the effect of intensity on pitch in electric hearing and ... · health and medical research council...
TRANSCRIPT

J Am Acad Audiol 17:733–746 (2006)
733
*Department of Audiology and Speech Sciences, Universiti Kebangsaan Malaysia, Kuala Lumpur, Malaysia; †Departmentof Otolaryngology, The University of Melbourne, Australia; ‡Neuroscience Research Institute, Aston University, Birmingham,United Kingdom
Cila Umat, Department of Audiology and Speech Sciences, Faculty of Allied Health Sciences, Universiti KebangsaanMalaysia, Jalan Raja Muda Abdul Aziz, 50300 Kuala Lumpur, Malaysia; Phone: 603-2691-4230/603-2698-1420, ext. 216; Fax: 603-2698-6039; E-mail: [email protected]
Part of this study was presented orally at the XVI National Conference of the Audiological Society of Australia, Brisbane,Queensland, Australia, May 17–20, 2004.
The first author was sponsored by a joint scholarship from the Malaysian government and the Universiti KebangsaanMalaysia throughout her study in Australia. The second and the third authors had received funding from the Australian NationalHealth and Medical Research Council and the Garnett Passe and Rodney Williams Memorial Foundation.
The Effect of Intensity on Pitch in ElectricHearing and Its Relationship to the SpeechPerception Performance of CochlearImplantees
Abstract
This study investigated the effect of intensity on pitch in electric hearing andits relationship to the speech perception ability of cochlear implantees. Subjectswere 13 adult users of the Nucleus 22 cochlear implant system, using eitherthe Spectra22 or ESPrit22 speech processor and the SPEAK speech processingstrategy. A multidimensional scaling technique was employed. Speech perceptionwas measured using sentences and vowels. All measurements were performedin a soundfield condition, and subjects wore their own speech processors withtheir normally used settings. Results showed a significant correlation betweenthe degree of deviation of the subjects’ stimulus spaces from the “ideal” spaceand subjects’ performance with the sentences, but not with the vowels. Asignificant correlation was found between subjects’ response variability inperforming the multidimensional scaling task and their speech perceptionmeasures, suggesting that spectral smearing or underlying cognitive abilitiesmight affect implantees’ speech perception performance.
Key Words: Cochlear implants, multidimensional scaling, pitch, speechperception
Abbreviations: ALSCAL = Alternating Least-Squares Scaling; CNC =consonant-nucleus-consonant; INDSCAL = Individual Differences Scaling;MDS = multidimensional scaling; NBN = narrow-band noise; RMDS = RepeatedMDS; RSQ-I = individual squared correlation value from the INDSCAL analysis;RSQ-R = Overall squared correlation value from the RMDS analysis; SIT =Speech Intelligibility Test; Stress-I = individual Stress value from the INDSCALanalysis; Stress-R = overall Stress value from the RMDS analysis
Sumario Este estudio investiga el efecto de la intensidad sobre el tono enauxiliares auditivos eléctricos y su relación con la capacidad de percepcióndel lenguaje en individuos con implante coclear. Se incluyeron 13 adultosusuarios del sistema de implante coclear Nucleus 22, utilizando el procesadorde lenguaje Spectra22 o el ESPrit22, y la estrategia de procesamiento SPEAK.Se empleó una técnica de ordenamiento en escalas multidimensionales. La
Cila Umat*†
Hugh J. McDermott†
Colette M. McKay†‡

Journal of the American Academy of Audiology/Volume 17, Number 10, 2006
734
There is a wide range of speech perceptionperformance among cochlear implantees.Many factors contribute to this variability,
including device-related factors such as speechprocessors and speech-processing strategies, aswell as individual-related factors such assubjects’ ability to discriminate electrodes orprocess auditory signals. The present studyexamined one of the individual factors that mayaffect the speech perception performance ofadult cochlear implantees. Specifically, thisstudy investigated the effects of intensity onpitch perception in electric hearing and itsrelationship to the speech perceptionperformance of individual implantees.
The impetus for the present study camefrom an earlier work reported by Henry et al(2000). In that study, the ability to discriminateelectrodes when level was randomly varied wassignificantly correlated with the ability toperceive speech information in the low- to mid-frequency regions (170–2680 Hz). One possibleexplanation for the difficulty in discriminatingelectrodes when level varies is that the perceivedpitch may change with level. Several studiesusing direct electrical stimulation have notedthat the pitch evoked by a single electrode canshift with level in some subjects and that thedegree and direction of such pitch shifts differ
among individual subjects (Shannon, 1983;Townshend et al, 1987; Pijl, 1997). For example,Townshend et al (1987) found that one subjectperceived a higher pitch as the level increased,whereas another perceived a lower pitch as thelevel increased.
The effect of intensity on pitch perceptioncould be explained by changes in the neuralexcitation pattern with level. The differingdistribution pattern of the surviving nerve cellsand the state of the cochlea may explaindifferences in severity and direction of thechanges in pitch with level. For example, thecurrent flow in the cochlea may be altered by thepresence of new bone growth. Depending onthe state of the cochlea, as the level increases,the current may flow more horizontally,stimulating adjacent neurons, or more vertically,activating the neurons in more apical turns.
The present study used a multidimensionalscaling (MDS) technique (Schiffman et al, 1981)to examine the percepts evoked by changes inlevel and frequency of narrow-band noise (NBN)stimuli. An MDS technique is useful to showgraphically the independent perceptualdimensions evoked by a set of stimuli. Theoutput of the MDS analysis is a “stimulusspace” in which rank order of the Euclideandistances among the stimuli corresponds with
percepción del lenguaje fue medida usando frases y vocales. Todas lasmedidas fueron realizadas en condición de campo sonoro, y los sujetosutilizaron sus propios procesadores de lenguaje, en sus ajustes habituales.Los resultados mostraron una correlación significativa entre el grado dedesviación de los espacios del estímulo para los sujetos a partir del espacio“ideal”, y el desempeño de los sujetos con las frases pero no así con las vocales.Se encontró una correlación significativa entre la variabilidad de respuesta delos sujetos para realizar las tareas de la prueba de escalas multidimensionalesy sus medidas de percepción del lenguaje, sugiriendo que la disposiciónespectral o las capacidades cognitivas subyacentes pueden afectar eldesempeño en cuanto a la percepción del lenguaje de los implantados.
Palabras Clave: Implantes cocleares, escalas multidimensionales, tono,percepción del lenguaje
Abreviaturas: ALSCAL = Escalas Alternantes de cuadrados mínimos; CNC= consonante-núcleo-consonante; INDSCAL = Escala de diferenciasindividuales; MDS = Escalas Multidimensionales; NBN = ruido de bandaestrecha; RMDS = MDS repetido; RSQ-I = valor cuadrado de correlaciónindividual a partir del análisis INDSCAL; RSQ-R = valor cuadrado de correlaciónglobal a partir del análisis RMDS; SIT = Prueba de Inteligibilidad del Lenguaje;Stress-I = valor de tensión individual a partir del análisis INDSCAL; Stress-R= valor de tensión individual a partir del análisis RMDS

Pitch and Intensity Interaction in Electric Hearing/Umat et al
735
least error to the rank order of perceptualdistances. The MDS technique has been usedin several studies to examine the dimensionalityof the pitch percept associated with activationof different electrode places (Tong et al, 1983;McKay et al, 1996; Collins and Throckmorton,2000; Henshall and McKay, 2001; McKay andHenshall, 2002). In these studies, it was foundthat the pitch evoked by single electrodes ofvarying place is a single-dimension percept,which is best represented as a U-shaped curvein a two-dimensional space. Collins andThrockmorton (2000) showed that the curvednature of the stimulus space is probably due tosubjects having difficulty ranking largeperceptual distances.
It is well known that loudness and pitchpercepts in hearing are perceptuallyindependent. In this study we varied thefrequency and level of acoustic stimuli presentedvia the subjects’ own speech processors. Bothfrequency changes and level changes canproduce changes in both loudness and pitchpercepts. In this study, the stimuli differingonly in frequency were loudness balanced withthe intention that frequency changes wouldproduce only pitch changes. Therefore, if levelchanges do not evoke changes in pitch, it waspredicted that the MDS stimulus space wouldshow two orthogonal dimensions correspondingto the frequency and level of the stimuli, andthese dimensions would be associated with thepercepts of pitch and loudness, respectively. If,on the other hand, level changes evoked bothpitch and loudness perceptual changes, thefrequency and level aspects of the stimuli wouldnot evoke orthogonal perceptual dimensions.Thus, in this study, the degree of deviation from
an “ideal” MDS stimulus space (in whichfrequency and level produced orthogonaldimensions of pitch and loudness) was used toquantify the amount of influence that levelchanges have on the pitch percept for eachsubject.
We examined the relationship betweeneach individual subject’s deviation from theideal stimulus space and their speech perceptionperformance, with the hypothesis that suchdeviations would particularly affect vowelperception. Two further hypotheses were tested:that speech perception performance would becorrelated with the relative importance of thepitch and loudness cues in the MDS task, andthat speech perception performance would becorrelated with the variability in each subject’sresponses on the MDS task.
METHOD
Subjects
Subjects were 13 postlingually deafenedadult users of the Nucleus 22 cochlearimplant system, using either the Spectra22or ESPrit22 speech processor with theSPEAK speech processing strategy (Skinneret al, 1994). They were selected at randomdepending on their availability to participatein a research project at the time the studycommenced, and were recruited from theCochlear Implant Clinic of the Royal VictorianEye and Ear Hospital in East Melbourne,Australia. Subjects’ demographic details aregiven in Table 1.
Table 1. Subjects’ Demographic Details
Subject Age (years) Years of profound Year of Etiology of deafness implantation deafness
S1 48 8 1992 UnknownS2 68 1 1992 Hereditary S3 66 16 1988 OtosclerosisS4 67 16 1992 HereditaryS5 78 22 1985 Unknown S7 70 49 1988 Multiple ear infections
and surgeriesS8 73 33 1989 Unknown S9 63 22 1987 Unknown S10 57 6 1993 HereditaryS11 59 Right (R) - 44 1988 R - since birth
Left (L) - 17 L - head injuryS12 66 1 1986 MeningitisS13 64 21 1988 OtosclerosisS14 57 R - 12 1993 Otosclerosis
L - 7

736
Journal of the American Academy of Audiology/Volume 17, Number 10, 2006
Subjects were tested using their ownspeech processors with their normally usedprocessor settings throughout the experiment,with the exception of S2 and S14. Thesesubjects changed their processors fromESPrit22 to Spectra22 for the vowelperception test. Table 2 shows a summary ofeach subject’s map.
Stimuli
Stimuli for the MDS experiment wereNBNs, generated using the Cool Edit Prosoftware program, with three different centerfrequencies (500, 1000, and 2000 Hz) andthree different equal-loudness levels (soft[S], medium [M], and loud [L]). In thefollowing, the stimuli are denoted by “NX,”where “N” is the center frequency of theNBN, and “X” is the loudness level (forexample, 500L is the 500 Hz NBN at theloud level). A different stimulus set wascreated for each subject to ensure that equalloudness levels across frequencies wereachieved. The loudness-balanced levels weredetermined by performing a loudnesscategory task prior to the MDS experiment.
In the loudness category task, NBNstimuli with four different center frequencies(250, 500, 1000, and 2000 Hz) and sixdifferent levels over a 25 dB range weregenerated and presented to each subject ina soundfield condition. A seven-categoryloudness scale was employed with descriptorsranging from 1 (uncomfortably loud) to 7(inaudible). Subjects were asked to indicate
verbally which category on the scale bestdescribed the loudness of each stimulus. Fourblocks of trials, with each block consisting of72 trials (24 stimuli x 3 presentations), werepresented to each subject, with the first blockserving as a practice list. The resultantloudness growth functions (mean levels in dBSPL versus loudness category) were used todetermine the three equal loudness levelsacross three frequencies for each individualsubject.
Calibration was performed in the audiotest booth to adjust the level of each of thenine NBN stimuli (i.e., 500L, 500M, 500S,1kL, 1kM, 1kS, 2kL, 2kM, and 2kS) to thatrequired. The stimuli were then paired witheach other, with a 700 msec silent intervalseparating the stimuli comprising each pair.All possible pairs were generated (9 stimulix 8), resulting in a total of 72 pairs of stimuliper MDS block of trials.
Procedures
MMDDSS DDiissssiimmiillaarriittyy JJuuddggmmeennttss
For the MDS dissimilarity judgments,the subject was seated in the test booth at thecalibrated position, approximately one meterin front of the loudspeaker. The stimuluspairs were presented in a random order. Thesubject’s task was to judge how different thepairs of sounds were in each presentation.Their responses were recorded on an
Table 2. Summary of Subjects’ Maps Used in This Study
Subject Speech Sensitivity Number of Stimulation Frequency processor setting channels mode range (Hz)
S1 ESPrit22 3.5 18 BP+1 150–7885S2 ESPrit22 Fixed – 24 dB 20 BP+1 120–8658S3 ESPrit22 3.5 16 BP+3 150–5744S4 Spectra22 2.5 15 Variable BP (+1, +2, +4) 240–7844S5 ESPrit22 3.5 17 BP+2 150–6730S7 ESPrit22 3.5 20 CG 120–8658S8 ESPrit22 Fixed – 21 dB 16 BP+1 150–5744S9 ESPrit22 2 19 BP+2 120–7390S10 Spectra22 5 17 BP+3 120–5384S11 Spectra22 3 16 CG 150–5744S12 ESPrit22 4 16 Mixed (CG, BP+1, BP+2) 150–5744S13 Spectra22 2 14 BP+2 171–5603S14 ESPrit22 3.5 17 BP+1 150–6730
Note: Fixed sensitivity setting on the ESPrit22 means that the clinician disabled the manual control on the processor, which can beprogrammed either as a sensitivity control or as a volume control. The value set in dB is a relative gain value, in which 21 dB approximatessensitivity setting 8 on the Nucleus 24 SPrint body-worn processor. BP + n (n = 1, 2, 3, 4) stimulation mode is the bipolar electrodeconfiguration with a spacing of n inactive electrodes between the active and indifferent electrodes; CG is common-ground mode.

Pitch and Intensity Interaction in Electric Hearing/Umat et al
737
undifferentiated 10 cm line scale markedwith “Exactly the same” at one end and “Themost different” at the other end. They wereinstructed to listen to any differences at allthat they were able to perceive and to placea mark on the line scale to indicate themagnitude of the perceived differencesbetween the stimuli.
Prior to commencing the dissimilarityjudgments test session, subjects werefamiliarized with all of the nine stimuli. Atraining session then followed in which thepairs that were considered likely to be mostdifferent were presented first to every subject;for example, 500L-2kS or vice versa, as well asthe more similar pairs such as 1kL-1kM orvice versa. They were then guided to marktheir responses on the line scales. Subsequently,a practice list was carried out comprisingbetween 20 and 30 trials using the MACarenasoftware program (see acknowledgments). Testsessions were started only when subjectsindicated that they were confident to performthe MDS trials. Two subjects (S5 and S8)required additional training to becomeconfident in their ability to do the task. Testinginvolved six blocks of trials per subject over atleast two separate sessions.
Subjects’ responses on the line scaleswere transformed into numbers between 0and 100, and entered into six data matrices(i.e., with one data matrix per test block). Thedata were then submitted to the ALSCAL(Alternating Least-Squares Scaling) softwareprogram (Young and Lewyckyj, 1979) foranalyses using the Individual DifferencesScaling (INDSCAL) and Repeated MDS(RMDS) procedures.
The output stimulus space fromINDSCAL analysis is the best representationof perceptual dimensions that are common toall subjects (i.e., the “ideal” stimulus space).For this analysis, the input comprised of 13data matrices representing the results fromthe 13 subjects in the study (each matrixcontaining the sum of the six test-blockmatrices for each subject). In this experiment,if level did not affect pitch systematicallyacross the 13 subjects, we expected that theINDSCAL stimulus space would depict thefrequency and level parameters of the stimulias associated with orthogonal perceptualdimensions (i.e., pitch and loudness, asdiscussed earlier in the introduction).INDSCAL also allows analysis of individualsubject differences in assigning the common
dimensions to the stimuli. Results of theanalysis known as “weights” provideinformation about the relative importanceof each of the common dimensions for eachsubject (i.e., the relative importance of thepitch and loudness cues to individualsubjects), and the individual data can beassessed to see how closely they fit the overall“ideal” space.
Individual subject data were examinedusing RMDS analysis. The six data matricesfor the subject served as the ALSCAL inputdata. The resulting stimulus space from theRMDS analysis represented the perceptualdistances between the stimuli for that subject.
Speech Perception Measures
The Speech Intelligibility Test (SIT)sentences (Magner, 1972) were administeredin quiet at an average level of approximately60 dBA. The SIT test consists of 40 lists ofdigitally recorded sentences on a compactdisc (CD), spoken by a native Australianmale speaker. Each list comprises 15sentences with each sentence containingthree to eight key words. In total, there are80 key words per list. Two lists were selectedat random for the test, and the same listswere used for all subjects. Subjects wereasked to repeat the sentences, and the meanpercent correct key words identified from thetwo lists (mean SIT scores) were calculatedfor each subject.
The Australian version of the consonant-nucleus-consonant (CNC) monosyllabic wordstest (Henry et al, 1998) was used to measurevowel perception. Three lists of CNC words,each consisting of 50 meaningful wordsspoken by a female talker having an averageAustralian accent, were randomly selected,and the same lists were used for all subjects.The average peak speech level forpresentation was 61 dBA. The vowel scoresfrom the three lists were averaged to obtainthe mean CNC vowels score.
In both speech tests, the stimuli werepresented via a loudspeaker, routed from aMADSEN Itera Diagnostic Audiometer (usedto set the presentation levels of the speechsignals), which was connected to the CDplayer. Subjects were seated at the calibratedposition in the test booth for the speechmeasures, using the same speech-processorsettings as they used in the MDS experiment.

Journal of the American Academy of Audiology/Volume 17, Number 10, 2006
738
RESULTS
MDS
IINNDDSSCCAALL AAnnaallyyssiiss
The first step in MDS analysis is toestablish the appropriate number ofdimensions in which to represent the stimulusspace solution. One factor used in thisassessment is the way that Stress and R2
(RSQ) values change as a function of thenumber of dimensions used. Stress is anindex that assesses the mismatch of dataand corresponding distances in the stimulusspace (i.e., the lower the Stress values, thebetter). RSQ shows the proportion of variancein the data accounted for by the MDS model(i.e., the higher the RSQ values, the better).Analysis of the changes in Stress and RSQvalues revealed three as the maximumnumber of dimensions appropriate foranalysis of the INDSCAL group configuration.Generally, the number of dimensions wherea knee-point occurs (i.e., where increasing thenumber of dimensions further does notgreatly improve the Stress and RSQ values)indicates the most appropriate number ofdimensions for analysis.
The derived three-dimensional INDSCALgroup stimulus space is shown in Figure 1.
The configuration shows that the planeconsisting of dimensions 1 and 3 (left panel)separates the stimuli into three groupsdiffering in frequency. In contrast, thedimension orthogonal to this plane(dimension 2; the vertical direction in theright panel) separates the stimulisystematically according to level. Note thatthe dimension 1/3 plane shows thefrequencies arranged in the typical U-shapedpattern. As explained in the introduction,the curved nature of the relationship betweenthe stimuli does not mean that there are infact two pitch dimensions, but is just anartifact produced by using stimuli that arevery different in frequency. Since the groupspace obtained by INDSCAL shows the leveland frequency parameters in the stimulus toproduce orthogonal perceptual dimensions,we can be fairly confident that the perceptualdimensions are pitch and loudness. Thus,the dimension 1/3 plane in Figure 1 will bereferred to as the “pitch plane,” anddimension 2 as the “loudness dimension.”The group space will be referred to as the“ideal” space in the further analysis, since itrepresents well the ideal situation in whichlevel does not cause systematic significantpitch changes. The value describing how welleach subject’s data conforms to this idealspace can then be thought of as a measure ofthe interaction of pitch with level forindividual subjects.
Figure 1. The three-dimensional INDSCAL group stimulus space. The U-shaped pattern observed in the dimen-sion 1/3 plane (left panel) separates the stimuli of different frequencies, whereas dimension 2 (the vertical direc-tion in the right panel) separates the stimuli on the basis of level (soft [S], medium [M], and loud [L]).
Pitch and Intensity Interaction in Electric Hearing/Umat et al
739
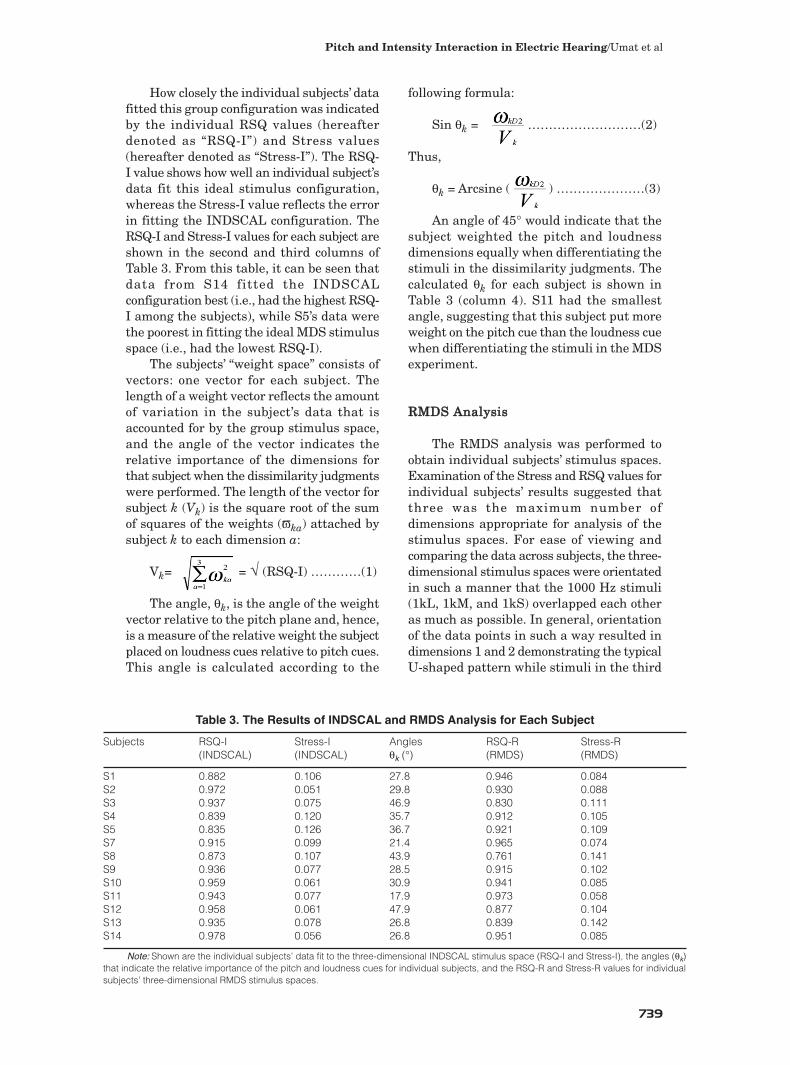
How closely the individual subjects’ datafitted this group configuration was indicatedby the individual RSQ values (hereafterdenoted as “RSQ-I”) and Stress values(hereafter denoted as “Stress-I”). The RSQ-I value shows how well an individual subject’sdata fit this ideal stimulus configuration,whereas the Stress-I value reflects the errorin fitting the INDSCAL configuration. TheRSQ-I and Stress-I values for each subject areshown in the second and third columns ofTable 3. From this table, it can be seen thatdata from S14 fitted the INDSCALconfiguration best (i.e., had the highest RSQ-I among the subjects), while S5’s data werethe poorest in fitting the ideal MDS stimulusspace (i.e., had the lowest RSQ-I).
The subjects’ “weight space” consists ofvectors: one vector for each subject. Thelength of a weight vector reflects the amountof variation in the subject’s data that isaccounted for by the group stimulus space,and the angle of the vector indicates therelative importance of the dimensions forthat subject when the dissimilarity judgmentswere performed. The length of the vector forsubject k (Vk) is the square root of the sumof squares of the weights (ϖka) attached bysubject k to each dimension a:
Vk= = √ (RSQ-I) …………(1)
The angle, θk, is the angle of the weightvector relative to the pitch plane and, hence,is a measure of the relative weight the subjectplaced on loudness cues relative to pitch cues.This angle is calculated according to the
following formula:
Sin θk = ………………………(2)
Thus,
θk = Arcsine ( ) …………………(3)
An angle of 45° would indicate that thesubject weighted the pitch and loudnessdimensions equally when differentiating thestimuli in the dissimilarity judgments. Thecalculated θk for each subject is shown inTable 3 (column 4). S11 had the smallestangle, suggesting that this subject put moreweight on the pitch cue than the loudness cuewhen differentiating the stimuli in the MDSexperiment.
RRMMDDSS AAnnaallyyssiiss
The RMDS analysis was performed toobtain individual subjects’ stimulus spaces.Examination of the Stress and RSQ values forindividual subjects’ results suggested thatthree was the maximum number ofdimensions appropriate for analysis of thestimulus spaces. For ease of viewing andcomparing the data across subjects, the three-dimensional stimulus spaces were orientatedin such a manner that the 1000 Hz stimuli(1kL, 1kM, and 1kS) overlapped each otheras much as possible. In general, orientationof the data points in such a way resulted indimensions 1 and 2 demonstrating the typicalU-shaped pattern while stimuli in the third
Table 3. The Results of INDSCAL and RMDS Analysis for Each Subject
Subjects RSQ-I Stress-I Angles RSQ-R Stress-R(INDSCAL) (INDSCAL) θk (°) (RMDS) (RMDS)
S1 0.882 0.106 27.8 0.946 0.084 S2 0.972 0.051 29.8 0.930 0.088 S3 0.937 0.075 46.9 0.830 0.111 S4 0.839 0.120 35.7 0.912 0.105 S5 0.835 0.126 36.7 0.921 0.109 S7 0.915 0.099 21.4 0.965 0.074 S8 0.873 0.107 43.9 0.761 0.141S9 0.936 0.077 28.5 0.915 0.102S10 0.959 0.061 30.9 0.941 0.085S11 0.943 0.077 17.9 0.973 0.058S12 0.958 0.061 47.9 0.877 0.104S13 0.935 0.078 26.8 0.839 0.142S14 0.978 0.056 26.8 0.951 0.085
Note: Shown are the individual subjects’ data fit to the three-dimensional INDSCAL stimulus space (RSQ-I and Stress-I), the angles (θk)that indicate the relative importance of the pitch and loudness cues for individual subjects, and the RSQ-R and Stress-R values for individualsubjects’ three-dimensional RMDS stimulus spaces.

dimension show systematic level changes.Examples of RMDS stimulus spaces for threesubjects—S2, S5, and S13—are depicted inFigure 2. The results for these three subjectswere chosen to illustrate representativeexamples of the main configuration ofstimulus spaces observed in this study. S2’sstimulus space is an example showing clearlyindependent dimensions of pitch (dimensions1/2) and loudness (dimension 3). S5’s resultsshowed a strong interaction of frequency andlevel parameters within the stimulus space,as evidenced by the overlapping data pointsfor 500L, 500M, and 1kS (see the top panelof S5’s graph), irrespective of the orientationof the stimulus space. The perceptualdimensions of S5’s stimulus space are notclearly interpretable as having a pitch planeand a separate loudness dimension. Forexample, in the dimension 1/2 plane, the 500Hz stimuli of differing level are not groupedtogether, as is the case for the otherfrequencies. Two other subjects (S3 and S12)also showed similar findings to that of S5,
that is, significant interaction of frequencyand level parameters in their stimulus spaces.Some other subjects (S1, S4, S7, and S13) didnot differentiate the different intensity levelsin either the 500 Hz or the 2000 Hz stimuli(i.e., the data points for 500L, 500M, and500S, or 2kL, 2kM, and 2kS overlapped in thederived stimulus spaces for these subjects).An example is shown in Figure 2 for S13’sstimulus space in which the 500L, 500M,and 500S stimuli were closely grouped,irrespective of how the space was oriented toview the data. These observations areinteresting given that all subjects were ableto distinguish these stimuli in the loudnesscategory task.
The overall RSQ (RSQ-R) and Stress(Stress-R) values for the RMDS analysis areshown in Table 3 (columns 5 and 6). Theseindices, which represent how well eachsubject’s data fit their own best-fittingstimulus space, partly reflect the degree ofuncertainty in subjects’ responses whenperforming the MDS dissimilarity judgments.
Journal of the American Academy of Audiology/Volume 17, Number 10, 2006
740
Figure 2. Examples of three-dimensional RMDS stimulus spaces for three subjects (S2, S5, and S13) that rep-resent the main configurations observed among the subjects’ results in this study. S2’s graph is an example ofa clearly interpretable stimulus space in which the dimension 1/2 plane could be interpreted as the pitch planeand dimension 3 could be interpreted as loudness. S5’s graph is an example in which the perceptual dimensionsare not as clearly interpretable as having a pitch plane and a separate loudness dimension (see text). S13 is anexample of subjects who appeared not to differentiate the different intensity levels in the 500 Hz (or 2000 Hz)stimuli. The 500L, 500M, and 500S points in this graph were closely grouped in the loudness dimension (dimen-sion 3), irrespective of how the space was oriented to view the data.

A high degree of uncertainty (leading tovariability and inconsistency in the responses)will contribute to a low RSQ-R or high Stress-R value. From the table, it can be observedthat S8’s data was the most variable; only76.1% of the variance was accounted for byS8’s stimulus space. S11 provided the mostconsistent responses.
Speech Perception Performance
Individual subjects’ speech perceptionperformance on sentences and vowels areshown in Figure 3. There was a considerablevariation in the implantees’ speech perceptionperformance. The vowel scores for two of thesubjects, S2 and S14, were obtained withdifferent speech processors than those usedwhen performing the MDS task. Thus, theCNC vowel scores for these two subjects wereexcluded in the subsequent correlation andregression analyses with the MDS results.
Correlating MDS and SpeechPerception Results
To test the hypothesis that individualsubjects’ perception of changes in frequencyand intensity are correlated with their speechperception performance, the goodness of fitof each subject’s data to the ideal stimulusspace in Figure 1 (as given by the RSQ-I andStress-I) was correlated with their speechperception scores. These indices reflect howfar individual subjects’ data deviated from theINDSCAL configuration, which showedindependent pitch and loudness dimensions.
Both the RSQ-I and Stress-I weresignificantly correlated with the mean SITscores. The correlation between the RSQ-Iand mean SIT scores was r = 0.656 (F[1,11]= 8.30, p = 0.015). The Pearson correlationcoefficient for the association between theStress-I values and the mean SIT scores wasr = -0.610 (F[1,11] = 6.51, p = 0.027).Significant results were not found, however,when either the RSQ-I or Stress-I valueswere correlated with the mean CNC vowelsscores. The correlation between the RSQ-Iand mean CNC vowels scores was r = 0.217(p = 0.522), and the correlation between theStress-I and mean CNC vowels was r = -0.122 (p = 0.722). Thus, our main hypothesisthat the variation seen in pitch when
intensity changes significantly correlateswith speech perception performance was notfully supported, as a significant correlationwas found only with the sentences and notwith the vowels. It was expected that vowelperception would be more sensitive thansentence perception to the effects of pitchchanges with level. The regression plots areshown in Figure 4.
We also examined the correlationbetween the indices from the RMDS analysis(RSQ-R and Stress-R) and the speechperception scores. As discussed earlier, thesemeasures partly reflect the uncertainty ofeach subject in giving perceptual distanceestimates. We found a significant correlationbetween the Stress-R and the mean SITscores: r = -0.636 (p = 0.019) but not betweenthe RSQ-R and the mean SIT (r = 0.449, p =0.123). When correlated with the mean CNCvowels scores, a stronger correlation wasobserved with Stress-R (r = -0.820, p = 0.002),while the correlation between the RSQ-Rand mean CNC vowels scores was r = 0.618(p = 0.043). The regression plots are shownin Figure 5.
To test the hypothesis that the relativeimportance of the pitch and loudness cues toindividual subjects in the MDS tasksignificantly correlated with their speechperception performance, the angles of theweight vectors relative to the pitch planewere correlated with the speech perceptionscores. Speech is a complex signal havingacoustic components that vary in frequencyand intensity over time. It was hypothesizedthat implantees possibly used specificstrategies to differentiate the phonemes,which could be inferred from the relativeimportance of the pitch and loudness cues inresults of the MDS experiment. No significantcorrelations between the angles and either ofthe speech perception measures wereobserved.
DISCUSSION
The present study investigated the effectof intensity on pitch perception in electric
hearing and its relationship to the speechperception of adult cochlear implantees. Thestudy utilized the MDS technique and NBNstimuli that varied in frequency and intensityto vary the pitch and loudness percepts.
The MDS results revealed that three-
Pitch and Intensity Interaction in Electric Hearing/Umat et al
741

dimensional stimulus spaces wereappropriate to represent the data from allsubjects. In general, the frequencies couldbe separated in a two-dimensional plane(showing a U-shaped pattern), and the levelscould be separated in an orthogonal thirddimension. Thus, the perceptual dimensionscould be interpreted as pitch and loudness.The present result in which a U-shapedpattern was observed in the pitch plane isconsistent with findings from earlier studiesrelated to electrode-place pitch using theMDS technique (Tong et al, 1983; McKay etal, 1996; Collins and Throckmorton, 2000;Henshall and McKay, 2001; McKay andHenshall, 2002).
The present results confirm that pitchand loudness are two independent perceptsin electric hearing as evidenced by theorthogonal dimensions in the INDSCALstimulus configuration, which could beinterpreted as pitch and loudness dimensions.It was hypothesized that individualimplantees differed in the effect of intensitychanges on pitch. Visual inspection of theindividual stimulus spaces obtained from theRMDS analysis supported this hypothesis.For example, although S2 showed nointeraction between pitch and level, S5showed an unusual stimulus configurationthat could not be interpreted as havingdistinct pitch and loudness dimensions (see
Figure 2). This individual variability wasalso consistent with the RSQ-I and Stress-Ivalues from the INDSCAL analysis. Asdiscussed above, these measures reflect howwell the individual’s data fitted the “ideal”group space. It can be seen that S2 had thebest fit (lowest Stress-I) and S5 the worst fit(highest Stress-I). The finding that pitchchanged with level in some implantees wasconsistent with the reports of previous studiesusing direct electrical stimulation on singleelectrodes (Shannon, 1983; Townshend et al,1987; Pijl, 1997). The individual variationin the direction of the pitch shifts with levelwas also consistent with the findings ofTownshend et al (1987).
Our main hypothesis, however, was notfully supported by the experimental results.We hypothesized that the variation of pitchwith intensity changes would correlatesignificantly with the speech perceptionperformance of the implantees, in particularwith vowel perception. We did find significantcorrelations between the RSQ-I (and Stress-I) and the mean SIT scores (p = 0.015 and p = 0.027, respectively), but not with themean CNC vowel scores. It would be expectedthat, since vowel perception depends onaccurate perception of formant frequencies,variations in pitch with level might affectvowel recognition more than sentenceperception. In explaining the significant
Journal of the American Academy of Audiology/Volume 17, Number 10, 2006
742
Figure 3. The Mean SIT and Mean CNC vowels scores (percent correct) across subjects. It should be noted thatthe vowel scores for S2 and S14 were obtained with different speech processors than those used when performingthe MDS task and the SIT sentences test.

Pitch and Intensity Interaction in Electric Hearing/Umat et al
743
Figure 4. Regressionplots for RSQ-I versusMean SIT scores (top left)and Stress-I versus MeanSIT scores (top right).Regression plots for RSQ-I versus Mean CNC vow-els scores (bottom left)and Stress-I versus MeanCNC vowels scores (bot-tom right). For all graphs,the solid lines are theregression lines while thedashed lines represent95% confidence intervals.
Figure 5. Regressionplots for RSQ-R versusMean SIT scores (topleft) and Stress-R versusMean SIT scores (topright). Regression plotsfor RSQ-R versus MeanCNC vowels scores (bot-tom left) and Stress-Rversus Mean CNC vow-els scores (bottom right).For all graphs, the solidlines are the regressionlines while the dashedlines represent 95% con-fidence intervals.

relationship between the RSQ-I and the meanSIT scores, it is possible that other cues insentences such as suprasegmentalinformation or consonant perception wereaffected by the pitch and intensity interaction,thus contributing to the significant result. Itmight also be possible that the naturalintensity variation within the sentences (incontrast to the CNC words, which werepresented at a constant intensity) led to moreperformance variability being due topitch/level interactions. Finally, it should bepointed out that the correlation with vowelscores used results from only 11 subjects (incontrast to 13 for the sentences).
We found significant correlations betweenthe speech perception measures and theindices from the RMDS analysis (Stress-Rand RSQ-R), which in part quantify thedegree of uncertainty or difficulty thatsubjects had when performing the MDSdissimilarity judgments. That is, the higherthe variability or inconsistency in subjectresponses, the lower the RSQ-R (or higherStress-R). It was found that subjects withmore variability in their responses had poorerspeech perception performance, as measuredusing both sentences and vowels (see Figure5). There are two broad reasons why thiscorrelation may occur: the subjects with moreinconsistent responses may suffer from aninability to perceive differences amongelectrode positions (due perhaps to suchfactors as current spread in the cochlea), orthese subjects may suffer from a more centralor cognitive disadvantage that would affectboth speech and MDS results.
It is well known that implantees varygreatly in their ability to discriminateelectrode positions (Nelson et al, 1995;Hanekom and Shannon, 1996; Henry et al,1997; Throckmorton and Collins, 1999;Donaldson and Nelson, 2000; Henry et al,2000). Also, it has been shown that frequencyresolution ability is highly correlated withspeech understanding (Hawks et al, 1997;Henry and Turner, 2003; Laback et al, 2004).The experiment presented here was notdesigned to measure electrode discriminationor frequency resolution, and the NBNs usedwere separated by relatively large frequencydifferences. Nevertheless, subjects wouldhave differed in the absolute perceptualdistances they experienced between thedifferent stimuli. It is plausible that subjectsfor whom the stimuli all sounded very similar
would have responded in a more variableway in the MDS task and would haveexperienced more difficulty distinguishingdifferent speech sounds as well.
Subjects performing an MDSdissimilarity judgment need to be attentiveto the first stimulus and hold informationabout it in their memories for the subsequentcomparison with the second stimulus. Twoseparate processes may be involved inperforming this task: one is to perceive thedifferences between the stimulus pairs asdiscussed above, and the other is to make ajudgment about how different the stimuliare in each pair (Nosofsky, 1985). InNosofsky’s study, semicircle stimuli varyingin size and a radial line with varying angleof orientation were used, and subjects wereasked to identify the stimuli. The resultswere computed in an identification confusionmatrix. Nosofsky fitted his data to a versionof the MDS model and found that the resultssupported the notion that there is adistinction between “perceptual”independence and “decisional” independence.Both factors may contribute to variableresponses, and hence lower RSQ-R (or higherStress-R) in the RMDS analysis. Forexample, if a subject perceived most of thestimuli as the same, this might contribute tohis or her uncertainty in judging howdifferent the stimuli were. Alternatively, asubject may perceive the differences buthave difficulty in assigning a relativemagnitude to them.
According to the information processing(IP) model proposed by researchers in thearea of cognitive psychology (see, for example,Pisoni, 2000; Pisoni and Cleary, 2004),perception involves attention and memory.Poor attention and limitation in the workingmemory of an individual subject might affectwhat the subject perceives. The workingmemory is a cognitive system that holds theincoming information for a brief period (short-term storage) while at the same time applyinga cross-check (recall and retrieve) between theincoming information and that held in long-term storage. Nosofsky (1991), for example,generated 34 schematic faces varying in eyeheight, eye separation, nose length, andmouth height, and performed an MDS studywith 138 undergraduates from IndianaUniversity. Subjects rated the similarity of thefaces on a scale from most dissimilar to mostsimilar. The data were consistent with the
Journal of the American Academy of Audiology/Volume 17, Number 10, 2006
744

theory that recognition decisions are basedon similarity comparisons with storedinformation in the memory. If the informationwere not stored adequately in memory,subjects would not be able to take fulladvantage of comparisons with storedinformation when asked to make recognitionjudgments.
These various possible sources ofuncertainty may affect both the MDS resultsand speech perception, and might therebycontribute to the significant correlation foundin the present study between variability inresponses in the dissimilarity judgments andspeech understanding. Some implantees mayperceive different speech phonemes as verysimilar, or have difficulty in deciding thedifferences between phonemes due tolimitations in their information-processingcapability, hence contributing to theirdifficulty in perceiving the speech sounds.The results imply that differences infrequency selectivity of the electricalstimulation or differences in underlyingcognitive abilities might underlie differencesin speech perception.
The role of cognitive function in thespeech perception of adult cochlearimplantees has not been extensively studied.In one study, Lyxell et al (2003) found that acertain level of working memory capacitywas needed to allow implant users to followan oral conversation with a relatively lowlevel of effort. However, the findings fromseveral other researchers do not support theproposition that the speech perception ofadult cochlear implantees may be affected byunderlying cognitive abilities (Parkin et al,1989; Gantz et al, 1993; Collison et al, 2004).Collison et al (2004), for example, conductedthe Test of Nonverbal Intelligence-3 (TONI-3) and the Woodcock-Johnson III Tests ofCognitive Abilities (Verbal ComprehensionSection [WJ-III VCS]) with implantees. Inthese tests, participants identifiedrelationships among abstract figures andsolved problems following manipulation ofthese figures. The word recognition testinvolved the recognition of consonant-vowel-consonant (CVC) words. No significantrelationships were found between thecognitive and speech perception measures.Research with children, however, hasrevealed that nonverbal intelligence is one of the significant predictive factors ofgood speech perception performance
postimplantation (Geers et al, 2003; Moogand Geers, 2003; Willstedt-Svensson et al,2004). Further investigation is needed toexamine the role of cognitive function inspeech perception performance of adultimplantees.
CONCLUSIONS
In conclusion, we have confirmed that pitchand loudness are two independent percepts
in electric hearing and can best be observedusing a three-dimensional MDS stimulusspace. It was found that, in some subjects,pitch changed with level of stimulation. Howfar subjects’ perception deviated from theideal stimulus configuration (in which levelchanges affected only the stimulus dimensionorthogonal to pitch) was found to be correlatedsignificantly with their speech perception asmeasured using sentences, but not withvowels. The relative importance of pitch andloudness cues in performing the MDS task didnot correlate with the speech perceptionmeasures. The indices that reflect the degreeof uncertainty or inconsistency in subjects’responses when performing the MDSdissimilarity judgments were significantlycorrelated with both the speech perceptionmeasures, suggesting that difficulty indiscriminating the stimuli or poor underlyingcognitive abilities might contribute tosubjects’ poor speech perception performance.
Acknowledgments. The study was undertaken atthe Department of Otolaryngology, University ofMelbourne, and the Bionic Ear Institute, Melbourne,Australia. The authors would like to thank all theresearch subjects for their time and enthusiastic par-ticipation in the study. Dr. Wai Kong Lai from theDepartment of Otorhinolaryngology Head and NeckSurgery, University Hospital, in Zürich, Switzerland,is acknowledged for providing the MACarena soft-ware program used in the experiment.
REFERENCES
Collins LM, Throckmorton CS. (2000) Investigatingperceptual features of electrode stimulation via a mul-tidimensional scaling paradigm. J Acoust Soc Am108:2353–2365.
Collison EA, Munson B, Carney AE. (2004) Relationsamong linguistic and cognitive skills and spoken wordrecognition in adults with cochlear implants. J SpeechLang Hear Res 47:496–508.
Donaldson GS, Nelson DA. (2000) Place-pitch sensi-tivity and its relation to consonant recognition bycochlear implant listeners using the MPEAK and
Pitch and Intensity Interaction in Electric Hearing/Umat et al
745

SPEAK speech processing strategies. J Acoust SocAm 107:1645–1658.
Gantz BJ, Woodworth GG, Abbas PJ, Knutson JF,Tyler RS. (1993) Multivariate predictors of audio-logical success with multichannel cochlear implants.Ann ORL 102:909–916.
Geers A, Brenner C, Davidson L. (2003) Factors asso-ciated with development of speech perception skillsin children implanted by age five. Ear Hear24:24S–35S.
Hanekom JJ, Shannon RV. (1996) Place pitch dis-crimination and speech recognition in cochlear implantusers. S Afr J Commun Disord 43:27–40.
Hawks JW, Fourakis MS, Skinner MW, Holden TA,Holden LK. (1997) Effects of formant bandwidth onthe identification of synthetic vowels by cochlearimplant recipients. Ear Hear 18:479–487.
Henry BA, McDermott HJ, McKay CM, James CJ,Clark GM. (1998) A frequency importance functionfor a new monosyllabic word test. Aust J Audiol20:79–86.
Henry BA, McKay CM, McDermott HJ, Clark GM.(1997) Speech cues for cochlear implantees: spectraldiscrimination. In: Clark GM, ed. XVI World Congressof Otorhinolaryngology Head and Neck Surgery:Cochlear Implants. Sydney: Monduzzi Editore -International Proceedings Division, 89–93.
Henry BA, McKay CM, McDermott HJ, Clark GM.(2000) The relationship between speech perceptionand electrode discrimination in cochlear implantees.J Acoust Soc Am 108:1269–1280.
Henry BA, Turner CW. (2003) The resolution of com-plex spectral patterns by cochlear implant andnormal-hearing listeners. J Acoust Soc Am113:2861–2873.
Henshall KR, McKay CM. (2001) Optimizing elec-trode and filter selection in cochlear implant speechprocessor maps. J Am Acad Audiol 12:478–489.
Laback B, Deutsch WA, Baumgartner WD. (2004)Coding of vowellike signals in cochlear implant lis-teners. J Acoust Soc Am 116:1208–1223.
Lyxell B, Andersson U, Borg E, Ohlsson I-S. (2003)Working-memory capacity and phonological processingin deafened adults and individuals with a severe hear-ing impairment. Int J Audiol 42:S86–S89.
Magner ME. (1972) A Speech Intelligibility Test forDeaf Children. Northampton, MA: Clarke School forthe Deaf.
McKay CM, Henshall KR. (2002) Frequency-to-electrode allocation and speech perception withcochlear implants. J Acoust Soc Am 111:1036–1044.
McKay CM, McDermott HJ, Clark GM. (1996) Theperceptual dimensions of single-electrode and non-simultaneous dual-electrode stimuli in cochlearimplantees. J Acoust Soc Am 99:1079–1090.
Moog JS, Geers AE. (2003) Epilogue: major findings,conclusions and implications for deaf education. EarHear 24:121S–125S.
Nelson DA, Tasell DJV, Schroder AC, Soli S, LevineS. (1995) Electrode ranking of “place pitch” and speechrecognition in electrical hearing. J Acoust Soc Am98:1987–1999.
Nosofsky RM. (1985) Overall similarity and the iden-tification of separable-dimension stimuli: a choicemodel analysis. Percept Psychophysics 38:415–432.
Nosofsky RM. (1991) Tests of an exemplar model forrelating perceptual classification and recognitionmemory. J Exp Psych Hum Percept Perform 17:3–27.
Parkin JL, Stewart BE, Dankowski K, Haas LJ. (1989)Prognosticating speech performance in multichannelcochlear implant patients. Otolaryngol Head NeckSurg 101:314–319.
Pijl S. (1997) Pulse rate matching by cochlear implantpatients: effects of loudness randomization and elec-trode position. Ear Hear 18:316–325.
Pisoni DB. (2000) Cognitive factors and cochlearimplants: some thoughts on perception, learning, andmemory in speech perception. Ear Hear 21:70–78.
Pisoni DB, Cleary M. (2004) Learning, memory, andcognitive processes in deaf children following cochlearimplantation. In: Zeng FG, Popper AN, Fay RR, eds.Vol. 20 of Cochlear Implants: Auditory Prostheses andElectric Hearing. New York: Springer-Verlag, 377–426.
Schiffman SS, Reynolds ML, Young FW. (1981)Introduction to Multidimensional Scaling—Theory,Methods and Applications. New York: Academic Press.
Shannon RV. (1983) Multichannel electrical stimu-lation of the auditory nerve in man. I. Basicpsychophysics. Hear Res 11:157–189.
Skinner MW, Clark GM, Whitford LA, Seligman PM,Staller SJ, Shipp DB, Shallop JK, Everingham C,Menapace CM, Arndt PL, Antogenelli T, BrimacombeJA, Pijl S, Daniels P, George CR, McDermott HJ,Beiter AL. (1994) Evaluation of a new spectral peakcoding strategy for the Nucleus 22 channel cochlearimplant system. Am J Otol 15:15–27.
Throckmorton CS, Collins LM. (1999) Investigationof the effects of temporal and spatial interactions onspeech recognition skills in cochlear-implant subjects.J Acoust Soc Am 105:861–873.
Tong YC, Blamey PJ, Dowell RC, Clark GM. (1983)Psychophysical studies evaluating the feasibility ofa speech processing strategy for a multiple-channelcochlear implant. J Acoust Soc Am 74:73–80.
Townshend B, Cotter N, Compernolle DV, White RL.(1987) Pitch perception by cochlear implant subjects.J Acoust Soc Am 82:106–115.
Willstedt-Svensson U, Lofqvist A, Almqvist B, SahlenB. (2004) Is age at implant the only factor that counts?The influence of working memory on lexical and gram-matical development in children with cochlearimplants. Int J Audiol 43:506–515.
Young FW, Lewyckyj R. (1979) ALSCAL User’s Guide.Chapel Hill: Data Analysis and Theory Associates.
Journal of the American Academy of Audiology/Volume 17, Number 10, 2006
746