the effect of intangible assets on financial performance
TRANSCRIPT

Asian Journal of Finance & Accounting
ISSN 1946-052X
2020, Vol. 12, No. 1
ajfa.macrothink.org/ 26
The Effect of Intangible Assets on Financial
Performance, Financial Policies, and Market Value of
Technology Firms: A Global Comparative Analysis
Muhammad Junaid Qureshi (Corresponding author)
Research Scholar
Karachi University Business School, University of Karachi, Pakistan
E-mail: [email protected]
Dr. Danish Ahmed Siddiqui
Associate Professor
Karachi University Business School, University of Karachi, Pakistan
E-mail: [email protected]
Received: March 1, 2020 Accepted: April 15, 2020 Published: June 1, 2020
doi:10.5296/ajfa.v12i1.16655 URL: https://doi.org/10.5296/ajfa.v12i1.16655
Abstract
Purpose: The purpose of this study is to examine the degree to which intangible assets effect
financial performance, financial policies and market value of the technology firm.
Design/methodology/approach- Structural equation modeling analysis was used to ascertain
the relationship among intangible assets, firm performance, firm policies, and market value in
the year 2015 to 2018 of 80 companies according to the market capitalization of their
respective countries in the technology sector globally. The measures used in this study
profitability efficiency, capital structure, dividend policy and market value that is calculated
through the proxies ROA, ROE, ROIC, ATO, Net Profit Margin, debt to equity ratio,
dividend payout ratio, price-earnings ratio, price to sales and price to book value.
Finding- The results from Multi group Analysis (MGA) revealed that there are differences (p
< .05) in the significance of the impact of Assets on the criterion variable between a few
countries for instance Asset’s impact on ROIC is significantly different between Russia &
China and USA.

Asian Journal of Finance & Accounting
ISSN 1946-052X
2020, Vol. 12, No. 1
ajfa.macrothink.org/ 27
Practical implications- Owners and managers of technological sector global companies must
recognize the importance of both the physical capital and the intangible resources to the best
interest of the companies
Originality/value– This is the first paper to examine the impact of intangible assets on firm
performance, policies and value through cross country analysis in the technological sector.
Keywords: Firm Performance, Firm Policies, Firm value, Intangible assets, SEM analysis,
Technological Industry
Asian Journal of Finance & Accounting
ISSN 1946-052X
2020, Vol. 12, No. 1
ajfa.macrothink.org/ 28
1. Introduction
1.1 Background of the Study
Researchers and practitioners have reached a consensus that intangible assets play a vital role
in the success and survival of firms in today’s economy Satt, Harit & Youssef, Chetioui.
(2017). In recent decades, the focus has shifted from the traditional financial statements that
focus on tangible assets into intangible assets like innovation, knowledge, intellectual
property, and goodwill.
Rapidly changing dynamics of globalization and increasing market competition, companies
all around the world confronting several new challenges and opportunities (Bchini, 2015). To
be competitive and successful apart from the relative importance of physical sources,
companies have to adopt modern strategies and policies regarding market flexibility and
development (Hejazi, Ghanbari, & Alipour, 2016). Moreover, the evolution of the knowledge
economy from the industrial economy also puts greater pressure on companies to use soft
resources efficiently as human capital and knowledge, which have become major factors of
economic growth. In past, companies’ success, profitability and value mainly depend on
tangible assets like land, infrastructure, and equipment (Nuryaman, 2015) but in current
global economy intangible assets contributing approximately 80% in companies’ value
through human capital development and knowledge management (Vodák, 2011).
Amortization of ‘goodwill’ has serious shortcomings, hence, the emergence of IFRS 3, SFAS
141R and SFAS 142. That is, goodwill and other intangibles are made up of unrelated
components: the new goodwill comprising of reputation (Iwu-Egwuonwu, 2011), human
capital and organizational capital, have indefinite life albeit highly volatile and perishable.
Conversely, there are definite lives for patents, copyrights, licenses, trademarks and royalties.
To order to assess how intangibles increase the value and profitability of a business, these
components should be evaluated separately and their effects recorded. (Henning, Lewis and
Shaw, 2000). Regrettably, only those components which have definite valid lives can be
calculated quantitatively. Those components with infinite lives which have a major positive
impact on firm value / growth are highly qualitative and are not easily quantitatively
calculated.
In the modern business era, intangible assets are vital strategic resources. They are extremely
important in creating corporate value (Gamayuni, 2015) and improving company
performance. Researches indicated that intangible assets abound throughout the business
world, touching nearly all aspects of a company, from product development to human capital,
and staff functions such as legal, accounting, finance, and line operations such as research
and development, marketing, and general management.
In a macro scenario, investments in intangible assets have grown rapidly among companies in
the United States, Japan, and Europe. Such growth has been amplified by intensified global
competition, use of information and communication technologies, adoption of new business
models, and prevalence of the services sector. The report of the Organization for Economic
Cooperation and Development (OECD, 2011) cited that such investments have a significant

Asian Journal of Finance & Accounting
ISSN 1946-052X
2020, Vol. 12, No. 1
ajfa.macrothink.org/ 29
impact on productivity. It also indicated that in some cases the investments match or exceed
those in the traditional capital such as machinery, equipment, and buildings.
(Lim Macias et al 2018) found a strong relationship between identifiable intangible assets &
financial leverage. Overall identifiable intangible assets support debt financing in firm that
lack abundant tangible assets. While the dataset provides the fair value estimates of intangible
assets for only a small subset of firms. Harrit Satt et al (2017) studied the effect of goodwill
on firm performance found that a high level of goodwill has a positive impact on firm’s
performance, however, the research is conducted in the MENA region. Rufo Mendoza (2017)
studied the importance of intangible assets in improving financial performance, creating
value & maintain competitiveness, it was conducted in the Philippines Stock exchange.
The Effect of Intangible assets on financial policy, financial performance & firm value
covered rarely in previous literature, only one paper available in Gamayuni (2015) but that is
also in the context of Indonesia in the manufacturing industry. In short, studies undertaken are
mostly limited to country or region-specific studies. In our opinion, intangible assets are not
related to region but to sectors, different sectors have their own peculiar requirement. We for
the first time covered the whole sector globally. We choose the technology sector, as it as a
high degree of intangibles as compared to other, and have a more pronounced effect on
performance. Moreover, comparative analysis of factors affected by intangible assets could
also highlight the country- specific underlying trend in tech sector, and where it’s significant
enough to overshadow industry- specific characteristics.
Researchers have long recognized that intangible assets can be critically important to firm
value and affect firms’ financial policies. For example, the patents of Apple and Pfizer, the
brands of Coke and Amazon, the unique supply chain of Walmart, and the highly efficient
business process of Southwest Airlines have bolstered the competitive advantages and
corporate values of these firms in the knowledge economy (Lev and Gu 2016). However, it
has been difficult to document intangibles’ effects on firms’ financial policies because the
conservative accounting practice does not recognize the most internally-generated intangible
assets on the balance sheet. For example, firm’s expense advertising as well as research and
development (R&D) expenditures, except for certain software development costs. In contrast,
accounting capitalizes externally acquired intangible assets. Peters and Taylor (2017) estimate
that firms purchase only 19% of their intangible assets externally.1 The Economist (2014)
reports that “In 2005 Procter & Gamble, a consumer-goods company, paid $57 billion for the
Gillette razor company. The brand alone, P&G reckoned, was worth $24 billion.” For these
intangible assets, researchers typically can observe neither book nor market or fair values.
In this information era, intangible assets dominate the environment compared to during the
industrial era that was dominated by tangible assets. Zhang (2017) found that the inferred
intangibles have predictive power for stock returns, which might be because of
mean‐reverting misevaluation by the stock market; and the way the inferred intangibles
predict stock returns is consistent with the three‐factor model of Fama and French (1992).
These changes have led the role of intangibles to increase to provide a more informative and
reflective business performance intended for the investors in the decision-making process

Asian Journal of Finance & Accounting
ISSN 1946-052X
2020, Vol. 12, No. 1
ajfa.macrothink.org/ 30
which the traditional accounting standards cannot fulfill anymore (Wilson, et.al. 2014;
Yu-Chi and Lin, 2018).
1.2 Problem Statement
Some types of intangible assets or intellectual property are not mentioned in any other
financial statements, because monetary value is difficult to calculate or quantify. Intellectual
capital is the community of information assets assigned to an organization, which contributes
most significantly to this organization's improved competitive position, identified by adding
value to key stakeholders (Marr and Schiuma, 2001). According to Sveiby (1998), The
unseen intangible component of the balance sheet can be described as a family of three,
individual competence, internal structure and external structure”. Meanwhile, Leif Edvinsson,
as quoted by equates intellectual capital as amount of human capital and structural capital (eg,
relationships with consumers, network management and information technology). Choong
(2008) calculated excess ROA intellectual capital as composed of intangible individual,
company and institutional properties. Intellectual capital can thus be characterized as the
amount of what is generated by the organization's three main elements (human capital,
structural capital, and customer capital) related to information and technology which can
provide a competitive form of organization with more value for the client. Roos et al. (1997)
Revealed that these companies 'market value is several times their net asset value which is the
value of their tangible value. The difference between the two values is the "secret value" of
the product, which can be expressed as a market value percentage. On the basis of these
statements it can be inferred that intellectual capital is the key factors which can increase the
market value and therefore the profitability of a business
R&D investment occupies an significant role in terms of intangible asset efficiency, value,
and risk. R&D investments also influence the market value of the company which is
expressed in sales and return (Sougiannis, 1994). Under IAS 38, spending on research and
development may be counted as investment or assets. The option will have an effect on
financial results.
Intangible assets have 5 unique characteristics according to Holmstrom (1989): 1. Long-run,
2. Unable to predict the outcome, 3. Strong bankruptcy risk, n. 4. Intense labour, 5. Local.
Such specific features impact financial policies within the company. Investment in intangible
assets influences the budget and dividend policy of the company's debt. Theory of Agencies
(Jensen and Meckling, 1976) argues that Company expenses are dictated by monetary policy.
The expense of the business is projected to be higher in businesses with concentrated
intangible assets, based on the particular characteristics of intangible assets. Intangible assets
will raise the cost of the agency to shareholders (due to more details and secret action), as
well as the cost of the debtor agency (asset replacement and underinvestment problem). Thus,
investment in intangible assets will affect the company's financial policy.
Previous studies have been conducted to prove the influence of company’s financial
performance to stock return. It has been shown that the ratios extracted from the financial
statements have a strong relationship with the stock market metrics, which indicates that the
financial statements are also useful to investors in decision making and may clarify the value

Asian Journal of Finance & Accounting
ISSN 1946-052X
2020, Vol. 12, No. 1
ajfa.macrothink.org/ 31
of the stock market. Several other studies found that the structure of financial risks and
smoothing earnings has worked at firm value. Investment opportunity set and the leverage
effect on firm value. These results are consistent with Modigliani and Miller's opinion that the
enterprise value is determined by the earnings power of the company's assets. So ROA is one
of the factors that affect firm value. The same results on the research by Carlson and Bathala
(1997).
According to The Wall Street Journal, the rate of intangible investment as a percentage of
private-sector gross domestic product (GDP) overtook tangible investment in the mid-1990s.
Intangible assets in term of improvement firm performance, impact on firm value & policies
covered rarely in previous literates, some paper cover some aspects of intangible assets
(Rindu Rika Gamayun, 2015); (Vladimir Dženopoljac Stevo Janoševic Nick Bontis 2016).
But that is also in the context of certain countries not cross-sectional for the majority of
countries. Some other investigated in majority about intangible assets, as studied in different
papers (Melsa et al, 2015); (Onipe A. Yahya et al,2015); (lihard Stevanus et al 2017); (Rufo R
Mendoza 2017);(Zeb, S. & Rashid A 2016); (Lim S.C Macias et al 2018). Previously studies
were conducting examining intangible assets of a particular country or market in different
sectors.
1.3 Research Objective
We have studied sectorial analysis of the manufacturing & services sector globally among 14
countries in technological sectors from 2015 to 2018 because of the most recent data
availability of company’s annual reports, where most companies spend a large amount of
investment in intangible assets & also try to compare different groups with each other. This
study is particularly important because intangible assets ratio in total assets has been
significantly increased in many countries. We tend to find the impact of intangible assets on
financial performance, firm policy & firm value in the global technology sector. The current
paper covers how intangibles impact dependent variables & how these vary among countries.
1.4 Outline of the Study
We review in all previous papers & find the gap that the intangible plays a very prominent
role to drive the firm performance & impact on the firm value & policies. We design our
methodology to test the validity of intangible assets globally by sectorial analysis of each
country & its influence on the financial performance of companies. We collect data on
financial indicators of 14 countries from financial statement of 80 companies in technological
sector. We rely on the financial statement data source because of authenticity of data. We
obtain data for 14 countries of ROA, ROE, ROIC, ATO, Operating Profit, Intangible assets,
Debt to Equity, Dividend Payout Ratio, Price to Earnings Ratio, Price to Book Value & Price
to Sales Ratio. We make Intangible assets as independent variable & rest of all as dependent
variables. We take four years from 2015 to 2018 and run different test to support our results.
We run test on smart pls 3 and find correlation and regression analysis. Based on test result
we interpret and conclude our research.
Asian Journal of Finance & Accounting
ISSN 1946-052X
2020, Vol. 12, No. 1
ajfa.macrothink.org/ 32
2. Literature Review
Haji and Ghazali (2018) suggest the better investment in intangible resources to improve the
financial performance of companies. Investment in human capital and technology has the
perspective to improve the profitability and the lack of investment can results in weaker firm
performance.
Ozkan, Cakan, and Kayacan (2017) examine the association among investment in intangible
assets and banking profitability in the short and long run by using panel data. Their results
indicate that the intangible assets improve the banking performance in the long run
Nijun Zhang (2017) researched on the effect of intangible assets on firms’ economic
performance in listed telecommunication firms in China. Intangible assets ratio (intangible
assets divided by total assets) is used as an independent variable whereas the return on assets
(ROA) as the dependent variable. Assets are future economic benefits controlled by using
the entity as an end result of past transactions or other previous events. Intangible assets are
the companies’ aggressive advantage and challenging to imitate. In the Chinese accounting
standards, intangible belongings include patents, copyright, franchise, and land-use right.
There is an assumption that if in China, intangible belongings owned with the aid of
businesses can promote corporation’s performance higher than tangible assets, the market
structure is aggressive and mature. Hence a positive and significant correlation was found
between intangible assets and the firm’s profitability.
Vladimir Dženopoljac, Stevo Janoševic & Nick Bontis DeGroote (2016) investigated the
influence of intellectual capital (IC) on financial performance in information communication
technology (ICT) industry of Serbia. Financial performance is measured by the following
ratios; return on equity, return on assets, return on invested capital, profitability, and asset
turnover. Knowledge administration and IC are regarded among the youngest administration
disciplines to have received acceptance in the scientific community. The results of this study
indicate that there are no significant differences found in economic performance among
different ICT subsectors.
Jasenka Bubic & Toni Susak (2015) study the relationship between investment in intangible
assets represented by intangible assets to total assets ratio and financial performance of
companies represented by Return on Assets, Return on Equity, Net Profit Margin, and Gross
Profit Margin. Intangible assets are commercial enterprise sources of a company.
Gamayuni (2015) empirically tests the relationship between intangible assets, financial
policies, and financial performance on firm value in Indonesia's going-public business.
Process analysis was used in 2007-2009 to assess the relationship between intangible assets,
financial policies, financial performance, and firm value in Indonesia's going-public company.
Interestingly, intangible assets, financial policies, and financial performance have a
significant impact on firm value. Important assets have no significant influence on financial
policies but have had a positive and significant impact on financial performance (ROA) and
firm value. Debt policies and financial performance (ROA) have had a strong and important
impact on firm price. Limitation of financial statements in measuring and disclosing
Asian Journal of Finance & Accounting
ISSN 1946-052X
2020, Vol. 12, No. 1
ajfa.macrothink.org/ 33
intangible assets is the cause of a significant difference between equity of book value and
equity of market value.
Intangible assets are being transformed into an unrivaled resource for business wealth
creation. While tangible assets such as structures, facilities and equipment continue to be the
main elements in the production of goods and services, the relative importance has declined
over time as the significance of intangible assets replaces tangible assets (Martins & Alves,
2010)
3. Conceptual Framework
3.1 Dependent Variables
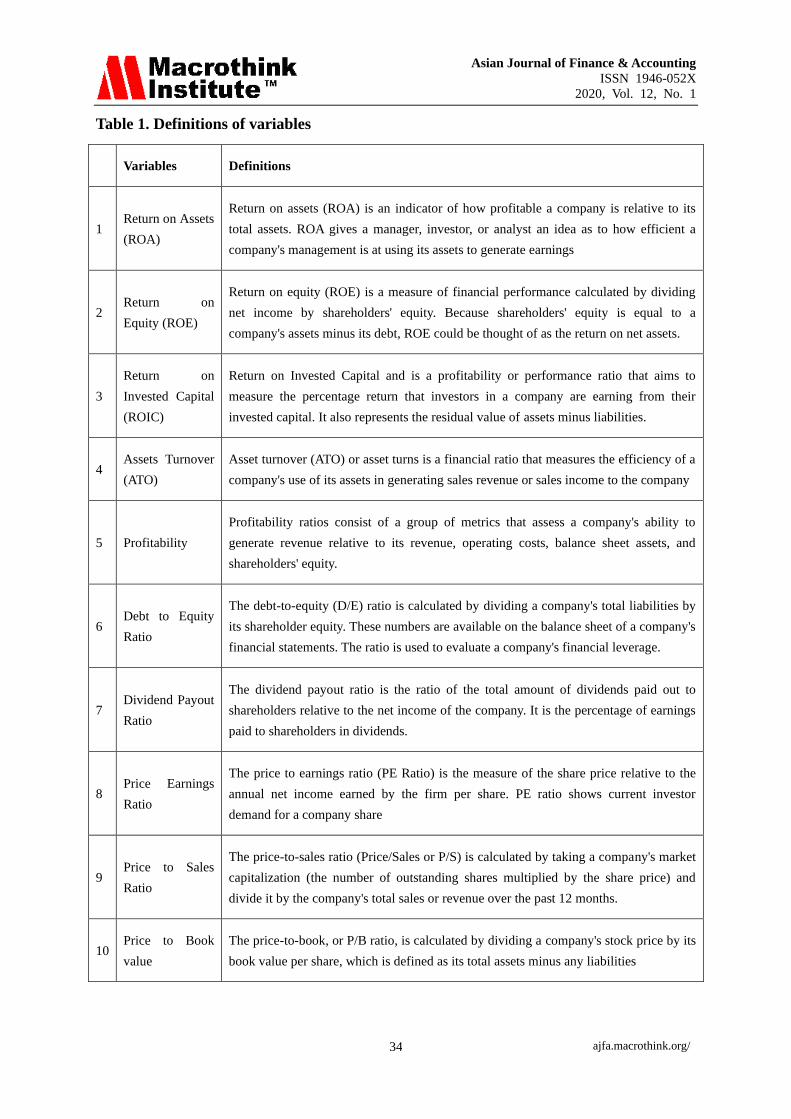
The dependent variable in this paper is Profitability, Efficiency, Capital Structure, dividend
policy and market value which is measured through the proxies of ROA, ROE, ROIC, ATO,
Net Profit margin, Debt to Equity Ratio, Dividend payout ratio, Price Earnings Ratio, Price to
Sales Ratio and Price to Book Value. Definitions of the variables mentioned in table 1:
Asian Journal of Finance & Accounting
ISSN 1946-052X
2020, Vol. 12, No. 1
ajfa.macrothink.org/ 34
Table 1. Definitions of variables
Variables Definitions
1 Return on Assets
(ROA)
Return on assets (ROA) is an indicator of how profitable a company is relative to its
total assets. ROA gives a manager, investor, or analyst an idea as to how efficient a
company's management is at using its assets to generate earnings
2 Return on
Equity (ROE)
Return on equity (ROE) is a measure of financial performance calculated by dividing
net income by shareholders' equity. Because shareholders' equity is equal to a
company's assets minus its debt, ROE could be thought of as the return on net assets.
3
Return on
Invested Capital
(ROIC)
Return on Invested Capital and is a profitability or performance ratio that aims to
measure the percentage return that investors in a company are earning from their
invested capital. It also represents the residual value of assets minus liabilities.
4 Assets Turnover
(ATO)
Asset turnover (ATO) or asset turns is a financial ratio that measures the efficiency of a
company's use of its assets in generating sales revenue or sales income to the company
5 Profitability
Profitability ratios consist of a group of metrics that assess a company's ability to
generate revenue relative to its revenue, operating costs, balance sheet assets, and
shareholders' equity.
6 Debt to Equity
Ratio
The debt-to-equity (D/E) ratio is calculated by dividing a company's total liabilities by
its shareholder equity. These numbers are available on the balance sheet of a company's
financial statements. The ratio is used to evaluate a company's financial leverage.
7 Dividend Payout
Ratio
The dividend payout ratio is the ratio of the total amount of dividends paid out to
shareholders relative to the net income of the company. It is the percentage of earnings
paid to shareholders in dividends.
8 Price Earnings
Ratio
The price to earnings ratio (PE Ratio) is the measure of the share price relative to the
annual net income earned by the firm per share. PE ratio shows current investor
demand for a company share
9 Price to Sales
Ratio
The price-to-sales ratio (Price/Sales or P/S) is calculated by taking a company's market
capitalization (the number of outstanding shares multiplied by the share price) and
divide it by the company's total sales or revenue over the past 12 months.
10 Price to Book
value
The price-to-book, or P/B ratio, is calculated by dividing a company's stock price by its
book value per share, which is defined as its total assets minus any liabilities

Asian Journal of Finance & Accounting
ISSN 1946-052X
2020, Vol. 12, No. 1
ajfa.macrothink.org/ 35
3.2 Independent Variable
In this paper data collected for 4 years (2015-2018) from 80 companies selected for
intangible assets. Intangible assets are an important indicator and taken as an independent
variable in this study.
Intangible assets are non-monetary assets besides physical traits that can be identified. They
include of following categories of assets: research and development, patents, concession
rights, trademarks, software, permissions for fishing, franchisees, and other rights, goodwill,
boost repayments for the buy of intangible asset and different intangible assets.
Capitalized intangible fixed assets and expensed R&D expenses scaled by total assets
represent our explanatory variables whereas market to book value ratio as the dependent
variable. Intangible belongings lack bodily substance and do not have a monetary
embodiment. The valuation of this form of belongings is tough and uncertain. Intangible
property commonly relates to improvements implementation, technological know-how
improvement or advertising and marketing activities. The increase in the quantity of company
intangible belongings influences the firms’ behavior. One of the modern-day tendencies is
that intangible belongings emerge as the foremost transferring channel of income shifting and
switch pricing manipulation. The function of intangibility is related to a number of issues of
valuation of internally generated intangible assets. Those are divided into two groups:
identifiable and unidentifiable intangible assets. The valuation of intangible belongings is
particularly necessary for the pricing of mergers and acquisitions. Results assert that there is a
positive and significant relationship among dependent and independent variables.
3.3 Development of Research Hypothesis
According to IAS 38, spending on R&D can be counted as investment or assets. This option
will impact financial performance, but it is difficult to estimate the effect because it raises the
information asymmetry between shareholders and managers. Canibano, Garcia-Ayuso, and
Sanchez (2000) in Lantz, et al. (2005) show the presence of improved returns due to
increased spending on research and development, so hypothesis derived from this literature
review.
H1. Intangible asset has a direct positive impact on financial performance of the technology
firm
H1a. Intangible assets has significant effect on ROE.
H1b. Intangible assets has significant effect on ROA.
H1c. Intangible assets has significant effect on ROIC.
H1d. Intangible assets has significant effect on Net Profit Margin.
H1e. Intangible assets has significant effect ATO.
The theory of the agency cost (Jensen and Meckling, 1976) suggests that the expense of the
agency cost influences monetary policy. Depending on the unique characteristics of
Asian Journal of Finance & Accounting
ISSN 1946-052X
2020, Vol. 12, No. 1
ajfa.macrothink.org/ 36
intangible assets, in organizations with concentrated intangible assets, the expense of the
business is projected to be higher. Intangible assets would increase the cost of the business to
shareholders (due to more details and secret action), including the cost of the debtor agency
(asset substitution and underinvestment problem) so the second testing hypothesis derived
from this theory.
H2. Intangible asset has a direct positive impact on financial policy of technology firm
H2a. Intangible assets affect debt policy.
H2b. Intangible assets affect the dividend policy.
Agrawal and Knoeber (1996) result in a positive and important connection of intangible
investment to the market value of the company. And so, in her research, Connolly and
Hirschey's (1984) show a positive correlation between intangible spending and firm interest.
Erawati and Sudana (2005) suggested the idea that, together with the tangible assets,
intangible assets are one category that: (1) assess the company's value and (2) influence the
financial performance of the company.
H3. Intangible asset has a direct positive impact on market value of technology firm.
H3a. Intangible assets has significant effect on P/E.
H3b. Intangible assets has significant effect on P/Book value.
H3c. Intangible assets has significant effect on P/Sales.
By testing the H4, we can determine that if there is significant differences occur in the sector
of the technological firm or not that is (manufacturing & service) because in some papers
such as Miyagawa (2015) investigate and proposed that service sector rely more on
intangible assets than manufacturing so we tested this among global technology firms
H4. The contribution of intangible assets to a company’s financial performance, financial
policies & market value will not be significantly different among the global technological
subsector.
Hypothesis 5 is used to test that if result varies from country to country or not because in
most countries this is not reported due to the lack of ability of the accounting standards issued
to date. Intangibles are among the fundamental determinant of the value of business
enterprises. Currently, most of the intangibles are only revealed indirectly by incremental
economic performance (Mortensen, Eustace and Lannoo, 1997).
H5: The contribution of intangible assets to the company’s financial performance, financial
policy, and market value will not be significantly different among different country’s groups.
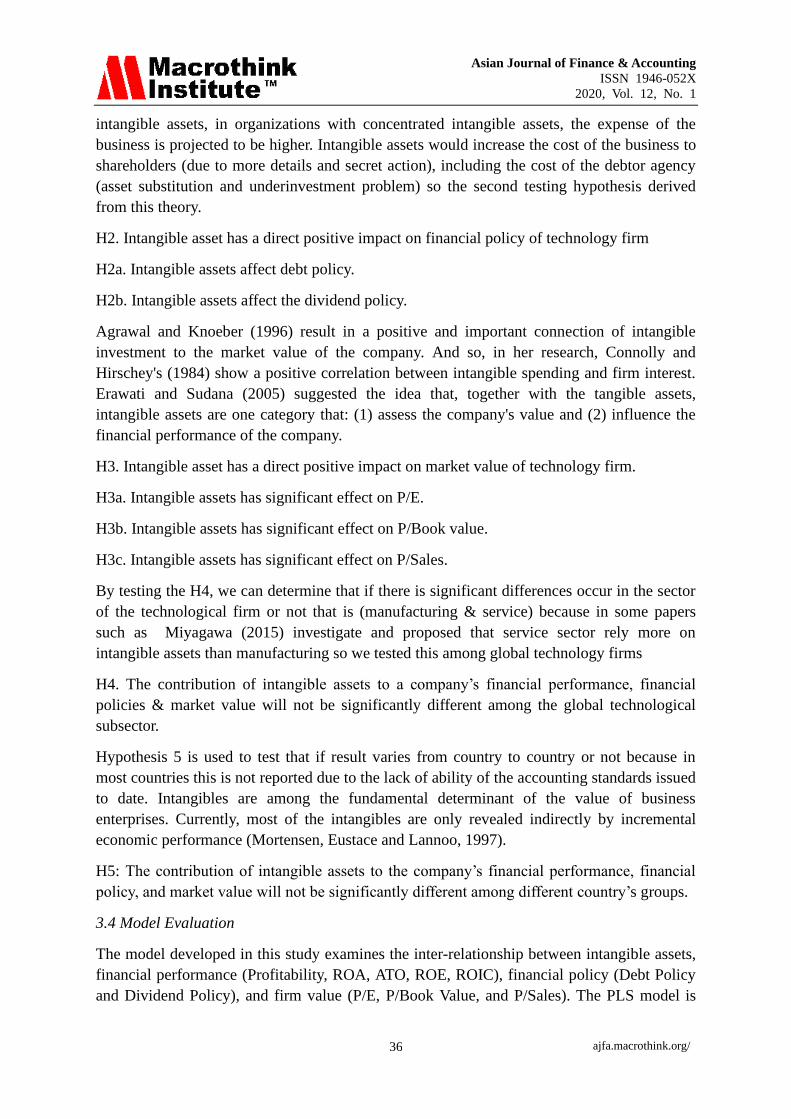
3.4 Model Evaluation
The model developed in this study examines the inter-relationship between intangible assets,
financial performance (Profitability, ROA, ATO, ROE, ROIC), financial policy (Debt Policy
and Dividend Policy), and firm value (P/E, P/Book Value, and P/Sales). The PLS model is
Asian Journal of Finance & Accounting
ISSN 1946-052X
2020, Vol. 12, No. 1
ajfa.macrothink.org/ 37
shown in Figure 1.
Figure 1. Model of the Study
4. Methodology
4.1 Sample
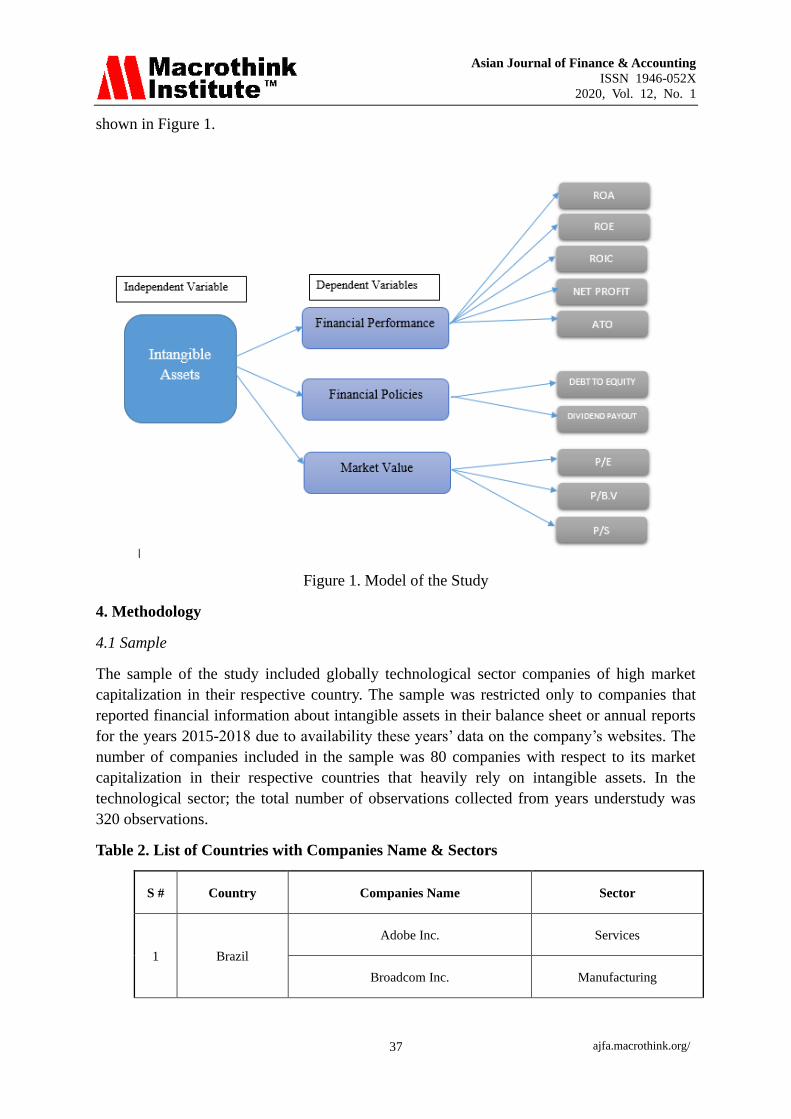
The sample of the study included globally technological sector companies of high market
capitalization in their respective country. The sample was restricted only to companies that
reported financial information about intangible assets in their balance sheet or annual reports
for the years 2015-2018 due to availability these years’ data on the company’s websites. The
number of companies included in the sample was 80 companies with respect to its market
capitalization in their respective countries that heavily rely on intangible assets. In the
technological sector; the total number of observations collected from years understudy was
320 observations.
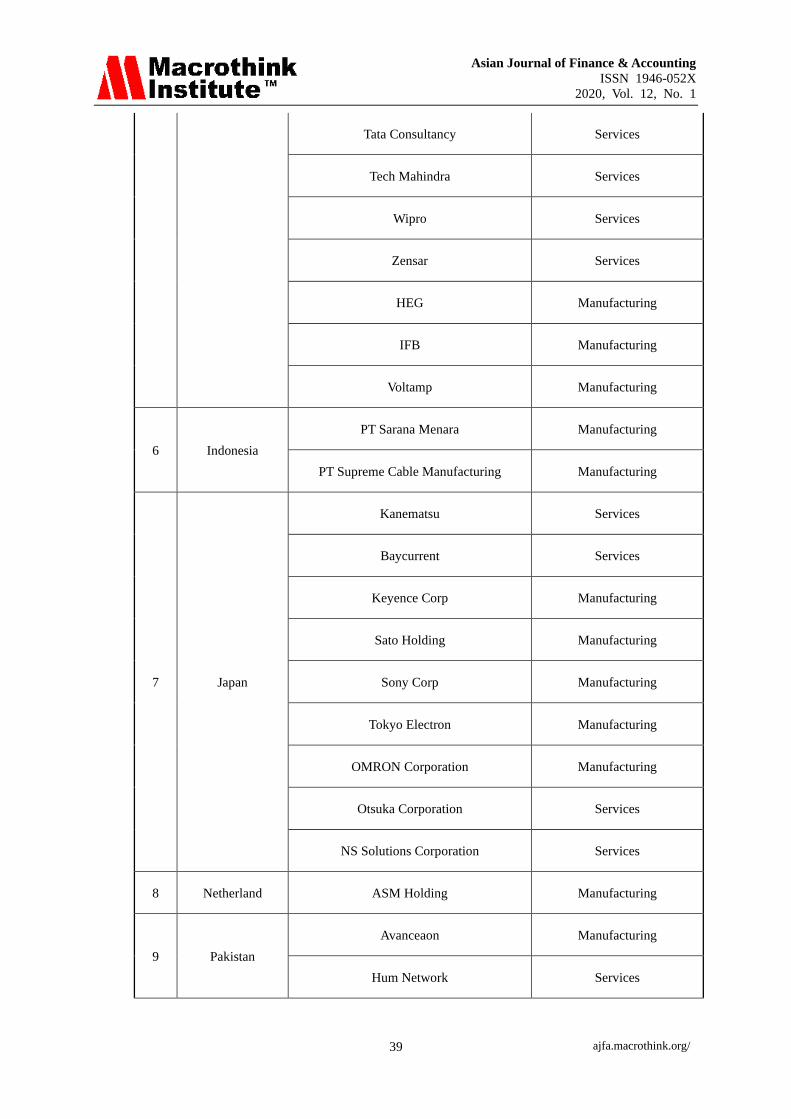
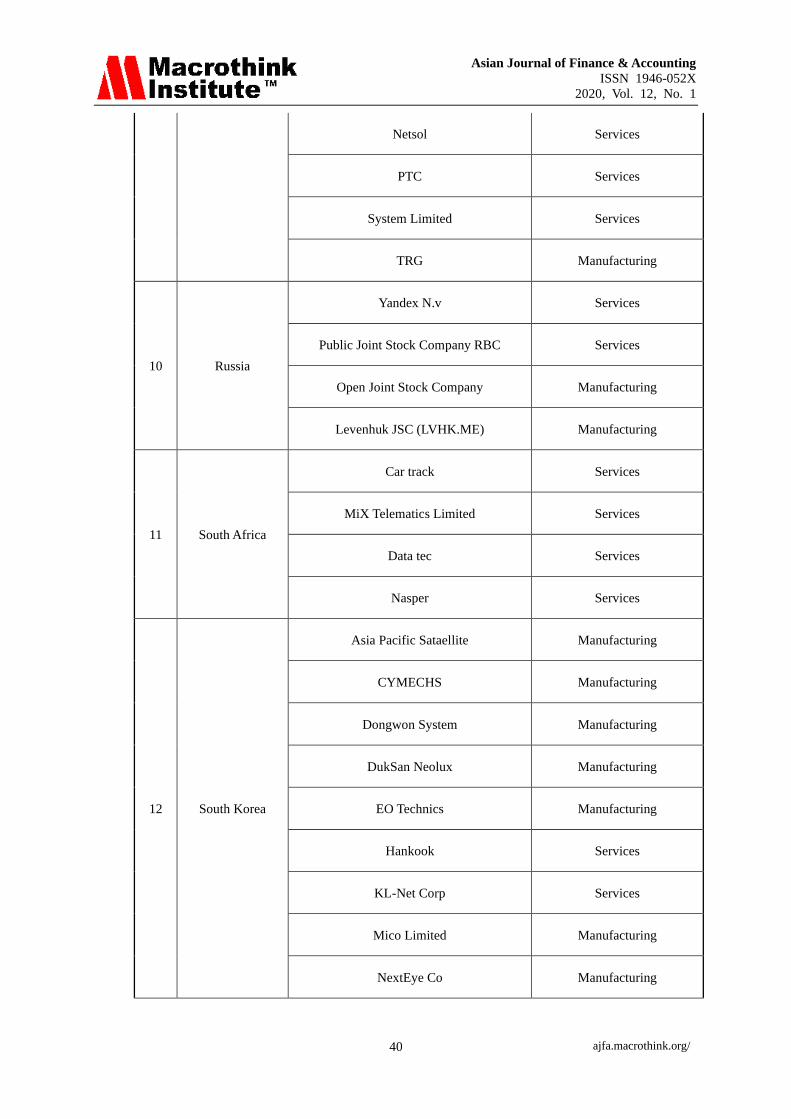
Table 2. List of Countries with Companies Name & Sectors
S # Country Companies Name Sector
1 Brazil
Adobe Inc. Services
Broadcom Inc. Manufacturing

Asian Journal of Finance & Accounting
ISSN 1946-052X
2020, Vol. 12, No. 1
ajfa.macrothink.org/ 38
Sinqia S.A Services
2 China
Hangzou Manufacturing
Midea Group Manufacturing
Haier Smart Home Manufacturing
Tencent Holding Limited Services
ZTE Corporation Manufacturing
3 Finland
Nokia Corporation Manufacturing
Telefonaktiebolaget LM Ericsson Services
Vaisala Oyj (VAIAS.HE) Manufacturing
4 Germany
Dell Technologies Manufacturing
SAP SE Services
5 India
Accelya Services
Mastek Services
Birlasoft Services
HCL Technologies Services
Himachal Manufacturing
Infosys Services
L & T Services
Mphasis Services
Sonata Software Services
Sterlite Manufacturing
Asian Journal of Finance & Accounting
ISSN 1946-052X
2020, Vol. 12, No. 1
ajfa.macrothink.org/ 39
Tata Consultancy Services
Tech Mahindra Services
Wipro Services
Zensar Services
HEG Manufacturing
IFB Manufacturing
Voltamp Manufacturing
6 Indonesia
PT Sarana Menara Manufacturing
PT Supreme Cable Manufacturing Manufacturing
7 Japan
Kanematsu Services
Baycurrent Services
Keyence Corp Manufacturing
Sato Holding Manufacturing
Sony Corp Manufacturing
Tokyo Electron Manufacturing
OMRON Corporation Manufacturing
Otsuka Corporation Services
NS Solutions Corporation Services
8 Netherland ASM Holding Manufacturing
9 Pakistan
Avanceaon Manufacturing
Hum Network Services
Asian Journal of Finance & Accounting
ISSN 1946-052X
2020, Vol. 12, No. 1
ajfa.macrothink.org/ 40
Netsol Services
PTC Services
System Limited Services
TRG Manufacturing
10 Russia
Yandex N.v Services
Public Joint Stock Company RBC Services
Open Joint Stock Company Manufacturing
Levenhuk JSC (LVHK.ME) Manufacturing
11 South Africa
Car track Services
MiX Telematics Limited Services
Data tec Services
Nasper Services
12 South Korea
Asia Pacific Sataellite Manufacturing
CYMECHS Manufacturing
Dongwon System Manufacturing
DukSan Neolux Manufacturing
EO Technics Manufacturing
Hankook Services
KL-Net Corp Services
Mico Limited Manufacturing
NextEye Co Manufacturing

Asian Journal of Finance & Accounting
ISSN 1946-052X
2020, Vol. 12, No. 1
ajfa.macrothink.org/ 41
Samsung Electronic Manufacturing
Signetic Corporation Manufacturing
13 Taiwan
Taiwan Semiconductor Manufacturing
Yageo Corporation Manufacturing
14 USA
Amadeus Services
Accenture Services
Cisco Systems Manufacturing
Cognizant Services
Fujitsu Services
Intel Corporation Manufacturing
International Business Machine Services
Microsoft Corporation Services
NIVIDIA Manufacturing
ORACLE Services
Texas Instruments Manufacturing
4.2 Trend Analysis
4.2.1 Scatter Plot Analysis:

Asian Journal of Finance & Accounting
ISSN 1946-052X
2020, Vol. 12, No. 1
ajfa.macrothink.org/ 42
Plot A (ROA vs Intangible/total assets
In Plot A, the data points line up very nicely! we can easily draw a horizontal line amongst
these dots, and the line would be a good fit to the data. However, the fact that the line would
be horizontal means that the input values (that is, Intangibles/Total Assets) are irrelevant to
the output values (that is, ROA). So there is a definite trend to the data, and there is an
excellent good-fit line for it, but that line only says that the input values are irrelevant. If the
inputs are irrelevant, then there can't possibly be a correlation between inputs and outputs.
Plot B (Debt to Equity vs Intangible/total assets
In Plot B shows a bunch of dots, we can draw a horizontal line amongst these dots, and the
line would be a good fit for the data but at some extent increasing at the bottom. However,
the fact that the line would be horizontal means that the input values (that is, Intangibles/Total
Assets) are irrelevant to the output values (that is, Debt to Equity Ratio). If the inputs are
irrelevant, then there can't possibly be a correlation between inputs and outputs.

Asian Journal of Finance & Accounting
ISSN 1946-052X
2020, Vol. 12, No. 1
ajfa.macrothink.org/ 43
Plot C (Dividend Payout Ratio vs Intangible/total assets
Plot C shows a bunch of dots, where low x-values that is (Intangible Assets/Total Assets)
correspond to low y-values (Dividend Payout Ratio), and high x-values correspond to high
y-values. It's fairly obvious to me that we could draw a straight line, starting near the
left-most dot and angling upwards as I move to the right, amongst the plotted data points, and
the line would look like a good match to the points. Such a line would have a positive slope,
and the plotted data points would all lie on or very close to that drawn line.
So there does appear to be a strong correlation here and, because the good-fit line drawn
amongst these points would have a positive slope, that correlation is positive.
Plot D (Price Earning Ratio vs Intangible/total assets
Asian Journal of Finance & Accounting
ISSN 1946-052X
2020, Vol. 12, No. 1
ajfa.macrothink.org/ 44
Plot D shows a bunch of dots, where low x-values (Intangible Assets/Total Assets)
correspond to high y-values (P/E), and high x-values correspond to low y-values. It's fairly
obvious to me that I could draw a straight line, starting from around the left-most dot and
angling downwards as I move to the right, amongst the plotted data points, and the line would
look like a good match to the points. Such a line would have a negative slope, and the plotted
data points would all lie on or very close to that drawn line.
So there does appear to be a strong correlation here and, because a good-fit line drawn
amongst these points would have a negative slope, that correlation is negative.
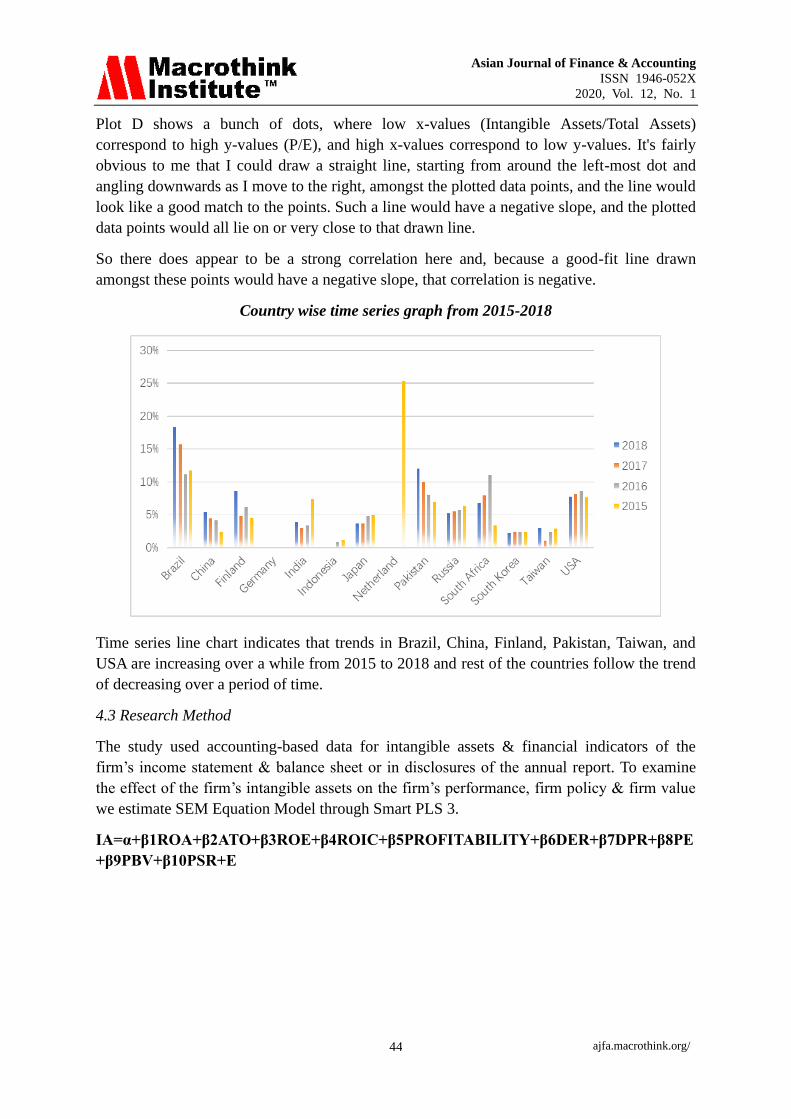
Country wise time series graph from 2015-2018
Time series line chart indicates that trends in Brazil, China, Finland, Pakistan, Taiwan, and
USA are increasing over a while from 2015 to 2018 and rest of the countries follow the trend
of decreasing over a period of time.
4.3 Research Method
The study used accounting-based data for intangible assets & financial indicators of the
firm’s income statement & balance sheet or in disclosures of the annual report. To examine
the effect of the firm’s intangible assets on the firm’s performance, firm policy & firm value
we estimate SEM Equation Model through Smart PLS 3.
IA=α+β1ROA+β2ATO+β3ROE+β4ROIC+β5PROFITABILITY+β6DER+β7DPR+β8PE
+β9PBV+β10PSR+E
Asian Journal of Finance & Accounting
ISSN 1946-052X
2020, Vol. 12, No. 1
ajfa.macrothink.org/ 45
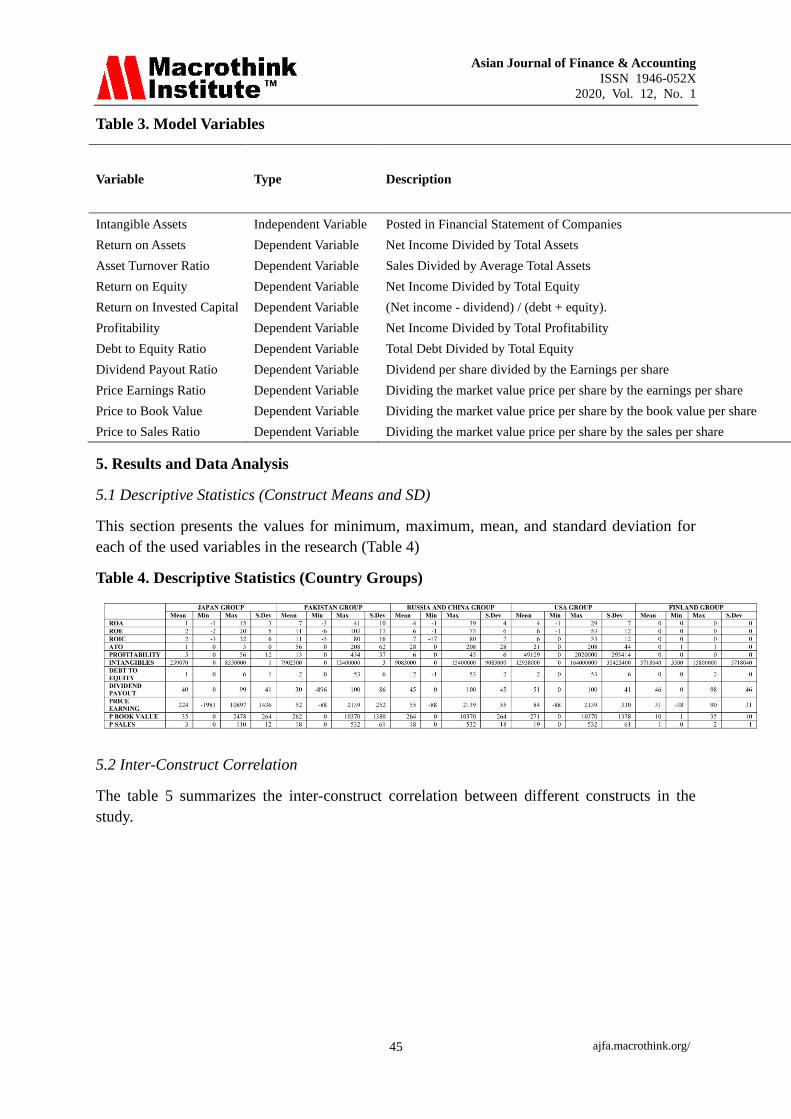
Table 3. Model Variables
Variable Type Description
Intangible Assets Independent Variable Posted in Financial Statement of Companies
Return on Assets Dependent Variable Net Income Divided by Total Assets
Asset Turnover Ratio Dependent Variable Sales Divided by Average Total Assets
Return on Equity Dependent Variable Net Income Divided by Total Equity
Return on Invested Capital Dependent Variable (Net income - dividend) / (debt + equity).
Profitability Dependent Variable Net Income Divided by Total Profitability
Debt to Equity Ratio Dependent Variable Total Debt Divided by Total Equity
Dividend Payout Ratio Dependent Variable Dividend per share divided by the Earnings per share
Price Earnings Ratio Dependent Variable Dividing the market value price per share by the earnings per share
Price to Book Value Dependent Variable Dividing the market value price per share by the book value per share
Price to Sales Ratio Dependent Variable Dividing the market value price per share by the sales per share
5. Results and Data Analysis
5.1 Descriptive Statistics (Construct Means and SD)
This section presents the values for minimum, maximum, mean, and standard deviation for
each of the used variables in the research (Table 4)
Table 4. Descriptive Statistics (Country Groups)
5.2 Inter-Construct Correlation
The table 5 summarizes the inter-construct correlation between different constructs in the
study.

Asian Journal of Finance & Accounting
ISSN 1946-052X
2020, Vol. 12, No. 1
ajfa.macrothink.org/ 46
Table 5. Inter-construct Correlation Analysis
1 2 3 4 5 6 7 8 9 10 11
ROA (1) 1
ROE (2) 0.818 1
ROIC (3) 0.89 0.84 1
ATO (4) 0.7 0.632 0.662 1
Profitability (5) -0.054 -0.043 -0.052 -0.047 1
Intangible assets (6) -0.057 -0.046 -0.054 -0.056 -0.013 1
DebttoEquityRatio (7) -0.091 -0.071 -0.094 -0.077 0.007 -0.016 1
DividendPayoutRatio (8) -0.014 0.014 -0.021 -0.067 0.063 0.085 -0.114 1
PE (9) -0.049 -0.042 -0.052 -0.058 -0.009 0.31 -0.022 0.067 1
PBookvalue (10) -0.062 -0.052 -0.063 -0.068 -0.011 -0.016 0.019 -0.052 -0.024 1
PSales (11) 0.066 -0.073 -0.084 -0.089 -0.013 -0.026 -0.016 0.029 0.022 0.44 1
Structural Equation Model
This section ascertains the proposed relationships in the study. The structural model shows
how well the theoretical model predicts the hypothesized paths.
5.3 Hypotheses Testing (Overall Data)
H1. Intangible asset has a direct positive impact on the financial performance of the
technology firm
H1a: Intangible assets has significant effect on ROE
H1a evaluates the impact of intangible assets on ROE. The hypotheses results show that
Assets have a significant negative impact on ROE (β = -0.045, t = 2.619, p = 0.000). This
shows that higher intangible assets would lead to lower ROE. Hence, the hypotheses H1a was
not supported.
H1b: Intangible assets has significant effect on ROA
H1b evaluates the impact of intangible assets on ROA. The hypotheses results show that
Assets have a significant negative impact on ROA (β = -0.056, t = 2.570, p = 0.01). This
shows that higher intangible assets would lead to lower ROA. Hence, the hypotheses H1b
was not supported.
Asian Journal of Finance & Accounting
ISSN 1946-052X
2020, Vol. 12, No. 1
ajfa.macrothink.org/ 47
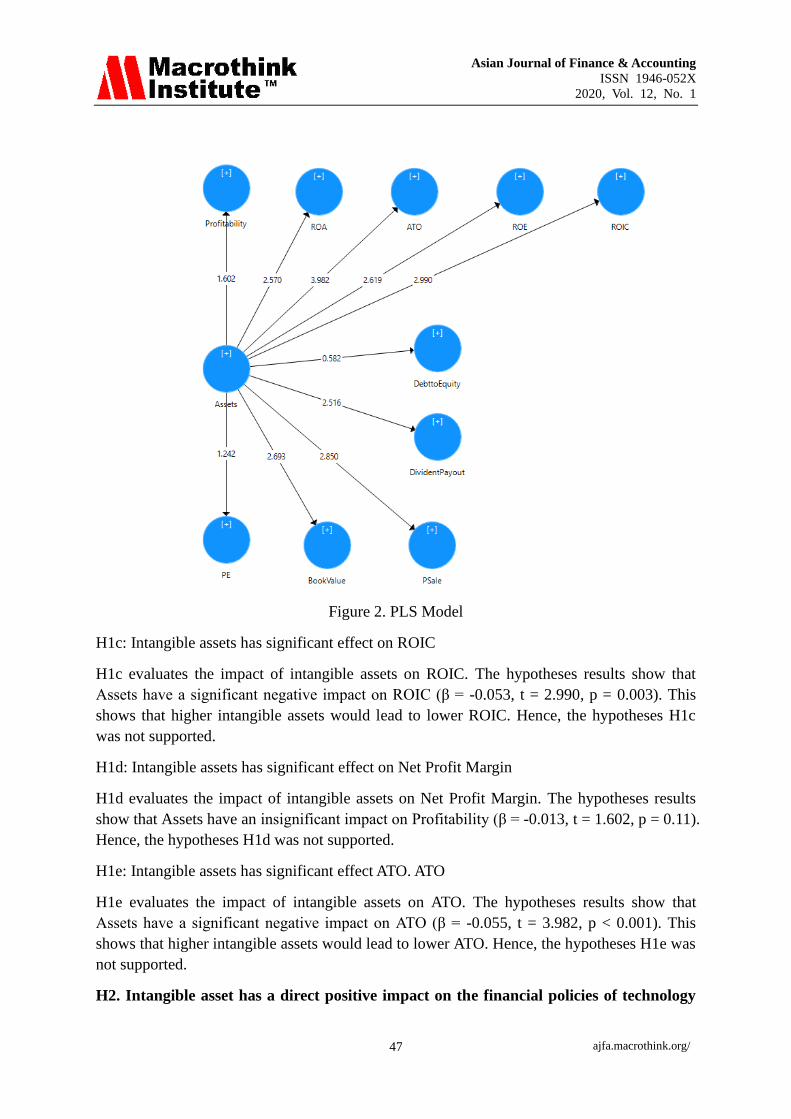
Figure 2. PLS Model
H1c: Intangible assets has significant effect on ROIC
H1c evaluates the impact of intangible assets on ROIC. The hypotheses results show that
Assets have a significant negative impact on ROIC (β = -0.053, t = 2.990, p = 0.003). This
shows that higher intangible assets would lead to lower ROIC. Hence, the hypotheses H1c
was not supported.
H1d: Intangible assets has significant effect on Net Profit Margin
H1d evaluates the impact of intangible assets on Net Profit Margin. The hypotheses results
show that Assets have an insignificant impact on Profitability (β = -0.013, t = 1.602, p = 0.11).
Hence, the hypotheses H1d was not supported.
H1e: Intangible assets has significant effect ATO. ATO
H1e evaluates the impact of intangible assets on ATO. The hypotheses results show that
Assets have a significant negative impact on ATO (β = -0.055, t = 3.982, p < 0.001). This
shows that higher intangible assets would lead to lower ATO. Hence, the hypotheses H1e was
not supported.
H2. Intangible asset has a direct positive impact on the financial policies of technology

Asian Journal of Finance & Accounting
ISSN 1946-052X
2020, Vol. 12, No. 1
ajfa.macrothink.org/ 48
firm.
H2a: Intangible assets affect debt policy
H2a evaluates the impact of intangible assets on Debt to Equity. The hypotheses results show
that Assets have an insignificant impact on Debt to Equity (β = -0.016, t = 0.582, p = 0.561).
Hence, the hypotheses H2a was not supported.
H2b: Intangible assets affect the dividend policy
H2b evaluates the impact of intangible assets on Dividend Policy. The hypotheses results
show that Assets have a significant positive impact on Dividend Policy (β = 0.084, t = 2.516,
p = 0.012). This shows that higher intangible assets would lead to higher dividend payout.
Hence, the hypotheses H2b was supported.
H3. Intangible asset has a direct positive impact on market value of technology firm
H3a: Intangible assets has significant effect on P/E
H3a evaluates the impact of intangible assets on P/E. The hypotheses results show that Assets
have an insignificant effect on P/E (β = 0.304, t = 1.242, p = 0.215). Hence, the hypotheses
H3a was not supported.
H3b: Intangible assets has significant effect on P/Book value
H3b evaluates the effect of intangible assets on P/Book Value. The hypotheses results show
that Assets have a significant negative effect on P/Book Value (β = -0.016, t = 2.693, p =
0.007). This shows that higher intangible assets would lead to lower P/Book Value. Hence,
the hypotheses H3b was not supported.
H3c: Intangible assets has significant effect on P/Sales.
H3c evaluates the effect of intangible assets on P/Book Value. The hypotheses results show
that Assets have a significant negative effect on P/Sale (β = -0.026, t = 2.850, p = 0.005). This
shows that higher intangible assets would lead to lower P/Sale. Hence, the hypotheses H3c
was not supported.
Asian Journal of Finance & Accounting
ISSN 1946-052X
2020, Vol. 12, No. 1
ajfa.macrothink.org/ 49
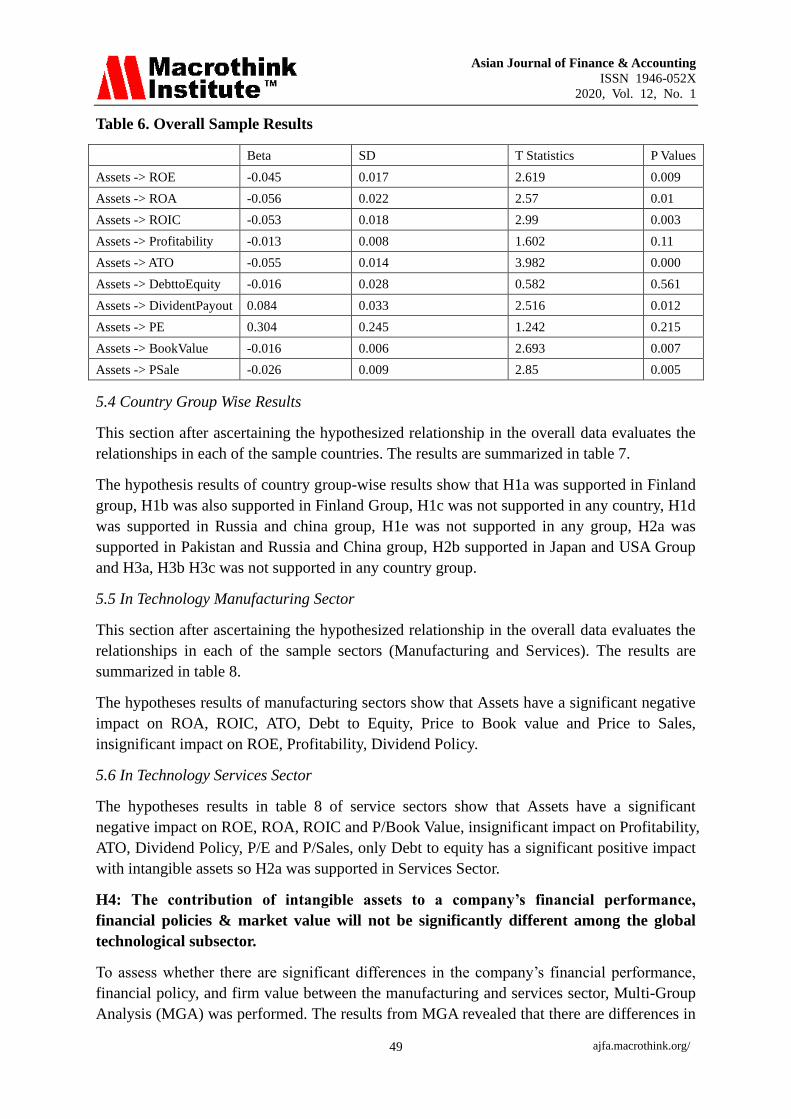
Table 6. Overall Sample Results
Beta SD T Statistics P Values
Assets -> ROE -0.045 0.017 2.619 0.009
Assets -> ROA -0.056 0.022 2.57 0.01
Assets -> ROIC -0.053 0.018 2.99 0.003
Assets -> Profitability -0.013 0.008 1.602 0.11
Assets -> ATO -0.055 0.014 3.982 0.000
Assets -> DebttoEquity -0.016 0.028 0.582 0.561
Assets -> DividentPayout 0.084 0.033 2.516 0.012
Assets -> PE 0.304 0.245 1.242 0.215
Assets -> BookValue -0.016 0.006 2.693 0.007
Assets -> PSale -0.026 0.009 2.85 0.005
5.4 Country Group Wise Results
This section after ascertaining the hypothesized relationship in the overall data evaluates the
relationships in each of the sample countries. The results are summarized in table 7.
The hypothesis results of country group-wise results show that H1a was supported in Finland
group, H1b was also supported in Finland Group, H1c was not supported in any country, H1d
was supported in Russia and china group, H1e was not supported in any group, H2a was
supported in Pakistan and Russia and China group, H2b supported in Japan and USA Group
and H3a, H3b H3c was not supported in any country group.
5.5 In Technology Manufacturing Sector
This section after ascertaining the hypothesized relationship in the overall data evaluates the
relationships in each of the sample sectors (Manufacturing and Services). The results are
summarized in table 8.
The hypotheses results of manufacturing sectors show that Assets have a significant negative
impact on ROA, ROIC, ATO, Debt to Equity, Price to Book value and Price to Sales,
insignificant impact on ROE, Profitability, Dividend Policy.
5.6 In Technology Services Sector
The hypotheses results in table 8 of service sectors show that Assets have a significant
negative impact on ROE, ROA, ROIC and P/Book Value, insignificant impact on Profitability,
ATO, Dividend Policy, P/E and P/Sales, only Debt to equity has a significant positive impact
with intangible assets so H2a was supported in Services Sector.
H4: The contribution of intangible assets to a company’s financial performance,
financial policies & market value will not be significantly different among the global
technological subsector.
To assess whether there are significant differences in the company’s financial performance,
financial policy, and firm value between the manufacturing and services sector, Multi-Group
Analysis (MGA) was performed. The results from MGA revealed that there are differences in

Asian Journal of Finance & Accounting
ISSN 1946-052X
2020, Vol. 12, No. 1
ajfa.macrothink.org/ 50
the significance of the impact of Assets on ROA, ROE, and ROIC (p < .05), however all
other differences in significance between the two groups are insignificant. The results are
summarized in table 8.
H5: The contribution of intangible assets to the company’s financial performance,
financial policy, and market value will not be significantly different among different
country’s groups.
The study evaluated whether there are significant differences in the company’s financial
performance, financial policy, and firm value across different countries (Finland, Japan,
Pakistan, Russia & China, and the USA), Multi-Group Analysis (MGA) was performed. The
results from MGA revealed that there are differences (p < .05) in the significance of the
impact of Assets on the criterion variable between a few countries for instance Asset’s impact
on ROIC is significantly different between Russia & China and USA. Results are presented
in table 9, a p-value less than .05 indicate a significant difference in the impact of Assets on
different outcomes variables between the countries.
Table 7. Country Group Wise Analysis
Finland Japan Pakistan Russia and China USA
Beta SD T P Beta SD T P Beta SD T P Beta SD T P Beta SD T P
Assets -> ROE 0.202 0.099 2.044 0.041 -0.073 0.023 3.151 0.002 -0.173 0.047 3.715 0.000 -0.133 0.081 1.645 0.101 -0.129 0.053 2.424 0.016
Assets -> ROA 0.218 0.116 1.878 0.061 -0.062 0.021 3.023 0.003 -0.246 0.031 8.046 0.000 0.094 0.103 0.914 0.361 -0.130 0.059 2.217 0.027
Assets -> ROIC 0.065 0.146 0.448 0.654 -0.083 0.025 3.274 0.001 -0.197 0.035 5.588 0.000 0.115 0.095 1.201 0.230 -0.127 0.061 2.092 0.037
Assets -> Profitability -0.111 0.117 0.947 0.344 -0.075 0.021 3.533 0.000 -0.106 0.074 1.426 0.154 0.523 0.193 2.714 0.007 -0.099 0.039 2.542 0.011
Assets -> ATO 0.019 0.141 0.136 0.892 -0.069 0.031 2.202 0.028 -0.132 0.058 2.286 0.023 -0.242 0.160 1.515 0.130 0.027 0.083 0.318 0.750
Assets -> DebttoEquity -0.136 0.097 1.397 0.163 -0.062 0.054 1.150 0.251 0.351 0.179 1.965 0.050 0.314 0.105 2.983 0.003 -0.105 0.104 1.007 0.314
Assets -> DividentPayout 0.088 0.199 0.443 0.658 0.265 0.057 4.685 0.000 -0.055 0.089 0.615 0.539 0.127 0.146 0.867 0.386 0.188 0.060 3.115 0.002
Assets -> PE -0.137 0.127 1.073 0.284 0.300 0.235 1.278 0.202 0.081 0.160 0.509 0.611 -0.210 0.092 2.280 0.023 -0.089 0.154 0.579 0.563
Assets -> Book Value -0.211 0.138 1.528 0.127 -0.027 0.048 0.557 0.578 -0.054 0.014 3.990 0.000 -0.055 0.144 0.378 0.705 -0.442 0.083 5.315 0.000
Assets -> PSale -0.311 0.093 3.366 0.001 -0.056 0.056 0.993 0.321 -0.031 0.063 0.489 0.625 -0.214 0.093 2.306 0.022 -0.478 0.125 3.828 0.000

Asian Journal of Finance & Accounting
ISSN 1946-052X
2020, Vol. 12, No. 1
ajfa.macrothink.org/ 51
Table 8. Manufacturing and Services Sector Analysis
Manufacturing Services
Beta SD T Statistics P Values Beta SD T Statistics P Values
Assets -> ROE -0.019 0.017 1.155 0.249 -0.176 0.036 4.851 0.000
Assets -> ROA -0.049 0.014 3.400 0.001 -0.217 0.024 9.018 0.000
Assets -> ROIC -0.055 0.016 3.382 0.001 -0.194 0.024 8.136 0.000
Assets -> Profitability -0.031 0.019 1.631 0.104 -0.039 0.021 1.880 0.061
Assets -> ATO -0.056 0.015 3.774 0.000 -0.085 0.058 1.465 0.144
Assets -> DebttoEquity -0.038 0.014 2.698 0.007 0.324 0.137 2.366 0.018
Assets -> DividentPayout 0.100 0.052 1.903 0.058 0.010 0.097 0.101 0.919
Assets -> PE 0.301 0.238 1.265 0.206 0.039 0.091 0.432 0.666
Assets -> BookValue -0.090 0.020 4.427 0.000 -0.060 0.012 4.951 0.000
Assets -> PSale -0.105 0.029 3.578 0.000 -0.051 0.052 0.997 0.319
Table 9. Multi-group Analysis – Manufacturing and Services Sector
Manufacturing – Services p-Value(Manufacturing vs Services)
Assets -> ROE 0.157 0.000
Assets -> ROA 0.169 0.000
Assets -> ROIC 0.139 0.000
Assets -> Profitability 0.007 0.372
Assets -> ATO 0.029 0.308
Assets -> DebttoEquity 0.361 0.995
Assets -> DividentPayout 0.090 0.204
Assets -> PE 0.262 0.118
Assets -> BookValue 0.030 0.890
Assets -> PSale 0.054 0.832
Table 10. Multi-group Analysis-Country Groups
6. Discussion
These results support previous research of Haji and Ghazali (2018), Nijun Zhang (2017)
Vladimir Dženopoljac, Stevo Janoševic & Nick Bontis DeGroote (2016) and Gamayuni
(2015) found that the higher the intangible assets, the higher the ability of companies to
return earnings assets. The higher the intangible assets owned by the company, the higher

Asian Journal of Finance & Accounting
ISSN 1946-052X
2020, Vol. 12, No. 1
ajfa.macrothink.org/ 52
company's ability to generate profits, and investors will appreciate the company (seen from
the large market capitalization of companies) that will increase the value of the company.
Model 1 of the study shows that intangible assets have a positive impact on the financial
performance of the enterprise because out of five proxies, four have the significantly affected
by intangibles. Model 2 shows that sub hypothesis dividend policy affects from the
intangibles that supported the model also. Model 3 result shows that Price/book value and
Price/Sales negatively affected from the intangibles. Model 4 used for sectorial analysis of
the technological sector of 80 companies and Multi group Analysis revealed that there
difference in the significance on profitability and efficiency, however, all other differences in
significance between manufacturing and service are insignificant. The results of the Model 5
revealed that there are significant differences in the company’s financial performance,
financial policy, and firm value across different countries (Finland, Japan, Pakistan, Russia &
China, and the USA), Multi-Group Analysis (MGA) was performed.
This paper covers the gap by taking comparative analysis among 14 countries and find that
results vary country to country and also varies among sectors. This study is will help in find
out that the impact of intangibles in technology firm and identify country or sectors means
(manufacturing or services) that capitalize intangibles more efficiently.
Intangibles assets are nowadays become the safest investment because it will make your firm
stronger and more productive by increasing the market efficiency as well build on profitable
channels by showing your goodwill in numbers at the financial position statement of business.
By studying from different aspects it is concluded intangible assets is useful resource of the
business, it should fairly recorded and disclosed in the balance sheet.
7. Conclusion
The current paper supports the impact of intangibles on profitability, efficiency, capital
structure, and dividend policy, and market value of technology firms. This paper attempt to
cover broader portrait drew from the impact of intangibles by introducing 14 countries
financial indicators from 2015 to 2018. In previous studies, only one country and any specific
market aspect covered not global comparative analysis conducted. The main purpose of this
study is to find out whether intangibles impact financial indicators of the company or not. For
this SEM analysis was conducted that revealed several important points. Firstly in overall
data analysis, Intangible assets have a significant negative effect on ROE, ROA, ROIC, ATO,
Debt to Equity Ratio, P/book value, P/Sales and insignificant positive impact on profitability,
P/E and significant positive impact on Dividend Policy. Secondly, country group-wise data
revealed that in Finland group intangible assets have significant impact on ROA, ROE and
P/Sales, in Japan group intangible assets have significant impact on ROA, ROE, Profitability,
ATO, Dividend Policy and P/Book value, In Pakistan group, significant impact on ROE,
ROA, ROIC, ATO, Debt to Equity Ratio and P/Book Value, in Russia group significant
impact on Profitability, Debt to Equity, P/E and P/Sales ratio and In USA group have a
significant impact on ROE, ROA, ROIC, Profitability, Debt to Equity, Dividend Policy,
P/book value, and P/Sales ratio. Third, To assess whether there are significant difference in
company’s financial performance, financial policy, and firm value between manufacturing

Asian Journal of Finance & Accounting
ISSN 1946-052X
2020, Vol. 12, No. 1
ajfa.macrothink.org/ 53
and services sector, Multi-Group Analysis (MGA) was performed. The results from MGA
also revealed that there are difference in the significance of impact of Assets on ROA, ROE,
and ROIC (p < .05), however all other differences in significance between the two groups are
insignificant. Multi group analysis revealed that the significance of impact of Assets on ROA,
ROE, and ROIC (p < .05), however all other differences in significance between the two
groups are insignificant. These results support previous research that found that the higher the
intangible assets, the higher the ability of companies to return earnings assets. The higher the
intangible assets owned by the company, the higher company's ability to generate profits, and
investors will appreciate the company (seen from the large market capitalization in
companies) that will increase the value of the company.
7.1 Implication
In the last few years, the critical importance of intangible assets for enterprises has intensified.
As today’s corporate asset values shift radically from tangible assets (buildings, inventory,
products) to intangible assets (ideas, patents, Intellectual Property or IP), smart companies are
using their intangible assets to boost their stock price and create shareholder value (Kahn,
2002). Studies undertaken are mostly limited to a country or region-specific studies. In our
opinion, intangible assets are not related to region but to sectors, different sectors have their
own peculiar requirement. This research will determine if investment in intangibles is the
way out towards improvement in profitability, efficiency, capital structure, and dividend
policy, and market value of technology firms as compared to other variables. Our research
complements and extends other empirical work that uses financial markets to value IT and
other intangible assets. The results direct managers to understand and realize the importance
of Intangible Assets and keenly invest in R&D, technology, software, advertising, CRM and
human resources to further augment their performance.
7.2 Limitations
The research shows some limitations which, nonetheless, did not affect the results of the
study. One limitation is concerned with the lack of information about research and
development in regular financial statements or in annual reports or disclosures; further lack
was also in accounting information related to intangible assets. The second limitation was
linked to the sample of the study; the number of observations was decreased because we
excluded many companies that did not provide continuous information over the selected
period of the study.
7.3 Future research
1. The study uses the metric of market capitalization, which is the most suitable measure
because under the analysis it can represent variable intangible assets as a hidden value as a
goal. In future studies, other metrics of intangible assets may be used to compare the results.
2. We recommend that public companies use fair value approaches to evaluate the value of
assets to improve the quality of earnings and the relevance of financial statements.
3. In the filing of financial statements, some forms of intellectual capital which cannot be

Asian Journal of Finance & Accounting
ISSN 1946-052X
2020, Vol. 12, No. 1
ajfa.macrothink.org/ 54
categorized as intangible assets should be disclosed. It is necessary to standardize the
disclosure of intellectual capital as part of intangible assets that are not presented in the
balance sheet, to make companies more comparable, so that analysts and investors can take
benefit from it.
References
Abubakar, Modibbo. (2015). Intangible Assets and Value Relevance of Accounting
Information of Listed High-Tech Firms in Nigeria. Research Journal of Finance and
Accounting, 6, 60-79.
Agrawal, A., & Knoeber, C. R. (1996). Firm performance and mechanisms to control agency
problems between managers and shareholders. Journal of financial and quantitative
analysis,31(3), 377-397. https://doi.org/10.2307/2331397
Bchini, B. (2015). Intellectual capital and value creation in the Tunisian manufacturing
companies. Procedia economics and finance, 23, 783-791.
https://doi.org/10.1016/S2212-5671(15)00443-8
Bubic, J., & Susak, T. (2015, September). Detecting optimal financial and capital structure:
The case of small and medium enterprises (SME) in Republic of Croatia. In 10th
International Scientific Conference on Economic and Social Development, Miami.
Carlson, S. J., & Bathala, C. T. (1997). Ownership differences and firms' income smoothing
behavior. Journal of Business Finance & Accounting, 24(2), 179-196.
https://doi.org/10.1111/1468-5957.00101
Choong, K. K. (2008). Intellectual capital: definitions, categorization and reporting
models. Journal of intellectual capital. https://doi.org/10.1108/14691930810913186
Connolly, R. A., & Hirschey, M. (1984). R & D, Market Structure and Profits: A
Value-Based Approach. The Review of Economics and Statistics, 682-686.
https://doi.org/10.2307/1935995
Dodd, M. D. (2016). Intangible resource management: social capital theory development for
public relations. Journal of Communication Management, Vol. 20(4), 289-311.
https://doi.org/10.1108/JCOM-12-2015-0095
Dženopoljac, V., Janoševic, S., & Bontis, N. (2016). Intellectual capital and financial
performance in the Serbian ICT industry. Journal of Intellectual Capital, 17(2), 373-396.
https://doi.org/10.1108/JIC-07-2015-0068
Erawati, N. M. A., & Sudana, I. P. (2005). Intangible Assets. Company Values, and Financial
Performance. doi: 10.5897/AJBM2017.8429
Fukao, K., Miyagawa, T., Mukai, K., Shinoda, Y., & Tonogi, K. (2009). Intangible
investment in Japan: Measurement and contribution to economic growth. Review of Income
and Wealth, 55(3), 717-736. https://doi.org/10.1111/j.1475-4991.2009.00345.x
Asian Journal of Finance & Accounting
ISSN 1946-052X
2020, Vol. 12, No. 1
ajfa.macrothink.org/ 55
Gamayuni, R. R. (2015). The effect of intangible asset, financial performance and financial
policies on the firm value. International journal of scientific & technology research, 4(1),
202-212.
Gupta, J., Wilson, N., Gregoriou, A., & Healy, J. (2014). The value of operating cash flow in
modelling credit risk for SMEs. Applied Financial Economics, 24(9), 649-660.
https://doi.org/10.1080/09603107.2014.896979
Haji, A. A., & Ghazali, N. A. M. (2018). The role of intangible assets and liabilities in firm
performance: empirical evidence. Journal of Applied Accounting Research.
https://doi.org/10.1108/JAAR-12-2015-0108
Hejazi, R., Ghanbari, M., & Alipour, M. (2016). Intellectual, human and structural capital
effects on firm performance as measured by Tobin's Q. Knowledge and Process Management,
23(4), 259-273. https://doi.org/10.1002/kpm.1529
Henning, S. L., Lewis, B. L., & Shaw, W. H. (2000). Valuation of the components of
purchased goodwill. Journal of accounting research, 38(2), 375-386.
https://doi.org/10.2307/2672938
Holmström, B. (1989). Agency costs and innovation (No. 214). IUI Working Paper.
https://doi.org/10.1016/0167-2681(89)90025-5
Iwu-Egwuonwu, D., & Chibuike, R. (2010). Corporate reputation & firm performance:
Empiricial literature evidence. Ronald Chibuike, Corporate Reputation & Firm Performance:
Empiricial Literature Evidence (August 16, 2010). https://dx.doi.org/10.2139/ssrn.1659595
Jensen, M. C., & Meckling, W. (1976). H. (1976). Theory of the firm: managerial behavior,
agency costs and ownership structure En: Journal of Finance Economics, 3.
https://doi.org/10.1016/0304-405X(76)90026-X
Lantz, J. S., & Sahut, J. M. (2005). R&D investment and the financial performance of
technological firms. International Journal of Business, 10(3), 251.
LEE, H. M., HSU, Y. H., CHEN, T., & WU, Y. C. (2018). FACTORS THAT AFFECT THE
PERCEPTION OF LUXURY BRANDS AFTER M&A. CLEAR International Journal of
Research in Commerce & Management, 9(1).
Lev, B., & Gu, F. (2016). The end of accounting and the path forward for investors and
managers. John Wiley & Sons. https://doi.org/10.1002/9781119270041
Lim, S. C., Macias, A. J., & Moeller, T. (2019). Intangible assets and capital structure.
Available at SSRN 2514551.
Lumapow, L. S., & Tumiwa, R. A. F. (2017). The effect of dividend policy, firm size, and
productivity to the firm value. Research Journal of Finance and Accounting, 8(22), 20-24.
Marr, B., & Schiuma, G. (2001). Measuring and managing intellectual capital and knowledge
assets in new economy organisations. Handbook of performance measurement, Gee, London,
369-411.
Asian Journal of Finance & Accounting
ISSN 1946-052X
2020, Vol. 12, No. 1
ajfa.macrothink.org/ 56
Martins, J., & Alves, S. (2010). The impact of intangible assets on financial and governance
policies: A literature review. Portuguese Journal of Management Studies, 15(1), 87-107.
Mendoza, R., & Rivera, J. P. R. (2017). The effect of credit risk and capital adequacy on the
profitability of rural banks in the Philippines. Annals of the Alexandru Ioan Cuza
University-Economics, 64(1), 83-96. https://doi.org/10.1515/aicue-2017-0006
Mortensen, J., Eustace, C., & Lannoo, K. (1997, March). Intangibles in the European
economy. In CEPS workshop on intangibles in the European economy. Brussels.
Noradiva, H., Parastou, A., & Azlina, A. (2016). The effects of managerial ownership on the
relationship between intellectual capital performance and firm value. International Journal of
Social Science and Humanity, 6(7), 514. https://doi.org/10.7763/IJSSH.2016.V6.702
Nuryaman, N. (2015). The Influence of Intellectual Capital on The Firm’s Value with The
Financial Performance as Intervening Variable. Procedia–Social and Behavioral
Sciences, 211, 292-298. https://doi.org/10.1016/j.sbspro.2015.11.037
OECD. (2011). OECD MRL calculator: spreadsheet for single data set and spreadsheet for
multiple data set, 2 March 2011.
Ozkan, N., Cakan, S., & Kayacan, M. (2017). Intellectual capital and financial performance:
A study of the Turkish Banking Sector. Borsa Istanbul Review, 17(3), 190-198.
https://doi.org/10.1016/j.bir.2016.03.001
Peters, R. H., & Taylor, L. A. (2017). Intangible capital and the investment-q relation.
Journal of Financial Economics, 123(2), 251-272.
https://doi.org/10.1016/j.fineco.2016.03.011
Roos, G., & Roos, J. (1997). Measuring your company's intellectual performance. Long
range planning, 30(3), 413-426. https://doi.org/10.1016/S0024-6301(97)90260-0
Sougiannis, T. (1994). The accounting based valuation of corporate R&D. Accounting review,
44-68.
Sveiby, K. E. (1998). Intellectual capital: Thinking ahead. Australian Cpa, 68, 18-23.
Vodák, J. (2011). The Importance of Intangible Assets for Making the Company’s Value.
Human Resources Management & Ergonomics, 5(2), 104-119.
https://doi.org/10.11118/actaun201866020431
Yahaya, O. A., & Lamidi, Y. (2015). Empirical examination of the financial performance of
Islamic banking in Nigeria: A case study approach. International Journal of Accounting
Research, 42(2437), 1-13. https://doi.org/10.12816/0017347
Zeb, S., & Rashid, A. (2016). Impact of Financial Health and Capital Structure on Firm's
Value, with Moderating Role of Intangible Assets. Global Management Journal for
Academic & Corporate Studies, 6(1), 37.

Asian Journal of Finance & Accounting
ISSN 1946-052X
2020, Vol. 12, No. 1
ajfa.macrothink.org/ 57
Zhang, L., Pei, D., & Vasarhelyi, M. A. (2017). Toward a new business reporting model.
Journal of Emerging Technologies in Accounting, 14(2), 1-15.
https://doi.org/10.2308/jeta-10570
Zhang, N. (2017). Relationship between Intangible Assets and Financial Performance of
Listed Telecommunication Firms in China, Base on Empirical Analysis. African Journal of
Business Management, 11(24), 751-757.
Copyright Disclaimer
Copyright for this article is retained by the author(s), with first publication right granted to
the journal.
This is open-access article distributed under the terms and conditions of the Creative
Commons Attribution license (http://creativecommons.org/license/by/4.0).