the effect of injection angle on the interaction between
TRANSCRIPT

.*. L-.
THE EFFECT OF INJECTION ANGLE ON THE INTERACTION BETWEEN SONIC SECONDARY JETS A N D A SUPERSONIC FREE STREAM
by Charles R. McClinton
Langley Research Center Hampton, Va. 23365
TECH LIBRARY KAFB, NM
_ _ 1. Report No. 2. Government Accession No.
NASA TN D-6669 I 4. Title and Subtitle THE EFFECT OF INJECTION ANGLE ON THE
7. Author(s)
Charles R. McClinton
9. Performing Organization Name and Address
2. Sponsoring Agency Name and Address
National Aeronautics and Space Administration Washington, D.C. 20546
I111111#IlullllulIllllllll1Ill11111 3. Recipient's Catalog No.
5. Report Date February 1972
~
8. Performing Organization Report No.
L-8125 10. Work Unit No.
764-75-01-06
13. Type of Report and Period Covered
Technical Note 14. Sponsoring Agency Code
An experimental investigation, as par t of a r e sea rch program on the development of technology for the design of supersonic combustion ramjets , has been conducted to determine the effect of injection angle on the jet penetration, mixing rate, and a i r s t r eam total-pressure recovery downstream of five laterally spaced sonic hydrogen jets flush mounted on a flat plate. The hydrogen was injected at a rat io of jet dynamic p res su re to f ree-s t ream dynamic p r e s s u r e of unity into a Mach 4.04 free s t r e a m with a turbulent boundary layer 3.40 injector diameters thick at the injection station. Fuel was injected at angles measured from the plate surface of 30°, 45O, 60°, and 90°, and the flow field was surveyed at 30, 60, and 120 injector diameters downstream to obtain hydrogen concentration, pitot p re s su re , and static pressure. Results of this investigation indicated that at the lower injection angles less f r ee - s t r eam momentum loss was required to tu rn and accelerate the injected gas downstream and, thereby, less flow disturbance and total-pressure loss were produced. In addition, the lower injection angles resulted in improved fuel distribution and f a s t e r mixing of the injected gas with the free s t ream. A correlating parameter , developed f rom considerations of the effective-momentumf l u differences between the injected gas and the free-s t ream air, predicted g rea t e r penetration and faster mixing for the lower injection angles.
7. Key-Words (Suggested by Author(s1) 1 18. Distribution Statement
Injection angleSupersonic combustor Unclassified - Unlimited Wall injectionFuel penetrationTurbulent mixing
19. Security Classif. (of this report) 20. Security Classif. (of this page) 21. NO. of Pages 22. Price'
Unclassified Unclassified 33 $3.00
For sale by the National Technical Information Service, Springfield, Virginia 22151

THE EFFECT OF INJECTION ANGLE ON THE INTERACTION BETWEEN
SONIC SECONDARY JETS AND A SUPERSONIC FREE STREAM*
By Charles R. McClinton Langley Research Center
SUMMARY
An experimental investigation, as par t of a research program on the development of technology for the design of supersonic combustion ramjets , has been conducted to determine the effect of injection angle on the jet penetration, mixing rate, and a i r s t ream total-pressure recovery downstream of five laterally spaced sonic hydrogen jets flush mounted on a flat plate. The hydrogen was injected at a ratio of jet dynamic pressure to f ree-s t ream dynamic pressure of unity into a Mach 4.04 free s t ream with a turbulent boundary layer 3.40 injector diameters thick a t the injection station. Fuel was injected at angles measured from the plate surface of 30°, 4 5 O , 60°, and 90°, and the flow field was surveyed a t 30, 60, and 120 injector diameters downstream to obtain hydrogen concentration, pitot p ressure , and static pressure. Results of this investigation indicated that at the lower injection angles less free-s t ream momentum loss was required to turn and accelerate the injected gas downstream and, thereby, l e s s flow disturbance and total-pressure loss were produced. In addition, the lower injection angles resulted in increased penetration at the downstream stations surveyed and faster mixing of the injected gas with the f ree stream. A correlating parameter , developed from considerations of the effective-momentum-flux differences between the injected gas and the free-s t ream air, predicted greater penetration and faster mixing for the lower injection angles.
INTRODUCTION
The development of concepts for hypersonic air-breathing propulsion systems has created a need for the refinement and optimization of all aspects of the design of the supersonic combustion ramjet (scramjet) engine. The accurate design of the supersonic combustion chamber depends on knowledge of fueldair mixing characterist ics. The pr i mary objectives of the fuel-injector arrangement are to obtain a reasonably uniform
* The information presented herein was offered as a thesis in partial fulfillment of the requirements for the degree of Master of Science from the School of Engineering and Applied Science, George Washington University, Washington, D.C., February 1971.
L

III1111m111 III
combustible-fuel distribution ac ross the combustion chamber within a shor t combustor length and to produce a minimal pressure loss i n the combustor a i rs t ream. In an optimized combustor design it is probable that fuel will be injected from points i n the s t r eam (i.e., f rom struts) as well as f rom the wall; however, only injection from the wall is considered in the present study.
Historically, interest i n the mixing o r interaction of a secondary jet with a supersonic mainstream has developed in several fields. A survey of the l i terature indicates that most scramjet-oriented studies have been performed using a single, underexpanded jet issuing normal to the air flow; the analysis was aimed primarily at jet penetration and at the shock-wave s t ructure in proximity to the injector (refs. 1 to 5). This type of analysis has proved useful i n the preliminary design of ramjet fuel-injection systems, but system optimization also requires a knowledge of the downstream mixing region. Some work has been presented in the l i terature which considers both the initial interaction effects and the downstream aspects of the mixing problem. Much of the downstream analys i s resul ts from schlieren data (refs. 6 to 10) which are limited to penetration correlations for air flow with relatively thin boundary layers. Other analyses are based on resul ts from surveys of pitot p ressure and injected-gas concentration i n the downstream mixing region. This survey procedure produces fuel-distribution contours which are used in determining mixing rates, in addition to defining penetration. Several studies (refs. 11 to 18) have evaluated the effect of different flow (jet and free-s t ream) variables on the jet penetration and mixing rate. However, studies on the effect of injection angle, references 6, 7 , and 15, have produced only limited results. The data f rom references 6 and 7 pertain to measurements in the immediate vicinity of the jet. These measurements are not representative of the ramjet problem of fuel distribution and mixing in the downstream region where the fuel-air mixture approaches a stoichiometric ratio. On the other hand, the resul ts from reference 15, although measured in the downstream region, were obtained in a confined cylindrical duct; consequently the interpretation of the resu l t s is uncertain.
The objective of the present research is to study in some detail the effect of secondary- jet injection angle in an unreacting mixing situation. In the present investigation, values of the following parameters were used which are believed to be representative of scramjet design:
Value
Ratio of jet dynamic pressure to f ree-s t ream dynamic pressure . . . . . . . . . . . 1.0 Ratio of boundary-layer thickness to jet diameter . . . . . . . . . . . . . . . . . . . 3.0 Ratio of jet molecular weight to f ree-s t ream molecular weight . . . . . . . . . . 0.0691 Jet lateral center-to-center spacing . . . . . . . . . . . . . . . . . . . . . . . . . . 6.25 Jet Mach number . . . . . . . . . . . . . . . . . . . . . . . . . . . . . . . . . . . . 1.0
2
The investigation was performed i n a Mach 4.04 a i rs t ream with secondary injection of hydrogen from a flat-plate model. The tunnel was operated at stagnation pressure of 1.38 MN/m2, Reynolds number of 6.19 X 10⁷ per meter, and stagnation temperature of approximately 300 K.
b
A
D
hmid
htop
M
ma
SYMBOLS
profile shape index (eq. (1))
jet diameter, cm
vertical height to center (middle) of jet Mach disk, cm (fig. 10)
vertical height to upper (top) edge of jet Mach disk, cm (fig. 10)
Mach number
air flow ra te per unit a r ea , pxux(l - a),kg/m2-s
hydrogen flow rate per unit a rea , pXuxa, kg/m2-s
jet penetration measured by highest point on contour v = 0.005, cm (fig. 10)
pressure, N/m2
pressure recovery, ratio of the mass average total pressure in the mixing region to the mass average total pressure in the undisturbed-airstream tube that feeds the mixing region (fig. 8)
dynamic pressure , N/m2
ratio of jet dynamic pressure to f ree-s t ream dynamic pressure
effective-dynamic-pressure ratio defined in equation ( 6 )
Reynolds number
Reynolds number based on distance from plate leading edge and conditions at edge of boundary layer
3
U velocity, m/s
X axial coordinate, measured downstream from center of middle jet (see fig. l), cm
Y la teral coordinate, measured across plate f rom middle jet (see fig. l),cm
z vertical coordinate, measured up from middle jet (see fig. l),cm
a! hydrogen mass fraction
6 boundary-layer thickness, cm
6* boundary-layer displacement thickness, cm
8 injection angle, measured from horizontal, deg
OB boundary-layer momentum thickness (fig. 4),cm
V hydrogen volume fraction
--. P density, kg/m3
Subscripts:
a air
H2 hydrogen
j secondary -j e t condition
max maximum value in mixing region
0 point on vertical survey where v = 0
ref point on vertical survey of maximum hydrogen concentration
t stagnation condition
U undisturbed plate flow
4
L

X condition at survey point
%ax condition at or location of maximum hydrogen mass fraction
6 condition at boundary-layer edge
00 free-s t r eam condition
A bar over a symbol denotes a m a s s averaged value.
APPARATUS AND PROCEDURES
Wind Tunnel and Model
The investigation was conducted using a flat-plate model, shown in figure 1, that spanned a 0.229-meter by 0.229-meter continuous-flow Mach 4.05 tunnel. The plate was 22.87 cm wide and 76.2 cm long; the plate had a replaceable leading edge cut at loo on the bottom surface with the tip sharpened to 2'; and the plate was bored and counterbored to form a jet settling chamber and accept a replaceable secondary-jet nozzle block (see settling-chamber detail).
nozzle b l o c k ,-47 s t a t i c o r i f i c e s
22.87
1 : , I 0.97
alp r e s s u r e p r o b e
L e a d i n g - e d g e d e t a i l Hydrogen j e t s e t t l i n g - c h a m b e r d e t a i l
Figure 1.- Sketch of model. ( A l l dimensions in cm.)
5

I I I, . .. ....
Individual nozzle blocks were fabricated for each injection angle with five 0.102-cmexit-diameter injector nozzles, as il lustrated i n figure 2, laterally spaced at 0.635 cm.
Each of the injector nozzles had a constant area section that was 2-1nozzle exit diameters2
long. The injector nozzles had measured discharge coefficients of 0.76, 0.83, 0.77, and 0.81 for the 30°, 4 5 O , 60°, and 90° injectors, respectively.
0.102 diam, 3.12 rad.
e = 900 8 = 30' k3.12 rad.
0.102 diam,
0.792 rad.
0.792 r a d .
e = 600 p = 4 5 O
Figure 2.- Details of secondary-jet nozzle. (All dimensions in cm.)
Instrumentation
Instrumentation was provided to measure hydrogen and air stagnation pressures and temperatures, plate-surface static pressures , and in-s t ream surveys of pitot and s ta t ic pressures and hydrogen concentration. In addition, the hydrogen mass flow rate was measured using a sharp-edge orifice meter.
Plate s ta t ic-pressure orifices of 0.051-cm diameter were located on the longitudinal center line from 30 injector diameters ahead of the injector station to 150 injector diameters downstream. In addition, several lateral rows of pressure orifices were located a t and downstream of the injection station (see fig. 1). Although data were taken at each orifice, only resul ts on the plate center line and between the jets are presented herein.
The in-stream measurements were made using the probe rake illustrated in figu r e 3. Spacing between the pitot probe and the static probe was large (3.66 cm) to assure that the static probe did not interfere with pitot-probe readings.
Gas samples were taken from the mixing region by the pitot probe and were analyzed with an on-line process gas chromatograph having a cycle time of 60 seconds. The chromatograph measured only the hydrogen volume fraction and was connected by a series of electrically actuated valves to both the pilot probe and the hydrogen-settling-chamber probe.
6

I3.66
J. 0.038 0.076 0. io2
Figure 3.- Sketch of pitot- and static-probe rake. (All dimensions in cm.)
Test Conditions and Procedures
The tunnel was operated at a free-s t ream Mach number of 4.05, at a stagnation pressure of 1.38 MN/m2, and at a stagnation temperature of approximately 300 K. Reynolds number was 6.19 x lo7 per meter. The jet stagnation pressure w a s 0.28 MN/m2, which corresponds to q.J Iqm of unity. Generally, the jet stagnation temperature was 5 K to 10 K lower than the free-s t ream stagnation temperature. The hydrogen-air mixing regions were surveyed to obtain pitot pressure, static pressure , and volumetric hydrogen concentration at locations 30, 60, and 120 injector diameters downstream of the injector station. At each station one vertical survey and three horizontal surveys were made. The vertical survey was located directly downstream from the middle-jet center line and extended from the plate surface up to the point of zero hydrogen concentration. The ver tical position of the horizontal surveys corresponded to the following three points on the vertical survey: the point of maximum concentration c+ef , the point halfway between0 plate and point of maximum concentration, and the point of half-maximum concentration above aref. All surveys completely spanned the five-jet mixing region.
EXPERIMENTAL RESULTS AND DISCUSSION
Undisturbed. Plate Flow
The boundary-layer velocity distribution measured at the jet station with no injection is given in figure 4. The data were reduced assuming a modified Crocco-type temperature velocity profile (ref. 19). The boundary layer was turbulent with a profile
7
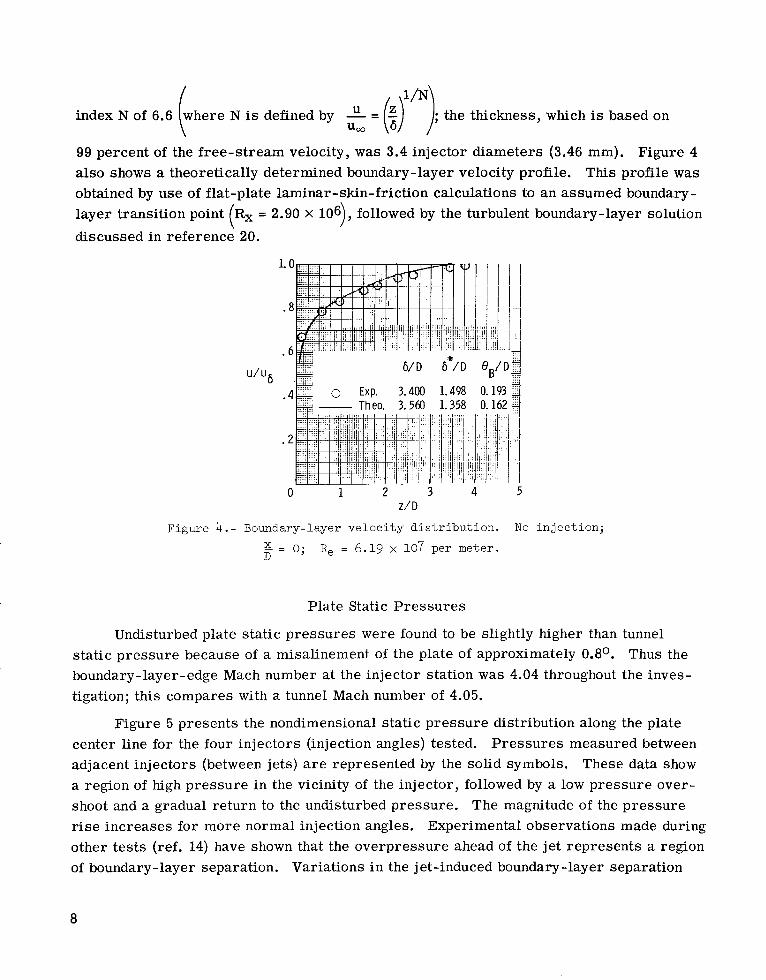
- - index N of 6.6 iwhere N is defined by u,
- tf”);the thickness, which is based on-
99 percent of the free-s t ream velocity, was 3.4 injector diameters (3.46 mm). Figure 4 also shows a theoretically determined boundary-layer velocity profile. This profile was obtained by use of flat-plate laminar-skin-friction calculations to an assumed boundary-layer transition point (Rx = 2.90 X ,followed by the turbulent boundary-layer solution
discussed in reference 20.
1.0
. 8
.6
U/Ub
.4
. 2
0 1 2 3 4 5 z/ D
Figure 4.- Boundary-layer velocity distribution. No injection;
D = 0; Re = 6.19x 10⁷ per meter.
Plate Static P res su res
Undisturbed plate static pressures were found to be slightly higher than tunnel s ta t ic pressure because of a misalinement of the plate of approximately 0.8O. Thus the boundary-layer-edge Mach number at the injector station was 4.04 throughout the investigation; this compares with a tunnel Mach number of 4.05.
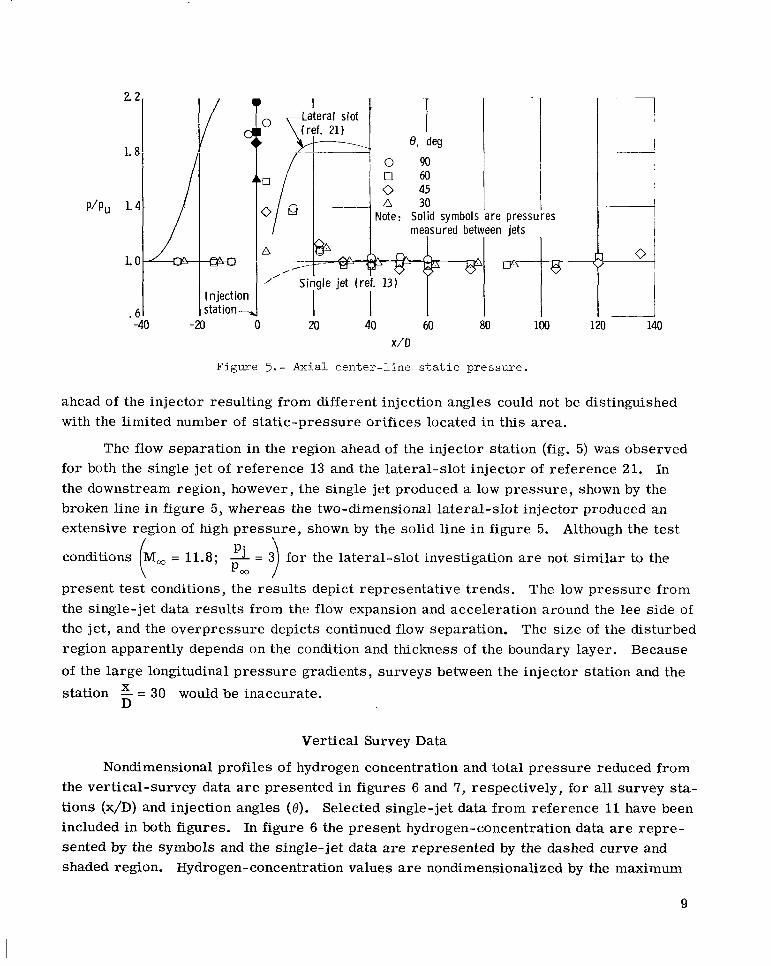
Figure 5 presents the nondimensional static pressure distribution along the plate center line for the four injectors (injection angles) tested. P res su res measured between adjacent injectors (between jets) a r e represented by the solid symbols. These data show a region of high pressure in the vicinity of the injector, followed by a low pressure overshoot and a gradual re turn to the undisturbed pressure. The magnitude of the pressure rise increases for more normal injection angles. Experimental observations made during other tests (ref. 14)have shown that the overpressure ahead of the jet represents a region of boundary-layer separation. Variations in the j et-induced boundary-layer separation
a
-- I22
1. 8
P i p u 1.4
1. 0
. 6 -8
C
l%cl
In jec t ion station,
Vote: Solid symbols o r e p r e s s L . 2 ~ measured between iets
n I-
/
1’- SiAgle jet (r
I I I IMI 40 60 80 100 1 x/ D
1 !
i0 I J140
Figure 5. - Axial center-line s t a t i c pressure.
ahead of the injector resulting from different injection angles could not be distinguished with the limited number of static-pressure orifices located in this area.
The flow separation in the region ahead of the injector station (fig. 5) was observed for both the single jet of reference 13 and the lateral-slot injector of reference 21. In the downstream region, however, the single jet produced a low pressure , shown by the broken line in figure 5, whereas the two-dimensional lateral-slot injector produced an extensive region of high pressure , shown by the solid line in figure 5. Although the test
\
for the lateral-slot investigation are not s imilar to the
present tes t conditions, the resul ts depict representative trends. The low pressure from the single-jet data resul ts from the flow expansion and acceleration around the lee side of the jet, and the overpressure depicts continued flow separation. The size of the disturbed region apparently depends on the condition and thickness of the boundary layer. Because of the large longitudinal pressure gradients, surveys between the injector station and the station = 30 would be inaccurate.
D
Vertical Survey Data
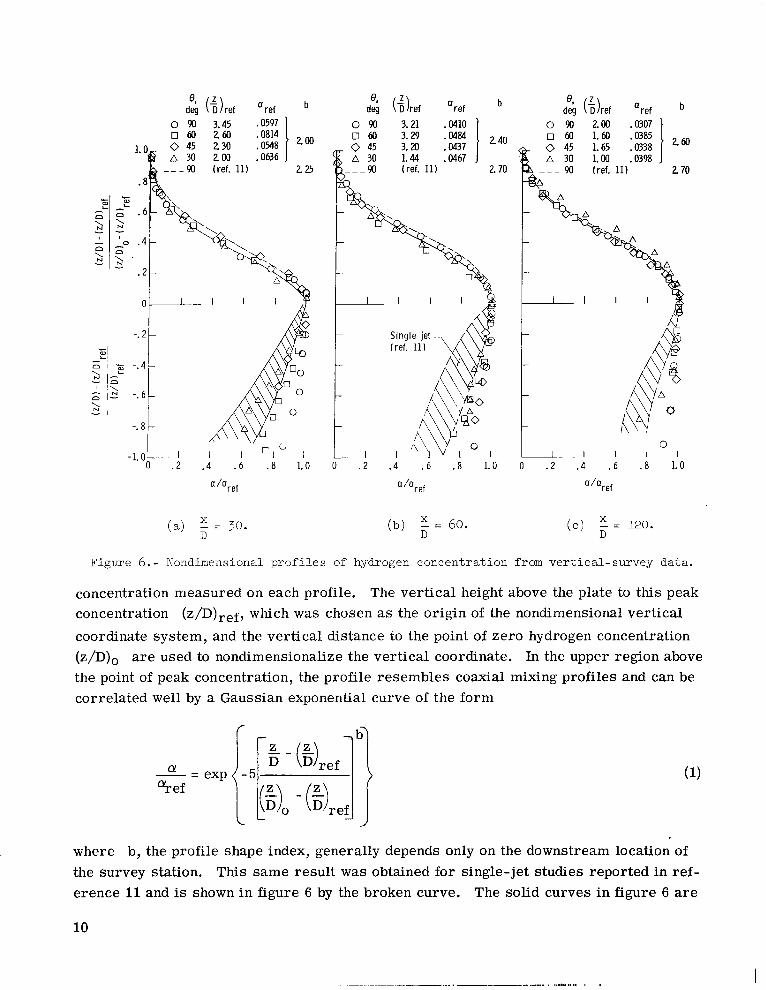
Nondimensional profiles of hydrogen concentration and total p ressure reduced from the vertical-survey data are presented in figures 6 and 7, respectively, for all survey stations (x/D) and injection angles (0). Selected single-jet data from reference l l have been included in both figures. In figure 6 the present hydrogen-concentration data are represented by the symbols and the single-jet data are represented by the dashed curve and shaded region. Hydrogen-concentration values are nondimensionalized by the maximum
9
- - -
0,deg ($)ref 'ref b
0 90 3.21 .M10 1 060
. 0 45 3.20 .M37 A 30 1.44 .M67 1
270
I
b
0 90 200 .0307 60 1.60 .0385
. 0 45 1.65 .0338 260 A 30 1.00 .0398
h 90 (ref. 11) 2 70
0 I I I l l
. 2 . 4 . 6 .8 1.0 0 . 2 . 4 . 6 . 8 1.0
'"ref '"ref "/'ref
(a) X = 30. (b) -X
D = 60. ( e ) 5 = 120.
D D
Figure 6.-Nondimensional profiles of hydrogen Concentration from vertical-survey data.
concentration measured on each profile. The vertical height above the plate to this peak concentration (z/D)ref, which was chosen as the origin of the nondimensional vertical
coordinate system, and the vertical distance to the point of zero hydrogen concentration ( Z / D ) ~ are used to nondimensionalize the vertical coordinate. In the upper region above the point of peak concentration, the profile resembles coaxial mixing profiles and can be correlated well by a Gaussian exponential curve of the form
where b, the profile shape index, generally depends only on the downstream location of the survey station. This same resul t was obtained for single-jet studies reported in reference 11and is shown i n figure 6 by the broken curve. The solid curves in figure 6 are
10
--
4 a 0
h na v
2;na v
, -O4t- 1 .02 r o ? , , , 1 1 I I I I l l I -
P 4
0 h n .20> v:: >a
v .10:i.06 0 0
n 1
3 x/D
0 30 0 60 0 120 n o
- 0 4 t o1 1 1 1 I 1 I 1 1 I l l I I .02 .04 .06 .10 .20 .40 .60 1.0
pt'pt_
(b) 9 = 600.
Figure 7.-Nondimensional profiles of total pressure from vertical-survey data.
11
- - 111 I I I I I I l l 1.111111111111 I, I I. I I I, I... III-I..III .. .. ....
0 \
K
x /D
0 30 0 6 0 0 120 n o
p t / p t m
( d ) 9 = 30’.
,
(z/D),
6.68 7.12 7.44
( 6 / D = 3.40;
Sj/4, = 0 )
Figure 7 . - Concluded.
12

data correlations using equation (l),with b as listed on each figure. The values of b for the single-jet data are slightly higher than those for the data of the present investigation. No consistent deviation from the correlation line can be, determined as a function of injection angle.
In the lower region of figure 6 between the plate surface and (:)ref, the injection
angle affects the uniformity of the concentration profiles at a n x/D of 60 and less, with the more uniform profiles occurring for the higher injection angles. Downstream of the
Xstation -D
= 60 the profile shape is not affected by the injection angle, with the exception
of the resul ts for 6 = 30° near the surface (fig. 6(c)). However, these resul ts (two data points) are considered to be in e r r o r because of the trends shown by the remainder of the profile. The profile shape i n the lower region appears to be a measure of adjacent-jet interaction. For no lateral interference, the single-jet profile, represented by the shaded region, continues to decrease towards the plate; whereas, for the present jet spacing, the adjacent-jet mixing regions interact by the last station. Also, the higher injection angles produce interference between adjacent-jet mixing regions at stations nearer to the injectors.
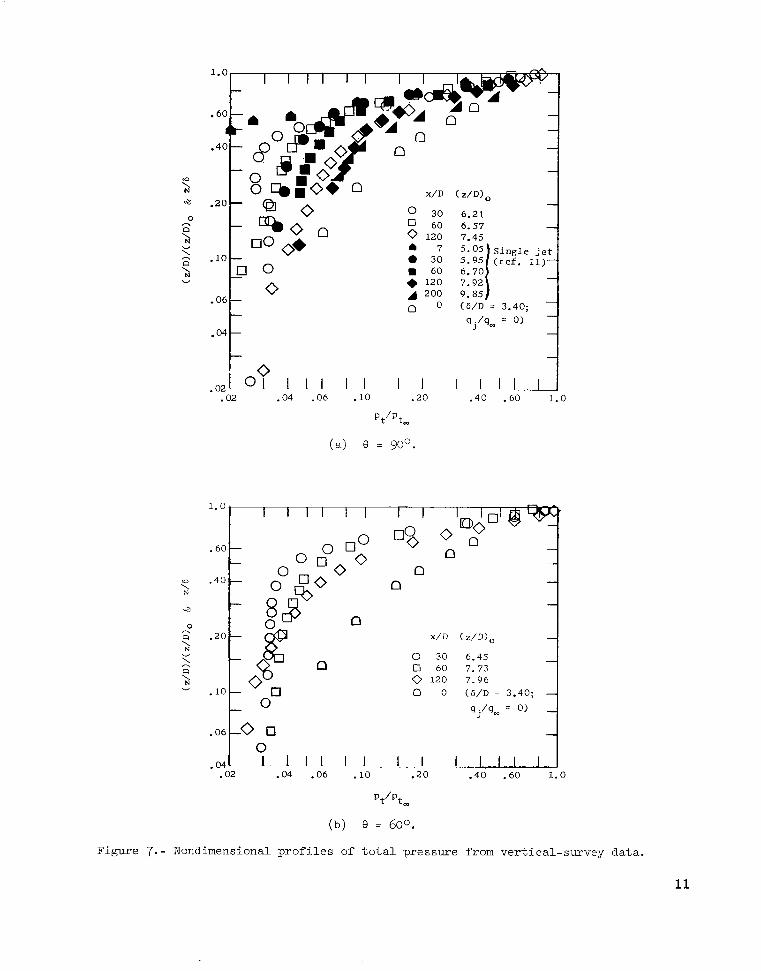
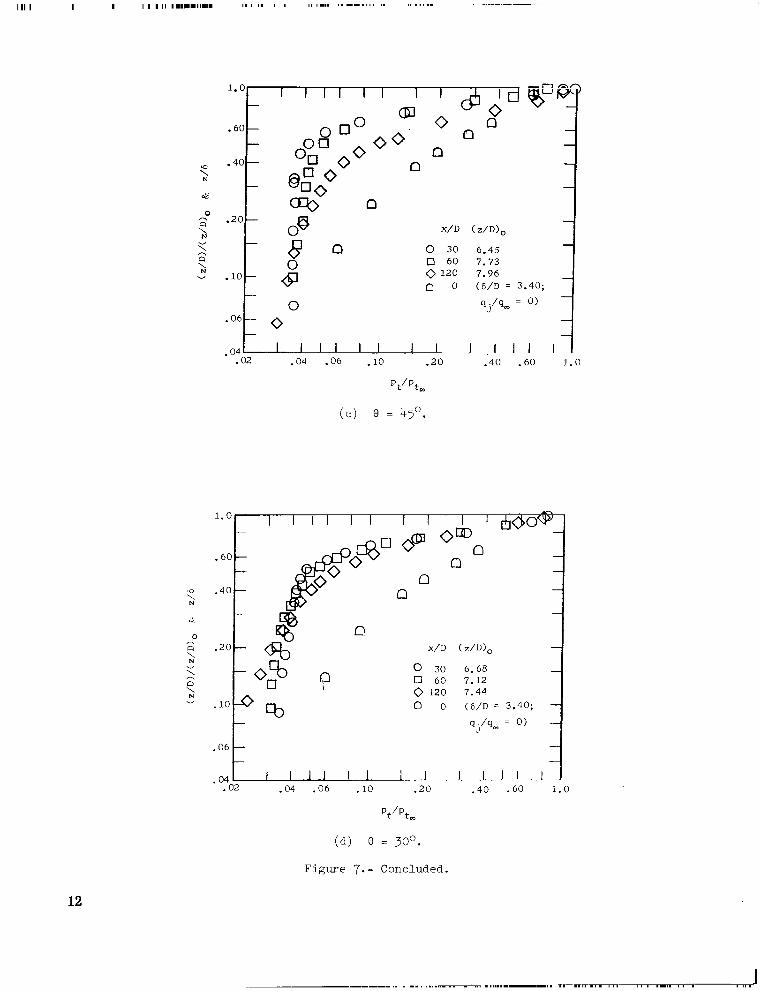
Figure '7 compares the nondimensional total-pressure profiles from the vertical surveys with the undisturbed boundary-layer profile at the injector station. The vertical coordinate is nondimensionalized by the corresponding values of ( Z / D ) ~ o r the boundary-layer thickness 6. Single-jet total-pressure profiles f rom reference 11 are represented in figure "(a) by the solid symbols. These data are for normal injection of hydrogen at qj/q, of unity.
Both the single-jet and the multiple-jet data show the largest p ressure loss at the survey station nearest to the injector. As the mixing proceeds downstream, the total-pressure profile shape approaches that of the undisturbed boundary layer as a resul t of higher total-pressure air entering the mixing region. The normal multiple jet produces the most severe pressure loss near the injector station. However, the shape of the pres su re profile approaches that of the undisturbed profile more rapidly as the flow proceeds downstream than do the corresponding shapes of the profiles for lower injection angles. The single jet has relatively low blockage and produces about the same pressure profile at an x/D of 30 (fig. "(a)) as the pressure profile measured for the multiple-jet case of 6 = 30° (fig. 7(d)).
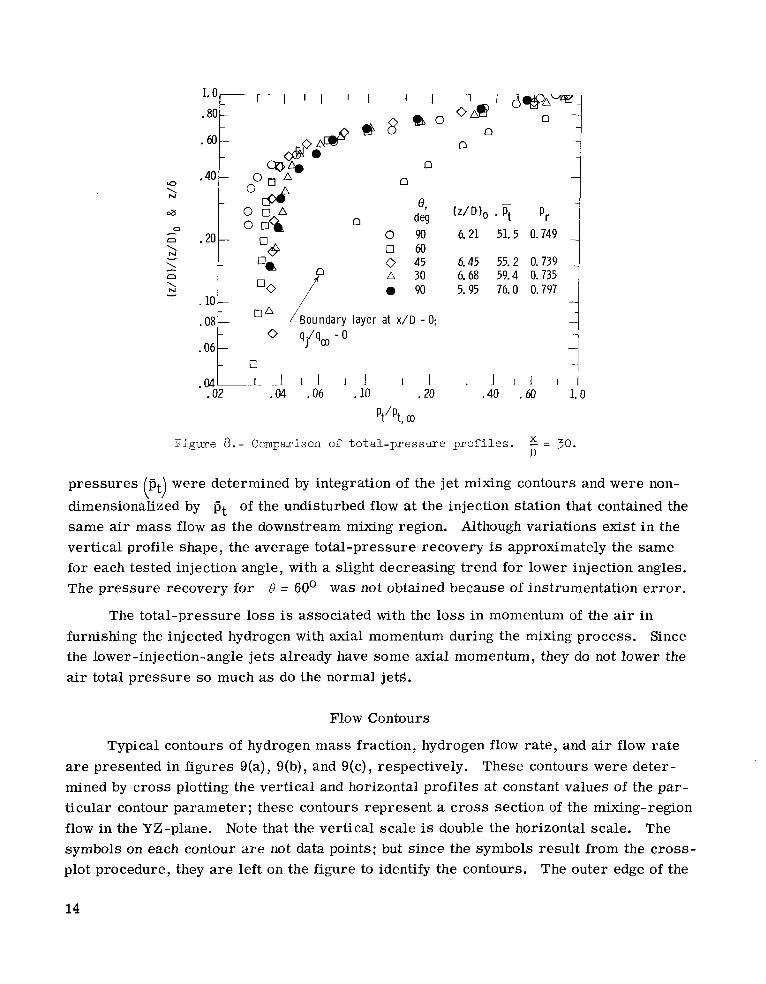
In order to i l lustrate the effect of injection angle 8 on the pressure recovery pr, a comparison of total-pressure profiles is presented in figure 8. The profiles presented are for the present multiple-jet data at 5 = 30, the single-jet data at 5 = 30 (from
D D fig. ?(a)), and the undisturbed boundary-layer data at 5 = 0. The mass averaged totalD
13
L
b o
n n 1
% 0 6 0 6.21 51.5 0.749 -1
I
0 45 6.45 55.2 0.739 a 30 6.68 59.4 0.135
OO IP 0 90 5.95 16.0 0.791 . l 0 L /
1 1 1 1 I I.40 .60 1. 0
Figure 8.-Comparison of total-pressure profiles. 5 = 30.D
pressures pt were determined by integration of the jet mixing contours and were non0 dimensionalized by Pt of the undisturbed flow at the injection station that contained the same air mass flow as the downstream mixing region. Although variations exist i n the vertical profile shape, the average total-pressure recovery is approximately the same for each tested injection angle, with a slight decreasing trend for lower injection angles. The pressure recovery for 8 = 60’ was not obtained because of instrumentation e r ro r .
The total-pressure loss is associated with the loss i n momentum of the air in furnishing the injected hydrogen with axial momentum during the mixing process. Since the lower-injection-angle je ts already have some axial momentum, they do not lower the air total p ressure so much as do the normal jets.
Flow Contours
Typical contours of hydrogen mass fraction, hydrogen flow rate, and air flow rate are presented in figures 9(a), 9(b), and 9(c), respectively. These contours were determined by cross plotting the vertical and horizontal profiles a t constant values of the particular contour parameter ; these contours represent a c ross section of the mixing-region flow in the YZ-plane. Note that the vertical scale is double the horizontal scale. The symbols on each contour are not data points; but since the symbols resul t from the cross-plot procedure, they are left on the figure to identify the contours. The outer edge of the
14

Y/ D [injector locations
( a ) Hydrogen mass f r ac t ion .
Z/ D
( b ) Hydrogen f l o w r a t e .
z/ D
( c ) A i r f l o w r a t e .
Figure 9.- Typical flow contours. E = 30; 8 = 30°.D
15

mixing region is defined by the contour for hydrogen volume fraction ( V ) of 0.005. The contours produced by the three central jets a r e quite s imi la r i n appearance, but some la teral spreading of the concentration peaks has resulted because of unrestrained la teral mixing of the end jets. The center-jet mixing region has a relatively small amount of spreading and provides a good simulation of the mixing region downstream of a continuous row of laterally spaced fuel injectors. For reference, contours of the central-jet mixing region for all cases are presented in figures 17 to 19 of the appendix. The important resul ts obtained from the contours are hydrogen penetration and mixing ra te , which a r e discussed in the following paragraphs.
Penetration
A sketch of the flow field resulting from the interaction of a secondary wall jet with a supersonic f ree s t ream is presented in figure 10. This sketch i l lustrates several methods used in the l i terature to define the jet penetration P. The most widely used measure is associated with the initial penetration, for example, htop and hmid, Which correspond to the top and center of the jet Mach disk. Values of these jet details a r e easily obtained from schlieren photographs and have primary applications to nonfuel injection and mixing problems. For fuel-injection studies the downstream fuel distribution, illustrated by the mixing-region cross section, is more important than the initial penetration. In this report the fuel distribution will be measured by two nondimensionalized parameters, as illustrated in figure 10. The measure P/D, referred to simply as the penetration, is the vertical distance from the plate to the edge of the mixing region (v = 0.005); the other measure (z/D) amax’ referred to as the maximum-concentration
trajectory, is the distance from the plate to the point of maximum concentration. Values of P/D and ( z / D ) ~ ~ =were determined from the flow contours in the appendix
(figs. 17 and 18) and a r e not necessarily on the vertical survey.
F igure 10.- Sketch of flow field.
16
1
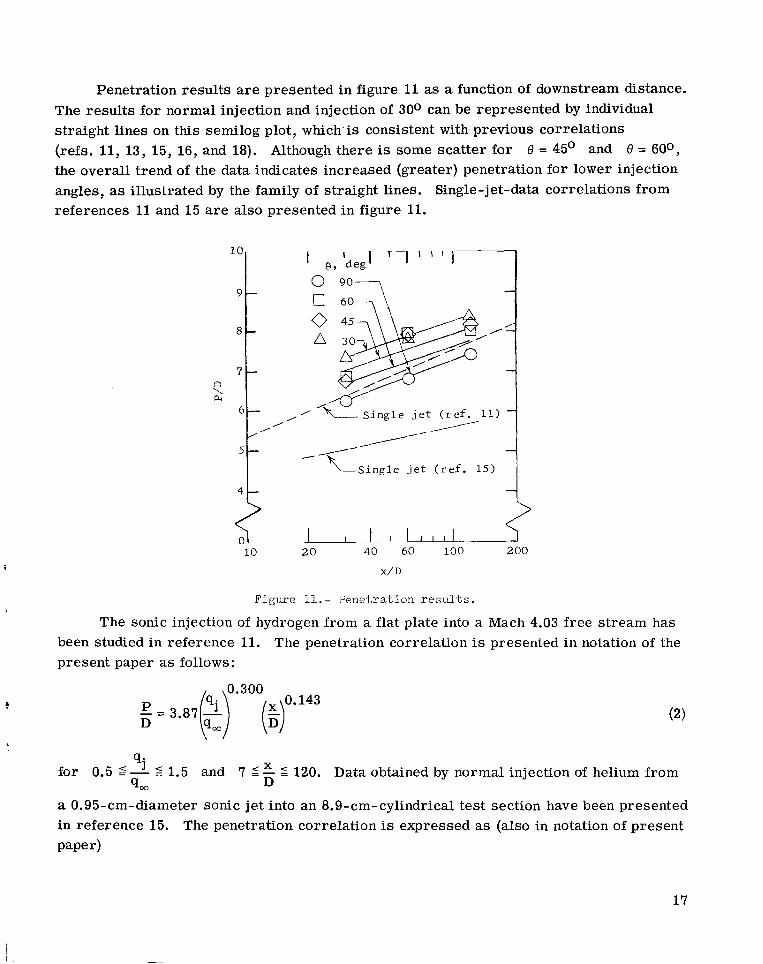
Penetration resul ts are presented in figure 11as a function of downstream distance. The resul ts fo r normal injection and injection of 300 can be represented by individual straight lines on this semilog plot, which'is consistent with previous correlations (refs. 11, 13, 15, 16, and 18). Although there is some scatter for 8 = 45' and 8 = 600, the overall trend of the data indicates increased (greater) penetration for lower injection angles, as illustrated by the family of straight lines. Single-jet-data correlations from references 11 and 15 a r e also presented in figure 11.
41- -I
Figure 11.-Penetration results.
The sonic injection of hydrogen from a flat plate into a Mach 4.03 free s t ream has been studied in reference 11. The penetration correlation is presented in notation of the present paper as follows:
0.300 - = 3 . 8 ' 7 k ) (E)0.143P D
'j Xfor 0.5 I-5 1.5 and 7 5 -D
5 120. Data obtained by normal injection of helium from %o
a 0.95-cm-diameter sonic je t into an 8.9-cm-cylindrical tes t section have been presented in reference 15. The penetration correlation is expressed as (also in notation of present paper)
17
0.0866
D
The relative size of the hydrogen jet and the test section for tests of reference 15 were such that the jet may have been restr ic ted i n its lateral spreading by the curvature of the wall. However, the variation i n the penetration correlations of equation (2) and equation (3) is believed to resul t primarily from differences in the ratio of boundary-layer thickness to jet diameter. Unreported NASA data indicate that for sonic injection of hydrogen from a single jet the ratio of boundary-layer thickness to jet diameter has a significant effect on the penetration, with greater penetration resulting from thicker boundary layers. The resul ts represented by equation (2) (ref. 11) were obtained with the value of 6/D slightly less than for the present case whereas the resul ts represented by equation (3) (ref. 15) appear to have a very small value of 6/D. Although the combustor boundary-layer thickness was not given in reference 15, the shor t combustor length and relatively large jet diameter suggest the existence of a small value of 6/D.
The maximum-concentration trajectories for the present tes t s are presented in figu re 12 and show greater values of (z/D) amax for lower injection angles. The trajectory
(z/D)Lymax generally increases in the region 30 S -
X 5 60 and then decreases toD
5 = 120. References 11 and 15 also present single-jet resul ts of the maximum-D concentration trajectory (z/D) amax' The flat-plate resul ts (ref. 11) are represented by
the dashed curve in figure 12 and the cylindrical-test-section resu l t s (ref. 15) are repre
sented by the solid curve which is of the form
(4)
The flat-plate single-jet resul ts have an increasing maximum-concentration trajectory with downstream distance; the cylindrical-test-section resul ts have a decreasing maximum-concentration trajectory. The shape of the concentration profiles presented in reference 15 indicates that the curvature of the test-section walls res t r ic ted the lateral diffusion of the hydrogen, thus confining turbulent diffusion to the vertical direction which resulted in the maximum-concentration trajectory approaching the wall. The single-jet flat-plate case, on the other hand, imposed no lateral restrictions on the mixing, and the maximum-concentration trajectory increased with downstream distance. For the multiple-jet data of the present tes t the fuel initially mixed laterally, which increased the maximum-concentration trajectory. Downstream of the station 5 = 60 the adjacent-jet interaction
D
18

restricted the lateral spreading and the fuel mixed upward; as a result , the maximum-concentration trajectory turned and approached the wall.
4 I I I I I I I I I I 0 , deg
3 -- 0 90 F l a t p l a t e ; @ = 90' ( r e f . 11) x 6 0 d E
n 045 ~r /
s U
2 -- Q A 3 0
P A/--- n
\ v N 0 //-- 0
f 1 .- - = - O -
C y l i n d e r ; @ = 90° ( r e f . 15)
0 I I 1 I I - I I I I I
Two studies of injection-angle effect on jet penetration (refs. 6 and 7) have shown that the initial jet penetration (i.e., "top/" o r hmid/D) is proportional to the injection
angle 8. In reference 15, which contains a study of the downstream fuel (helium) distribution in a circular, confined duct, the various injection-angle resul ts were correlated by
The authors thereby contend that the penetration is governed by the normal component of the jet dynamic pressure q. s in 8. Although this correlation would be expected to apply for the initial jet penetration htop D ,the other jet component would be expected to enter7 1 )into the correlation of the downstream fuel distribution. Since the secondary jet is turned downstream because of the difference between its downstream component of total momentum (or dynamic pressure qj cos 8) and the a i r s t ream momentum (or dynamic pressure q,), the normal component re ta ins more of its initial momentum i f the absolute value of q, - q.J cos 6 is small. Therefore, the correlation of equation (5) is extended by intro
ducing the effective-dynamic-pressure ratio
19

For normal injection the effective-dynamic-pressure ratio P j19,) eff reduces to the
dynamic-pressure ratio q - q,; but as the injection angle is reduced f rom 90°, theJ /
effective-dynamic-pressure ratio increases for a constant q. q,. The maximum valueJ /
of this parameter is obtained by variation of q,, q., and 8 such thatJ
9.J COS e - q,
where 8 is not zero. Within the range of the present tests, (qj/q,)eff is maximum
for 0 = 30'.
The effective-dynamic-pressure ratio w a s used to correlate the penetration and the maximum-concentration-trajectory results. Figure 13 presents data correlations of the multiple-jet penetration' data from figure 11 in t e rms of the effective-dynamic-pressure ratio. The data have been correlated by the equation
0.09 -P = 3 . 3 8 5 p ) (E)0.18
D qm eff
which is of the same form as the correlations presented by equation (2) and equation (3). The variation with downstream distance is about the same as was shown for the single-jet flat plate (eq. (2)). Equation (8) implies that the maximum penetration occurs when the downstream component of jet dynamic pressure is equal to the free-s t ream dynamic
pressure. However, for the present conditions, -qj = 1.0, the equation is mathematically qm
undefined at this point ( e = 0).
lor8
::; 3 1 A 30
2 I I I I I I I I 20L- 1
30 40 60 80 100 200 300
F igu re 13. - P e n e t r a t i o n c o r r e l a t i o n .
20

The single-jet maximum-concentration trajectories were correlated in reference 11
versus x/D (symbol notation of present paper), thereby collaps
ing the data for the various rat ios q q, to the ratio -qj = 1.0. A similar approach is j / q m
used herein to correlate the present data. Results for all the injection angles were col
lapsed onto the normal injection resul ts by plotting versus x/D i n
figure 14.
I l l
0
0 45 A 30
I l l 20 40 60
x/ D Figure 14.- Maximum-concentration-trajectory correlation.
Maximum Concentration
The maximum hydrogen mass fraction measured for each profile, which is a gage of the mixing rate , is presented in figure 15 as a function of the downstream station for each angle of injection. Data scat ter (on the order of &lopercent) resul ts from the inability to position the probe at the exact point of maximum concentration. The resul ts of the normal injection angle 8 = 90° and the injection angle 8 = 300 a r e represented by the two faired lines in figure 15. Because of the considerable data scat ter for 8 = 4 5 O and 8 = 60°, these injection angles will not be considered in this discussion. Comparing the resul ts for 8 = 90' and 8 = 30° shows two trends associated with changing the injection angles. The lower angles produce a lower maximum concentration and a slightly fas ter rate of decay throughout the mixing region surveyed. Also presented in figure 15
are single-jet data for normal injection at -9 = 1.0 from reference 11. The ra te of q,
decay of the maximum concentration is slower in the downstream region 30 5 5 2 120)( D
fo r multiple-jet data than for single-jet data. However, the initial mixing rate is more
rapid for the multiple-jet injection as seen at the station 5 = 30 where the maximumD
hydrogen concentration is two-thirds that for the single jet. This faster initial mixing
21
apparently resul ts f rom the increased flow turbulence caused by the initial interaction between adjacent-jet flow fields.
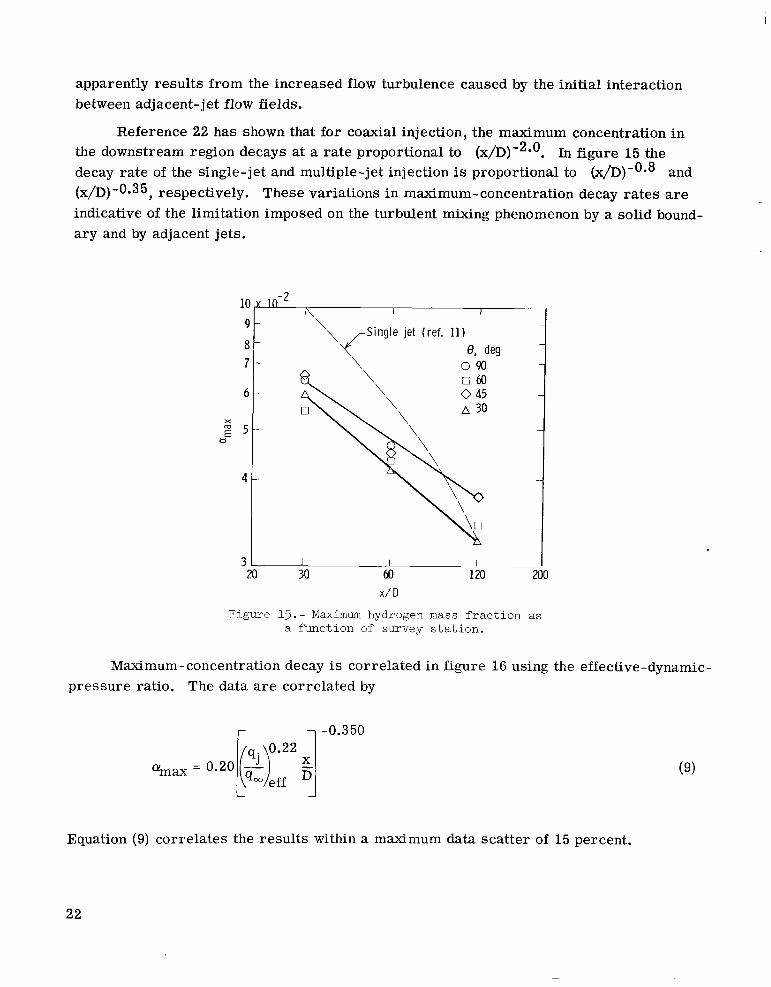
Reference 22 has shown that for coaxial injection, the maximum concentration i n the downstream region decays at a ra te proportional to (x/D)-~*O. In figure 15 the decay ra te of the single-jet and multiple-jet injection is proportional to (x/D)-OS8 and (x/D)-Oa35, respectively. These variations in maximum-concentration decay r a t e s are indicative of the limitation imposed on the turbulent mixing phenomenon by a solid boundary and by adjacent jets.
I I 1 I 20 30 60 120 200
x / D
Figure 15.- Maximum hydrogen mass fraction as a function of survey station.
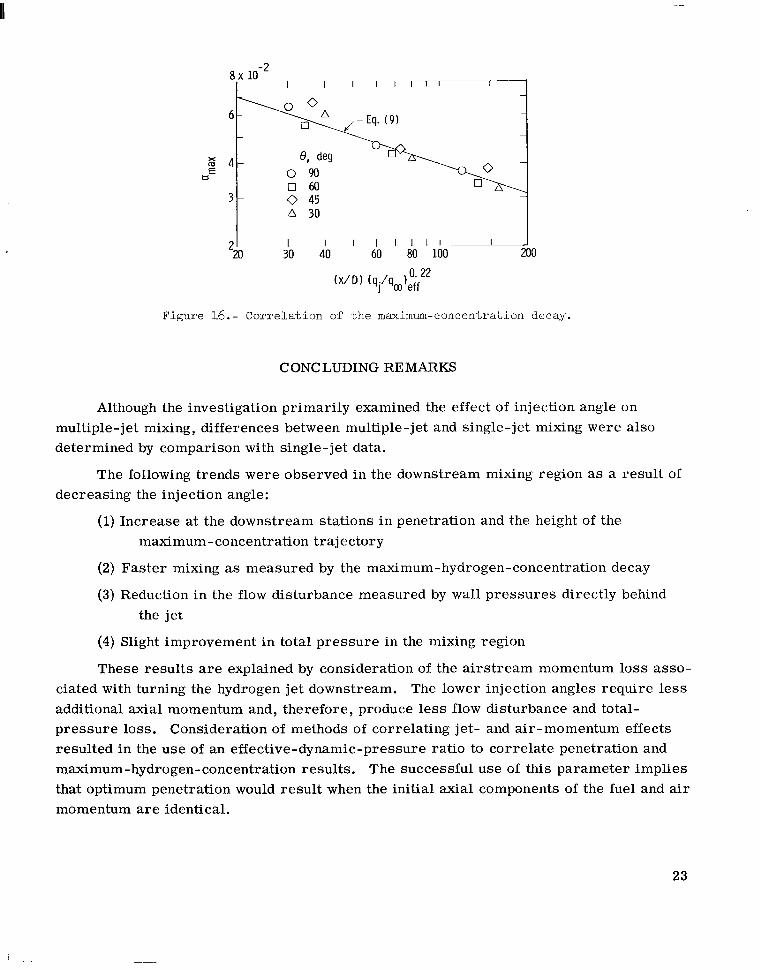
Maximum-concentration decay is correlated in figure 16 using the effective-dynamicpressure ratio. The data a r e correlated by
r 1-0.350
%ax = 0.20 g (9)
L J
Equation (9) correlates the resul ts within a maximum data scat ter of 15 percent.
22
aE 0 9 0 0 6 0
3 - 0 45 30
I I I I Ill-' 220 30 40 60 80 100I 1
0. 22(x/D) (qj/q,leff
Figure 16.- Correlation of the maximum-concentration decay.
CONCLUDING RE MARKS
Although the investigation primarily examined the effect of injection angle on multiple-jet mixing, differences between multiple-jet and single-jet mixing were also determined by comparison with single- jet data.
The following trends were observed in the downstream mixing region as a result of decreasing the injection angle:
(1)Increase at the downstream stations in penetration and the height of the maximum-concentration trajectory
(2) Fas ter mixing as measured by the maximum-hydrogen-concentration decay
(3) Reduction in the flow disturbance measured by wall p ressures directly behind the jet
(4) Slight improvement in total p ressure in the mixing region
These resul ts are explained by consideration of the a i r s t ream momentum loss associated with turning the hydrogen jet downstream. The lower injection angles require less additional axial momentum and, therefore, produce less flow disturbance and total-pressure loss. Consideration of methods of correlating jet- and air-momentum effects resulted in the use of an effective-dynamic-pressure ratio to correlate penetration and maximum-hydrogen-concentration results. The successful use of this parameter implies that optimum penetration would resul t when the initial axial components of the fuel and air momentum are identical.
23
1111111 111111111111111111111111 I11111.11111 111 I, , 1 1 1 I I , , I 1 1 1 1 , , . 1 . . ~ 1 1 . ~ 1 . . ~ ~ ~ -
When compared with single-injector data, the multiple-injector data resulted in the following trends :
(1) Wall pressures directly behind the center jet were higher than undisturbed plate pressures , whereas the single jet produced a low-pressure expansion region
(2) More uniform concentration distributions were obtained below the point of maximum concentration
(3) The air flow sustained greater total-pressure losses
(4) The maximum- concentration trajectory approached the wall with downstream distance at injector stations (x/D)greater than 60; whereas, the trajectory continued to rise for the single jet
(5) The initial decay of the maximum concentration was faster
(6) The rate of decay of the maximum concentration i n the region 30 5 5 5 120D was slower
These observations apparently result f rom two flow phenomena associated with multiple jets. The first is the initial interference between jet flow fields. This interference cancels the air-flow expansions around the jets, adds turbulence to the initial mixing region, and produces increased total-pressure losses compared to the single-jet cases. The second flow phenomenon is the overlapping of the adjacent jet mixing regions. When these regions merge, the mixing of the hydrogen below the maximum concentration is restrained. The resulting fuel-air region is basically res t r ic ted to mixing in the ver tical direction, resulting in the point of maximum concentration moving towards the wall. This laterally res t r ic ted mixing also resul ts i n the rate of decay of maximum concentration being slower in the downstream region.
Langley Research Center, National Aeronautics and Space Administration,
Hampton, Va., February 2, 1972.
24

APPENDIX
CENTER-JET FLOW CONTOURS
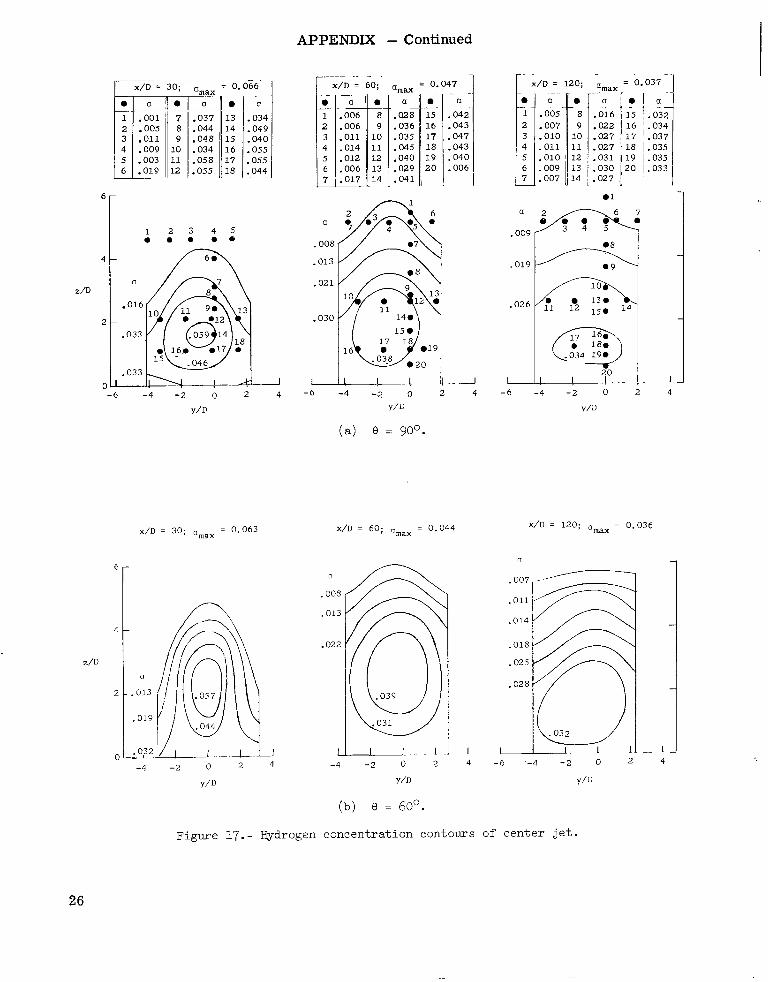
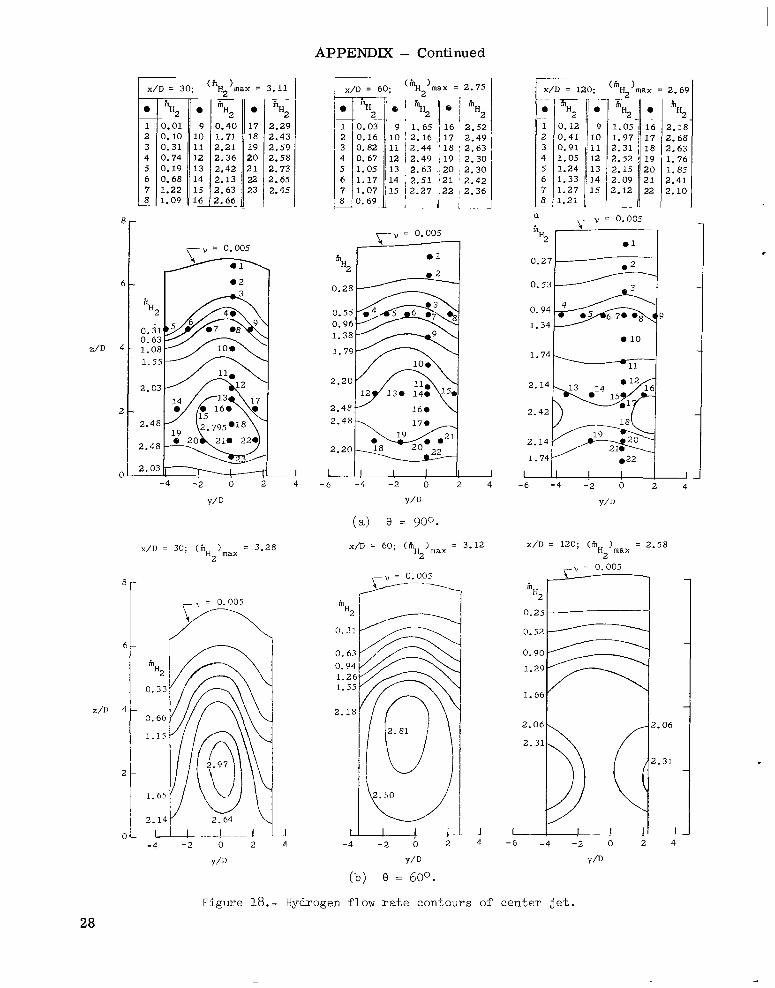
Mixing-region contours of the center jet a r e presented in figures 17, 18, and 19 for hydrogen mass fraction, hydrogen flow rate , and air flow rate, respectively. The hydrogen-air mixing region for the center jet is defined by a zone 6.25 jet diameters wide, centered about the middle hydrogen concentration peak to give the most symmetrical concentration contour. Data points are included on the first contour in each of these figures to i l lustrate the accuracy of the flow contours. The contours show that the center-jet mixing region is not always alined with the center line of the plate; however, the la teral shift is small , with a maximum value of about 3 percent of the downstream distance.
25
-
.019
--
APPENDIX
x / r =30; =max = 0.066' I X/D = 60;
2 .006 .048 15
.009 10 .034 1 6 11 .058 17
.019 12 .055 18
a
.008
-013
-021
- 030
-I -4 -2 0 2 4
Y/D
x/D = 3 0 ; 'max = 0.063 X/D = 60;
0
.008
.013
.022
z/D
2 .013
- Continued
amax - 0.047 = 0.037 ..
-e e [ .I 1 15 j .032 2 16 ' .034 3 .010 10 -027 17 ' .037 4 .011 11 .027 18 ~ .035 5 19 I .035 6 20 I .033 7-
0
.009 fii7 .026 Fl 13.
150 l4
, -034 19.
-6 -4 -2 0 2
Y / D
= 0.044 x/D = 120; omax = 0.036
n
.032 L 111 -4 -2 0 2 4 -4 - 2 0 2 4 - 6 ' -4 - 2 0 2 4
Y/D Y/D Y/D
(b) 9 = 60'.
~ I I . 1 1. 1
Figure 17.- Hydrogen concentration contours of center jet.
26

APPENDIX - Continued
8
6
z/D 4
L
c
Z/D
X/D = 30; amax = 0.067 x/D = 60; nmax = 0.045
.013
.020
-4 -2 0 2 4 -4 -2 0 2 4
Y/D Y / D
( c ) e = 450.
x/D = 30; omax = 0.060 x/D = 60; 2 0.041 max
.018
I ! ! I I 1 -4 -2 0 2 4 -4 -2 0 2 4
Y/D Y/D
(d) 0 = 30'.
Figure 17.-Concluded.
X / D = 120; amax = 0.037
n
Y/D
X / D = 120; qmax = 0.031
.006
.009
.a15
- 0 2 2
.02 8
.028
1 -4 - 2 0 2 4
Y/D
27
APPENDIX - Continued
60; ('H 2
'max = 2.753 . 11 Ix/o=- _ _ e in
-1 2.29 2 2.43 3 2.59 4 2.58 5 2.73 6 2.65 7 2.45 8-
a a v = 0.005
TV= O-Oo5 1 r V = 0.005
6 0.28
0.96 1.38
z/D 4 1.79
2.20
2 2.48 1 6 0 2.42
2.14;:::H,, 1.74
0 -4 -2 0 2 -6 -4 -2 b 2
Y/D Y/D
(a) 8 = 900.
x/D = 30 ; ( hH )max = 3.28 x/D = 60 ; (15H max
= 2 2
8 r n= 0.005 in
0.2
0. t in 0.9
H2 1.2 0.33 1.:
Z/D 0.66 2.1
2. 501.15 \ 1.65
2.14
-4 - 2 0 2
Y/D
(b) e = 60°.
4 - 6 -4 -2 0 2 4
Y/D
3.12 X/D = 120; (aH )max = 2.58 2
7 V = 0.005
hH
0.2
0.5
0.9
1.2
1.6
2.0 2.06
2.3
2.31
1 4
Figure 18.- Hydrogen flow r a t e contours o f c e n t e r j e t .
28

APPENDIX - Continued
-
in HZ
0.33
z / D - 0.68
1.18
- 1.68
- 1 -4 -2 0 2
Y/D
m
0.33
0.68
1.18
1.60
- t I ! !
r--\l = 0.005
A ,k 2 ! I A
4 -6 -4 -2 0 2 44 -4 -2 0
Y/D
( c ) e = 450.
u
Y/D
0.55
0.97
1. 38
1.81
2.21
2.36
2.36
2.21
1.81 1.381
I - 1 1 1 1 -4 -2 0 2 4
Y/D
29
-4 -2 0 2 4 -4 -2 0 2 4
Y/D Y/D
(d) 8 = 30°.
Figure 18.- Concluded.
L

15
8
6
z/D 4
2
0
Z/D
APPENDIX - Continued
26 Ix/D=-60; = 2491
in inin
~
107 65 1 229 8 129 I @ 88 71 82 63 2 187 9 112 16 79 52 71 65 3 152 10 98 17 50 67 75 52 4 135 11 84 18 5548 61 56 131 12 71 19 71 51 67 64 6 136 13 76 20 6563 85 62 7 , 142 14 8758 ~ __ -L. .
\I = 0.005
-v = 0.005 v in in
I 0 2 198
17. q !
09
12' 142
17 18 19 20 1 21 57 20.
L I IJ I -6 4 -6 -4 -2 0 2
85 7
0 0 0 .
Y/D
( a ) e = 90°.
x/D = 60; (in ) = 271 a max
in
190
132
108 R1
81
_J L A -4 4
Y/D
x/D = 120; ( Ha)max = 296
I 4
Y/D
(b) 8 = 600.
Figure 19.- Air flow r a t e contours of c e n t e r jet.
30

APPENDIX - Concluded
X/D = 30; (in ) = 299 a max
-
~ y = 0.005
-4 -2 0 2 4
Y/D
x/D = 30; (15a)max = 288
,- = 0.005
-4 -2 0 2 4
Y/D
X/D = 60; (in ) = 282 x/D = 120; (I5 ) = 284 a max a max
= 0.0°5
in
198
142
1 1 2
82
5 ;
(c) e = 45O.
x/il = 120; ( ha )max 254
\ = Omoo5-7 in
190
136
108
81
I ! I -4 - 2 0 2 4 -4 -2 0 2 4
Y/D Y/D
Figure 19. - Concluded.
31
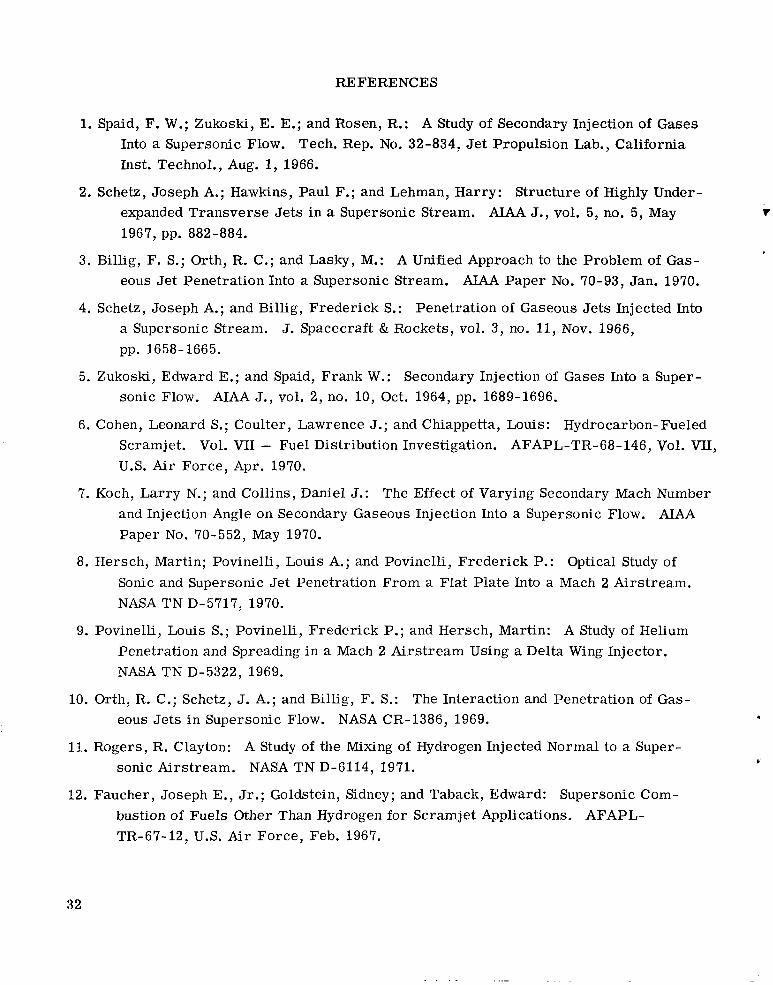
RE FERENCES
1. Spaid, F. W.; Zukoski, E. E.; and Rosen, R.: A Study of Secondary Injection of Gases Into a Supersonic Flow. Tech. Rep. No. 32-834, Jet Propulsion Lab., California Inst. Technol., Aug. 1, 1966.
2. Schetz, Joseph A.; Hawkins, Paul F.; and Lehman, Harry: Structure of Highly Under-expanded Transverse Jets in a Supersonic Stream. AIAA J., vol. 5, no. 5, May 1967, pp. 882-884.
3. Billig, F. S.; Orth, R. C.; and Lasky, M.: A Unified Approach to the Problem of Gaseous Jet Penetration Into a Supersonic Stream. AIAA Paper No. 70-93, Jan. 1970.
4. Schetz, Joseph A,; and Billig, Frederick S.: Penetration of Gaseous Jets Injected Into a Supersonic Stream. J. Spacecraft & Rockets, vol. 3, no. 11, Nov. 1966, pp. 1658-1665.
5. Zukoski, Edward E.; and Spaid, Frank W.: Secondary Injection of Gases Into a Supersonic Flow. AIAA J., vol. 2, no. 10, Oct. 1964, pp. 1689-1696.
6. Cohen, Leonard S.; Coulter, Lawrence J.; and Chiappetta, Louis: Hydrocarbon-Fueled Scramjet. Vol. VII - Fuel Distribution Investigation. AFAPL-TR-68-146, Vol. VII, U.S. Air Force, Apr. 1970.
7. Koch, Larry N.; and Collins, Daniel J.: The Effect of Varying Secondary Mach Number and Injection Angle on Secondary Gaseous Injection Into a Supersonic Flow. AIAA Paper No. 70-552, May 1970.
8. Hersch, Martin; Povinelli, Louis A.; and Povinelli, Frederick P.: Optical Study of Sonic and Supersonic Jet Penetration From a Flat Plate Into a Mach 2 Airstream. NASA TN D-5717, 1970.
9. Povinelli, Louis S.; Povinelli, Frederick P.; and Hersch, Martin: A Study of Helium Penetration and Spreading in a Mach 2 Airs t ream Using a Delta Wing Injector. NASA TN D-5322, 1969.
10. Orth, R. C.; Schetz, J. A.; and Billig, F. S.: The Interaction and Penetration of Gaseous Jets in Supersonic Flow. NASA CR-1386, 1969.
13.. Rogers, R. Clayton: A Study of the Mixing of Hydrogen Injected Normal to a Supersonic Airstream. NASA TN D-6114, 1971.
12. Faucher, Joseph E., Jr.; Goldstein, Sidney; and Taback, Edward: Supersonic Combustion of Fuels Other Than Hydrogen for Scramjet Applications. AFAPL-TR-67-12, U.S. Air Force, Feb. 1967.
r
32
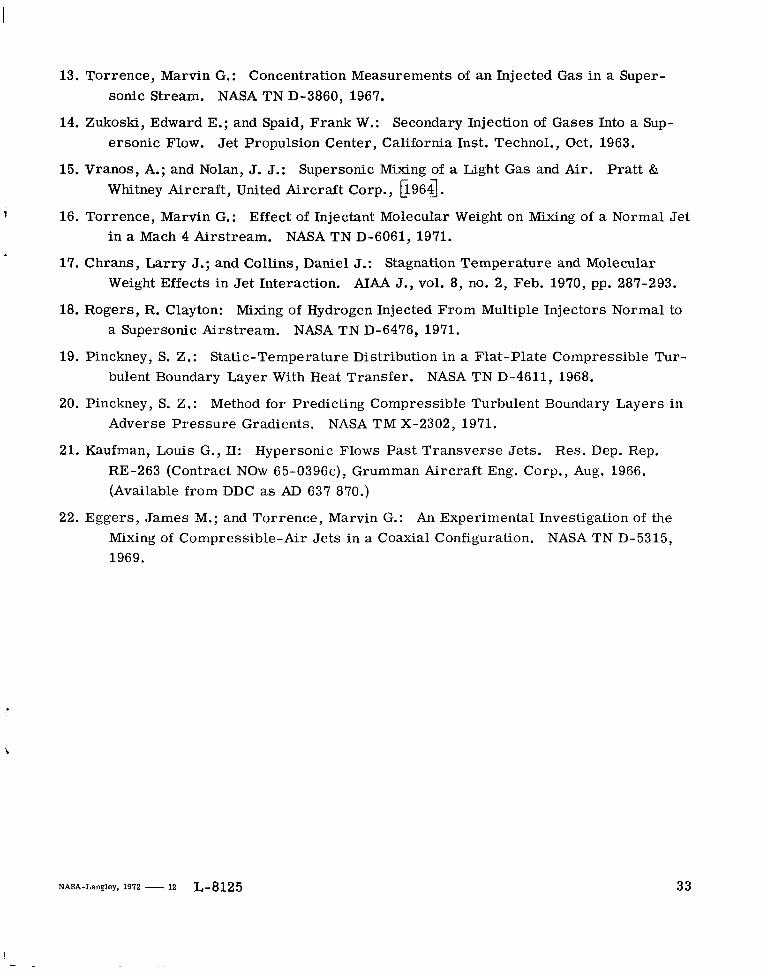
13. Torrence, Marvin G.: Concentration Measurements of an Injected Gas in a Supersonic Stream. NASA TN D-3860, 1967.
14. Zukoski, Edward E.; and Spaid, Frank W.: Secondary Injection of Gases Into a Supersonic Flow. Jet Propulsion Center, California Inst. Technol., Oct. 1963.
15. Vranos, A.; and Nolan, J. J.: Supersonic Mixing of a Light Gas and Air. Pratt & Whitney Aircraft, United Aircraft Corp., b 9 6 4 .
1 16. Torrence, Marvin G.: Effect of Injectant Molecular Weight on Mixing of a Normal Jet in a Mach 4 Airstream. NASA TN D-6061, 1971.
17. Chrans, Lar ry J.; and Collins, Daniel J.: Stagnation Temperature and Molecular Weight Effects in Jet Interaction. AIM J., vol. 8, no. 2, Feb. 1970, pp. 287-293.
18. Rogers, R. Clayton: Mixing of Hydrogen Injected From Multiple Injectors Normal to a Supersonic Airstream. NASA TN D-6476, 1971.
19. Pinckney, S . Z . : Static-Temperature Distribution in a Flat-Plate Compressible Turbulent Boundary Layer With Heat Transfer . NASA TN D-4611, 1968.
20. Pinckney, S. Z . : Method for Predicting Compressible Turbulent Boundary Layers in Adverse P res su re Gradients. NASA TM X-2302, 1971.
21. Kaufman, Louis G., 11: Hypersonic Flows Past Transverse Jets. Res. Dep. Rep. RE-263 (Contract NOW 65-0396c), Grumman Aircraft Eng. Corp., Aug. 1966. (Available from DDC as AD 637 870.)
22. Eggers, James M.; and Torrence, Marvin G.: An Experimental Investigation of the Mixing of Compressible-Air Je t s in a Coaxial Configuration. NASA TN D-5315, 1969.
NASA-Langley, 1972 -12 L-8125 33

' NATIONAL AERONAUTICS AND SPACE ADMISTRATION WASHINGTON. D.C. 20546 - P O S T A G E A N D FEES P A I D
N A T I O N A L A E R O N A U T I C S A N DOFFICIAL BUSINESS FIRST CLASS MAIL. SPACE A D M I N I S T R A T I O N PENALTY FOR P R I V A T E USE $300 USMAIL
008 0 0 1 C 1 V 12 720218 S00903DS DEPT OF THE A I R FORCE A F WEAPONS LAB (AFSC)TECH LIBRARY/WLOL/ ATTN: E LOU BOWMAN, C H I E F K I R T L A N D AFB N M 87117
POSTMASTER:
" T h e aevonantical and space activities of t he United Stntes shall be condmted so as t o contribute . . . t o the expansion of hzlitzan knowledge of pheiroiiiena in the atitlosphere and space. T h e Adnzinistmtion shall provide fo r the widest practicable and appropriate dissemina~ion of information conterning i ts actiuities and the resiilts thereof."
-NATIONALAERONAUTICS A N D SPACE ACT OF 1958
If Undeliverable (Section 158 Postal Manual) Do Not Return
NASA SCIENTIFIC AND TECHNICAL PUBLICATIONS
TECHNICAL REPORTS: Scientific and technical information considered important, complete, and a lasting contribution to existing knowledge.
TECHNICAL NOTES: Information less broad in scope but nevertheless of importance as a contribution to existing knowledge.
TECHNICAL MEMORANDUMS: Information receiving limited distribution because of preliminary data, security classification, or other reasons.
CONTRACTOR REPORTS: Scientific and technical information generated under a NASA contract or grant and considered an important contribution to existing knowledge.
TECHNICAL TRANSLATIONS: Information published in a foreign language considered to merit NASA distribution in English.
SPECIAL PUBLICATIONS: Information derived from or of value to NASA activicies. Publications include conference proceedings, monographs, data compilations, handbooks, sourcebooks, and special bibliographies.
TECHNOLOGY UTILIZATION PUBLICATIONS: Information on technology used by NASA that may be of particular interest in commercial and other non-aerospace applications. Publications include Tech Briefs, Technology Utilization Reports and Technology Surveys.
Details on the availability of these publications may be obtained from:
SCI ENTlF IC AND TECHNICAL INFORMATION OFFICE
NATIONAL AERONAUTICS AND SPACE ADMINISTRATION Wasbington, D.C. PO546 a