the effect of good corporate...
TRANSCRIPT

i
THE EFFECT OF GOOD CORPORATE GOVERNANCE, GROWTH
OPPORTUNITIES AND SALES GROWTH TO ACCOUNTING
CONSERVATISM
(Empirical Study on LQ 45 Companies Listed In Indonesia Stock Exchange )
Undergraduate Thesis
By:
Siti Humaeroh
1112082100009
ACCOUNTING DEPARTEMENT
INTERNATIONAL CLASS PROGRAM
THE FACULTY OF ECONOMICS AND BUSINESS
STATE ISLAMIC UNIVERSITY SYARIF HIDAYATULLAH
JAKARTA
1437 H / 2016 AD

ii

iii
iv

v

i
CURRICULUM VITAE
DAFTAR RUWAYAT HIDUP
Siti Humaeroh
Kp. Palayangan RT.01/01 Ds.Jagabaya Parungpanjang
Bogor, 16360
TTL/Date of Birth : Bogor, 30 Juni 1992
Jenis Kelamin/Gender : Perempuan/Female
Warganegara/Nationality : Indonesia/Indonesian
Status Marital/Marital Status : Sudah Menikah/Married
Nomor Telpon/Phone Number : 085781553331
Email : [email protected]
Ringkasan/Summarize
I am interested in accounting science. Higly motivated and hard worker personality, with
motto”If there is a will, there is a way”. Good in individual and team work.
Pendidikan Formal/Formal Education
2012 – Current State Islamic University Syarif Hidayatullah Jakarta
S1, Faculty of Economics and Business, Accounting
( International Program)
2008 – 2011 SMK Yuppentek – 5 Curug
2005 – 2008 SMPN 1 Parungpanjang
1999 – 2005 SDN Jagabaya O2
Pendidikan Non-Formal/Non-Formal Education
Latanza English Course
Pengalaman Kerja/Work Experinces
Teacher (Math Teacher) in SMK Acasia Fornis and SMK Yastrif
Internship at developer companies
Admin in Mega Block
This statement, I create with the truly as the consideration for you.
i
ii
PENGARUH GOOD CORPORATE GOVERNANCE, KESEMPATAN TUMBUH, DAN
PERTUMBUHAN PENJUALAN TERHADAP KONSERVATISME AKUNTANSI
(Studi empiris pada perusahaan LQ 45 yang terdaftar di Bursa Efek Indonesia
ABSTRAK
Tujuan penelitian ini adalah untuk memberikan bukti secara empiris pengaruh Good
Corporate Governance yang diproksikan oleh Independent Commissioner dan Managerial
Ownership, Growth opportunities dan Sales Growth terhadap Konservatisme Akuntansi.
Populasi penelitian adalah perusahaan yang tercatat di Bursa Efek Indonesia.
Sample penelitian adalah perusahaan LQ 45 yang tercatat di Bursa Efek Indonesia. Teknik
pengambilan sampel menggunakan metode purposive sampling dengan sample sebanyak 21
perusahaan untuk periode 2011 sampai dengan 2014. Metode analisis data menggunakan
regresi linier berganda menggunakan SPSS Versi 17. Variabel independen dalam penelitian
ini adalah Good Corporate Governance yang diproksikan oleh Komisaris Independen dan
Kepemilikan Manajerial, Kesempatan Tumbuh dan Pertumbuhan Penjualan dan variabel
dependennya adalah Konservatisme Akuntansi.
Hasil penelitian menunjukkan bahwa Kesempatan Tumbuh dan Pertumbuhan
Penjualan berpengaruh positif signifikan terhadap Konservatisme Akuntansi. Sedangkan
Good Corporate Governance yang diproksikan oleh Komisaris Independen dan Kepemilikan
Manajerial tidak berpengaruh terhadap Konservatisme Akuntansi.
Kata kunci: Good Corporate Governance, Komisaris Independen, Kepemilikan Manajerial,
Kesempatan Tumbuh, Pertumbuhan Penjualan dan Konservatisme Akuntansi.
ii
iii
THE EFFECT OF GOOD CORPORATE GOVERNANCE, GROWTH
OPPORTUNITIES AND SALES GROWTH TO ACCOUNTING CONSERVATISM.
(Empirical study on LQ 45 Companies Listed in Indonesian Stock Exchange)
ABSTRACT
The purpose of this study is to provide empirical evidence of the effect of Good
Corporate Governance proxied by Independent Commissioner and Managerial Ownership,
Growth opportunities and Sales Growth to Accounting Conservatism
The population of the research are shares listed on Indonesian Stock Exchange. The
sample are LQ 45 companies listed in Indonesian Stock Exchange. The sampling method is
purposive sampling that were sampled are 21 companies for the period from 2011 to 2014.
Methods used of data analysis was multiple regression analysis using SPSS version 17.
Independent Variables of the research are Good Corporate Governance proxied by
Independent Commissioner and Managerial Ownership, Growth opportunities and Sales
Growth and Dependent Variables of the research is Accounting Conservatism.
The results showed that Growth Opportunities and Sales Growth had positive and
significantly effect on Accounting Conservatism. While Good Corporate Governance proxied
by Independent Commissioner and Managerial Ownership had no effect on Accounting
Conservatism.
Key words: Good Corporate Governance, Independent Commissioner, Managerial
Ownership, Growth Opportunities, Sales Growth and Accounting Conservatism
iii

iv
FOREWORD
Bismillah Hirrohman Nirrohim
Assalamu’alaikum Wr.Wb.
All praise to Allah SWT as the hearer, the seer and above all an abundance of grace,
Taufiq, as well as his guidance. So, because Allah SWT I can finish this research on time.
And shalawat always gives to our beloved prophet Muhammad SAW and all his families and
friends who always helped him in establishing Dinullah in this earth.
With the strength, intelligence, patience, and strong desire from Allah SWT, I am able
to finish this mini thesis as graduation pre requirement for bachelor degree. I believe there is
an invisible hand which has helped me going through this process.
My special thanks to my Mom, Komyanah, who has been helping and supporting her
daughter to finish this thesis. You are the embodiment of angle in human form. So, I want to
make you aways smile because your smile is the efficacious magic that can boost my spirit to
reach my dream and face the world. You always pray and fall your tears in the mid night in
the front of Allah SWT, you prayed only for the pleasure of your family and your stubborn
daughter. Thanks mom, even a thousand of word can’t explain how really happy I am to be
your daughter.
I also would like to extend my gratitude to my father, Sardi, for everything that you
have gave to me. I just can pray that Allah SWT will give you back for everything that you
have done. Thank you also, you always pray for me in your sholah.
I believe I am nothing without each of you who has helped me in finishing this thesis.
Thus, in this very special moment, let me say many thanks to all of them have been helping
me in this process of this thesis, including:
iv

v
1. Special thanks to My Husband, Nandang Sunandar. You always be my place to say
every problem. Thanks for your patience, your knowledge, your motivation and
support. Thanks for your time and helps. So I can finish my thesis.
2. My relative family. Special thanks to my big sister Siti Ruaedah, you always be my
place to say every problem. Thanks for your patience, your knowledge, your
motivation and support. Special thanks for my lil sister Siti Sarah and My lil brother
Sigit.
3. Mr. Dr. Arief Mufraini, Lc., M.Si as Dean of Economic Faculty
4. Mrs. Yessi Fitri, SE., M.Si., Ak., CA as Head of Accounting Major
5. Mr. Hepi Prayudiawan, SE., MM., Ak., CA as Secretary of Accounting Major and
thesis supervisor. You are the best mentor with your carefulness, specificity and
punctuality. You have given me direction and guided me, share your knowledge to
me, and thank you so much for your time and your help. So I can finish this thesis.
6. All lecturers who have taught me patiently, may they have given are recorded in Allah
SWT almight and all staff UIN Syarif Hidayatullah Jakarta,
7. Special thanks to Mr. Bonik “Thanks a lot you have provide information and official
stuffs that I needed in college”.
8. All my friends in Accounting International Program 2012. Lia, Hadyan, Faiz, Syafiq,
Andhiko and Ody, thanks for every support, motivation to finish my thesis. Thanks
for every foolish thing that you have done, and you made my day full of laugh.
Thanks for the time we’ve been through together for four years. Senior, junior and
management class thanks all who couldn’t mention one by one “thanks for your
prayer.
9. All my teacher friends in Vocational High School, Mr. Madnur, Mrs. Ida, Mr. Ade,
Mr. Ugi, Mrs. Hj. Umayah, Mr. Budi, Mrs. Novi, Mrs. Erwin, Mrs.Ocih, Mrs. Lia.
vi
Thanks for every support and motivation to finish my thesis. Thanks for your
knowledge which you shared to me.
I realize that this thesis is still far from perfect, thus suggestion and constructive
criticism from all parties are welcome, in order to improve my thesis. Finally, only Allah
SWT will return all and I hope this thesis will be useful to all parties, especially for
writers and readers in general, may Allah SWT bless us and recorded as the worship of
Allah’s hand. Amin.
Wassalammualaiakum Wr. Wb.
Jakarta, May 2016
Siti Humaeroh

vii
TABLE OF CONTENTS
Curriculum Vitae........................................................................................................................i
Abstrak.......................................................................................................................................ii
Abstract.....................................................................................................................................iii
Foreword...................................................................................................................................iv
Table of Contents.....................................................................................................................vii
List of Tables..............................................................................................................................x
List of Figures...........................................................................................................................xi
List of Appendixes...................................................................................................................xii
Chapter I INTRODUCTION
A. Background Issues........................................................................................1
B. Problem Formulation....................................................................................6
C. Objective Research and Benefits......................... ........................................7
1. Objective................................................................................................7
2. Benefits ..................................................................................................7
Chapter II STUDY LITERATURE
A. Theory Development....................................................................................9
1. Positive Accounting Theory...................................................................9
2. Agency Theory.......................................................................................9
3. Signaling Theory............. ....................................................................10
4. Accounting Conservatism....................................................................11
5. Corporate Governance..........................................................................13
a. Independent Commissioner..............................................................14
b. Managerial Ownership.....................................................................16
6. Growth Opportunities..........................................................................17
7. Sales Growth............................................................................ ...........17
vii

viii
B. Variables Interrelationship.........................................................................17
1. Independent Commissioner and Accounting Conservatism................17
2. Managerial Ownership and Accounting Conservatism........................18
3. Growth Opportunities and Accounting Conservatism.........................19
4. Sales Growth and Accounting Conservatism.......................................19
5. Independent Commissioner, Managerial Ownership,
Growth Opportunities, Sales Growth
and Accounting Conservatism.............................................................20
C. Previous Research......................................................................................21
D. Framework and Hypotesis.........................................................................23
a. Framework...........................................................................................23
b. Hypotesis..............................................................................................25
Chapter III RESEARCH METHODOLOGY
A. Research Scope..........................................................................................26
B. Sampling Method.......................................................................................26
C. Data Collection Method.............................................................................27
D. Analysis Method........................................................................................27
1. Descriptive Analysis............................................................................27
2. Classic Assumption Test......................................................................28
a. Normality Test...............................................................................28
b. Multicollinearity Test....................................................................28
c. Heteroscedasticity Test..................................................................29
d. Autocorrelation Test.....................................................................29
3. Hypothesis Testing..............................................................................30
a. Coefficient of Determination........................................................30
b. Multiple Linear Regression Analysis............................................30
c. Simultaneous Significant Test (F-Test).........................................32
d. Significant Partial Test (T-Test)....................................................32
E. Research Operational Variable..................................................................33
1. Dependent Variable.............................................................................33
2. Independent Variable..........................................................................34
a. Independent Commissioner..........................................................34
b. Managerial Ownership.................................................................35

ix
c. Growth Opportunities..................................................................35
d. Sales Growth...............................................................................35
Chapter IV FINDING AND ANALYSIS
A. General Description of Research Object................................................37
B. Analysis and Discussion.........................................................................38
1. Descriptive Statistics.........................................................................38
2. The Result of Data Quality Test........................................................40
a. The Result of Normality Test......................................................40
b. The Result of Multicollinearity Test..........................................40
c. The Result of Heteroscedasticity Test.........................................41
d. The Result of Autocorrelation Test.............................................42
3. Hypothesis Testing............................................................................43
a. Coefficient of Determination.......................................................43
b. Multiple Regression Analysis Result..........................................44
c. Significant Partial Test (T-Test)..................................................47
d. Simultaneous Significant Test (F-Test).......................................51
Chapter V CONCLUSION
A. Conclusion................................................................................................52
B. Recomendation.........................................................................................53
REFERENCE.........................................................................................................................53

x
LIST OF TABLES
No Description Page
2.1 Overview Preview Research..................................................................................21
3.1 Operational Variable and Variable Measuring......................................................36
4.1 Sample Research....................................................................................................37
4.2 List of Sample companies......................................................................................38
4.3 Descriptive Statistics..............................................................................................39
4.4 Normality test by One-Sample Kolmogorov-Smirnov Test..................................40
4.5 Results Multicollinearity Test................................................................................41
4.6 Test Autocorrelation (Durbin Watson)..................................................................43
4.7 Results Coefficient Determination.........................................................................43
4.8 Regression Analysis...............................................................................................44
4.9 Simultanous Test Results (F-Test).........................................................................51
x

xi
LIST OF FIGURE
No. Desription Page
2.1 Logical Framework......................................................................................................23
4.1 Heterocedasticity Test (Scatterplot).............................................................................42
xi

xii
LIST OF APPENDIXES
No. Description Page
1 Sample Description...............................................................................................57
2 Raw Data Description...........................................................................................58
3 Output SPSS That Used for the Result of the Research........................................63
xii

1
CHAPTER I
INTRODUCTION
A. Background Issues
Enterprise resource management and performance management described the
company through the financial statements. In Indonesia, the financial statements must
be prepared based on Statement of Financial Accounting Standards (SFAS) issued by
the Indonesian Institute of Accountants (IAI). In the financial reporting process,
managers are given the freedom by Generally Accepted Accounting priciples (GAAP)
in selecting accounting methods adapted to the economic conditions in the company.
Unstable economic conditions led to the economic conditions that are faced by every
company were different. In order to not to harm investors and creditors as users of
financial statements information, the company should conservative in making
financial reports.
The concept of conservatism in GAAP (Generally Accepted Accounting
Principles) set at SFAC No. 2 that describes the characteristics that make accounting
information can be useful. Conservatism is a reaction to the uncertainty. Paul Grady
(1965) in Novikasari and Sofyan (2013) describes ten basic concepts that are
considered underlying business and accounting practices in the United States. Grady
describes the basic concepts underlying the concept of quality as the usefulness and
reliability of accounting information or as the limitations inherent in the financial
statements. One of ten basic concept is the concept of conservatism
The principle of conservatism is the precautionary principle to a uncertain
circumstances to avoid excessive optimism of management and owners of the
company. Conservatism has a basic rule, namely: (1) should not anticipate earnings
1

2
before occurred, but have to admit losses may occur. (2) when faced with two or more
preferred method of accounting, the accountants must choose a method which at least
profitable for the company (Suharli, 2009). Selected technique is generating value of
assets and low income, or who produce value of debt and the cost of the highest.
Consequently, if there conditions that may lead to losses, costs or debt then losses,
costs or debt must be immediately recognized. Then, if there is a condition that is
likely to generate profits, income or assets then profit, revenue or assets should not be
recognized immediately, until the condition has been really realized (Ghozali and
Chariri, 2007).
Conservatism is necessary to minimize or even eliminate the fault recording
and overstatement in the financial statements. Because there are many cases of
recording errors or even fraud that ends by harming one of the parties, especially the
shareholders. As example is the case of the profit mark-up undertaken by the
management of Toshiba revealed in 2015. The company proved do mark up on profit
reached 151.8 billion yen, or around Rp 16 trillion. It’s fraud has happened for six
years since 2008 until march 2014. The amount of profit is marked up for three times
of estimated profit at Toshiba predictions. Tanaka and Sasaki as president and vice
president of Toshiba considered responsible for this case because the cheating
occurred in their period. Because of discovery means that Toshiba should resettle its
financial statements in April 2008 to March 2014 and cause the company's president
and vice president resigned. Because of this incident firm profound to say sorry to
shareholders for causing serious problems for them (beritasatu.com).
This case illustrates that conservatism is needed in order to make user of
financial statements do not feel disadvantaged because of management opportunistic .

3
Because today many case of fraud by inflating the company's profit because of some
motifs such as raising the value of company, stock price and so on. Therefore the
accounting conservatism absolute need to provide better financial reporting and
pressing cheating. As Starling (1970) in Novikasari and Sofyan, (2013) states that the
principle of conservatism is the most influential in accounting valuations. This
principle emphasizes to choose alternative accounting records have the smallest
possibility to re-overstate assets and income. The principle that has become the
standard primary listing in the first three decades of the 20th century applied to offset
optimism management as well as their tendency to overstate clicking financial
statements. Practitioners of accounting and accounting standard setters itself . This led
to the financial statements will generate profits that can be accounted by the company
so that profits are at present not a mark-up and will not harm any of the parties.
Today, companies face greater pressure to provide more reliable financial
statements. Several parties, including the FASB (regulator US accounting) were
advised to abandon the principle of conservatism in the accounting reporting of the
company to provide financial statements that do not bias. Also in recent years, capital
market participants require registration of the company's assets value closer to market
value rather than book value. Demand these actors increasingly lowering the prestige
of the application of the principle conservatism. Conservatism considered no longer in
line with the purpose of accounting standards requiring modern accounting standards
that can predict conditions in future (future-oriented), something that can not be done
by principle accounting.
Although declining prestige of accounting conservatism but still many
companies in Indonesia which still apply the principle of conservatism as according to

4
(Widya, 2005 in Wijayanti 2008), many of Indonesian firms are applying
conservative accounting in the preparation its financial statements. A total of 76.9
percent of the total companies in Indonesia choose the conservative accounting
method. Accounting conservatism applied in several level according Wardhani (2008)
states that the company's accounting conservatism applied in different levels. One of
the factors that determine the level of conservatism in financial reporting of a
company is the commitment of management and the company's internal parties in
providing information that is transparent, accurate and not misleading for investors. It
is a part of the implementation of good corporate governance. Implementation of
corporate governance carried out by all parties within the company, with the main
actor is the top management company is authorized to establish company policy and
implement the policy. One of the policy related to the principle of conservatism that is
used by companies in reporting its financial condition. Therefore, the characteristics
of the company's top management will affect the level of conservatism that will be
used by the company in preparing its financial statements.
Good Corporate Governance mechanism used to ensure that all activities of
the company including accounting method of the company has been run optimally in
order to achieve the ultimate goal required supervisory function well. Implementation
of Corporate Governance made by all parties within the company, with the main actor
is the top management will affect the level of conservatism that will be used by the
company in preparing its financial statements. The management characteristics
include independent commissioner and managerial ownership.
According to Padmawati and Fachrurrozie (2015) managerial ownership can
provide influence within the company due to the ownership of the majority shares in

5
the company will cause the resulting financial interests of management will
implement more conservative of accounting. Independent commissioners is needed in
the company to protect minority shareholders and related parties. With the
independent commissioners, the supervision by the board of commissioners will be
more stringent so that it will tend to require conservative accounting to prevent
opportunistic attitude of the manager. (Padmawati and fachrurrozie, 2015)
The other factor influencing conservatism is growth opportunities. Companies
that have high growth rates have the motivation to minimize profit. As Widya (2004)
that the higher rate of growth of a company, the higher the likelihood that the
company is in choosing conservative accounting. Beside growth opportunities, sales
growth also influencing accounting conservatism. High sales growth expectations are
often increase the market against the future cash flows that will affect accounting
conservatism (Ahmed and Duellman 2002 in Padmawati and Fachrurrozie 2015).
Research of Satya (2013) also stated that the higher sales growth, the more inclined
the company choose a strategy of conservative accounting.
Researches on accounting conservatism have done by previous researchers.
Kootanaee, et al (2013) conducted a study on the influence of corporate governance
mechanism to accounting conservatism. The results showed that corporate governance
mechanism has no significant effect on accounting conservatism. This study is in line
with research Padmawati and Fachrurrozie (2015) which shows that good corporate
governance is proxied by managerial ownership and independent commissioner has
no effect on accounting conservatism but sales growth has significant effect to
accounting conservatism. This research is not in line with the study done Astarini
(2011) where the research results show that managerial ownership significantly

6
influence accounting conservatism. This result may be caused due to a difference in
research and place (state) research and research sample.
Research conducted by Astarini (2011) on accounting conservatism shows that
growth opportunities are not having a significant effect on accounting conservatism.
This study is not consistent with research Saputro and Setiawati (2004) found that
growth opportunities roomates have a significant effect on accounting conservatism.
This difference may be caused due to differences in study and research sample.
The variables used in this study had been investigated previous. But there are
differences of opinion between the previous researchers. Therefore, the author felt the
need to re-examine these variables to see the consistency of previous studies.
With the pros and cons regarding the application of accounting, the application
of conservatism in accounting increased the past few decades (Givoly and Hayn,
2000). Therefore, the research on this conservatism becomes interesting to discuss
because due to considerations relating to the company in applying conservative
accounting. Based on the background of problems above then I interesting in doing
research on accounting conservatism with the title “The Effect of Good Corporate
Governance, Growth Opportunities and Sales Growth to Accounting
Conservatism”.
B. Problem Formulation
1. Does Independent commissioner influence Accounting Conservatism?
2. Does Managerial ownership influence Accounting Conservatism ?
3. Does Growth opportunities influence Accounting Conservatism ?
4. Does Sales growth influence Accounting Conservatism ?
5. Does Independent commissioner, managerial ownership, growth opportunities and
sales growth simultaneously influence accounting conservatism ?

7
C. Objective Research and Benefits
1. Objective
In accordance with the formula above, this study has the objective to:
a. Provide empirical evidence whether Independent commissioner influence
Accounting Conservatism
b. Provide empirical evidence whether Managerial Ownership influence
Accounting Conservatism
c. Provide empirical evidence whether Growth opportunities influence
Accounting Conservatism
d. Provide empirical evidence whether Sales growth influence Accounting
Conservatism
e. Provide empirical evidence whether Independent commissioner, managerial
ownership, growth opportunities and sales growth simultaneously influence
Accounting Conservatism
2. Benefits
With the research is expected to have benefits can be taken for all interested
parties. Results of the analysis obtained in this study is expected to provide benefits
for:
Theoretical Benefits.
1. Researcher, As a comparison between the theories that have been writers
get during the course with reality. So that can know the problems facing
company and conformity among others obtained so as to obtain solving
existing problems.
8
2. Students of Accounting
- As a source of information for other researchers who are interested in
the same issues and analysis and for those who need the information.
- As a science that could enrich the knowledge about accounting
conservatism
Practical Benefits
1. Company, by doing research on the accounting conservatism
implementation is expected to be used as an evaluation of the importance of
corporate.
2. Investor is hoped that this research can be used as a consideration in
the investment decision on companies that implement accounting
conservatism.
3. Government, by doing this research on the accounting implementation
is expected to be used as an evaluation of the importance of state (tax).

9
CHAPTER II
STUDY LITERATURE
A. Theory Development
1. Positive Accounting Theory
Positive accounting theory explains that managers have an incentive or
encouragement to maximize welfare. This theory is based on a section that
managers and shareholders are rational. They seek to maximize their utility, which
is directly linked to their prosperity (Nugroho and Mutmainah, 2012)
Positive accounting theory predicts that managers have a tendency to raise
profit to hide poor performance. The tendency of managers to increase their
profits can be boosted by four issues, namely the hiring of asymmetric
information, limited working period managers, limited liability managers, and
asymmetry payment. Shareholders and creditors trying to avoid overpayment to
the manager to ask for the implementation of conservative accounting (Watts,
2003). Therefore it can be concluded that managers tend to organize accounting
liberal, but the lender (in debt contracts) and shareholder (in compensation
contracts) tend to ask the manager held a conservative accounting (Nugroho and
Mutmainah, 2012)
2. Agency Theory
Agency theory assumes that all individuals acting in their own interests.
Agency theory was first introduced by Jensen and Meckling (1976) on Wulandari
et al (2014). Agency relationship arises because of the contract between
shareholders (principal) and management company (agent) who is the manager of
the company, the contract holder authorizes management to run the company's
operations are included in decision-making. Both groups (the agent and principal)
9

10
are people who seek to maximize utility, then there is little reason for the agent
will not always act in the best interest of the principal.
In the agency theory is an imbalance of information or assymetry
information. The assumption that individuals act to maximize itself, resulting in
agents utilize their information assymetry they have to hide some information that
is not known by the principal. assymetry information and potential conflicts of
interest between principal and agent encouraging the agent to present information
that is not true to the principal, especially when it comes to the performance of
agents by thinking about how the accounting figures are used as a means to
maximize its interests (Wulandari et al, 2014)
3. Signaling Theory
According Fala (2007) Signaling Theory explains that the signaling is
done by managers to reduce assymetry infomation. Managers provide information
through the financial statements that they apply the accounting conservatism
policy which generate profit more qualified for this principle prevents companies
taking action to exaggerate profits and helps users of financial statements to
present the earnings and assets not overtsate. In practice management applying
conservative accounting policies with high computing depreciation will result in
lower profits relatively permanent, which means do not have a temporary effect
on the decline in profits would rebound on the future.
Understatement profit and net assets are relatively permanent in the show
through the financial statements is a positive signal of management to investors
that management has implemented a conservative accounting to generate quality
earnings. Investors are expected to receive this signal and valuing the company at
a higher (Fala, 2007)

11
4. Accounting Conservatism
Accounting conservatism is still considered by accountants as one of the
most important principles. Accounting conservatism concept was controversial at
the turn of last century up till now. Despite of the criticism against this principle,
it still plays an important role in accounting practices Watts (2003) on Reyad
(2012)
Francis, et al (2004) on (Kim and Yung, 2007).assumed that conservatism
is one of the desirable attributes of financial statements because it increases
transparency. On the other hand, Penman and Zhang (2002) suggest that
conservatism results in lower quality of earnings because conservative accounting
practices accelerate expensing of investment costs, thus reducing income and
generating hidden reserves, when the firm's investment expenditures grow
Basu (1997) on Kootanaee, et al (2013) defined conservatism as requiring
a higher degree of verifiable to identification good news such as profit vs bad
news, such as loss. as well as the conservatism, defined choice and use of
consistently accounting policies that are resulting in underestimate report net
assets of the company. Basu definition of conservatism is based on loss and profit
and Feltham and Ohlson is based on the balance sheet, so that have try in
assessment underestimate the assets or overestimate report liabilities. Givoly and
Hayn (2000) provided combination definition of conservatism that is based on
balance sheet and income Statement perspective which has been trying in decrease
retain earning. They defined conservatism, choose of accounting policies in
uncertainty terms, so that is resulting minimum amount for assets and incomes
and have minimal effect on equity.
12
Accounting conservatism has long been adopted into accounting
procedures in theory and practice. FASB’s Concepts Statement No. 2 defines
accounting conservatism as a prudent reaction to uncertainty to try to ensure that
uncertainty and risks inherent in business situations are adequately considered
(FASB, 1982). Conservatism can be defined as a downward bias in net book value
of assets than their economic value that due to inconsistent and incomplete
identification economic in accounting profit. Standard sitting and researchers, who
presented various definitions of conservatism, that is similar above definition. For
example, The AICPA has been defined the conservatism through accounting
practice in identification profit and loss; So that the losses recognized upon the
occurrence and profits when realized. Reserves are clearly evident in FASB’s
conceptual framework (FASB, 1980, Para. 95)
As long as for performance reporting, management used the criteria and
accounting standards, moral hazard’s problems always will exist in financial
reporting. The Managers to increase their personal interest in use of accounting
standards that is the basis information to investors, bias functioned and in the
transmission information create noise. If the limits which opportunistic behavior
of the manager confine is not exit, then; the accounting figures contained in
financial reports prepare and present bias. But conservatism by requiring its
verifiable confine opportunistic and bias behavior of the managers. In practice
conservatism is neutral bias behavior of the manager and delay benefit identifiable
as a result less shown net assets and profit Ataheryan (2012) on kootanae, et al
(2013).
Givoly and Hayn (2000) indicates that there is a global trend of increased
conservatism. Accounting standards in the United States reflects a fairly high level

13
of conservatism with the issuance of new accounting standards that accelerate the
recognition of costs and delays revenue recognition. Until now there is still
disagreement about the benefits of conservatism in the financial statements. Some
researchers argue that the profits generated from the conservative method of lesser
quality, irrelevant and useless. Most other researchers argue otherwise.
Researchers who have a second view assumes that conservative earnings, which
were prepared using conservative accounting principles reflect minimal profit that
can be obtained so that the profits are compiled with conservative methods are not
an exaggerated profit value, so it can be considered as earnings quality.
5. Corporate Governance
Corporate governance is the system which companies using as guidance
and control, so it is associated mainly with the problems of management and
ownership. Sloan (2001) provides a perspective on financial accounting and
financial economics, corporate governance can be defined as follows: a
mechanism that eliminates the incentive problems arising from the separation of
management and financing companies. Thus, corporate governance is a
mechanism to solve agency problems (kootanaee, et al 2013)
Definition of corporate governance according (Griffin on Susiana and
Herawaty, 2007:7) is The roles of shareholders, directors and other managers in
corporate decision making. Good governance is an effort guided by professional
ethics in business or work. In principle, the purpose of corporate governance is to
create value for interested parties. The parties are internal parties that include
commissioners, directors, employees and external interested parties. Corporate
governance is defined as a set of rules that define the relationship between
shareholders, managers, creditors, government employees, and stakeholders both

14
internal and another external, concerning their rights and obligations, or the
system in which companies set (directed) and controlled (controlled), the purpose
of corporate governance is to create added value for stakeholders (Forum for
Corporate Governance, 2001: 2).
Decision of Minister of State-Owned Enterprises No. KEP-117 / M-MBU /
2002 defines Corporate Governance as a process and structure used by an organ of
state-owned enterprises to improve the success of business and corporate
accountability in order to create shareholder value over the long term by taking
into account the interests of other stakeholders, based on regulations legislation
and ethical values. According to Organization for Economic Cooperation and
Development (OECD), Corporate Governance is One key element in improving
economic efficiency and growth as well as enhancing investor confidence that
involves a set of relationships between a company’s management, its board, its
shareholders and other stakeholders and also provides the structure through which
the objectives of the company, the means of attaining those objectives and
monitoring performance. In this study good corporate governance proxied by two
such as as independent commissioner and managerial ownership.
a. Independent commissioner
The definition of independent commissioner in accordance with the
provisions of Bapepam No. Kep 29 / PM / 2004 is Members of the
commissioner who came from outside the issuer or public company, has
no shares, either directly or indirectly to the issuer or public company, has
no affiliation with the issuer or public company, commissioners, directors
or shareholders the main issuers or public companies and do not have a
business relationship, directly or indirectly related to the business activities

15
of the issuer or public company . Independent commissioner aims to
balance in decision-making, especially in the framework of the protection
of minority shareholders and other parties concerned (Susiana and
Herawati, 2007: 9).
According to Weisbach (1988) in Arifin (2005: 40), independence
commissioner in a company to be truly independent so that it can resist the
influence, intervention and pressure from major shareholders who have a
particular interest. As part of the supervisory organ, independent directors
are expected to have full attention and commitment in performing their
duties and obligations. To that end, independent commissioner is people
who have the knowledge, ability, time and integrity.
The existence of independent commissioner has set by Jakarta
Stock Exchange through the JSE regulations July 1, 2000. It suggests that
companies listed on the Indonesia Stock Exchange must have an
independence commissioners which is proportionately equal to the number
of shares owned by the minority shareholders (not controlling
shareholders). In this regulation, the requirements of the minimum number
of independent directors is 30% of the members of the board of
commissioner. Some of the criteria of the independent commissioner is as
follows:
1) independent commissioner has no affiliation with the majority
shareholder or controlling shareholder (controlling shareholders) listed
companies concerned;
2) independent commissioner has no relationship with the director and/or
other commissioners listed companies concerned;

16
3) independent commissioner does not have a dual position at another
company affiliated with the listed company concerned;
4) independent commissioner must understand the legislation in the field
of capital markets;
5) independent commissioner depreciated and elected by minority
shareholders who are not controlling shareholders (not controlling
shareholders) in the General Meeting of Shareholders (AGM).
b. Managerial Ownership
Midiastuty and Machfoedz (2003: 177) defines managerial
ownership as a percentage of shares owned by management and actively
participate in corporate decision which includes commissioners and
directors. Ownership of shares by companies is a mechanism that can be
used so that managers perform activities in accordance with the interests of
the owner of the company. The percentage of ownership is percentage of
shares owned by management including the percentage of shares owned by
private management.
Jensen and Meckling (1976) on Wulandari et al (2014) states that
the managerial share ownership can help unite the interests between
managers and shareholders, which means increasing the proportion of
managerial ownership, the better the performance of the company. The
existence of managerial ownership in the company can be one of the
efforts to reduce the agency problems between managers and align the
interests of managers and shareholders. The greater the proportion of
managerial ownership in the company, management tends vigorously to
the interests of other shareholders themselves.

17
6. Growth Opportunities
Growth opportunities are opportunities for growth in a company in the
future (Mai 2006). The company's growth is expected by internal and external
parties, due to good growth signaled for the development of the company. From
the perspective of investors, the growth of a company is a sign the company has a
favorable aspect, and the investor would expect a rate of return (rate of return) on
investments carried out showed good development. (Novikasari and Sofyan,
2013)
Companies that have high growth rates have minimize motivation for
profit. As Widya (2004) that the higher the rate of growth of a company, the
higher the likelihood that the company is in choosing conservative accounting
7. Sales Growth
Sales are the main operating activities of a company. Sales growth can be
interpreted as a change in sales per year. Growth in sales of a product depends on
the product life cycle. According Kotlerdan Armstrong (1997) in Abdul Aziz
(2005) there are four stages of the product life cycle that affect the sales growth
that the company's sales growth will affect the rate of accrual at companies such
as inventory, accounts receivable, and a high sales growth often increases the
market expectation of cash flows the future so that it will affect the market
conservatism (Ahmed and Duellman, 2007) in the Padmawati and Fachrurrozie
(2015).
B. Variable Interrelationship
1. Independent Commissioner and Accounting Conservatism
In carrying out its functions, independent directors will require accurate
information and quality. Conservatis is a very useful tool for the board of directors

18
(particularly the independent commissioner) in carrying out their functions as
decision makers and those who monitor management. A strong board of directors
(board of directors dominated by independent directors) will require more quality
information so that they will tend to be using more conservative accounting
principles. On the other hand, the board of directors dominated by internal parties
or board of directors who has a weak monitoring incentives will provide greater
opportunities for managers to use more aggressive accounting principles (less
conservative) (Ahmed and Duellman, 2007). Based on these descriptions
formulated the following hypotheses :
H1: How Independent Commissioner has positive effect on Accounting
Conservatism
2. Managerial Ownership and Accounting Conservatism
Research conducted by Ahmed and Duellman (2007) shows that there is a
relationship between managerial ownership with conservative accounting policy
of the company. Conflicts within the company can not be resolved when the
contract runs because it will cause huge costs. It is forcing shareholders to
complete the contract term of the contract is completed. The greater portion of
managerial ownership, the greater the pressure from outsider to applying
conservative accounting. Conservatism is considered capable of reducing the
ability of managers to present net income and overstate assets by more recognized
gain. Conservatism is also considered capable of reducing the behavior of
managers who hide information about losses. Based on these descriptions
formulated the following hypotheses :

19
H2: How Managerial Ownership has positive effect on Accounting
Conservatism
3. Growth Opportunities and Accounting Conservatism
At companies that use the principle of conservatism are reserves
Hidden is used for investment, so a conservative company synonymous with
growth companies (Barry and Wilopo, 2002). This growth will be responded
positively by investors that the market value of the company's conservative
greater than its book value that will create goodwill. The market will be
positive rate on the investment made by the company because of the
investments made now expected that the company will gain future cash flows.
Markets positive rate on the investment made by the company, because of the
investment is expected the company will gain a cash flow.
Research Feltham and Ohlson (1995) and Penman (2001) suggest that
conservative accounting is a concept that is appropriate for that concept shows
the growth of a company's net assets reported as lower than market value.
Based on these descriptions formulated the following hypotheses :
H3: How Growth Opportunities has positive effect on Accounting Conservatism
4. Sales Growth and Accounting Conservatism
The sales growth will affect the size of conservatism through the accrual
and market value (Ahmed and Duellmann 2007) .High sales growth will increase
expectations of future cash flows that can affect the conservatism market. The
company's growth in the future is a sign that the company has reached the high
level of profit. So that higher sales growth indicates that the company is more
conservative.

20
Padmawati and Fachrurrozie (2015) states that the variable sales growth
shows the influence with accounting conservatism and has a positive sign on the
coefficient. Based on the theory of signal, with the investment, the market will be
positive rate on investment by the company because of the investments made
today is expected the company will gain future cash flows. Results of research
supporting research (Feltham and Ohlson 1995 and Penman 2001 in Widya, 2005)
which states that the concept of conservative accounting shows the growth of a
company's net assets are reported as lower than the market value. Companies that
use mostly conservative principles describe a company is grows because there are
hidden investment reserves used for investments. Based on these descriptions
formulated the following hypotheses :
H4: How Sales Growth has positive effect on Accounting Conservatism
5. Independent Commissioner, Managerial Ownership, Growth Opportunities
and Sales Growth and Accounting Conservatism.
Independent commissioner, managerial ownership, growth opportunities
and related sales growth as an indicator to determine the effect on the level of
accounting conservatism on the value of the company's financial statements.
Independent commissioner, managerial ownership, growth opportunities and high
sales growth will likely reporting companies use the concept of a conservative.
Based on these descriptions formulated the following hypotheses :
H5: How Independent Commissioner, Managerial Ownership, Growth
Opportunities and Sales Growth have simultanously effect on Accounting
Conservatism

21
C. Previous Research
Table 2.1
Previous Research
No Researcher
(Year)
Title Methodology Result
Similarities Differences
1 Guna and
Herawaty
(2010)
Pengaruh
Mekanisme
Corporate
Governance,
Independensi
Auditor,
Kualitas
Audit dan
Faktor
Lainnya
Terhadap
Manajemen
Laba
Corporate
governance
mechanism,
Leverage
and
profitability
Earning
management
Auditor
Independence,
Size of the
Company. Audit
Quality, Leverage
and profitability
Variable institutional
ownership, managerial
ownership, audit
committees, board
independent and auditor
independence has no
effect on earnings
management. While
variable leverage and
audit quality effect on
earnings management.
2. Astarini
(2011)
Analisis
Faktor-Faktor
Yang
Mempengaruh
i Pilihan
Perusahaan
Terhadap
Konservatisme
Akuntansi
Accounting
conservatis
m,
Managerial
ownership
dan growth
opportunitie
s
Debt covenant Managerial ownership
and debt covenant has
significant effect on
accounting conservatism
but growth opportunities
has no effect on
accounting conservatism.
3. Sameh M.
Reda
Reyad,
2012
Accounting
Conservatism
and Auditing
Quality : an
Applied
Study On
Egyptian
Corporation
Accounting
conservatis
m
Audit quality There is positive impact
of accounting
conservatism because of
audit quality
4. Chih-Wei
Peng and
Mei-Ling
Yang
(2014)
The Effect of
Corporate
Social
Performance
on Financial
Performance:
The
Moderating
Effect of
Ownership
Concentratio
n
sales
growth
Corporate social
performance
(CSP) and
profitability
The results of the
empirical analysis
provide firm
support for the idea that
the divergence between
control
rights and the cash flow
rights of controlling
owners negatively
moderates the link
between social and short-
and
long-run FP.
22
No Researcher
(Year)
Title Methodology Result
Similarities Differences
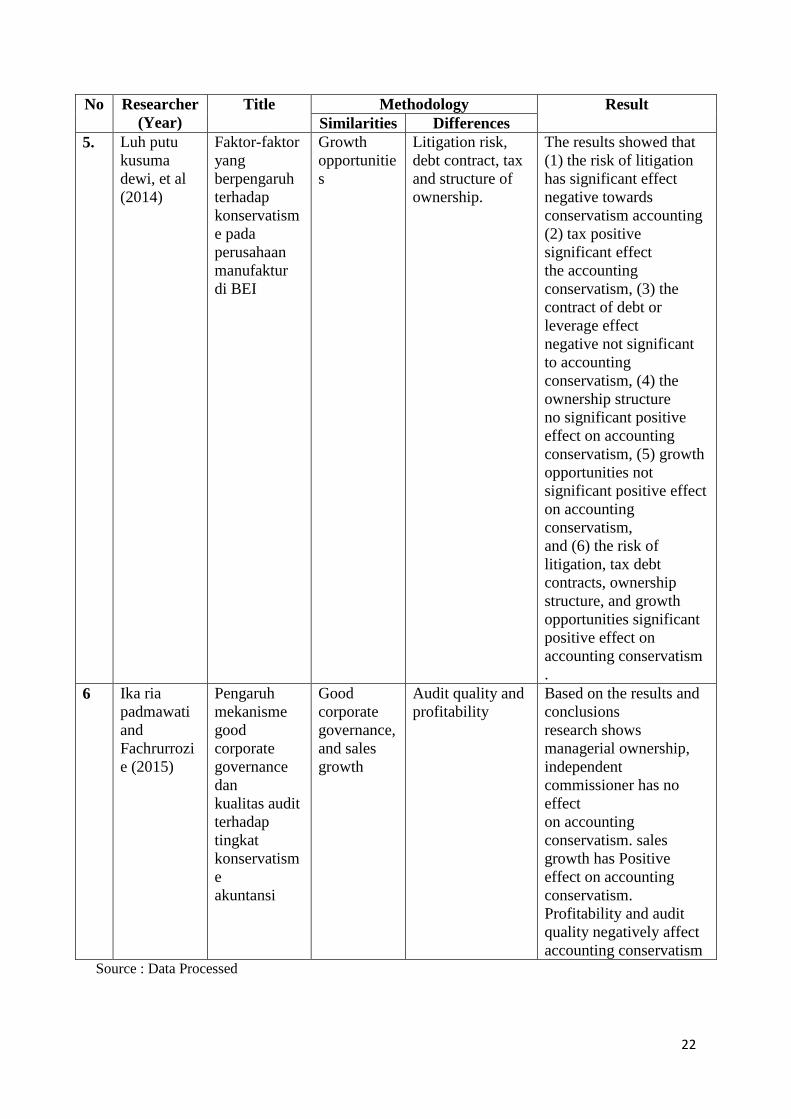
5. Luh putu
kusuma
dewi, et al
(2014)
Faktor-faktor
yang
berpengaruh
terhadap
konservatism
e pada
perusahaan
manufaktur
di BEI
Growth
opportunitie
s
Litigation risk,
debt contract, tax
and structure of
ownership.
The results showed that
(1) the risk of litigation
has significant effect
negative towards
conservatism accounting
(2) tax positive
significant effect
the accounting
conservatism, (3) the
contract of debt or
leverage effect
negative not significant
to accounting
conservatism, (4) the
ownership structure
no significant positive
effect on accounting
conservatism, (5) growth
opportunities not
significant positive effect
on accounting
conservatism,
and (6) the risk of
litigation, tax debt
contracts, ownership
structure, and growth
opportunities significant
positive effect on
accounting conservatism
.
6 Ika ria
padmawati
and
Fachrurrozi
e (2015)
Pengaruh
mekanisme
good
corporate
governance
dan
kualitas audit
terhadap
tingkat
konservatism
e
akuntansi
Good
corporate
governance,
and sales
growth
Audit quality and
profitability
Based on the results and
conclusions
research shows
managerial ownership,
independent
commissioner has no
effect
on accounting
conservatism. sales
growth has Positive
effect on accounting
conservatism.
Profitability and audit
quality negatively affect
accounting conservatism
Source : Data Processed
23
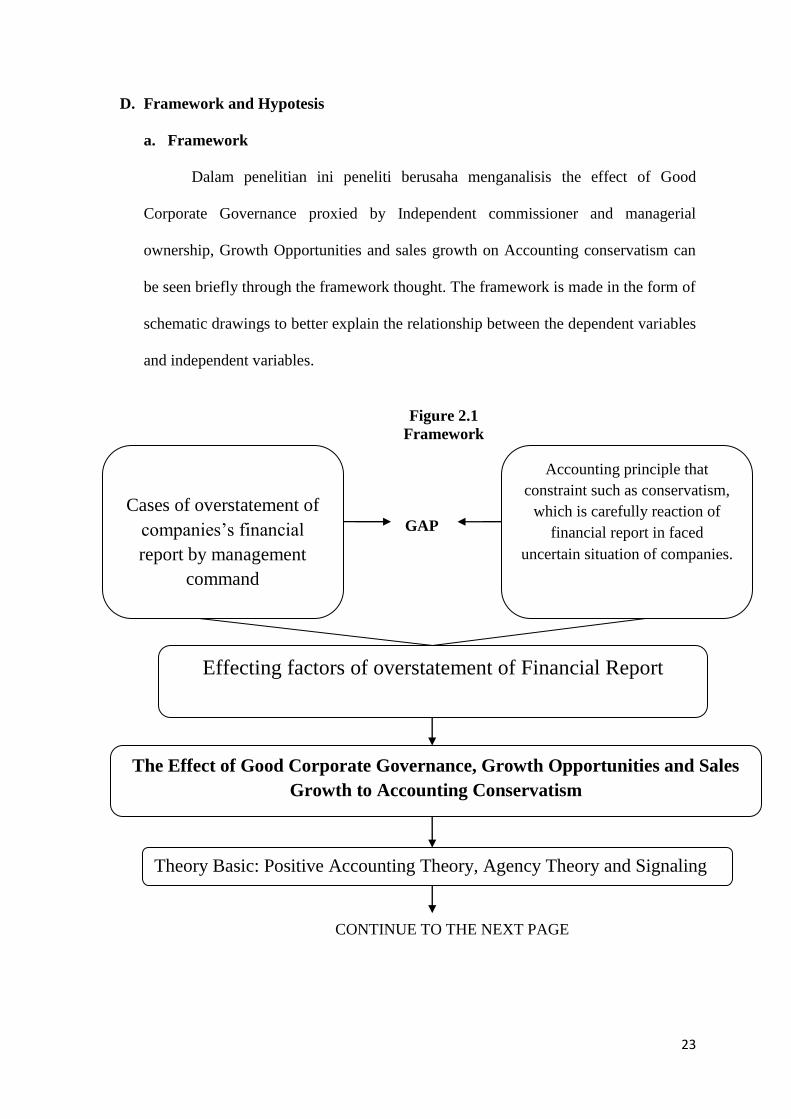
D. Framework and Hypotesis
a. Framework
Dalam penelitian ini peneliti berusaha menganalisis the effect of Good
Corporate Governance proxied by Independent commissioner and managerial
ownership, Growth Opportunities and sales growth on Accounting conservatism can
be seen briefly through the framework thought. The framework is made in the form of
schematic drawings to better explain the relationship between the dependent variables
and independent variables.
Figure 2.1
Framework
GAP
CONTINUE TO THE NEXT PAGE
Cases of overstatement of
companies’s financial
report by management
command
Accounting principle that
constraint such as conservatism,
which is carefully reaction of
financial report in faced
uncertain situation of companies.
Effecting factors of overstatement of Financial Report
The Effect of Good Corporate Governance, Growth Opportunities and Sales
Growth to Accounting Conservatism
Theory Basic: Positive Accounting Theory, Agency Theory and Signaling
ThoTheory

24
Figure 2.1 (Continuous)
H1(+)
H2 (+)
H5 (+)
H3(+)
H4(+)
Independent
Commissioner
(X1)
Managerial Ownership
(X2)
Accounting
Conservatism
(Y)
Growth Opportunities
(X3)
Sales Growth
(X4)
ANALYTICAL DATA METHOD:
1. Descriptive Statistics
2. Classical Assumption Test
3. Koefficient Determination Test
4. Hypothesis Test
Test Result and Discussion
Conclusion

25
b. Hypothesis
Of the framework that has been put forward before it can be concluded hypothesis
of this st
udy are:
1. H1: Independent commissioner has positive effect on Accounting
Conservatism
2. H2: Managerial Ownership has positive effect on Accounting Conservatism
3. H3: Growth opportunities has positive effect on Accounting Conservatism
4. H4: Sales Growth has positive effect on Accounting Conservatism
5. H5: Independent commissioner, Managerial Ownership, Growth opportunities
and Sales Growth has simultanously effect on Accounting Conservatism

26
CHAPTER III
RESEARCH METHODOLOGY
A. Research Scope
The population in this study are the companies listed on the Indonesian
Stock Exchange (IDX). The object of this study is a LQ45 companies listed on
Indonesian Stock Exchange. The research period in 2011 - 2014
B. Sampling Method
Samples in this study are LQ45 companies listed on the Stock Exchange in
the period 2011 - 2014. Companies sampled in this study were selected using
purposive sampling method, namely the collection of data by using terms and on
certain criteria. So the sample is selected based on considerations directly
researcher with the terms sample represents the population and in accordance with
the desired characteristics in the study, as follows:
1. The Company is engaged in LQ45, which is listed on the Indonesia Stock
Exchange (IDX) in 2011 - 2014.
2. Companies were listed on LQ45 Companies at least 3 years in research period
3. The Company publishes its financial statements for the period 2011 - 2014.
4. The financial statements used are financial statements audited by independent
auditors.
5. The financial statements used are expressed in Rupiahs.
6. There completeness of the data needed in a row from 2011 - 2014.
26
27
C. Data Collection Method
In obtaining the data in this study, researchers used data that has been
available. The data will be used in this research is secondary data taken from the
annual financial statements. The data used in this study comes from an external
source, companies’s Financial Report listed on the Stock Exchange in the period
2011 - 2014 were obtained from the company's annual financial report obtained
from the website Indonesian Stock Exchange (IDX) is www.idx.co.id , Indonesian
Capital Market Directory (ICMD).
D. Analysis Method
The analytical tool used in this research is multiple linear regression using
SPSS, where the regression equation contains elements of interaction
(Multiplication of two or more independent variables). This interaction test used
to determine the extent of interaction variables can independent commissioner,
managerial ownership, growth opportunities and sales growth influencing
Accounting Conservatism.
1. Desriptive Analysis
Descriptive Analysis were used to describe the variables in this study, the
level of Accounting conservatism, good corporate governance, growth
opportunities and sales growth on companies listed on the Stock Exchange.
Descriptive statistics will provide an overview of each of the variables. The
analytical tool used is the average value (mean), distribution frequency, minimum
and maximum values and standard deviation (Ghozali, 2011)

28
2. Classic Assumption Test
Classic assumption test aims to obtain regression results can be
accounted for and have results that are not biased or Best Linear Unbiased
Estimator (BLUE). Assumptions that must be met, of the test are normality
test, autocorrelation test, multicollinearity test and heterocedasticity test.
a. Normality Test
Normality test aims to test whether the regression model, the
disturber variables or residuals have a normal distribution. There are two
ways to detect whether or not residual normal distribution, namely by
looking at the analysis graph normal probability plot and statistical tests.
The regression model that has a data distribution is normal or near-normal
regression model is said to be good (Ghozali, 2011). In principle normality
can be detected by looking at the spread of the data (points) on the
diagonal axis of the graph or to view the histogram of the residual. The
basis for a decision as follows:
a. If the data is spread around the diagonal line and follow the direction of
the diagonal line or histogram graph showing a normal distribution pattern,
then the regression model to meet the assumption of normality.
b. If the data are spread far from the diagonal and does not follow the
direction of the diagonal line or histogram chart, present a normal
distribution, then the regression model did not meet the assumption of
normality.
b. Multicollinearity Test
Multicoloniarity test aims to test whether the regression model
found a correlation between independent variables . Multicoloniarity occur
29
in logistic regression analysis when the independent variables are
correlated between. Mutikolonieritas can be seen from:
• The value of tolerance and the opponent
• Variance Inflation Factor (VIF)
The results of these tests can be seen from VIF VIF using the
equation = 1/tolerance. If VIF <10 then there is no multicollinearity.
(Ghozali, 2011)
c. Heterocedasticity Test
Heterocedasticity test aims to test whether the regression model
occurred inequalities residual variance from one observation to another
observation. If the variance of the residuals of the observations to other
observations remain, then called Homoskedastisitas, and if different called
Heteroskidastity. This test can be done by looking at the graph plot
between the predicted value of the variable (ZPRED) with residual value
SREID. A good regression model if the residual variance from one
observation to another permanent, so that there is no identifiable
heteroskedastisitas (Ghozali, 2011).
d. Autocorrelation Test
Autocorrelation test whether a correlation exists between the
regression model error bullies in the current period (t) with an error in the
previous period (t-1). A good regression model is a regression that is free
from autocorrelation. If there is a correlation, then there is a problem
called autocorrelation. Autocorrelation arise because successive

30
observation at all times in relation to each other. This test uses a model
Durbin Watson (DW-Test). The hypothesis to be tested are:
Ho = no autocorrelation (r = 0),
Ha = no autocorrelation (r ≠ 0)
If the value of DW is greater than the upper limit or the upper
bound (du) and less than (4- du) means no autocorrelation (Ghozali, 2011).
3. Hypothesis Testing
a. Coefficient of Determination
Cox and Snell R Square and Nagelkerke R Square is a measure that
seeks to imitate the size of R2 in multiple regression based on Likelihood
estimation techniques. Nagelkerke R Square easier to interpret than Cox
and Snell R Square so as to know how much variability in the dependent
variable that can be explained by the independent variables can be seen
from the Nagelkerke R Square. Nagelkerke's R Square is a modification of
the coefficient Cox and Snell to ensure that its value varies from 0 (zero)
to 1 (one). This is done by dividing the value of Cox and Snell 's R2 with
maximum value. Nagelkerke's R Square value can be interpreted as the
value of R2 in the multiple regression. A small value means the ability of
the independent variables in explaining the variation of the dependent
variable is very limited. Approximate value of the independent variables
provide almost all the information needed to predict the variation of the
dependent variable.
b. Multiple Linear Regression Analysis
The analysis used in this research is multiple linear regression,
namely by looking at the effect of Good Corporate Governance proxied by

31
Independent Commissioner and Managerial ownership, Growth
Opportunities, and Sales Growth to Accounting Conservatism on the LQ
45 companies listed on the Indonesian Stock Exchange (IDX) , The
regression model in this study are as follows:
CONS it = β0 + β1 Indepentit + β2 Managit + β3 GO + β4 SGit + e
Where :
CONS : The Level of the Accounting Conservatism are
measured using the Feltham and Ohlson Model (Kootanaee, et al 2013)
Indepent : The existence of independent commissioner is measured by
calculated number of independent commissioner divided by total number
of commissioner in the company (Padmawati and Fachrurrozie, 2015)
Manag : Managerial Ownership, measured by the percentage of shares
owned by Management and actively participate in corporate decision
which includes commissioners, directors and its afiliation (Padmawati and
Fachrurrpzie, 2015)
GO : To measure growth opportunities of the company by
calculated market to book value of equity according to (Novikasari and
Sofyan, 2013)
SG : to measure for sales growth ratio by calculated change of
sales divided by net sales (Padmawati and Fachrurrozie, 2015)
E : error

32
c. Simultaneous Significant Test (F-Test)
The statistical test F basically indicates whether all the independent
variables included in the model have influence together on the dependent
variable. The null hypothesis (Ho) to be tested is whether all of the
parameters in the model is equal to zero, or
H0: b1 = b2 = b ... = bk = 0
This means that if all the independent variables is not a significant
explanatory on the dependent variable. The alternative hypothesis (Ha),
not all parameters simultaneously equal to zero, or:
Ha: b1 ≠ b2 ≠ ... ≠ bk ≠ 0
That is, all independent variables simultaneously is a significant
explanatory on the dependent variable. Testing criteria used are:
-If F count> F table then Ho is rejected
-If F count <f table then Ho is accepted
d. Significant Partial Test (T-Test)
T tests were used to determine the effect of independent variables (X1, X2,
X3, X4) alone or each dependent variable Y (Ghozali, 2007: 84-85). The
null hypothesis (Ho) to be tested is whether a parameter (bi) is equal to
zero or:
Ho: bi = 0
This means that if an independent variable is not a significant explanatory
on the dependent variable. The alternative hypothesis (Ha), a variable
parameter is not equal to zero, or:
Ha: bi ≠ 0
33
This means that these variables are significant explanatory on the
dependent variable. Testing criteria: -If t <t table then Ho is rejected -If t>
t table then Ho is accepted to measure the value t table, determined
significance level of 5 percent with degrees of freedom df = 4 n is the
number of observations.
E. Operational Research Variable
The data in this study can be grouped into two variables:
1. Dependent Variable
The dependent variable is the variable that is a major concern of
researchers. In this study, researchers took the Accounting Conservatism
(Y) as the dependent variable component. In this study conservatism
applied to the model of Feltham and Ohlson model (1995).
The idea underlying the use of MTB (or BTM) as a measure of
accounting conservatism is that, ceteris paribus, a conservative accounting
system tends to depress the net book values of a firm relative to the firm
economic value. Therefore, a higher MTB (and a lower BTM) implies a
higher degree of accounting conservatism, and vice versa. The MTB
measure is strongly rooted in the analytical work based on the Residual
Income Valuation Model (RIVM). Feltham and Ohlson first introduced
accounting conservatism in the RIVM context, and characterize
conservatism as a tendency to bias downwards the book value of a firm
relative to its market value. This manifestation of conservatism has been
carried into later analytical works on conservatism such as Beaver and
Ryan (Wang, 2009). Thus, this study was calculated to summarize the
degree of conservatism:

34
CONSit =
In this relationship:
MV it: The market value of equity of firm i in the end of year t.
- Where MV were formulated from :
MV = Outstanding shares x Stock Price
BV it: The Book value of equity of firm i in the end of year t.
- Where BV were formulated from :
BV = Outstanding shares x nominal value of shares
2. Independent Variables
Independent variables are variables that affect the dependent variable,
either positively or negatively. If there is a dependent variable, the
independent variables must also be present, and in each unit increase in the
independent variable nature there will be also an increase or decrease in the
dependent variable.
a. Independent Commissioner
Independent commissioner is a commissioner who is not
affiliated with management, other board members and controlling
shareholders, as well as free of a business relationship and other
relationships which may affect its ability to act independently or act
solely semi interests of the company (NCG, 2004 in Guna and
Herawaty, 2010: 6). In this research The existence of independent
commissioner is measured by calculated number of independent

35
commissioner divided by total number of commissioner in the
company ( Wardhani, 2008 on Padmawati, 2015)
Independent commissioner
= ∑
∑
b. Managerial Ownership
Managerial Ownership Measured by the percentage of shares
owned by Management and actively participate in corporate decision
which includes commissioners, directors and its afiliation (Padmawati
and Fachrurrozie, 2015)
Managerial Ownership = ∑
∑
c. Growth Opportunities
Growth Opportunities is an opportunity to grow the company to
expand the company by investing or by creating hidden reserves.
Calculations using the opportunity to grow with the market-to-book
value of equity according to research conducted by Astarini (2011).
The scale of this variable data is the ratio. To measure the growth
opportunities of the company
Market to book value of equity :
d. Sales Growth
Sales growth is defined as the change in sales per year.
Sales growth ratio is used to measure changes in the company's
sales per year. High sales growth often increases the market
expectation of future cash flows that will affect the market
36
conservatism (Ahmed and Duellman, 2007). To measure the sales
growth ratio used the following formula:
Sales growth =
TABLE 3.1
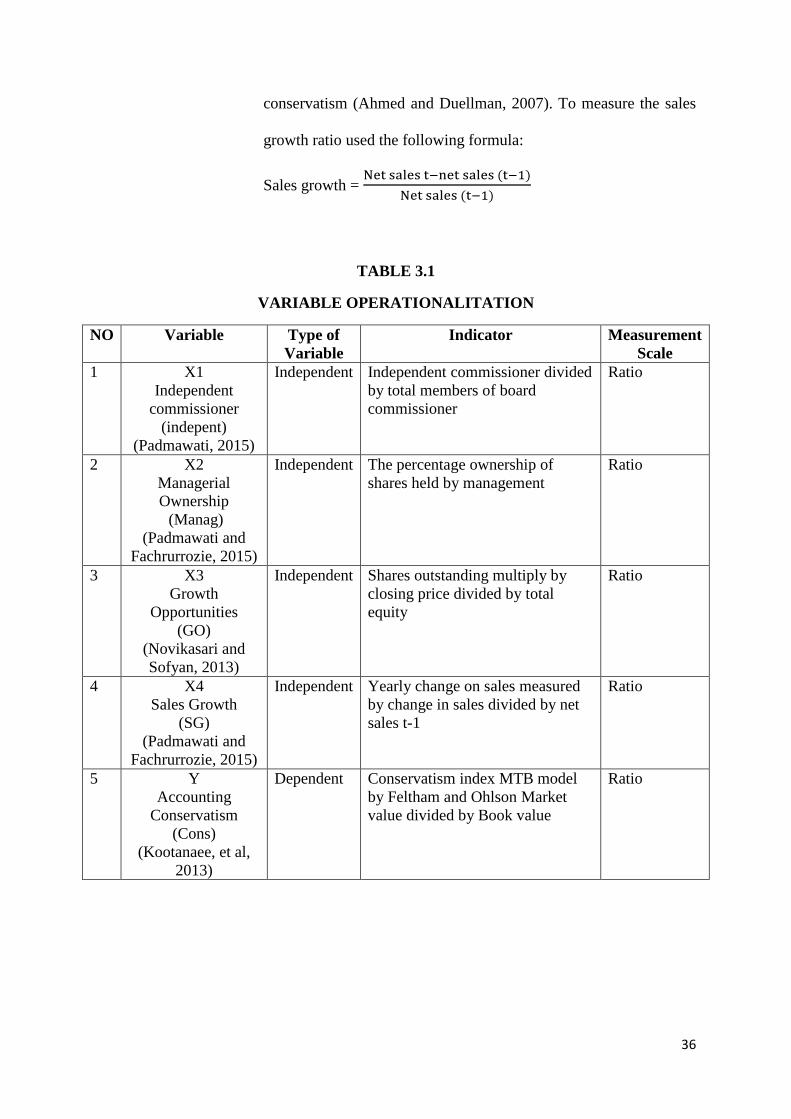
VARIABLE OPERATIONALITATION
NO Variable Type of
Variable
Indicator Measurement
Scale
1 X1
Independent
commissioner
(indepent)
(Padmawati, 2015)
Independent Independent commissioner divided
by total members of board
commissioner
Ratio
2 X2
Managerial
Ownership
(Manag)
(Padmawati and
Fachrurrozie, 2015)
Independent The percentage ownership of
shares held by management
Ratio
3 X3
Growth
Opportunities
(GO)
(Novikasari and
Sofyan, 2013)
Independent Shares outstanding multiply by
closing price divided by total
equity
Ratio
4 X4
Sales Growth
(SG)
(Padmawati and
Fachrurrozie, 2015)
Independent Yearly change on sales measured
by change in sales divided by net
sales t-1
Ratio
5 Y
Accounting
Conservatism
(Cons)
(Kootanaee, et al,
2013)
Dependent Conservatism index MTB model
by Feltham and Ohlson Market
value divided by Book value
Ratio

37
CHAPTER IV
FINDING AND ANALYSIS
A. General Description of Research Object
The study used a population of LQ 45 companies listed on the Indonesia Stock
Exchange (IDX) in the period 2011-2014. The sample used in this study were selected
by purposive sampling. LQ 45 companies selected in this study because it has a high
level of liquidation, market capitalization, and the prospects of sales growth. Based on
data obtained from the Indonesia Stock Exchange through its official website
www.idx.co.id only as many as 21 companies that meet the criteria of the study
sample had been applied. Here is a summary of the acquisition of samples of the study
:
Table 4.1
Detail of samples
No Details Amount
1 LQ45 companies listed on IDX 45
2 LQ45 companies listed three consecutive years in the
year of observation 25
3 LQ45 companies which publish its financial
statements in denominations other than the rupiahs 4
4 Company used as sample of observations 21
Years of observation 2011 – 2014 4
The number of research samples 84
Source : Data Processed
Based on purposive sampling method, acquired 21 companies that meet the
specified criteria so that it can be used as a sample in this study during the 4 years of
observation, in order to obtain as many as 21 x 4 = 84 observation data. The list of
companies sampled in this study as follows:
37

38
Table 4.2
Companies Name List
No Companies Name Code
1 PT Astra Agro Lestari AALI
2 PT Adhi Karya ADHI
3 PT AKR Corporindo AKRA
4 PT Aneka Tambang ANTM
5 PT Astra International ASII
6 PT Alam Sutera Realty ASRI
7 Bank BNI BBNI
8 Bank BRI BBRI
9 Bank Danamon BDMN
10 Bank Mandiri BMRI
11 PT Global Mediacom BMTR
12 PT Bumi Serpong Damai BSDE
13 PT XL Axiata EXCL
14 PT Indocement Tunggal Prakasa INTP
15 PT Jasa Marga JSMR
16 PT Lippo Karawaci LPKR
17 PT Perusahaan Perkebunan London Sumatera
Indonesia
LSIP
18 PT Media Nusantara Citra MNCN
19 PT Bukit Asam PTBA
20 PT Pakuwon Jati PWON
21 PT Telkom Indonesia TLKM
Source: www.idx.co.id
B. Analysis and Discussion
1. Descriptive Statistics
Research variables used in this study include Good corporate governance
that consists of managerial ownership and independent commissioners, growth
opportunities and sales growth as an independent variable while the dependent
variable is accounting conservatism. Descriptive statistical test result can be seen
in Table 4.3.

39
Table 4.3
Descriptive Statistics Test Result
Descriptive Statistics
N Minimum Maximum Mean Std. Deviation
Cons (Y) 84 10.00 50.20 22.0985 9.24824
indepent (X1) 84 .25 .67 .4179 .09946
Manag (X2) 84 .00 .50 .2726 .13340
GO (X3) 84 .13 9.94 2.6668 1.66203
SG (X4) 84 -.34 .57 .2311 .15034
Valid N (listwise) 84
Source: Data processed
Table 4.3 Shows the descriptive statistics for the independent variables and
the dependent variable. Based on Table 4.3, the results of the analysis using
descriptive statistics of the Independent commissioner (Indepent) indicates the
minimum value of 0.25 maximum value of 0.67 with an average of 0.4179 and a
standard deviation of 0.09946. In variable Managerial ownership (Manag)
indicates the minimum value of 0, the maximum value of 0.50 with an average of
0.2726 and a standard deviation of 0.13340. Growth opportunities in the variable
(GO) indicates the minimum value of 0.13 maximum value of 9.94 with an
average of 2.6668 and a standard deviation of 1.66203. Variable Sales Growth
(SG) indicated a minimum value of -0.34, the maximum value of 0.57 with an
average of 0.2311 and a standard deviation of 0.15034 Whereas, Accounting
conservatism (Cons) indicates a minimum value of 10, the maximum value of
50.20 with an average of 21.9770 and a standard deviation of 8.93653

40
2. The Result of Data Quality Test
a. The Result of Normality Test
Normality of the data was tested using the Kolmogorov-Smirnov Z
with a significant level of 0.05. From the Kolmogorov-Smirnov test Z has
done Kolmogorov-Smirnov Z values of 0.996 and significant of 0.275 more
than 0.05 means that it can be considered fulfilled normality test (Sufren and
Natanael, 2014). Here is the data normality test results:
Table 4.4
Data Normality Test Results
One-Sample Kolmogorov-Smirnov Test
Unstandardized
Residual
N 84
Normal Parametersa,,b
Mean .0000000
Std. Deviation 7.77218021
Most Extreme Differences Absolute .109
Positive .109
Negative -.045
Kolmogorov-Smirnov Z .996
Asymp. Sig. (2-tailed) .275
a. Test distribution is Normal.
b. Calculated from data.
Source: Data Processed
b. The Result of Multicollinearity Test
Multicollinearity testing in this study conducted by looking at the value
of collinearity statistics and the correlation coefficient between independent
variables. The test results shown in table 4.5

41
Table 4.5
Multicollinearity Test Results
Coefficientsa
Model
Collinearity Statistics
Tolerance VIF
1 indepent
(X1)
.918 1.090
Manag (X2) .950 1.053
GO (X3) .961 1.041
SG (X4) .942 1.062
Source: Data Processed
Multicolinearity test aims to test whether the regression model found a
correlation between independent variables. A good regression model should
not happen correlation between independent variables. Multikoloniaritas
occurs when (1) the value of tolerance (Tolerance <0.10) and (2) variance
inflation factor (VIF> 10). Based on Table 4.5 indicates VIF of Indepent,
manag, GO and SG is smaller than 10. Meanwhile, tolerancenya value greater
than 0.10. This suggests that the independent variables in this study are not
correlated so that the model does not contain multicollinearity (Sufren and
Natanael, 2014).
c. The Result of Heteroscedasticity Test
Results heteroscedasticity in this study by looking at the scatterplot
graph among other residue SDRESID dependent variables with independent
predictive value variable ZPRED. Detection of the presence or absence
heterokedastisitas can be seen where Y is the residual value and the value of X
is the predicted value. The scatterplot graph can be seen from Figure 4.1

42
Based Scatterplot image above can be concluded that there is
no clear pattern, as well as the points spread. Thus, the analysis model
can be concluded not happen heterocedastisity (Sufren and Natanael,
2014).
d. The Result of Autocorrelation Test
Autocorrelation test is used to determine and detect the presence of
autocorrelation. Autocorrelation in this research is using Durbin Watson. A
good model is a regression model that is free from autocorrelation.
Autocorrelation test results shown in Table 4.6
Table 4.6

43
Autocorrelation Test Results
Model Summaryb
Model R R Square Adjusted R Square
Std. Error of the
Estimate Durbin-Watson
1 .542a .294 .258 7.96651 1.814
a. Predictors: (Constant), SG (X4), GO (X3), Manag (X2), indepent (X1)
b. Dependent Variable: Cons (Y)
Source: Data Processed
If the numbers Durbin Watson below -2 means there is positive
autocorrelation, when between -2 to 2 means no autocorrelation, while more
than 2 means there is a negative autocorrelation. The results of data
processing showed that D-W = 1.814. so that, there is no autocorrelation
(Sufren and Natanael, 2014).
3. Hypothesis Testing
a. Coefficient of Determination (R2)
Table 4.7
Coefficient Determination Test Results (R2)
Model Summaryb
Model R R Square Adjusted R Square
Std. Error of the
Estimate Durbin-Watson
1 .542a .294 .258 7.96651 1.814
a. Predictors: (Constant), SG (X4), GO (X3), Manag (X2), indepent (X1)
b. Dependent Variable: Cons (Y)
Source: Data Processed
The result of the calculation produces adjusted R-square is equal to
0.258 or 26% which demonstrates the ability Indepent, manag, GO and SG in

44
explaining the variations that occur in accounting conservatism by 26% while
the remaining 74% is explained by other variables not examined in this study.
To avoid bias, the coefficient of determination used in this research is by using
Adjusted R Square because it can go up or down if the independent variable is
added to the model. If the test Adjusted R Square obtained value is negative,
then the value of Adjusted R Square is zero (Kuncoro, 2009: 221).
b. Multiple Regression Analysis Result
Multiple regression analysis is used to describe the relationship of
variables - independent variables are Indepent, Manag, GO and SG on the
dependent variable, namely Accounting conservatism. The results of multiple
regression analysis are shown in Table 4.8:
Table 4.8
Multiple Regression Data Results
E
s
t
i
m
a
Estimation Model :
Y = 17.196 + (-8.538)X1 + (-7.494)X2 + (2.718)X3 + (14.122)X4 + e
Coefficientsa
Model
Unstandardized Coefficients
Standardized
Coefficients
T Sig. B Std. Error Beta
1 (Constant) 17.196 4.541 3.787 .000
indepent (X1) -8.538 9.178 -.092 -.930 .355
Manag (X2) -7.494 6.725 -.108 -1.114 .269
GO (X3) 2.718 .537 .489 5.064 .000
SG (X4) 14.122 5.994 .230 2.356 .021
a. Dependent Variable: Cons (Y)

45
From the table above it can be seen that the value of the constant is
17.196, Indepent coefficient of -8.538, Manag coefficient of -7.494, GO
coefficient of 2.718, the coefficient SG amounted to 14.122.
α 17.196, This means that if the independent variable managerial ownership,
indepedent commissioner, growth opportunities and sales growth is zero, then
the dependent variable accounting conservatism will be worth 17.196 units.
β -8.538, means that if the Independent Commissioner variable increases by
one unit and the other variables constant, the dependent variable is the
accounting conservatism will be decreased 8.538units.
β -7.494, This means that if the variable Managerial Ownership increased by
one unit and the other variables constant, the dependent variable is the
accounting conservatism will decrease 7.494units.
β 2.718, This means that if the variable Growth Opportunities increased by
one unit and the other variables constant, the dependent variable is the
accounting conservatism will increase 2.718 units.
β 14.122, This means that if the variable Growth Sales increased by one unit
and the other variables constant, the dependent variable is the accounting
conservatism will increase 14.122 units.
The following are the test results of individual parameter significance
of each independent variable on the dependent variable:
1). Independent commissioner
46
See table 4.8 regression coefficient of -8.538 and Tcount value of -0.930 with
a significant value of 0.355greater than (α) 0.05, then it can be concluded that
the Independent commissioner has no effect on accounting conservatism
(Sufren and Natanael, 2014).
2). Managerial Ownership
See table 4.8 regression coefficient of -7.494and Tcount value of -1.114 with a
significant value of 0.269 greater than (α) 0.05, then we can conclude that
managerial ownership has no effect on accounting conservatism (Sufren and
Natanael, 2014).
3). Growth Opportunities
See table 4.8 regression coefficient of 2.718 and the value Tcount of 5.064
with significant value of 0.000 smaller than (α) 0.05, then it can be concluded
that growth opportunities has effect on accounting conservatism (Sufren and
Natanael, 2014).
4). Sales Growth
See table 4.8 regression coefficient of 14.122 and Tcount of 2.356 with
significant value of 0,021 is smaller than (α) 0.05, then it can be concluded
that the sales growth has effect on accounting conservatism (Sufren and
Natanael, 2014)
c. Significant Partial Test (T-Test)
1. The effect of Independent commissioner to Accounting conservatism
47
This study aimed to test the existence of an independent
commissioner to accounting conservatism. Tcount of -0.930 with a
significant value of 0.355 greater than (α) 0.05 so it can be stated that H1
Rejected (Sufren and Natanael, 2014). Because the commissioner
independent variables showed a negative effect on the accounting
conservatism and different result with the beginning hypotesis. This is
because the proportion of independent directors on the company LQ 45
listing on the Stock Exchange during the observation period is still low.
Seen on the descriptive statistical analysis results average value that is
equal to 0.4179.
It shows that the most sampled companies still have number of
independent directors in the range of a minimum average of 40% a little
more than what has been required by Bapepam as much as 30%. The low
proportion of independent commissioners in this study suggests that the
monitoring activity undertaken by independent directors in a company is
not optimally used as a tool to monitor management. The existence and the
appointment of independent board is done just to meet the regulations
could be the cause of an independent commissioner does not have a
significant effect. Research in support of research conducted by
Padmawati and Fachrurrozie (2015) were unable to prove the influence of
independent directors on accounting conservatism.
The results of this study different from the results of research
Rahmawati (2010) where the research results show that the independence
of commissioners has a significant influence on accounting conservatism
as measured by the size of the accrual. The difference is because the

48
research results in research Rahmawati (2010) uses a manufacturing
company as a sample and measurement using measurement accrual
accounting
2. The effect of Managerial Ownership to Accounting Conservatism
This study aimed to examine the effect of managerial ownership on
accounting conservatism. Tcount of -1.114 with a significant value of
0.269 greater than (α) 0.05 so it can be stated that H2 Rejected (Sufren
and Natanael, 2014). Because of managerial ownership variable showed a
negative effect on accounting conservatism and different result with the
beginning hypotesis. Because the proportion of managerial ownership in
companies LQ 45 listed in the Stock Exchange during the observation
period is low resulting in a company tend managerial above selfish
interests and not based on the maximization of value in the company's
financial decision making, so often a conflict between managerial and
shareholder. The absence of the effect of managerial ownership
conservatism due to an attempt to gain recognition from outsiders to
provide reporting higher earnings in order to obtain a greater investment
by the manager. This research was supported research Padmawati and
Fachrurrozie (2015) were not able to prove the effect of managerial
ownership on accounting conservatism.
The results of this study different from the results of research Dewi
(2013) where the research results show that the effect of managerial
ownership structure significantly positive on accounting conservatism.
This difference is due in research Dewi (2013) performed at a
manufacturing company in Indonesia Stock Exchange 2009-2011.
49
3. The effect of Growth Opportunities to Accounting Conservatism
This study aimed to examine the effect of Growth Opportunities to
accounting conservatism. Tcount amounted to 5.064 with significant value
of 0.000 smaller than (α) 0.05 so it can be stated that H3 Accepted
(Sufren and Natanael). It means that GO positive effect on accounting
conservatism. Companies that use conservative principles contained
hidden reserves used for investments, so a conservative company tends to
growing companies (Barry and Wilopo, 2002). This growth will be
assessed responsive to investors because the company's market value is
higher than the conservative book so that there will be goodwill. This
would make the market and investors assess positively to the company.
This state can show that the company is always growing due to ever-
increasing assets.
Growth opportunities will be reflected in higher earnings potential
of a company. This could increase the costs and political risks should be
borne by the company. Therefore the company is growing its earnings tend
to report conservatively in order to reduce costs and political risks are
high. It is also do to reduce excessive attention from regulators and
securities analysts. Saputro and Setiawati (2004) found that companies
with a high growth rate also motivated to minimize profit.
A high level of profitability that can be read by regulators and other
parties as profit levels that are too high and trigger higher demand for the
company or even suspicions of monopoly. The results of this study are
consistent with the findings of research conducted by Widya (2005), where
Widya find that the growth effect on conservatism, ie the company that

50
uses the principle of conservative accounting contained hidden reserves
used for investments, so a conservative company synonymous with growth
companies.
The results of this study different from the results of research
Astarini (2011) where the results showed no significant relationship
between the variables growth opportunities to accounting conservatism.
The difference this study because the study used a sample of 14
manufacturing companies in the Indonesia Stock Exchange (BEI) in the
study period 2006 - 2009. Testing of this research is done by using logistic
regression.
4. The effect of Sales Growth to Accounting Conservatism
This study aimed to examine the effect of sales growth towards
conservatism. Tcount amounted to 2.356 with significant value of 0,021 is
smaller than (α) 0.05 so it can be stated that H4 Accepted (Sufren and
Natanael, 2014). Variable sales growth showed a positive effect on
accounting conservatism. Based on the theory of signals, with their
investment, the market will be positive rate on the investment made by the
company because of the investments made now expected that the company
will gain in the future cash flows. The results of the research is supporting
the research (Padmawati and Fachrurrozie, 2015) which shows that sales
growth has significant effect on accounting conservatism. This is because
companies that use mostly conservative principles describes the company
grows because there are hidden investment reserves used for investments
The results of this study different from the results of research
Hayati (2015) which showed that Sales Growth had no effect on

51
Accounting Conservatism. The difference this study due to differences in
sample size and sample period research sample. Hayati (2015) use 12
companies as sample with the research period from 2009 to 2013.
d. Simultaneous Significant Test (F-Test)
Table 4.9
Simultaneous Test Results
ANOVAb
Model Sum of Squares df Mean Square F Sig.
1 Regression 2085.218 4 521.305 8.214 .000a
Residual 5013.763 79 63.465
Total 7098.981 83
a. Predictors: (Constant), SG (X4), GO (X3), Manag (X2), indepent (X1)
b. Dependent Variable: Cons (Y)
Source: Data Processed
Simultaneous test shows that the results are significant at a = 0.05, is equal
to 0.000 means significant value 0.000 <0.05. It showed that simultaneous
(Together) independent variables have a significant effect on the dependent
variable means the independent variables are independent commissioener,
managerial ownership, growth opportunities and sales growth simultaneously
effect on accounting conservatism, so H5 Accepted (Sufren and Natanael, 2014)

52
CHAPTER V
CONCLUSION
A. Conclusion
From the results of research conducted on the effect of good corporate
governance, growth opportunities and sales growth to accounting conservatism in the
LQ 45 Companies listed on the Indonesian Stock Exchange during the period 2011-
2014, it can be concluded as follows:
1. These results indicate that independent commissioner has no effect on accounting
conservatism in LQ 45 companies listed in Indonesian Stock Exchange with value
of Tcount of -0.930 with a significant value of 0.355 greater than (α) 0.05.
Research supporting the research conducted by Padmawati and Fachrurrozie
(2015) were unable to prove the influence of independent commissioner on
accounting conservatism.
2. These results indicate that managerial ownership has no effect on accounting
conservatism in LQ 45 companies listed in Indonesian Stock Exchange with value
of Tcount of -1.114 with a significant value of 0.269 greater than (α) 0.05. This
research was supporting research Padmawati and Fachrurrozie (2015) were not
able to prove the effect of managerial ownership on accounting conservatism
3. These results indicate that growth opportunities has effect on accounting
conservatism in LQ 45 companies listed in Indonesian Stock Exchange with the
value of Tcount of 5.064 with significant value of 0.000 smaller than (α) 0.05.
The result of this study is consistent with the findings of research conducted by
Widya (2005), where Widya find that the growth opportunities has effect on
accounting conservatism.
52

53
4. These results indicate that sales growth has effect on accounting conservatism in
LQ 45 companies listed in Indonesian Stock Exchange with the value of Tcount of
2.356 with significant value of 0,021 is smaller than (α) 0.05. The results of the
research is supporting the research Padmawati and Fachrurrozie (2015) which
shows that sales growth has significant effect on accounting conservatism.
5. These results indicate that independent commissioner, managerial ownership,
growth opportunities and sales growth simultaneously have effect on accounting
conservatism in LQ 45 companies listed in Indonesian Stock Exchange with value
of Fcount of 8.214 with significant value of 0.000 is smaller than 0.05.
B. Recommendation
Based on the result of the study, the author put forward some suggestions as follows:
1. For the management of LQ 45 Companies is expected to reveal more fully in
accounting conservatism.
2. For the government and the IAI is expected to formulate the policy in order to
make financial statements are conservatif.
3. For further research, we recommend using the entire sample of companies listed
on the Indonesian Stock Exchange, in order to represent all companies in
Indonesia.
4. Researcher should further increase the independent variables, as more and more
independent variables can increase the likelihood Adjusted R Square to explain
the accounting conservatism.
5. For further research, we recommend adding the study periods. More research
period will be more support variables revealed like type of industry, company
profile and etc.

54
REFERENCES
Ahmed and Duellman. 2007. Accounting Conservatism and Board of Director
Characteristics: An Empirical Analysis. Available online at http:// www.ssrn.com.
Almilia, Luciana Spica. 2005. Pengujian Size Hypothesis dan Debt/Equity
Hypothesis yang Mempengaruhi Tingkat Konservatisma Laporan Keuangan
Perusahaan dengan Tehnik Analisis Multinomial Logit. Jurnal Bisnis dan Akuntansi,
Vol. 7.
Arifin, Z. 2005. Hubungan antara Corporate Governance dan Variabel
Pengurang Masalah Agensi. Jurnal Siasat Bisnis , Vol.1 No.10, pp.39-55.
Astarini, Dwi. 2011. Analisis Faktor-Faktor Yang Mempengaruhi Pilihan Perusahaan
Terhadap Konservatisme Akuntansi. Skripsi universitas Pembangunan Nasional
veteran.
Ball, R and Shivakumar, L. 2005. Earnings quality in UK private firms: Comparative loss
recognition timeliness. Journal of Accounting and Economics, 39(1): 83-128.
Belkaoui and Ahmed. 2000. Accounting Theory. Edisi Kelima, Terjemahan Ali Akbar
Yulianto dan Risnawati Dernauli, Salemba Empat, Jakarta.
Chi, Wuchun, Chiawen Liu and Taychang Wang. 2007. What Affects Accounting
Conservatism: A Corporate Governance Perspective. Available online at http://
www.google.com
Brilianti, Dinny Prastiwi. 2013. Pengaruh Kepemilikan Manajerial, Kepemilikan
Institusional, Leverage, dan Komite Audit Terhadap Konservatisme Akuntansi.
Fala, Dwi Yana Amalia. 2007. Pengaruh Konservatisme Akuntansi Terhadap penilaian
Ekuitas Perusahaan Dimoderasi oleh Good Corporate Governance. Simposium
Nasional Akuntansi X.
Ghozali, Imam and Anis Chariri. 2007. Teori Akuntansi. Edisi Kedua BP UNDIP:Semarang.
Ghozali, Imam. 2011. Aplikasi Analisis Multivariate dengan Menggunakan
Program SPSS. Univertitas Diponegoro, Semarang.
Givoly, D and C Hayn.2000. The Changing Time-Series Properties of Earnings, Cash Flows
and Accruals: Has Financial Reporting Become More Conservative?. Journal of
Accounting and Economics, No. 29, pp. 287-320
Hayati, Dwi Arnis. 2015. The Factors Affecting Accounting Conservatism in Group Shares
LQ 45 Listed in Indonesia Stock Exchange.
Herawaty, arlen & Guna, I Welivin. 2010. Pengaruh mekanisme corporate governance,
independensi auditor, kualitas audit ddan faktor llainnya terhadap manajemen laba.
STIE Trisakti
Hutapea, Febriyami. 2015. www.google.com/kasus-audit/beritasatu.com/skandal markup-
toshiba . access on December 11, 2015 at 04.09 o’clock.
54

55
Padmawati, Ika, ria and Fachrurrozie. 2015. Pengaruh Mekanisme Good Corporate
Governance dan Kualitas Audit terhadap Tingkat Konservatisme Akuntansi.
Accounting Analysis Jurnal.
Kim, B. and K. Jung. 2007. The Influence of Tax Costs on Accounting Conservatism,
Working Paper Working Paper, Korea Advanced Institute of Science and Technology.
Komite Nasional Good Corporate Governance (KNGCG). 2002. Pedoman Pembentukan
Komite Audit yang Efektif. Disusun untuk Komite Nasional Good Corporate
Governance. 30 Mei 2002.
Kootanaee, Akbar Javadian, Jalal Sayedi, Morteza Nedaei and Milad Javadian Kootanaee.
2013. Accounting Conservatism and Corporate Governance’s Mechanisms: Evidence
from Tehran Stock Exchange. International Journal of Economics, Business and
Finance Vol. 1, No. 10, November 2013, PP: 301- 319
Mai, muhammad umar. 2006. Analisis Variabel-Variabel yang Mempengaruhi Struktur
Modal pada Perusahaan-Perusahaan LQ-45 di Bursa Efek Jakarta, Ekonomika, Hal.
228-245. Politeknik Negeri, Bandung.
Midiastuty, P.P. and M. Machfoedz. 2003. Analisis Hubungan Mekanisme Corporate
Governance dan Indikasi Manajemen Laba. Makalah Simposium Nasional Akuntansi
VI , hlm. 176 – 199.
Modugu. K. Prince, emmanuel eragbhe and Ohiorenuan Jude Ikhatua. 2012. Determinants of
Audit Delay in Nigerian Companies: Empirical Evidence. Research Journal of Finance
and Accounting. ISSN 2222-1697 (Paper) ISSN 2222-2847 (Online) Vol 3, No 6, 2012
Novikasari, Tri Ritonga and Sofyan. 2013. Analisis Faktor-faktor yang Mempengaruhi
penerapan Konservatisme dalam Akuntansi.
Nugroho, Deffa Agung and Siti Mutmainah. 2012. Pengaruh Struktur Kepemilikan
Manajerial, Debt Covenant, Kesulitan Keuangan Perusahaan dan Resiko Litigasi
Terhadap Konservatisme Akuntansi. Journal of Accounting, vol 1, No 1. Universitas
Diponegoro. Semarang.
Sameh M. Reda Reyad. 2012. Accounting Conservatism and Auditing Quality: an Applied
Study On Egyptian Corporations. European Journal of Business and Management, Vol
4, No.21.
Satya, Randy Dwy. 2013. Pengaruh Karateristik Dewan Komisaris, Komite Audit, dan
Tingkat Kesulitan Keuangan Terhadap Tingkat Konservatisme Akuntansi (Studi
Empiris Pada Industri Tekstil yang Terdaftar di BEI Tahun
2009-2011). Universitas Esa Unggul.
Sufren and Yonathan Natanael. 2014. Belajar Otodidak SPSS Pasti Bisa. PT Elex Media
Komputindo. Gramedia. Jakarta.
Suharli, Michael and Megawati Oktarina. 2009. Memprediksi Tingkat Pengembalian
Investasi Pada Equity Securities Melalui Rasio Profitabilitas, Likuiditas, dan Hutang
pada Perusahaan Publik di Jakarta. SNA VIII : Ikatan Akuntan Indonesia.

56
Susiana dan Arleen Herawaty. 2007. Analisa Pengaruh Indepedensi, Mekanisme
Corporate Governance, Kualitas Audit Terhadap Integritas Laporan
Keuangan. Simposium Nasional Akuntansi X. Unhas Makasar. 26-28 Juli 2007.
Wardhani, Ratna. 2008. Tingkat Konservatisme Akuntansi Di Indonesia Dan Hubungannya
Dengan Karakteristik Dewan Sebagai Salah Satu Mekanisme Corporate Governance.
SNA 11 : Ikatan Akuntan Indonesia.
Watts, R. 2003. Conservatism in accounting part II: Evidence and research opportunities.
Accounting Horizons 17, 287-301.
Widya. 2005. Analisis Faktor-Faktor yang Mempengaruhi Pilihan Perusahaan
terhadap Akuntansi Konservatif. Jurnal Riset Akuntansi Indonesia, Vol. 8
No. 2, h. 138-157.
Wijayanti, D. R. 2008. Analisis Faktor-Faktor yang Mempengaruhi Pilihan
Perusahaan terhadap Akuntansi Konservatif. Skripsi, Universitas
Diponegoro.
Wulandari, Indah, Andreas and Elfi Ilham. 2014. Pengaruh Struktur Kepemilikan
Manajerial, Debt Covenant dan Growth Opportunities terhadap Konservatisme
Akuntansi. JOM FEEKON, Vol. 1 No. 2, Pekanbaru.

57
APENDIXES
1. Sample Description
A. Detail of Samples
No Details Amount
1 LQ45 companies listed on IDX 45
2 LQ45 companies listed three consecutive years in the
year of observation 25
3 LQ45 companies which publish its financial
statements in denominations other than the rupiahs 4
4 Company used as sample of observations 21
Years of observation 2011 – 2014 4
The number of research samples 84
B. Sample Companies
No Companies Name Code
1 PT Astra Agro Lestari AALI
2 PT Adhi Karya ADHI
3 PT AKR Corporindo AKRA
4 PT Aneka Tambang ANTM
5 PT Astra International ASII
6 PT Alam Sutera Realty ASRI
7 Bank BNI BBNI
8 Bank BRI BBRI
9 Bank Danamon BDMN
10 Bank Mandiri BMRI
11 PT Global Mediacom BMTR
12 PT Bumi Serpong Damai BSDE
13 PT XL Axiata EXCL
14 PT Indocement Tunggal Prakasa INTP
15 PT Jasa Marga JSMR
16 PT Lippo Karawaci LPKR
17 PT Perusahaan Perkebunan London Sumatera
Indonesia
LSIP
18 PT Media Nusantara Citra MNCN
19 PT Bukit Asam PTBA
20 PT Pakuwon Jati PWON
21 PT Telkom Indonesia TLKM
57

58
2. Raw Data Description
A. Accounting Conservatism Level (Y)
NO CODE COMPANIES NAME Accounting Conservatism
2011 2012 2013 2014
1 AALI PT Astra Agro Lestari 43,40 39,40 50,20 41,50
2 AKRA PT AKR Corporindo 30,25 41,50 40,75 41,20
3 ANTM PT Aneka Tambang 16,20 12,80 10,15 10,65
4 ASII PT Astra International 14,80 15,20 13,60 14,85
5 ASRI PT Alam Sutera Realty 14,60 16,00 14,30 15,60
6 BBNI BANK BNI 10,13 19,87 10,53 16,27
7 BBRI BANK BRI 27,00 27,80 29,00 36,60
8 BDMN BANK DANAMON 18,20 11,30 17,55 19,05
9 BMRI BANK MANDIRI 13,50 16,20 15,70 20,20
10 BSDE PT Bumi Serpong Damai 19,80 11,10 17,50 18,05
11 EXCL PT XL Axiata 35,25 35,50 42,00 38,65
12 INTP PT Indocement Tunggal Prakarsa 28,00 34,90 40,00 40,20
13 JSMR PT Jasa Marga 18,40 10,90 19,45 14,10
14 LPKR PT Lippo Karawaci 16,60 10,00 19,10 11,02
15 LSIP PT Perusahaan Perkebunan London Sumatra Indonesia 22,50 23,00 19,30 18,90
16 PTBA PT Bukit Asam 34,70 30,20 20,40 25,00
17 TLKM PT Telkom Indonesia 28,20 36,20 41,00 37,30
18 ADHI PT Adhi Karya 15,80 17,60 19,70 20,10
19 BMTR PT Global MediaCom 19,90 23,50 19,00 14,25
20 MNCN PT Media Nusantara Citra 13,10 25,00 26,25 25,40
21 PWON PT Pakuwon Jati 17,50 12,25 12,70 15,15

59
B. Independent Commissioner (X1)
NO CODE COMPANIES NAME Independent Commissioner
2011 2012 2013 2014
1 AALI PT Astra Agro Lestari 0,43 0,43 0,43 0,43
2 AKRA PT AKR Corporindo 0,33 0,33 0,33 0,33
3 ANTM PT Aneka Tambang 0,33 0,33 0,33 0,33
4 ASII PT Astra International 0,45 0,45 0,45 0,45
5 ASRI PT Alam Sutera Realty 0,25 0,25 0,25 0,25
6 BBNI BANK BNI 0,43 0,43 0,43 0,43
7 BBRI BANK BRI 0,57 0,57 0,57 0,57
8 BDMN BANK DANAMON 0,50 0,50 0,50 0,50
9 BMRI BANK MANDIRI 0,67 0,67 0,67 0,67
10 BSDE PT Bumi Serpong Damai 0,38 0,38 0,38 0,38
11 EXCL PT XL Axiata 0,50 0,50 0,50 0,50
12 INTP PT Indocement Tunggal Prakarsa 0,40 0,40 0,40 0,40
13 JSMR PT Jasa Marga 0,33 0,33 0,33 0,33
14 LPKR PT Lippo Karawaci 0,57 0,57 0,57 0,57
15 LSIP PT Perusahaan Perkebunan London Sumatra Indonesia 0,33 0,33 0,33 0,33
16 PTBA PT Bukit Asam 0,40 0,40 0,40 0,40
17 TLKM PT Telkom Indonesia 0,40 0,40 0,40 0,40
18 ADHI PT Adhi Karya 0,29 0,29 0,29 0,29
19 BMTR PT Global MediaCom 0,33 0,33 0,33 0,33
20 MNCN PT Media Nusantara Citra 0,40 0,40 0,40 0,40
21 PWON PT Pakuwon Jati 0,67 0,67 0,67 0,67

60
C. Managerial Ownership (X2)
NO CODE COMPANIES NAME Managerial Ownership
2011 2012 2013 2014
1 AALI PT Astra Agro Lestari 0,40
0,40
0,40
0,40
2 AKRA PT AKR Corporindo -
0,10
0,10
0,10
3 ANTM PT Aneka Tambang 0,20
0,20
0,20
0,20
4 ASII PT Astra International 0,04
0,04
0,04
0,04
5 ASRI PT Alam Sutera Realty 0,20
0,20
0,20
0,20
6 BBNI BANK BNI 0,10
0,10
0,10
0,10
7 BBRI BANK BRI 0,23
0,23
0,23
0,23
8 BDMN BANK DANAMON 0,25
0,25
0,25
0,25
9 BMRI BANK MANDIRI 0,46
0,46
0,46
0,46
10 BSDE PT Bumi Serpong Damai 0,35
0,35
0,35
0,35
11 EXCL PT XL Axiata 0,20
0,20
0,20
0,20
12 INTP PT Indocement Tunggal Prakarsa 0,30
0,30
0,30
0,30
13 JSMR PT Jasa Marga 0,40
0,40
0,40
0,40
14 LPKR PT Lippo Karawaci 0,45
0,45
0,45
0,45
15 LSIP PT Perusahaan Perkebunan London Sumatra Indonesia
0,50
0,50
0,50
0,50
16 PTBA PT Bukit Asam 0,30
0,30
0,30
0,30
17 TLKM PT Telkom Indonesia 0,20
0,20
0,20
0,20
18 ADHI PT Adhi Karya 0,35
0,35
0,35
0,35
19 BMTR PT Global MediaCom 0,42
0,42
0,42
0,42
20 MNCN PT Media Nusantara Citra 0,20
0,20
0,20
0,20
21 PWON PT Pakuwon Jati 0,10
0,10
0,10
0,10

61
D. Growth Opportunities (X3)
NO CODE COMPANIES NAME Growth Opportunities
2011 2012 2013 2014
1 AALI PT Astra Agro Lestari 4,06
0,25 2,06 4,2
2 AKRA PT AKR Corporindo 3,23
1,59
2,28
0,13
3 ANTM PT Aneka Tambang 1,43
2,64
2,90
1,79
4 ASII PT Astra International 3,95
1,88
3,20
3,32
5 ASRI PT Alam Sutera Realty 2,95
2,47
2,96
3,23
6 BBNI BANK BNI 1,87
1,84
1,48
1,03
7 BBRI BANK BRI 3,34
3,08
1,99
1,27
8 BDMN BANK DANAMON 1,52
4,26
3,11
1,09
9 BMRI BANK MANDIRI 2,51
3,79
2,70
8,24
10 BSDE PT Bumi Serpong Damai 2,08
2,01
3,23
2,70
11 EXCL PT XL Axiata 2,82
2,50
2,70
2,30
12 INTP PT Indocement Tunggal Prakarsa 3,28
4,09
0,85
4,78
13 JSMR PT Jasa Marga 3,09
9,94
0,25
3,46
14 LPKR PT Lippo Karawaci 1,62
3,85
1,17
2,29
15 LSIP PT Perusahaan Perkebunan London Sumatra Indonesia
2,63
3,17
1,86
1,91
16 PTBA PT Bukit Asam 4,90
0,76
2,94
5,36
17 TLKM PT Telkom Indonesia 8,21
0,26
1,31
3,17
18 ADHI PT Adhi Karya 3,31
0,16
2,25
2,60
19 BMTR PT Global MediaCom 3,80
1,54
1,80
1,26
20 MNCN PT Media Nusantara Citra 0,95
2,25
2,97
3,81
21 PWON PT Pakuwon Jati 0,34
1,14
3,71
2,99

62
E. Sales Growth (X4)
NO CODE COMPANIES NAME Sales Growth
2011 2012 2013 2014
1 AALI PT Astra Agro Lestari 0,43 0,13 0,57 0,14
2 AKRA PT AKR Corporindo 0,24 0,1 38 0,12
3 ANTM PT Aneka Tambang 0,18 0,13 0,5 0,14
4 ASII PT Astra International 0,26 0,12 0,4 0,17
5 ASRI PT Alam Sutera Realty 0,12 0,13 0,33 0,43
6 BBNI BANK BNI 0,21 0,12 0,25 18
7 BBRI BANK BRI 0,13 0,34 0,33 0,13
8 BDMN BANK DANAMON 0,17 0,24 0,4 0,11
9 BMRI BANK MANDIRI 0,11 -0,15 0,4 0,2
10 BSDE PT Bumi Serpong Damai 0,13 0,25 0,29 0,14
11 EXCL PT XL Axiata 0,45 0,1 0,12 0,25
12 INTP PT Indocement Tunggal Prakarsa 0,25 0,14 0,17 0,16
13 JSMR PT Jasa Marga 0,12 0,31 0,13 0,46
14 LPKR PT Lippo Karawaci 0,34 0,43 0,1 0,28
15 LSIP PT Perusahaan Perkebunan London Sumatra Indonesia 0,3 0,33 0,26 0,12
16 PTBA PT Bukit Asam -0,34 0,33 0,26 0,17
17 TLKM PT Telkom Indonesia 0,35 0,45 0,14 0,4
18 ADHI PT Adhi Karya 0,1 0,25 0,25 0,3
19 BMTR PT Global MediaCom 0,15 -0,13 0,1 0,2
20 MNCN PT Media Nusantara Citra 0,2 0,57 0,25 0,23
21 PWON PT Pakuwon Jati 0,16 0,5 0,42 0,28
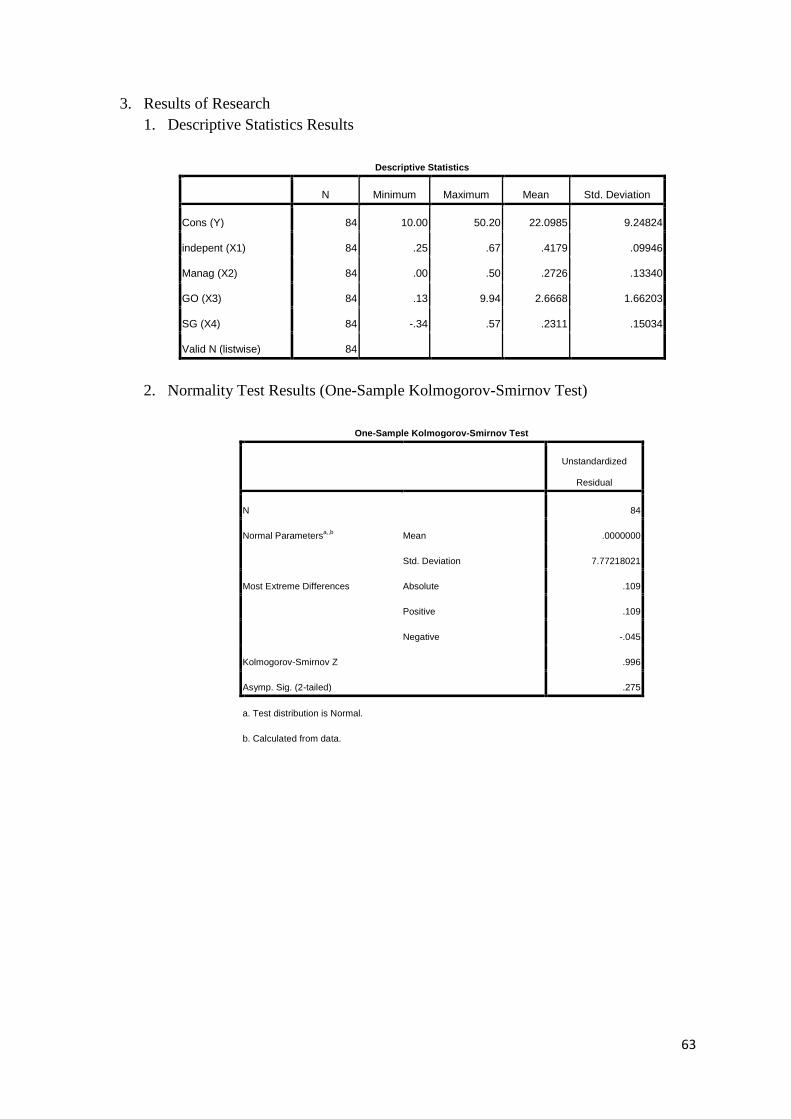
63
3. Results of Research
1. Descriptive Statistics Results
Descriptive Statistics
N Minimum Maximum Mean Std. Deviation
Cons (Y) 84 10.00 50.20 22.0985 9.24824
indepent (X1) 84 .25 .67 .4179 .09946
Manag (X2) 84 .00 .50 .2726 .13340
GO (X3) 84 .13 9.94 2.6668 1.66203
SG (X4) 84 -.34 .57 .2311 .15034
Valid N (listwise) 84
2. Normality Test Results (One-Sample Kolmogorov-Smirnov Test)
One-Sample Kolmogorov-Smirnov Test
Unstandardized
Residual
N 84
Normal Parametersa,,b
Mean .0000000
Std. Deviation 7.77218021
Most Extreme Differences Absolute .109
Positive .109
Negative -.045
Kolmogorov-Smirnov Z .996
Asymp. Sig. (2-tailed) .275
a. Test distribution is Normal.
b. Calculated from data.

64
3. Multicollinearity Test Result
Coefficientsa
Model
Collinearity Statistics
Tolerance VIF
1 indepent
(X1)
.918 1.090
Manag (X2) .950 1.053
GO (X3) .961 1.041
SG (X4) .942 1.062
Source: Data Processed
4. Autocorrelation Test Result
Model Summaryb
Model R R Square Adjusted R Square
Std. Error of the
Estimate Durbin-Watson
1 .542a .294 .258 7.96651 1.814
a. Predictors: (Constant), SG (X4), GO (X3), Manag (X2), indepent (X1)
b. Dependent Variable: Cons (Y)

65
5. Heterocedasticity Test Result
6. Coefficient Determination Test Result
Model Summaryb
Model R R Square Adjusted R Square
Std. Error of the
Estimate Durbin-Watson
1 .542a .294 .258 7.96651 1.814
a. Predictors: (Constant), SG (X4), GO (X3), Manag (X2), indepent (X1)
b. Dependent Variable: Cons (Y)

66
7. Partial Test Result (T-Test)
8. Simultaneous Significant Test (F- Test)
ANOVAb
Model Sum of Squares df Mean Square F Sig.
1 Regression 2085.218 4 521.305 8.214 .000a
Residual 5013.763 79 63.465
Total 7098.981 83
a. Predictors: (Constant), SG (X4), GO (X3), Manag (X2), indepent (X1)
b. Dependent Variable: Cons (Y)
Coefficientsa
Model
Unstandardized Coefficients
Standardized
Coefficients
T Sig. B Std. Error Beta
1 (Constant) 17.196 4.541 3.787 .000
indepent (X1) -8.538 9.178 -.092 -.930 .355
Manag (X2) -7.494 6.725 -.108 -1.114 .269
GO (X3) 2.718 .537 .489 5.064 .000
SG (X4) 14.122 5.994 .230 2.356 .021
a. Dependent Variable: Cons (Y)