the effect of firm-specific variables and macroeconomic...
TRANSCRIPT
The Effect of Firm-Specific Variables and
Macroeconomic Condition on Capital Structure
Evidence of Non-Linear Behaviors
Supervisor: Authors:
Anders Vilhelmsson Mei-Ti You
Kuang He

2
Abstract
This paper models the dynamics of capital structure listed on the NYSE and
NASDAQ during 1995 to 2010. The subsamples classified by given leverage level
and specified periods of time are tested. The main contribution is that macroeconomic
conditions and firm characteristics are incorporated regressed for non-linearity test.
We provide the evidence of non-linear patterns among low leverage and high leverage
firms. These two groups are found to have contrast behaviors toward stock market,
one of macroeconomic variables. With more financial flexibilities, the sensitivities of
firm-specific variables are found statistically insignificant for low leverage firms.
Besides, firm-specific variables drop sensitivities for high leverage firms in economic
downturns. Our results support the hypothesis that low leverage firms have higher
agency cost between managers and shareholders, and the fact that expected
bankruptcy cost is lower in booms.
Keywords: Capital structure, Non-linear behaviors, Business cycles.

3
Content
1. Introduction ........................................................................................................ 5
1.1 Background .................................................................................................. 5
1.2 Problem Discussion ...................................................................................... 6
1.3 Purpose ......................................................................................................... 6
1.4 Structure of the paper .................................................................................... 7
2. Theoretical Background ......................................................................................... 7
2.1 Irrelevance theory ......................................................................................... 7
2.2 Trade-off theory ............................................................................................ 8
2.3 Model based on asymmetric information signaling & agency costs ............... 8
2.4 Pecking order theory ..................................................................................... 9
3. Literature Review .................................................................................................. 9
3.1 Firm-specific variables ................................................................................ 10
3.2 Macroeconomic condition ............................................................................ 11
3.3 Non-linear behavior .................................................................................... 13
4. Methodology ....................................................................................................... 14
4.1 Model ......................................................................................................... 14
4.2 Data specification and source ...................................................................... 14
4.3 Variables selection ...................................................................................... 15
4.4 Subsample sorting ....................................................................................... 16
5. Prediction of the Variables ................................................................................... 17
5.1 Firm-specific variables ................................................................................ 17
5.2 Macroeconomic variables ........................................................................... 18
6. Results and Discussions ....................................................................................... 19
6.1 Profitability................................................................................................. 19
6.2 Size............................................................................................................. 20
6.3 Collateral .................................................................................................... 20
6.4 Convexity of taxation .................................................................................. 21
6.5 Growth opportunity .................................................................................... 21
6.6 Median of industry level ............................................................................. 21
6.7 Overall condition of market ........................................................................ 22

4
6.8 Stock market return ..................................................................................... 22
6.9 Credit spread............................................................................................... 23
6.10 Cross-sectional effect ................................................................................ 23
7. Conclusion .......................................................................................................... 23
References ............................................................................................................... 25
Appendix................................................................................................................. 28
Graph 1: Historical Macroeconomic Indicators ................................................. 28
Table 1: Data Description: Leverage level of industry ....................................... 29
Table 2: Model of Leverage .............................................................................. 31
Table 3: Test of Fixed Effect of Panel Data ....................................................... 34
Table 4: Cross Correlations of Variables ........................................................... 35

5
1. Introduction
1.1 Background
Capital structure is one of the most crucial decision makings of firms and thus
heated issues in corporate finance studies. Modigiani and Miller (1958) propose an
irrelevance theory in the perfect capital market. M&M I claims the value of firm is
same regardless what the capital structure is like. However, M&M II relaxed the
perfect market assumption, suggesting that with tax benefit, debt using increases the
value of firm. This argument definitely provokes countless interests of capital
structure research.
Without doubt, pecking order (Myers and Majluf, 1984) and trade-off theory
(Kraus and Litzenberger, 1973) are the two most widely discussed and tested theories.
Pecking order is based on the fact of adverse selection cost, presenting a priority from
internal funds to external financing. Trade-off theory obtains optimal leverage level
by balancing the benefits and costs of debt using. Many articles, such as Fama &
French (2000), Bancel & Mitto (2004), Frank & Goyal(2007), test the determinants of
capital structure and then conclude the partial explanatory ability of either the two
theories.
Besides determinants of capital structure, recent studies also have variety of
perspectives. Korajczyk and Levy (2002) investigates the effect of macroeconomic
condition on leverage level. Leary and Robert (2003) study the existence of target
ratio and rebalancing model. Roberts (2005) Flannery and Rangan (2004) model the
partial adjustment of capital structure. Mackay and Phillips (2002) provide the
evidence of industry equilibrium model of financial structure. These articles broaden
the horizons of empirical capital structure studies.
There are some inconsistent findings. For example, Chen and Zhao (2005)
control the adjustment cost and find out that it fails to explain the negative relation
between profitability and leverage level. Baker and Wurgler (2002) do not find

6
evidence of leverage reversion, which is contrast to the finding of Leary and Robert
(2003).
With different samples, models and point of views, the researches of capital
structure are enriched. Although there are still debates, capital structure seems to catch
people’s attention continually.
1.2 Problem Discussion
Our research is inspired by Korajczyk and Levy (2002). The paper proposes
that both macroeconomic conditions and firm specific factors drive variations on
financing decision. They also demonstrate that firms should adjust their capital
structure more by smaller volume in expansion than in depression. The subsamples
are classified as financial constrained and unconstrained firms in their article.
However, they neglect the existence of non-linearity of dependent variable in the
determinants of capital structure, which is documented by Harris and Scaramozzino
(2005). They prove the existence of non-linear behavior in the determinants of capital
structure between low leverage firms and high leverage firms, using conditional
quantile regression. This triggers our interest to see that besides firm-specific
variables, how macroeconomic conditions affect the leverage level Moreover, we are
also curious about the pattern of capital structure excluding large macroeconomic
flotation. Hence, the subsamples are classified by the given leverage level as well as
different business phases. In light of business cycle’s effect and non-linear patterns,
different subsamples are supposed to have varied sensitivities of determinants
according to their characteristics.
1.3 Purpose
The purpose of the paper is to examine the impacts of both macroeconomic
variables and firm-specific variables on capital structure decision making among
several subsamples. The comparisons among the subsamples, their economic
interpretations and linkages with theory and prior studies are the main investigations

7
of this paper.
1.4 Structure of the paper
In chapter 2, the main theories of capital structured are illustrated. Chapter 3
reviews relevant literature. Chapter 4 presents the methodology. We discuss
predictions of variables in chapter 5. Results and discussions are analyzed in chapter 6.
Finally, the whole investigation is concluded in chapter 7.
2. Theoretical Background1
2.1 Irrelevance theory
In 1958, Franco Modigliani and Merton Miller (M&M) published a landmark
paper, “The cost of capital, Corporation Finance and the Theory of Investment”. In the
paper, they characterize an ideal capital market, which is defined by a set of five
assumptions. Market participants face no transaction costs or taxes, which means the
frictionless capital structure; all market participants share homogeneous expectations
about the prospects of investments; there is no atomistic competition; the firm’s assets,
operations and strategies are fixes and known to all investor and the firm’s financing
is stable and fixed once chosen.
Under the above assumptions, they developed two controversial propositions on
the effects of corporate financing decisions, which are the market value of a firm is
constant regardless of the amount of leverage (i.e., debt relative to equity) that firm
uses to finance its assets and the expected return on a firm’s equity is an increasing
function of the firm’s leverage. They challenged the traditional notion that a firm’s
value can be increased by using debt. In other words, the value of a firm is unaffected
by the capital structure in the absence of taxes, bankruptcy costs, agency costs and
asymmetric information. According to this theory, it does not matter if the firm’s
1 Ogden J P.Connor. Advanced Corporate Finance: Policies and Strategies.Page30-170

8
capital is financed by debt or equity and the firm’s dividend policy is irrelevance to
capital structure either.
2.2 Trade-off theory
With the relaxation of assumptions of the ideal capital market, the presence of
bankruptcy cost and favorable tax treatment of interest payment led to the
development of static trade off framework. Kraus and Litzenberger (1973) argued that
firms will seek to maintain an optimal capital structure by balancing the value of tax
shields on interests and the cost of bankruptcy or financial distress, which is
traditional trade-off theory. However, Miller (1977) developed other alternative
offsetting factor, personal taxes, to take full advantage of interest deductibility and
yielded an equilibrium involving corporate and personal tax rates in corporate debt.
Furthermore, under the agency theoretical models, Stulz (1988) developed a
model of optimal capital structure that focuses on the benefits of reducing potential
free cash flow problems and other potential conflicts between managers and
shareholders. Corporate managers have the incentive to waste free cash flow and bad
investment. The issue of debt limits the free cash flow available to managers and thus
mitigates the manager-shareholder agency conflict.
2.3 Model based on asymmetric information signaling &
agency costs
Since the shareholders cannot observe neither the firm’s true cash flows nor
management’s investment decisions whereas management do, the information
asymmetry occurs between them. Besides, the principal-agent problems also do favor
of management since they are incentive to overinvest. Managers always turn to equity
funding by claiming the insufficient cash flow to invest profitable items and thus
leads to adverse results, which shareholders refuse to provide fund even under real
situation. In that case, overinvestment and underinvestment problems come up.

9
Stulz (1990) developed a theory of optimal capital structure that incorporates
both principal-agent and information asymmetry problems. He argues that both
overinvestment and underinvestment problems can be mitigated if the firm is financed
with mixture of debt and equity. The issue of debt reduces the overinvestment cost
because of the control of free cash flow while the equity fund can increase the control
of shareholders and cut down the underinvestment cost. Therefore, an optimal capital
structure exists towards to managerial discretion.
2.4 Pecking order theory
Another pioneering finding addressed by Myers and Majluf (1984) and Myers
(1984) is Pecking Order Hypothesis. It has been recognized that managers know more
about the true value of the firm and the firm’s riskiness than less informed
shareholders and outside investors, according to asymmetric information. Firms may
be forced to forgo projects with positive net present value if it is costly for express the
true value. To avoid the underinvestment problem, managers prefer to finance the new
project by those who are not undervalued by the market, such as internal funds or
riskless debt. Therefore, this affects the choice between internal and external
financing.
Based on the idea of asymmetric information between managers and investors,
he pointed out that managers prefer internal financing (i.e., equity financing via
retained earnings) over external financing (i.e., funds raised via debt or equity).
Second, if company has to finance externally, it would issue the security with the least
risk. It ranks internal equity at the top of the pecking order, followed by debt and then
hybrids of debt-equity, with external finance at the bottom of the pecking order.
3. Literature Review
Although capital structure theories have been proposed, many of the empirical
studies are aimed at providing support for a particular theory. These empirical studies,
10
such as Bancel & Mitto (2004), Frank & Goyal(2007), focus on trade-off theory and
pecking order to explain the factors of financing decisions making. Almost every
related article reaches the conclusion that either trade-off theory or pecking order can
only partially capture the capital structure in the real world.
In this part, we review previous studies from three main perspectives,
firm-specific variables, macroeconomic conditions, and non-linear behavior, which
are highly related to our research.
3.1 Firm-specific variables
Most researches are consistent with elements of both tradeoff and pecking order
theories. Bancel & Mitto (2004) surveyed managers of firms in seventeen European
countries on their capital structure and found that financial flexibility, credit rating
and tax advantage of debt are the most important factors influencing the debt policy
while the earnings per share dilution is the most concern in issuing equity. They also
pointed out that level of interest rate and the share price are important considerations
in selecting the timing of debt and equity issues respectively. Hedging consideration is
the primary factor influencing the selection of the maturity of debt or when raising
capital abroad.
Fama & French (2000) tested the dividend and leverage predictions of tradeoff
and pecking order models and followed Fama & Macbeth's (1973) approach to study
the determinants of leverage (and dividends). The exogenous driving variables in their
leverage model are profitability of assets, investment opportunities, non-debt tax
shields, volatility and the target payout ratio is endogenous. According to their
research, firms with more profits are less levered, which is consistent with the pecking
order model but contradicts the tradeoff model.
However, confirming the trade-off theory, firms with more investments have
less market leverage. Korajczyka & Levy (2003) followed Titman & Wessels (1988),
Hovakimian, Opler, and Titman (2001), and Fama & French (2000) when testing
firm-specific variables on target leverage. They assumed profitability of firm, the
11
extent of non-interest tax shields, the level of taxes paid, the level of
intangible/tangible assets and market-to-book ratio have negative effects on target
leverage while firm size has the positive effect.
The fact that deviations from target leverage explain issue choice is consistent
with the tradeoff theory while the negative relation between profitability and target
leverage is consistent with the pecking order theory. Frank & Goyal(2007) examines
the relative importance of many factors in leverage decision of publicly traded
American firms from 1950 to 2003 and got the same results. These factors they used
are median industry leverage( positive effect on the leverage), market-to-book
ratio(-),tangibility(+),profits(-),log of assets(+)and expected inflation(+).While
industry subsumes a number of smaller effects.
From the existing literature, we extract a long list of factors claimed to have
some influence on corporate leverage in firm specific aspect. This list includes
measures of profitability, size, growth opportunity, industry, collateral and convexity
of taxation.
3.2 Macroeconomic condition
Besides firm characteristics, several articles proved macroeconomic conditions
significantly influence the dynamic target capital structure. Taggart (1985) argues that
the real value of deduction on debt is higher when expected inflation is higher.
Consequently, tradeoff theory predicts that expected inflation has a positive effect on
leverage. Frank & Goyal (2007) find the same result of the positive relation between
the expected inflation and debt-to-equity level. Korajczyk, Lucas, and McDonald
(1992) provide evidence of clustering equity issuance. Firms often issue equity in
good times, as their own price of equity has an abnormal increase, and thus decrease
the leverage level. Choe, Masulis, and Nanda (1993) claim that counter-cyclical
adverse selection costs lead to general increase in equity issues in expansionary
phases of the business cycle. They suggest that firms face lower selection cost when
they have more promising investment opportunities and less uncertainty of assets in

12
place. Bayless and Chaplinsky (1996) argue that firms seek to exploit the
opportunities to raise capital in favorable terms during good time. Levy (2001)
explains the counter-cyclical leverage patterns for relatively financially unconstrained
firms accessing public capital market. Macroeconomic condition is used as proxy for
managers’ wealth. Managers are more likely to issue debt when their compensation is
lower.
Korajczyk and Levy (2003) show the counter-cyclicality of leverage for
financially unconstrained firms versus the pro-cyclicality of leverage for constrained
firms. In addition, they find evidence that financially unconstrained firms time their
equity issuance. Hackbarth, Miao, and Morellec (2004) get the same conclusion and
demonstrate that firms should adjust their capital structure more by smaller volume in
expansion than in depression. Chen (2009) presents a mechanism for “credit
contagion” and market timing for debt issuing. Erel et al (2011) find that for
noninvestment-grade firms, the raise of capital is pro-cyclical while it is
counter-cyclical for investment grade firms.
Empirically, macroeconomic conditions also provide some explanations of
pecking order theory as well as tradeoff theory. Macro-variables’ negative relation to
leverage for financially unconstrained firms seems to support pecking order;
unconstrained firms tend to use more internal funds as they have more investment
opportunities in good time. The equity issue in booms due to counter-cyclical adverse
selection cost also agrees with the prediction in pecking order. On the other hand, if
we only look within the good time, pro-cyclical leverage tendency during economic
expansion is consistent with the tradeoff story. For unconstrained firms, debt is more
attractive possibly because bankruptcy cost decreases and firm wants to have more tax
shield as the market goes up continually. Firms lever up when the expected inflation
increases, since the effective tax benefits get higher at the same time (Frank and
Goyal, 2007). This finding apparently supports the tradeoff theory.
The effect of macroeconomic conditions on capital structure can be seen as two
dimensions. The first one is firms’ changing demand for types and amount of
financing source over business cycle. The adverse selection costs resulted from
13
information asymmetry between firms and investors are higher in recession. Hence,
firms choose to issue less information-sensitive securities, for example, shifting from
equity to convertibles and from convertibles to debt (Baker, 2009). The other
perspective is the change of capital supply. Capital supply has shortage and investors
demand for more safe securities in recession. Holmstrom & Tirole (1997) present the
recession creates a “credit crunch” for lower rated firms. The “flight to quality” model
by Caballero and Krishnamurthy (2008) illustrates that investors become more
adverse to risk in downturns, and thus they purchase more safe securities. The finding
by Erel et al (2011) that investment-grade firms have more public bond issuances in
downturns is consistent with the “flight to quality” argument. It also responses the
survey of Graham & Harvey (2001) which shows one of crucial goals of Chief
Financial Officers is to maintain finance flexibility in order to avoid from shrinking
business in economic downturn, as well as the argument by Kisgen &Hovakimian
(2009) that firms target their bond ratings.
3.3 Non-linear behavior
There is empirical evidence of non-linearity pattern of leverage among different
quantiles of UK firms. Fattouh, Harris and Scaramozzino (2005) documented the
existence of linearity in the determinants of capital structure. The main finding is that
size of firm is positively related to debt-to-equity ratio for low leverage firms while
negatively related for high leverage firms. Additionally, asset tangibility has a positive
impact for low quantiles, but not significant for high quantiles. The debt ceiling is
pointed out to be the potential rationale for the non-linearity pattern of capital
structure decision making.
Holding other firm characteristic constant, low leverage firms have more
financial flexibilities and sever free cash flow problem. High leverage firms have
higher pressure of solvency, more tax benefit of debt, severer debt-overhang problem.
These factors could be the rationales for the non-linearity pattern of determinants of
capital structure.

14
The determinants used in Fattoul et al (2005) are all firm-specific variables.
Macroeconomic variables and firm-specific variables are incorporated in our studies,
and more implications are expected.
4. Methodology
4.1 Model
Following the above researches, we use OLS to regress panel data. The regression
can be written as:
Lev it=α+β’xfit-1+γ’xjt+εit
Lev it : leverage level of firm i at time period t
α: constant
xfit: firm-specific variables f of firm i at time period t.
xet: macroeconomic variables j at time period t.
β: vector of coefficients of firm-specific variables.
γ: vector of coefficients of macroeconomic variables.
εit: error term
It is reasonable to use cross-sectional effect since there could be unobservable
idiosyncratic factor affecting capital structure. Cross-sectional fixed effect or random
effect of each firm is used as dummy variable according to the result of test of fixed
effect and random effect. It is reasonable to Note that the value of one macroeconomic
variable is same for all firms at one specific time period t.
4.2 Data specification and source
The yearly data of firm specific variables, stock market return and Consumer
Price Index (CPI) are from DataStream. For two other macroeconomic indicators, we
obtain the yearly data from Board of Governors of the Federal Reserve. The

15
expansion/recession time periods are defined by National Bureau of Economic
Research (NBER).
All series are deflated to real value in 1994 dollars with the CPI inflation series.
We choose firms listed on New York Stock Exchange and NASDAQ and then exclude
the financial industry, since their capital structures have different natures and
regulatory requirements. The firms should exist during the whole period of time from
January 1994 to December 2010 and be still active now in order to be included in the
sample. This time span captures two business cycles, entitling us to test the impact of
macroeconomic conditions and to test the subsamples within specific business phase.
After dropping the missing data, the full sample includes 960 firms, distributed in 33
industries classified by DataStream.
4.3 Variables selection
Explanatory variables
We follow most of previous studies, such as Korajczyka & Levy (2003) and
Frank& Goyal(2007), to choose explanatory variables and their transformations.
Firm specific variables
All the firm-specific variables are one period lagged.
1. Size: The proxy of size of firm is log of total asset.
2. Collateral: Property, plant and equipment scaled by total asset.
3. Profitability: profit margin of the firm.
4. Convexity of taxation: net deferred tax asset.
5. Growth opportunity: market-to-book ratio
6. Influence of industry: median leverage level of industry
Macroeconomic variables
All the macroeconomic variables are current value (i.e. not lagged)
1. Condition of product market: 1 year aggregate domestic non-financial business
profit.
2. Condition of stock market: 1 year average return on NYSE index and NASDAQ

16
index.
3. Condition of credit market: Average yield of difference between Baa and Aaa
Moody’s rated bond.
Explained variable
Book leverage: book value of short-term debt plus long-term debt over total asset.
Book leverage versus market leverage
Market value is volatile and hard to predict, in general. Hence, the change of
market leverage may have different cause from that of book leverage. For example,
change of book leverage mainly means change of book value of capital structure
(issue/ repurchase of equity, issue/ pay down of debt) and directly reflects capital
structure decision making. However, if the firm does not alter the book value of
capital structure, the market leverage may still have great change due to the
fluctuation of market value of the firm. If we measure the change of market leverage,
it is difficult to distinguish the effect of fluctuation from the effect of change in capital
structure. As a result, the interpretation of the explanatory variables might be quite
different between book leverage and market leverage as explained variables. In order
to capture the linkage between capital structure decision making and the change of
leverage level, the study is mainly focused on book leverage, despite whether the
decision making is influenced by market value or not. Actually, with taking
macroeconomic condition and market-to-book value as explanatory variables, the
decision making affected by market value can be captured and interpreted to a large
extent.
4.4 Subsample sorting
Low leverage firms versus high leverage firms
Our test of non-linearity behavior is mainly inspired by Fattouh et al (2005).
Different from their methodology, which is quantile regression, we quantilze the firms’
leverage levels relative to the industry which they belong to. This method of data
sorting is motivated by the evidence that industry leverage median is also a significant
17
factor. Furthermore, the subsample will have similar proportion of each industry to
that of the whole sample by such sorting. A firm’s average leverage is computed over
whole period of time, and the order is ranked within each industry. The subsample of
low leverage firms and high leverage firms is first quantile and last quantile,
respectively. Note that the firm which has most volatile leverage level (i.e. highest
variance of leverage level during the time span) in its industry is excluded from any
subsample in order to prevent instability.
Good time versus bad time
The full period of time covers two business cycles. Sorting the subsamples
according to the business phases excludes the big business fluctuations and keeps only
relatively small fluctuation within one phase. This entitles us to test whether
macroeconomic indicators are still influential to capital structure. During 1995 to
2010, there are two recessions identified by NBER, March 2001 to November 2001,
and December 2007 to June 2009. The stock market went down from 1999 and to the
downturn in 2002. Our subsample, named bad time, covers these two main recessions.
Subsample of bad time is from 1999 to 2002 and from 2007 to 2010. Subsample of
good time is from 1995 to 1998 and from 2003 to 2006, capturing the expansions.
5. Prediction of the Variables
5.1 Firm-specific variables
As the theoretical background and literature review presents, there are some
firm-specific variables seemed to be reliable determinants. Below are some
predictions of the sign of the variables included in our model.
Profitability: Pecking order theory predicts profitability has negative impact
since the firm should use internal funds firstly, which is supported by Korajczyka &
Levy (2003) and Frank& Goyal(2007),while trade-off theory predicts positive sign
because of increase of free cash flow.

18
Investment opportunities: Pecking order theory predicts investment
opportunities is positively related to leverage level since the firm needs more funds
and debt is prior to equity. Nevertheless, with limit of debt capacity, the equity
financing will be employed after debt financing. Trade-off theory predicts negative
impact because deadweight cost of debt will lead to underinvestment problem. As
investment opportunities increase, firms prefer equity financing to prevent
underinvestment problem. Korajczyka & Levy (2003) also prove the negative effect
of market-to-book ratio on debt level
Collateral: higher collateral means higher liquidation value and lower incentive
of asset substitution. Positive influence is predicted by trade-off theory since the
conflict between shareholders and debt holders are less; tax benefit should be
achieved. Frank &Goyal(2007) examines the relationship by the amount of tangible
assets and found the positive effect.
Convexity of tax: When the firm has less deferred tax asset, the need of debt tax
benefit will increase, and thus trade-off theory predicts a negative sign. From
empirical aspect, Frank & Goyal(2007) got the same result.
5.2 Macroeconomic variables
There are some studies, such as Korajczyka & Levyb(2003), discussing about
the contrast pattern for financial unconstrained versus financial constrained firms
toward business cycle. However, different macroeconomic indicators seem to have
competitive impacts on leverage; two indicators may have offset effect on the change
of leverage. This competition will be discussed below. Furthermore, pecking order
theory and trade-off theory have different predictions of the factors.
Controlling other factors constant, when product market goes up, leading to
more retained earnings of firms, the leverage will decrease according to pecking order,
since firms should use internal funds as first priority. Nevertheless, if good market
also implies more investment opportunities, the leverage will not necessarily decrease
since the need of funds increases and debt is prior to equity financing. Trade-off

19
theory has no obvious prediction, either. Due to free cash flow problem and the
decrease of default risk, good product market is predicted to have positive impact on
leverage level. However, the cost of underinvestment problem increases in the good
time, equity financing becomes more attractive, thus decreases the leverage level.
Credit spread is a measure of cost of debt (Rd), and indicates the credit market
supply at that time. Intuitively, controlling other factors unchanged, the firm will use
less debt if the credit spread goes up.
If the product market has negative impact on leverage level, and credit spread
also influences leverage level negatively, there exist two competitive forces. In
general, the credit spread is lower in booms and higher in contractions. Thus, high
aggregate profit leads to lower debt level, while lower credit spread leads to higher
debt level in a good time. Moreover, the complexity increases if the factor of stock
market is taken in consideration, since aggregate profit and stock return not always go
toward same direction.
6. Results and Discussions
Compared with high leverage firms, low leverage firms have generally more
financial flexibility and thus are less sensitive towards firm-specific variables.
The coefficients of firm-specific variables of the full sample (all firms, whole time
of period) are consistent with prior studies (statistically significant and have same
sign). Both 1 year aggregate domestic non-financial business profits (1YADNFBP)
and Baa-Aaa yield spread have negative impact on leverage level. This is to say,
different macroeconomic indicators have competitive forces as above predicted.
Below is further analysis of all the variables. The significance is referred to be at
10% level of confidence or lower.
6.1 Profitability
For the whole period of time, the coefficient of full sample is significantly
20
negative, but insignificant in both subsample A and B. The same result is found in
good time, while the significance disappears for the three samples in bad time.
Consistent with most of the previous studies, negative effect on capital structure of
profitability is thought to support pecking order and be consistence with the finding
from Fama& French (2000), Korajczk & Levy (2003) and Frank & Goyal (2007). For
high leverage firms, profitability is found weakly significant (p-value 0.109). It might
be linked with the solvency. High leverage firms have bigger pressure to pay down
debt; lower profitability may push them to lever down.
6.2 Size
We get similar result to prior studies; size is positively related to leverage level.
Firms with larger size are seen to have less information asymmetry and thus have
higher debt capacity. In the downturn, interestingly, size starts to have significant
positive influence on low leverage firms while becomes insignificant for high
leverage firms. In general, low leverage firms have more spare debt capacity, and it
can be inferred that the adverse selection cost becomes relatively dominant only in
bad time.
6.3 Collateral
Proxied by PP&E, collateral is found positively related to leverage level, which is
the same finding as Frank& Goyal (2007) did. For high leverage firms, PP&E is not
significant except in good times. Debt ceiling is a reasonable explanation. Given the
firms are highly levered; more collaterals do not affect the usage of debt. Besides, the
decrease of expected bankruptcy cost might increase the debt capacity of high
leverage firms, causing the collateral to become significant in expansion.

21
6.4 Convexity of taxation
As the firms have less deferred tax asset, or more deferred tax liability, the need to
exploit tax benefit of debt increases. This factor has significantly negative influence
on leverage level. However, when under worse macroeconomic condition, taxation
drops the importance. The cost of bankruptcy can be a main rationale for the behavior.
In the recession, bankruptcy risk increases, the tax benefit becomes less attractive to
firms.
6.5 Growth opportunity
Indeed, market-to-book ratio is a controversial indicator since it could be
interpreted as future investment opportunity or market misevaluation. Adam & Goyal
(2008) prove the best proxy for growth option is MB ratio. Actually, even if there
exist firm’s timing of equity issue with advantage taking of market misevaluation, the
impact of MB ratio on leverage level is also negative. It is found insignificant for low
leverage firms in all sub-period samples. With less deadweight cost, leverage level of
low leverage firms are rarely influenced by MB ratio. MB ratio can be thus proved as
an efficient proxy for future investment opportunity simultaneously. Since there is no
positive effect in any subsamples, the finding of growth option is relatively in favor of
trade-off theory.
6.6 Median of industry level
For the full samples in different periods of time (full sample, subsample C and F),
Median of industry level affects leverage level positively. Campello(2001) provides
evidence of the interaction between business cycle and capital structure in both firm
and industry level. He claims that leverage level affects the sensitivity of sales toward
macroeconomic shocks. Because of competitive position in the industry, capital
structure is influenced by that of industry level. Note that although this variable is also
included in six other subsamples, it has not much to infer since low/high leverage
22
firms are ranked in their own industry.
6.7 Overall condition of market
The overall condition of product market demand and business profit, proxied by 1
year domestic non-financial business profits, is negatively related to leverage level for
all the samples. Since both the pecking order and trade-off theories have self-offset
impacts as above discussed, and the negative influence has different implications in
the two theories, the indicator cannot be fully explained by either theory. Use of
internal funds supports pecking order theory while use of equity financing is favor of
trade-off theory.
6.8 Stock market return
Stock market return has insignificant influence on leverage level, but the story
does not end here. The non-linearity test highlights the contrast impacts of stock
market return. For sample B (low leverage firms, whole period of time), stock market
return is positively related to leverage level while negatively related for subsample B
(high leverage firms, whole period of time). The agency cost model established by
Levy (2001) can explain this behavior. Lower leverage firm has higher agency cost
between shareholders and manager because of lack of debt discipline. As the stock
market goes up, the agency cost increases due to the value increase of stock and stock
option owned by managers. The usage of debt can mitigate such agency problem. In
contrast, higher leverage firms have lower agency cost between shareholders and
managers. The stock market return has negative influence on leverage level. This
could be the issue of equity in good time or debt pay down (note that some debts have
restriction of new equity issue). To sum up, the agency cost can be a plausible reason
for the contrast behavior of the different groups toward the trend of stock market.
23
6.9 Credit spread
Credit spread reflects the direct cost of debt. It is found significantly negative for
all the subsamples except for high leverage firms in expansion. The solvency problem
is less in good time; this could cause the drop of sensitivity of credit spread.
6.10 Cross-sectional effect
All the subsamples have zero for p-value in the fixed effect test. Some
subsamples pass the Hausman test for random effect while others do not. In order to
unify the regressions, the full sample and the eight subsamples are regressed included
firm as cross-sectional fixed effect.
7. Conclusion
In this study we examine the effects of firm specific and macroeconomic variables
on 960 frims' leverage ratios in New York Stock Exchange and NASDAQ markets
between 1995 and 2010. The sample is divided on the basis of leverage level and
business cycles.
We find that both firm specific and macroeconomic variables have same effects
on full sample's debt ratio as previous researches found. Confirming the trade-off
theory, firms with more investments have less market leverage. Profitability,
convexity of taxation and market-to-book ratio all show significantly negative effects
on leverage ratio while size and collateral have the negative influence. This supports
the premise of Korajczk & Levy (2003) and Frank& Goyal (2007) findings. Besides,
our result on the effects of overall economic condition shows significantly negative,
which is consistent with the pecking order theory since firms would generate more
retained earnings of firms when market goes up, resulting in preference in using
internal funds for financing choices. Moreover, credit spread, a measure of cost of
debt, shows significantly negative effect on leverage ratio. Stock market is found to
24
have highly non-linear patterns among low-leverage and high-leverage firms.
Our results on non-linearity leverage subsamples give us new aspects towards
variables' effects on debt. Compared with low leverage firms, variables of high
leverage firms show more sensitive and significant influence on leverage changes.
The coefficients sign of high leverage firms keep the same as full sample expect the
insignificant effect of collateral level. We suppose the high underlying bankrupt cost
of high-debt firms would be one reason. As for low leverage firms, they tend to have
more financial flexibility and thus leads to insignificance effects of firm specific
variables. On the other hand, the impacts of stock market return become differently
significant between two subsamples. Levy's (2001) agency cost model supports our
finding, which stock market return to debt ratio is positively related for low leverage
firms while negatively related for high leverage firms.
When we take business cycle into consideration, more differences can be found.
In general, all variables included firm specific and macroeconomic variables show
significant relationship to leverage in good time and variables of both high leverage
and low leverage firms become less sensitive in bad times. For high leverage firms,
PP&E is not significant except in good times. In booming economy, more collateral
shows positive signal to market even under the high bankrupt cost, which allows more
available debts. In addition, the tax benefit becomes less attractive to firms in the
recession and thus increases the bankruptcy risk and decreases the debt capacity,
according to trade-off theory.
Our results also contribute to raise a number of interesting issues that can be
addressed in future work. As macroeconomic conditions have obvious influence on
capital decision choices, and it would be interesting to study not only the influence on
capital structure but deeper the extent of structure change, such as the issuance of
equity or bond. Besides, this paper examines the sensitivities of determinants of
capital structure, given the firms are highly or lowly levered. That is to say, we do not
distinguish the high/low leverage firms’ deviations from their so-called optimal
leverage and leave it for the future studies.

25
References
Printed Sources:
Ogden J P. Advanced Corporate Finance: Policies and Strategies. Prentice Hall(2003)
USA
Articles:
Modigliani. F.and Miller. M. The Cost of Capital, Corporation Finance and the
Theory of Investment. American Economic Review (1958)
http://www.jstor.org/stable/1809766.
Myers, Stewart and Nicholal S. Majluf. Corporate Financing and Investment
Decisions when Firms have Information that Investors Do Not Have. Journal of
Financial Economics(1984) Vol. 13No. 2page187-221
Kraus, A. and R.H. Litzenberger. A State Preference Model of Optimal Financial
Leverage. Journal of Finance(1973) September.page 911-922
Flannery,Mark J. and Rangan, Kasturi P.Partial Adjustment Toward Target Capital
Structures (2004).
http://ssrn.com/abstract=467941
Mackay,Peter and Phillips, Gordon M.Is There an Optimal Industry Financial
Structure(2002).
http://ssrn.com/abstract=269249 or doi:10.2139/ssrn.269249
Malcolm Baker, Jeffrey Wurgler. Market Timing and Capital Structure. The Journal
of Finance(2002) Vol57( 1)pages 1–32
Fattouh, Bassam, Harris, Laurence and Scaramozzino,Pasquale. Non-Linearity in the
Determinants of Capital Structure: Evidence from UK Firms (2005)
http://ssrn.com/abstract=789304
Stulz.R. Managerial discretion and optimal financial policies.Journal of
FinancialEconomics(1990)Vol26page 3-27
Fama, Eugene F. and French, Kenneth R. Testing Tradeoff and Pecking Order
Predictions About Dividends and Debt (2000)
http://ssrn.com/abstract=199431 or doi:10.2139/ssrn.199431
Robert Korajczyk with Amnon Levy.Capital Structure Choice: Macroeconomic

26
Conditions and Financial Constraints. Journal of Financial
Economics(2003)Vol68page75-109
Sheridan Titman and Roberto Wessels. The Determinants of Capital Structure Choice.
The Journal of Finance(1988).
http://links.jstor.org/sici?sici=0022-1082%28198803%2943%3A1%3C1%3ATDOCS
C%3E2.0.CO%3B2-A
Hovakimian, A., Opler, T., Titman, S. The debt-equity choice. Journal of Financial
and Quantitative Analysis(2001)Vol 36(1)page 1-24
Frank, Murray Z. and Goyal, Vidhan K. Trade-Off and Pecking Order Theories of
Debt (2007).
http://ssrn.com/abstract=670543
Korajczyk, R., Lucas, D., and McDonald, R. L.Equity issues with time-varying
asymmetric information. Journal of Financial and Quantitative
Analysis(1992)Vol27(3)page397–417
Choe, Hyuk,Masulis,Ronald W and Nanda, Vikram K. Common Stock Offerings
Across the Business Cycle: Theory and Evidence. Journal of Empirical Finance(1993)
http://ssrn.com/abstract=903156
Bayless, M., Chaplinsky, S. Is there a window of opportunity for seasoned equity
Issuance.Journal of Finance(1996)Vol51page253--278.
Miao, Jianjun,Hackbarth ,Dirk and Morellec, Erwan,.Capital Structure, Credit Risk,
and Macroeconomic Conditions.Simon School of Business Working Paper (2004)
http://ssrn.com/abstract=395480 or doi:10.2139/ssrn.395480
Bengt Holmstrom; Jean Tirole. Financial Intermediation, Loanable Funds, and the
Real Sector.The Quarterly Journal of Economics (1997)
http://links.jstor.org/sici?sici=0033-5533%28199708%29112%3A3%3C663%3AFIL
FAT%3E2.0.CO%3B2-Z
Ricardo J. Caballero & Arvind Krishnamurthy. Collective Risk Management in a
Flight to Quality Episode.Journal of Finance.American Finance Association(2008)Vol
63(5)page 2195-2230
Graham, John R. and Harvey, Champbell R. The Theory and Practice of Corporate
Finance: Evidence from the Field. AFA 2001 New Orleans. Duke University Working
Paper(1999). http://ssrn.com/abstract=220251 or doi:10.2139/ssrn.220251
Tim Adam, Vidhan K. Goyal. The investment opportunity set and its proxy
variables.Journal of Financial Research (2008)Vol 31 (1) page41–63

27
Franck Bancel & Usha R. Mittoo. Why Do European Firms Issue Convertible Debt:
European Financial Management.Blackwell Publishing Ltd(2004 )vol. 10(2), pages
339-373
Erel, Isil, Julio, Brandon, Kim, Woojin and Weisbach, Michael S.Macroeconomic
Conditions and Capital Raising. Charles A. Dice Center Working Paper(2011)
http://ssrn.com/abstract=1803455
Taggart, Jr. R.A. Secular patterns in the financing of U.S. corporations. (University of
Chicago Press, New York), in Friedman, B.M. Corporate Capital Structures in the
United States(1985)
Chen, Hui.Macroeconomic Conditions and the Puzzles of Credit Spreads and Capital
Structure . Journal of Finance(2009)
http://ssrn.com/abstract=1480409
Baker, Malcolm P.Market-Driven Corporate Finance (2009)
http://ssrn.com/abstract=1331567
Campello, Murillo.Capital Structure and Product Markets Interactions: Evidence
from Business Cycles (2001)
http://ssrn.com/abstract=198228 or doi:10.2139/ssrn.198228
Levy, Amnon. Why Does Capital Structure Choice Vary with Macroeconomic
Conditions? (2000)
http://ssrn.com/abstract=1295832
Stulz, ReneM.Managerial control of voting rights: Financing policies and the market
for corporate control.Journal of Financial Economics (1988)vol. 20(1-2)pages 25-54
28
Appendix
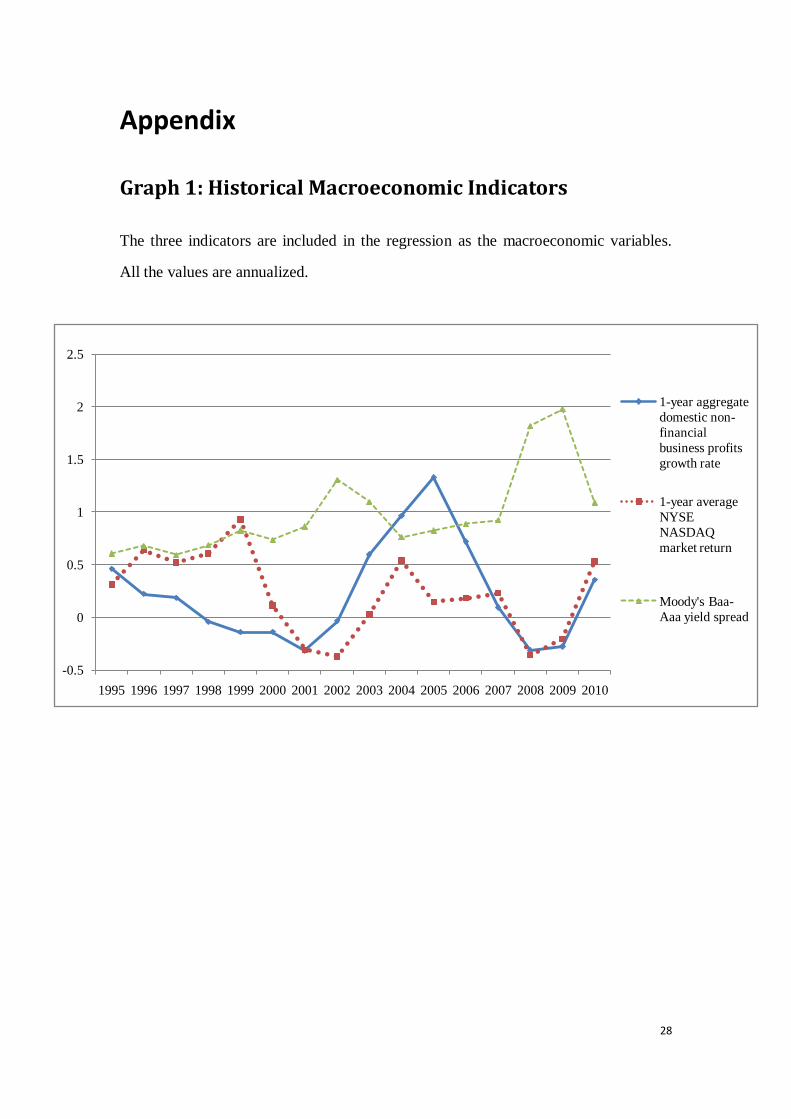
Graph 1: Historical Macroeconomic Indicators
The three indicators are included in the regression as the macroeconomic variables.
All the values are annualized.
-0.5
0
0.5
1
1.5
2
2.5
1995 1996 1997 1998 1999 2000 2001 2002 2003 2004 2005 2006 2007 2008 2009 2010
1-year aggregate
domestic non-
financial
business profits
growth rate
1-year average
NYSE
NASDAQ
market return
Moody's Baa-
Aaa yield spread

29
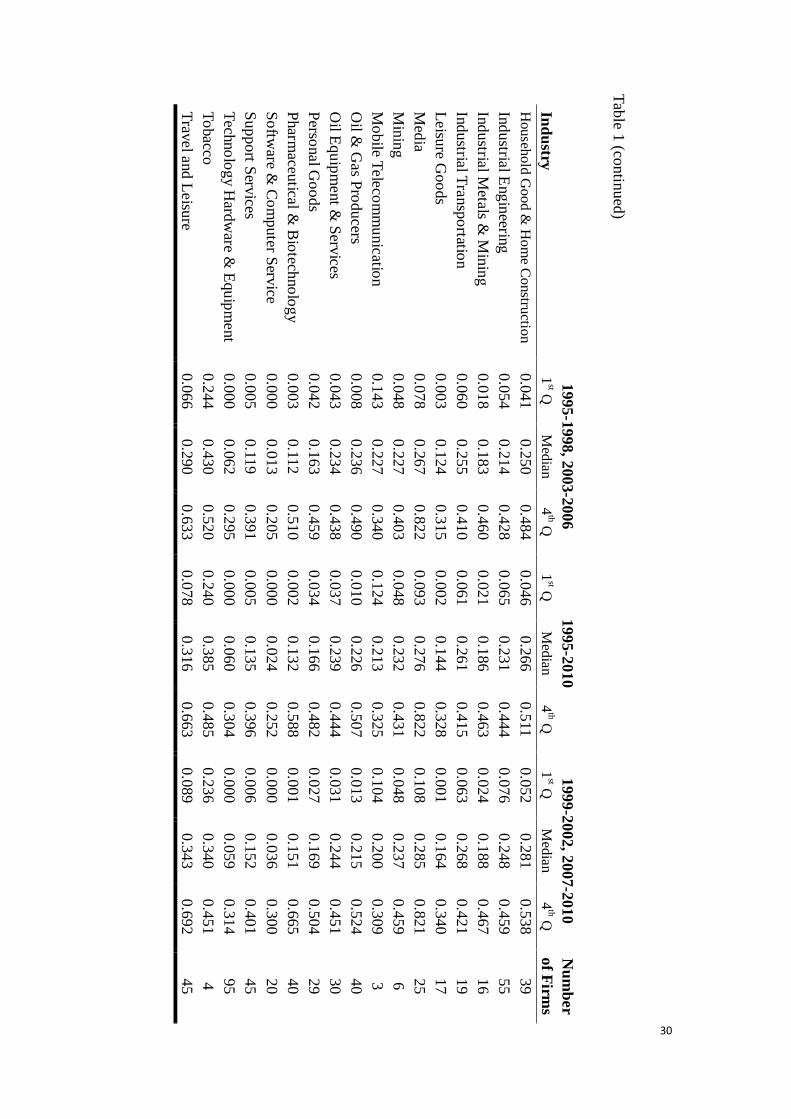
Ta
ble
1: D
ata
De
scriptio
n: L
ev
era
ge
leve
l of in
du
stry
Each
leverag
e level is co
mputed
as averag
e valu
e durin
g th
e specified
span
of tim
e. 1st Q
and 4
th Q refer to
ascendin
g first q
uan
tile and last
quan
tile, respectiv
ely. The n
um
ber o
f firms is to
taled 9
60, eq
ual to
the su
mm
ation o
f num
ber o
f firms o
f each in
dustry.
1
99
5-1
99
8, 2
00
3-2
00
6
19
95
-20
10
1
99
9-2
00
2, 2
00
7-2
01
0
Nu
mb
er
of F
irms
Ind
ustry
1
st Q
Med
ian
4
th Q
1st Q
M
edia
n
4th Q
1
st Q
Med
ian
4
th Q
Aero
space &
Defe
nse
0
.08
1
0.2
31
0.4
15
0.0
61
0.2
19
0.4
26
0.0
40
0.2
06
0.4
41
19
Altern
ative E
nerg
y
0.0
03
0.1
00
0.7
13
0.0
07
0.1
08
0.5
34
0.0
11
0
.11
5
0.3
54
4
Au
tom
ob
ile & P
arts 0
.02
6
0.2
12
0.4
61
0.0
29
0.2
30
0.4
96
0.0
31
0.2
48
0.5
31
16
Beverag
e
0.1
07
0.2
83
0.5
36
0.1
02
0.2
72
0.5
43
0.0
98
0.2
60
0.5
50
7
Ch
em
icals
0.0
54
0.2
52
0.4
35
0.0
61
0.2
57
0.4
37
0.0
68
0.2
62
0.4
40
43
Co
nstru
ction &
Materia
ls 0
.05
6
0.2
20
0.3
87
0.0
54
0.2
32
0.4
02
0.0
52
0.2
44
0.4
15
36
Electric
ity
0.2
92
0.3
65
0.5
14
0.2
91
0.3
75
0.5
08
0.2
91
0.3
84
0.5
01
37
Electro
nic &
Electrica
l Eq
uip
ment
0.0
01
0.1
04
0.3
93
0.0
01
0.1
22
0.4
07
0.0
02
0.1
41
0.4
20
69
Fix
ed L
ine T
eleco
mm
un
ication
0
.22
3
0.4
16
0.7
95
0.2
48
0.4
41
0.8
08
0.2
73
0.4
67
0.8
21
6
Fo
od &
Dru
gs R
etailers 0
.04
3
0.2
04
0.4
84
0.0
48
0.2
10
0.4
87
0.0
52
0.2
17
0.4
90
15
Fo
od P
rod
ucers
0.0
26
0.2
21
0.4
49
0.0
29
0.2
38
0.4
65
0.0
32
0.2
54
0.4
81
31
Fo
restry &
Pap
er 0
.16
1
0.2
79
0.5
50
0.1
92
0.3
02
0.6
04
0.2
24
0.3
25
0.6
59
4
Gas, W
ater & M
ultiu
tilities
0.2
83
0.3
64
0.4
98
0.2
82
0.3
69
0.5
13
0.2
81
0.3
74
0.5
27
34
Gen
eral In
du
stries
0.1
29
0.2
87
0.5
37
0.1
46
0.2
99
0.5
45
0.1
62
0.3
10
0.5
52
21
Gen
eral R
etailers
0.0
08
0.1
74
0.3
67
0.0
10
0.1
79
0.3
78
0.0
13
0.1
84
0.3
90
43
Hea
lth C
are Eq
uip
ment &
Serv
ice
0.0
07
0.1
50
0.4
42
0.0
09
0.1
73
0.5
10
0.0
11
0
.19
6
0.5
78
43
30
Tab
le 1 (co
ntin
ued
)
1
99
5-1
99
8, 2
00
3-2
00
6
19
95
-20
10
1
99
9-2
00
2, 2
00
7-2
01
0
Nu
mb
er
of F
irms
Ind
ustry
1st Q
M
edia
n
4th Q
1
st Q
Med
ian
4
th Q
1st Q
M
edia
n
4th Q
Househ
old
Good &
Hom
e Constru
ction
0
.04
1
0.2
50
0.4
84
0.0
46
0.2
66
0.5
11
0
.05
2
0.2
81
0.5
38
39
Ind
ustria
l Eng
ineerin
g
0.0
54
0.2
14
0.4
28
0.0
65
0.2
31
0.4
44
0.0
76
0.2
48
0.4
59
55
Ind
ustria
l Meta
ls & M
inin
g
0.0
18
0.1
83
0.4
60
0.0
21
0.1
86
0.4
63
0.0
24
0.1
88
0.4
67
16
Ind
ustria
l Tra
nsp
ortatio
n
0.0
60
0.2
55
0.4
10
0.0
61
0.2
61
0.4
15
0.0
63
0.2
68
0.4
21
19
Leisu
re Go
od
s 0
.00
3
0.1
24
0.3
15
0.0
02
0.1
44
0.3
28
0.0
01
0.1
64
0.3
40
17
Med
ia
0.0
78
0.2
67
0.8
22
0.0
93
0.2
76
0.8
22
0.1
08
0.2
85
0.8
21
25
Min
ing
0
.04
8
0.2
27
0.4
03
0.0
48
0.2
32
0.4
31
0.0
48
0.2
37
0.4
59
6
Mo
bile T
ele
com
mu
nic
ation
0
.14
3
0.2
27
0.3
40
0.1
24
0.2
13
0.3
25
0.1
04
0.2
00
0.3
09
3
Oil &
Gas P
rod
ucers
0.0
08
0.2
36
0.4
90
0.0
10
0.2
26
0.5
07
0.0
13
0.2
15
0.5
24
40
Oil E
qu
ipm
ent &
Serv
ices
0.0
43
0.2
34
0.4
38
0.0
37
0.2
39
0.4
44
0.0
31
0.2
44
0.4
51
30
Perso
nal G
oo
ds
0.0
42
0.1
63
0.4
59
0.0
34
0.1
66
0.4
82
0.0
27
0.1
69
0.5
04
29
Pharm
aceutica
l & B
iotech
no
log
y
0.0
03
0.1
12
0
.51
0
0.0
02
0.1
32
0.5
88
0.0
01
0.1
51
0.6
65
40
So
ftware &
Co
mp
uter S
ervice
0
.00
0
0.0
13
0.2
05
0.0
00
0.0
24
0.2
52
0.0
00
0.0
36
0.3
00
20
Su
pp
ort S
ervices
0.0
05
0.1
19
0
.39
1
0.0
05
0.1
35
0.3
96
0.0
06
0.1
52
0.4
01
45
Tech
no
log
y H
ardw
are & E
qu
ipm
ent
0.0
00
0.0
62
0.2
95
0.0
00
0.0
60
0.3
04
0.0
00
0.0
59
0.3
14
95
To
bacco
0
.24
4
0.4
30
0.5
20
0.2
40
0.3
85
0.4
85
0.2
36
0.3
40
0.4
51
4
Trav
el a
nd
Leisu
re
0.0
66
0.2
90
0.6
33
0.0
78
0.3
16
0.6
63
0.0
89
0.3
43
0.6
92
45
31
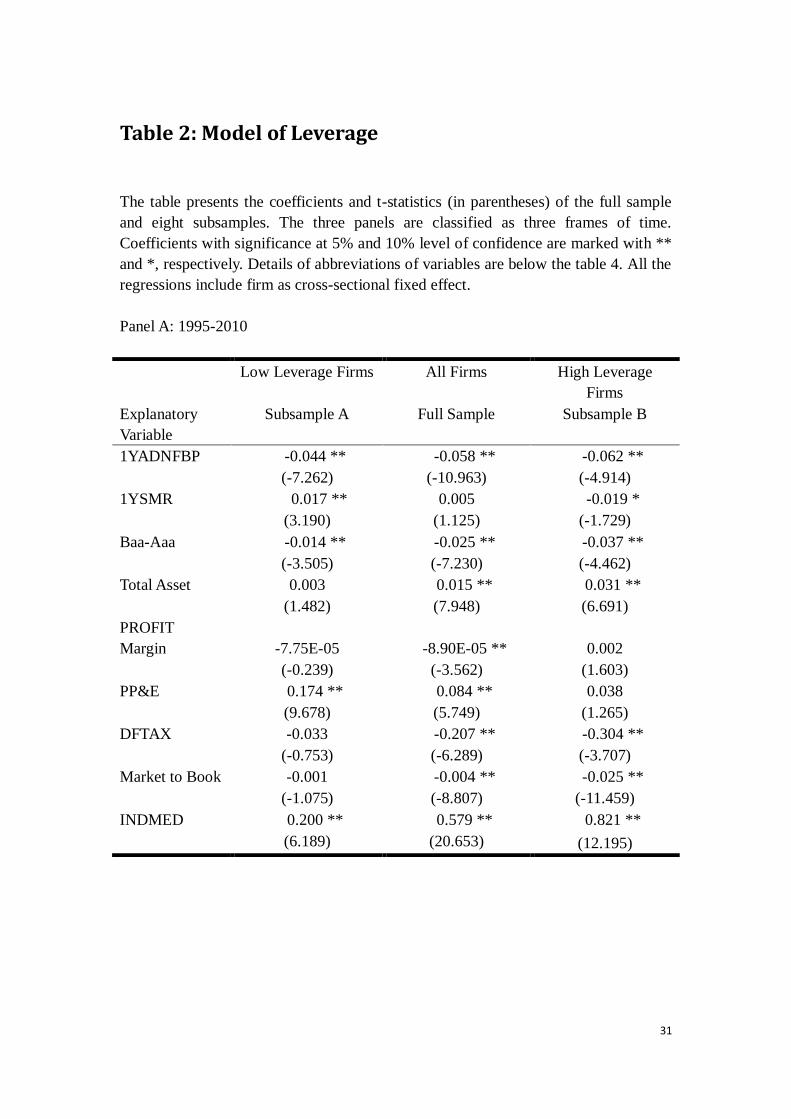
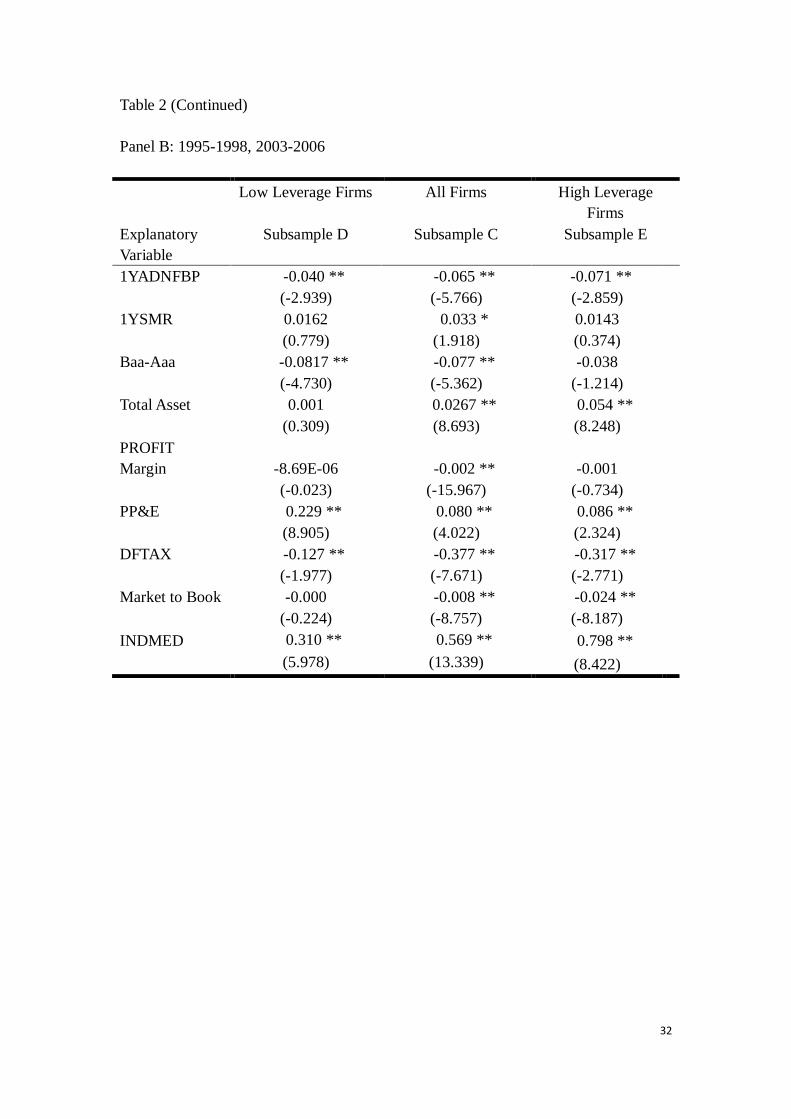
Table 2: Model of Leverage
The table presents the coefficients and t-statistics (in parentheses) of the full sample
and eight subsamples. The three panels are classified as three frames of time.
Coefficients with significance at 5% and 10% level of confidence are marked with **
and *, respectively. Details of abbreviations of variables are below the table 4. All the
regressions include firm as cross-sectional fixed effect.
Panel A: 1995-2010
Low Leverage Firms All Firms High Leverage
Firms
Explanatory
Variable
Subsample A Full Sample Subsample B
1YADNFBP -0.044 ** -0.058 ** -0.062 **
(-7.262) (-10.963) (-4.914)
1YSMR 0.017 ** 0.005 -0.019 *
(3.190) (1.125) (-1.729)
Baa-Aaa -0.014 ** -0.025 ** -0.037 **
(-3.505) (-7.230) (-4.462)
Total Asset 0.003 0.015 ** 0.031 **
(1.482) (7.948) (6.691)
PROFIT
Margin -7.75E-05 -8.90E-05 ** 0.002
(-0.239) (-3.562) (1.603)
PP&E 0.174 ** 0.084 ** 0.038
(9.678) (5.749) (1.265)
DFTAX -0.033 -0.207 ** -0.304 **
(-0.753) (-6.289) (-3.707)
Market to Book -0.001 -0.004 ** -0.025 **
(-1.075) (-8.807) (-11.459)
INDMED 0.200 ** 0.579 ** 0.821 **
(6.189) (20.653) (12.195)
32
Table 2 (Continued)
Panel B: 1995-1998, 2003-2006
Low Leverage Firms All Firms High Leverage
Firms
Explanatory
Variable
Subsample D Subsample C Subsample E
1YADNFBP -0.040 ** -0.065 ** -0.071 **
(-2.939) (-5.766) (-2.859)
1YSMR 0.0162 0.033 * 0.0143
(0.779) (1.918) (0.374)
Baa-Aaa -0.0817 ** -0.077 ** -0.038
(-4.730) (-5.362) (-1.214)
Total Asset 0.001 0.0267 ** 0.054 **
(0.309) (8.693) (8.248)
PROFIT
Margin -8.69E-06 -0.002 ** -0.001
(-0.023) (-15.967) (-0.734)
PP&E 0.229 ** 0.080 ** 0.086 **
(8.905) (4.022) (2.324)
DFTAX -0.127 ** -0.377 ** -0.317 **
(-1.977) (-7.671) (-2.771)
Market to Book -0.000 -0.008 ** -0.024 **
(-0.224) (-8.757) (-8.187)
INDMED 0.310 ** 0.569 ** 0.798 **
(5.978) (13.339) (8.422)
33
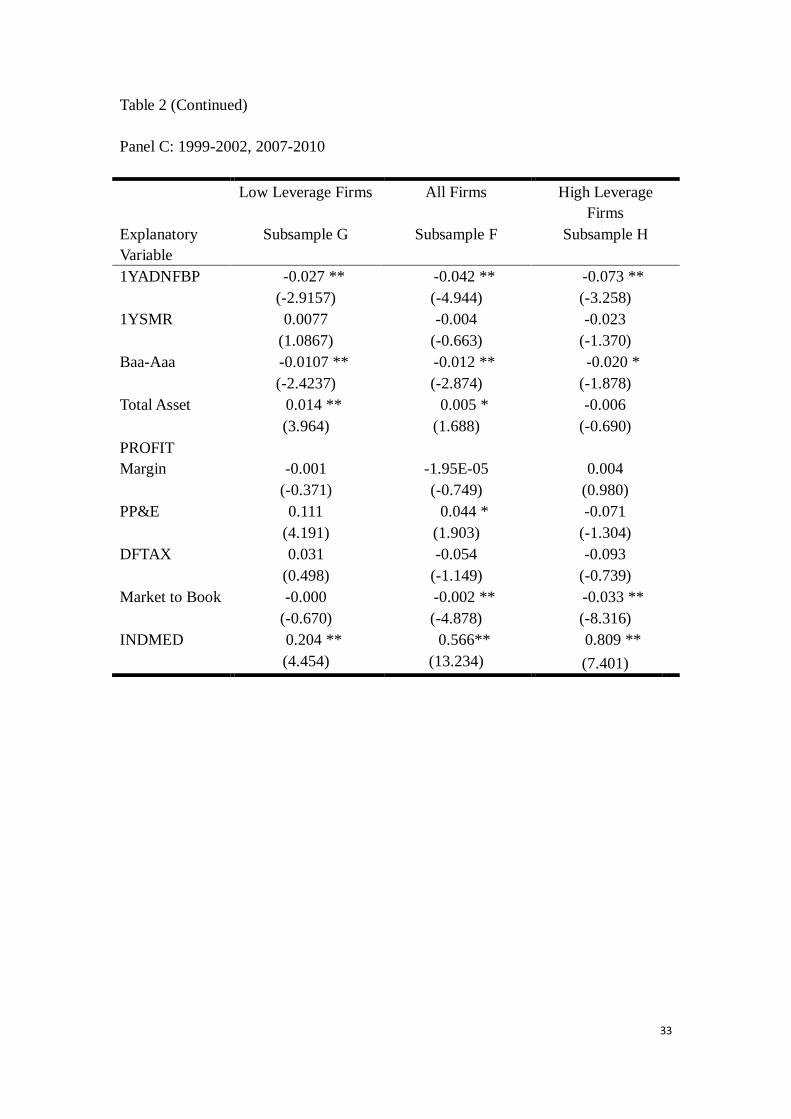
Table 2 (Continued)
Panel C: 1999-2002, 2007-2010
Low Leverage Firms All Firms High Leverage
Firms
Explanatory
Variable
Subsample G Subsample F Subsample H
1YADNFBP -0.027 ** -0.042 ** -0.073 **
(-2.9157) (-4.944) (-3.258)
1YSMR 0.0077 -0.004 -0.023
(1.0867) (-0.663) (-1.370)
Baa-Aaa -0.0107 ** -0.012 ** -0.020 *
(-2.4237) (-2.874) (-1.878)
Total Asset 0.014 ** 0.005 * -0.006
(3.964) (1.688) (-0.690)
PROFIT
Margin -0.001 -1.95E-05 0.004
(-0.371) (-0.749) (0.980)
PP&E 0.111 0.044 * -0.071
(4.191) (1.903) (-1.304)
DFTAX 0.031 -0.054 -0.093
(0.498) (-1.149) (-0.739)
Market to Book -0.000 -0.002 ** -0.033 **
(-0.670) (-4.878) (-8.316)
INDMED 0.204 ** 0.566** 0.809 **
(4.454) (13.234) (7.401)

34
Table 3: Test of Fixed Effect of Panel Data
The figure is the result of fixed effect of the full sample. The eight subsamples all
have zero for p-value.
Full sample Statistic d.f. Prob
Cross-section F 17.432 -959.144 0.000
Cross-section Chi-square 11839.030 959 0.000

35
Table 4: Cross Correlations of Variables
The table is cross correlation test of the nine variables included in the regression.
List of Abbreviations:
1YADNFBP 1YSMR Baa-Aaa TA PROFIT PP&E DFTAX MB INDMED
1YADNFBP 1.000
1YSMR 0.354 1.000
Baa-Aaa -0.281 -0.250 1.000
TA 0.025 -0.092 0.195 1.000
PROFIT -0.004 0.013 -0.008 0.024 1.000
PP&E -0.008 0.031 -0.054 0.189 0.015 1.000
DFTAX -0.010 0.001 -0.050 0.263 0.007 0.428 1.000
MB -0.008 -0.016 -0.042 -0.187 -0.016 -0.121 -0.071 1.000
INDMED -0.033 -0.040 0.035 0.258 0.014 0.494 0.352 -0.146 1.000
1YADNFBP : One-year aggregate domestic non-financial business profits growth rate.
1YSMR : One-year stock market return, computed as average return of NYSE and NASDAQ index
Baa-Aaa : Annualized yield spread of Baa and Aaa bond of Moody’s.
TA : Logarithm of total asset.
Profit : Profit margin.
DFTAX : Net deferred tax assets.
MB : Market-to-book ratio
INDMED : Median leverage level of industry.