the effect of environmental constraints on land prices · pdf fileconsumptive value ... given...
TRANSCRIPT
The Effect of Environmental Constraints on Land Prices
November 2015
Prepared by: Phil Journeaux AgFirst Waikato Ltd

2 | P a g e
A study funded via the Farmax/Dairy NZ Dairy Consultant of the Year Award An acknowledgement to Kevin Wilson, Rural and Agri-Business Research, for providing comments on drafts.
The content of this report is based upon current available information and is only intended for the use of the party named. All due care was exercised by AgFirst Waikato Ltd in the preparation of this report. Any action in reliance on the accuracy of the information contained in this report is the sole commercial decision of the user of the information and is taken at their own risk. Accordingly, AgFirst Waikato Ltd disclaims any liability whatsoever in respect of any losses or damages arising out of the use of this information or in respect of any actions taken in reliance upon the validity of the information contained within this report.

3 | P a g e
Table of Contents Executive Summary ................................................................................................... 4
Purpose ...................................................................................................................... 6
Background ................................................................................................................ 6
Determinants of Land Price ........................................................................................ 6
Productive Value..................................................................................................... 7
Economic Theory ................................................................................................ 7
Relationship between Profitability and Land Value ............................................. 8
Land Values and Return on Capital ...................................................................... 11
Consumptive Value ............................................................................................... 12
Speculative Value ................................................................................................. 13
Access to credit ................................................................................................. 14
Transactional Influences ....................................................................................... 16
Summary .............................................................................................................. 17
Value versus Price ................................................................................................... 17
Impact of Environmental Constraints........................................................................ 19
Impact on Farm Profitability .................................................................................. 19
Diffuse Discharges to Water ............................................................................. 19
Carbon Charges ................................................................................................ 20
Impact on Future Flexibility ................................................................................... 20
Impact of Environmental Constraints: Taupo and Rotorua Lake Catchments ...... 22
Conclusions .............................................................................................................. 24
References ............................................................................................................... 26

4 | P a g e
Executive Summary The value of land is an important component of any farming business. Often it is the largest balance sheet item, a key determinant of farm ownership, and a key factor in the level of debt a farming business incurs. There are three fundamental drivers of land value:
(i) Productive value; the value relative to the rent, or profits, obtainable from the land;
(ii) Consumptive value; this includes amenity factors such as recreational opportunities and scenery, plus intangibles such as the countryside is a nice place to live, a great place to bring up children, you’re your own boss, and farming is a great lifestyle; and
(iii) Speculative value; the ability of an asset to retain its value/the return on the asset as an investment
In addition there is a lesser fourth component; transactional factors, which may affect the price on the day. These include forced sales and family transactions. Of the above, it could be expected that the Productive component has the biggest impact. Analysis of dairy and sheep & beef income and land prices in New Zealand shows that over the last two decades farm profitability has only a moderate relationship with dairy land, and almost no relationship with sheep & beef land – the latter being driven more by dairy profitability and payouts. Consumptive value appears to have a significant effect on land values, but it is difficult to quantify this due to the variability and individuality of the impact. New Zealand farmers would appear to be ready to accept relatively low cash returns from their farming business, in return for the assumption that they will be compensated by good capital gains in land value – an assumption that has proven largely correct over the last 3 decades, although not as much since 2008. In this respect the speculative component of land value has also been high. Across New Zealand, there is now a concerted effort to reduce the environmental footprint of farming. This is largely around reducing diffuse contaminant discharges of nitrogen, phosphorous, sediment, and microbes, to water. This will impact (or has impacted) on farming in two ways;
(i) By increasing costs/decreasing profitability, which affects the productive component of land value, and
(ii) By significantly reducing the opportunity to intensify production, both in-situ, and via land use change, which affects the speculative component of land value.
Potentially, an environmental improvement may result in an increased consumptive value, helping to offset the productive/speculative effect. Again this is difficult to quantify generically as it would depend on the individual circumstances. For example a small improvement in a river or lake (which was already swimmable/fishable) may

5 | P a g e
have limited impact, whereas a large improvement (from non-swimmable/fishable to swimmable/fishable) may result in a significant lift in the consumptive value. Given the complexity of the interactions between the factors affecting land value, it is difficult to readily quantify the degree to which environmental constraints will impact on land value, but the probability of an adverse impact is very high. The limited data to date, from catchments affected by constraints, would support this. On the assumption that dairying is (currently) the best/highest use for pastoral farming, then dairy land values will be mostly impacted by constraints that affect profitability. Proportionally, however, the effect on forestry, under-developed land, and sheep & beef land values is likely to be higher, due to a combination of profitability effects, but especially so due to the second effect noted; the reduced ability for land use change. In a number of catchments under consideration of constraints on contaminant discharges, the modelling used has assumed some degree of “reverse” land use change in order to meet the new limits. If this occurs, one could expect the process to be very sticky, and the (adverse) impact on land values could be severe. At a national level, the implication of the impact of environmental constraints on land values is that the credit risk of farming, and the credit risk of banks, would be significantly increased, although this would be a transitional effect – it would be current landowners that would bear the brunt of this impact, before a new equilibrium was reached.

6 | P a g e
Purpose The intent of this paper is to investigate the relationship between the price of dairy and sheep & beef land in New Zealand, relative to the three main determinants of land value, and then consider how environmental constraints could affect these determinants and hence flow through to affecting land values.
Background Land is the single biggest investment farmers usually make in their farming business and the value of this constitutes a major proportion of most balance sheets. The price of land is often a key component in determining the entry or otherwise into a farming career in the sense that farming traditionally requires ownership of one’s own land, and is a major aspect of farm profitability, as it is the price of land which usually determines the level of debt being carried by the farming business. Currently, New Zealand farmers, particularly dairy farmers, are carrying high levels of debt and factors which have the potential to reduce land prices are generally regarded with concern. Over the last two decades there has been a concerted effort to reduce the environmental footprint of farming, very largely driven by the Resource Management Act (1991). With the recent introduction of the National Policy Statement on Freshwater, Regional Councils are moving to introduce discharge constraints on farms relating to nitrogen, phosphorous, microbes, and sediment. These constraints are leading to an increased cost of farming due to the cost of mitigation practices, as well as reducing the flexibility of future land use change. Both of which have the potential to impact on the price of land.
Determinants of Land Price The three fundamental drivers of land value are a combination of:
Productive value; the value relative to the rent, or profits, obtainable from the land;
Consumptive value; this includes amenity factors such as recreational opportunities and scenery, plus intangibles such as the countryside is a nice place to live, a great place to bring up kids, you’re your own boss, and farming is a great lifestyle; and
Speculative value; the ability of an asset to retain its value/the return on the asset as an investment
In addition to this there are also transactional components which can also affect land prices, e.g. forced sale, sale to family members, the size/scale of the operation, and the value of any improvements.
7 | P a g e
Productive Value Of the three fundamental drivers, it could be expected that the productive component would have the most influence. Profitability in itself is influenced by a wide range of factors, including:
The quality and productivity of the land
The weather/climate
Costs and returns
The stage of development of the property
The ability of the farmer
Economic Theory In a simple economic sense the price of an income earning asset such as a farm is the present value of its discounted expected future net income stream. Looking at this in different ways;
1. Given the benefit of perfect hindsight – we know the profitability levels of dairy farming over the last two decades, so if we travel back to the year 2000 and do a Net Present Value calculation forward to 2014 (last year of actual data), at a discount rate of 7.0% (the average Business Interest rate (Reserve Bank) at the time), we get a land value of $14,026/hectare. Which compares to the average price of dairy land in 2000 of $12,560/hectare. So close-ish.
2. If we do the same calculation in the year 2005, with the discount rate of 7.1% (average Business Interest rate), we get a value of $12,405/hectare, versus an actual price of $20,970/hectare. So not so close.
3. If we look forward say 20 years from 2014, taking a three year average Economic Farm Surplus (EFS) as the best measure of farm profitability, and using the average business interest rate for 2013/14 (Reserve Bank 2015) of 5.5%, the value calculated is $30,868, which compares well with the average price of dairy land in 2013/14 of $31,311/ha.
If the methodology outlined in (3) above is used (i.e. the Present Value is calculated based on the average of the 3 preceding years’ EFS/ha, at the prevailing Business interest rate at the time and for a 20year period) for the period 1999 to 2014, the results are as follows:

8 | P a g e
Figure 1: Actual Dairy Land Value versus Calculated PV Value
So it would appear that economic theory worked in 2003 and 2014, but not so well in other years.
Relationship between Profitability and Land Value It could be expected that there would be a close relationship between Economic Farm Surplus (EFS), which is a direct reflection of profitability from the land, and land value. [Note all comparisons below are in nominal terms and are based on national averages] This is illustrated below. Figure 2: Dairy Land Value Relative to EFS
Source: Dairy NZ
$0
$5,000
$10,000
$15,000
$20,000
$25,000
$30,000
$35,000
1999 2000 2001 2002 2003 2004 2005 2006 2007 2008 2009 2010 2011 2012 2013 2014
Actual $/ha
Calculated PV Value $/ha (smoothed)
Calculated PV Value $/ha (based on EFS in immediate previous year)
$0
$500
$1,000
$1,500
$2,000
$2,500
$3,000
$3,500
$0
$5,000
$10,000
$15,000
$20,000
$25,000
$30,000
$35,000
19
91
19
92
19
93
19
94
19
95
19
96
19
97
19
98
19
99
20
00
20
01
20
02
20
03
20
04
20
05
20
06
20
07
20
08
20
09
20
10
20
11
20
12
20
13
20
14
EFS
Lan
d V
alu
e
Land Value $/ha EFS/Ha

9 | P a g e
The correlation between the two is 74%, and with an R2 of 0.546. If EFS is lagged by one year (i.e. land value is related to the previous years’ EFS), the correlation drops to 71% and R2 to 0.50. For sheep and beef farms, the correlation between the land value and EFS is 13% and with an R2 of 0.017. If EFS is lagged by one year (i.e. land value is related to the previous years’ EFS), the correlation drops to 9% and R2 to 0.01. Figure 3: Sheep & Beef Land Value Relative to EFS
Source: Beef + Lamb NZ
This would indicate that the driver of the sheep & beef land price was something other than the profitability of sheep & beef farming itself. If the S&B land price is compared with dairying profitability, the “fit” is much stronger, as illustrated below. Figure 4: Sheep & Beef Land Price versus Dairy EFS
Source: Beef + Lamb NZ, Dairy NZ
The correlation between these two indices is 75%, and with a R2 of 0.563.
-50
0
50
100
150
200
0100020003000400050006000700080009000
19
90
-91
19
91
-92
19
92
-93
19
93
-94
19
94
-95
19
95
-96
19
96
-97
19
97
-98
19
98
-99
19
99
-00
20
00
-01
20
01
-02
20
02
-03
20
03
-04
20
04
-05
20
05
-06
20
06
-07
20
07
-08
20
08
-09
20
09
-10
20
10
-11
20
11
-12
20
12
-13
20
13
-14
EFS
$/h
a
Lan
d V
alu
e $
/ha
S&B Land Value $/ha S&B EFS/ha
0
500
1000
1500
2000
2500
3000
3500
0
1000
2000
3000
4000
5000
6000
7000
8000
9000
19
90
-91
19
91
-92
19
92
-93
19
93
-94
19
94
-95
19
95
-96
19
96
-97
19
97
-98
19
98
-99
19
99
-00
20
00
-01
20
01
-02
20
02
-03
20
03
-04
20
04
-05
20
05
-06
20
06
-07
20
07
-08
20
08
-09
20
09
-10
20
10
-11
20
11
-12
20
12
-13
20
13
-14
EFS
$/h
a
Lan
d V
alu
e $
/ha
S&B Land Value $/ha Dairy EFS/Ha

10 | P a g e
Another possible indicator/predictor of land prices is the dairy payout. Analysis using the Dairy NZ dataset showed: Table 1: Correlation and Regression Analysis on Dairy Land Values versus Payout
Correlation R2
Dairy Land Value vs Dairy Payout 87% 0.75
S&B Land Value versus Dairy Payout 85% 0.72
Overall therefore the dairy payout would appear to be a better indicator/predictor of land values, both dairying and sheep and beef, than the profitability of each (as measured by EFS). The reason it is a better predictor of S&B land prices is the degree of dairy conversions carried out over the last two decades, and some expectation of this is built into the land price (which represents a speculative factor of the land value). While the above correlations/regression factor would appear to be “reasonable” they are not sufficient to calculate land values with a high degree of confidence. The regression formula for dairy land (as an example) is; Land value = -3578.22 + (payout (expressed as $0.00)) x 4967.031, with a standard error of 4464.9. This standard error means that the value calculated would be + or – anything from 10% to 30%+, depending on the payout (the lower the payout, the larger the error). The analysis indicates that the “productive” component of land value varies in its importance; while of moderate importance for dairy land values, it is almost totally unimportant for sheep & beef land – other factors are driving this value. It is also important to note that the data used relates to a national average, and it is very likely that the value of some hill country (for example) could well related better to its profitability, given the option of other more profitable land use is significantly less. This hypothesis was tested using the Beef + Lamb Class 3 North Island Hard Hill Country dataset, on the basis this was as far from dairying as is possible. The results showed;
Table 2: Relationship between Class 3 Hard Hill Country Model land Value and various Indices
Correlation (%) R2
Class 3 Land Value and Class 3 EFS/ha 17 0.03
Class 3 Land Value and Dairy EFS/ha 49 0.43
Class 3 Land Value and Dairy Payout 75 0.56
This shows a closer relationship between land value and profitability for Class 3 Hard Hill Country compared with the national level figures, but only just. Again there is a stronger relationship with the dairy indices, albeit at a weaker level compared with the national figures. So it would appear that the hypothesis noted above (that hill country land value is more closely related to its profitability) does not really hold up.
11 | P a g e
Another potential external influence on hill country land values is forestry, but time series datasets on forestry land values and (particularly) profitability are not readily available.
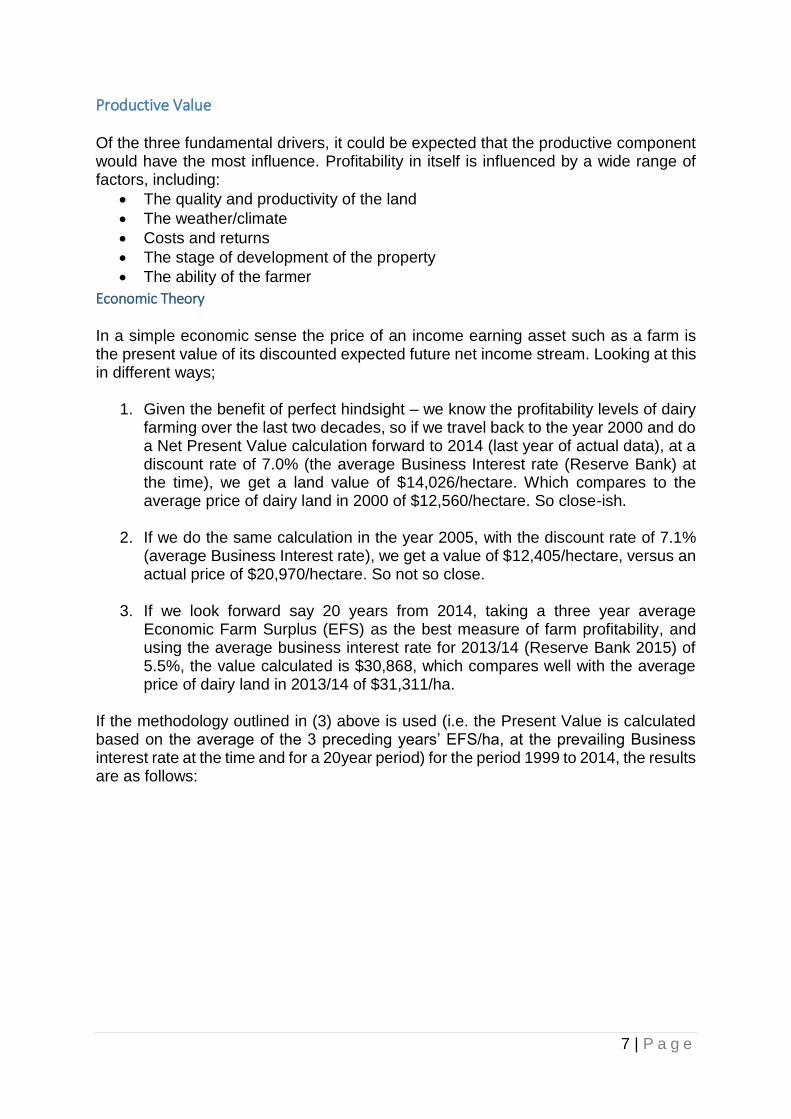
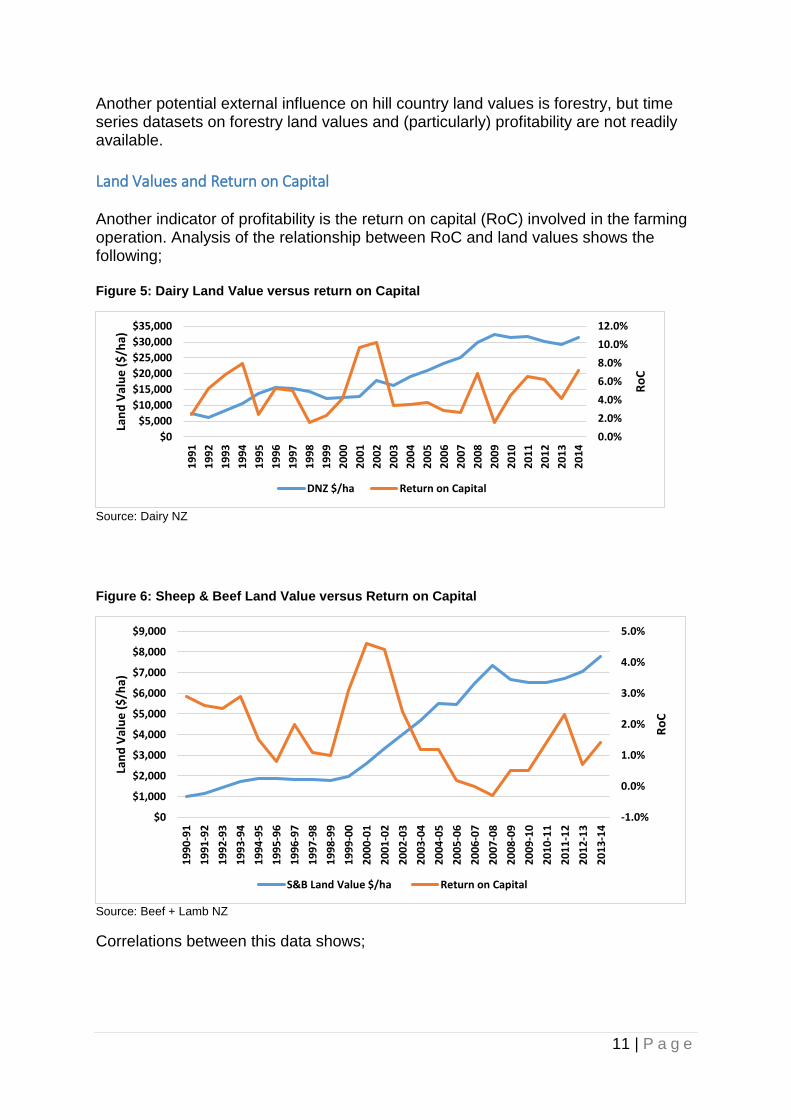
Land Values and Return on Capital Another indicator of profitability is the return on capital (RoC) involved in the farming operation. Analysis of the relationship between RoC and land values shows the following; Figure 5: Dairy Land Value versus return on Capital
Source: Dairy NZ
Figure 6: Sheep & Beef Land Value versus Return on Capital
Source: Beef + Lamb NZ
Correlations between this data shows;
0.0%
2.0%
4.0%
6.0%
8.0%
10.0%
12.0%
$0
$5,000
$10,000
$15,000
$20,000
$25,000
$30,000
$35,000
19
91
19
92
19
93
19
94
19
95
19
96
19
97
19
98
19
99
20
00
20
01
20
02
20
03
20
04
20
05
20
06
20
07
20
08
20
09
20
10
20
11
20
12
20
13
20
14
Ro
C
Lan
d V
alu
e (
$/h
a)
DNZ $/ha Return on Capital
-1.0%
0.0%
1.0%
2.0%
3.0%
4.0%
5.0%
$0
$1,000
$2,000
$3,000
$4,000
$5,000
$6,000
$7,000
$8,000
$9,000
19
90
-91
19
91
-92
19
92
-93
19
93
-94
19
94
-95
19
95
-96
19
96
-97
19
97
-98
19
98
-99
19
99
-00
20
00
-01
20
01
-02
20
02
-03
20
03
-04
20
04
-05
20
05
-06
20
06
-07
20
07
-08
20
08
-09
20
09
-10
20
10
-11
20
11
-12
20
12
-13
20
13
-14
Ro
C
Lan
d V
alu
e (
$/h
a)
S&B Land Value $/ha Return on Capital

12 | P a g e
Table 3: Correlations between Land Value and Return on Capital
Correlation (%)
Dairy Land Value versus RoC 0.1
Dairy Land Value lagged 1 year behind RoC -2.8
S&B Land Value versus RoC -54
S&B Land lagged 1 year behind RoC -50
All of which would indicate that return on capital is not a good indicator of future land value.
Consumptive Value This relates to a wide range of intangible values, such as; amenity factors, e.g. recreational opportunities (hunting, fishing), scenery, access to near-by urban centres, the countryside is a nice place to live, a great place to bring up children, you’re your own boss, and farming is a great lifestyle. These are very hard to measure, as they vary both with respect to the individual and to the farming situation/location. American studies (Torell et al 2005) found that “(New Mexico) ranch income was a statistically important determinant of land value, but yet a relatively small percentage of ranch value was explained by income earnings. Ranch location, scenic view, and the desirable lifestyle influenced ranch value more than ranch income”. They also noted that “Ranch buyers maximise utility, not profit”, and “western ranching has been both a way of life and a business, but it is now a business to only some”. Similarly Pope (1985) noted that “Consumptive demand applies significant upward pressure on rural land values and plays an important role in determining farm and ranch structure in Texas. Population density, proximity to major metropolitan centres, quality of deer hunting, and aesthetic differences across the state explain the majority of the differences in rural land values. On the average, only about 22 percent of the total market value of rural land in Texas can be statistically explained by its productive value”. Blank (2014) noted that there were four categories of influence on land values:
(i) The productivity of the land (ii) Policy effects (iii) Urban influence (iv) Amenity effects
The first two of these relate to the income generated from the land, either (a) directly or (b) as a result of government policies, e.g. subsidies. The last two are in effect consumptive influences. Over the period 1994 – 1996, USDA data shows that the average value of farmland that was not urban-influenced was $640/hectare, versus $1,880 for urban-influenced farmland (Blank, 2014). In other words 66% of the value of the urban-influenced farmland was due to non-agricultural factors. These urban influences would include access to services and the expectation of future subdivision, as well as the availability
13 | P a g e
of a ready market for fresh produce, with the attendant probability of higher returns relative to farming in a non-urban influenced area. The effect of amenities on land value varied from farm to farm. Amenities such as open spaces and water bodies tended to have a positive impact on land values, whereas high intensity agriculture tended to have a negative impact. Blank (2014) summarises this as; “people will pay extra to live near water or a park, but they do not want to see or smell any livestock”. Consumptive aspects therefore can have a significant influence on land values, but are difficult to readily quantify as they vary from farm to farm.
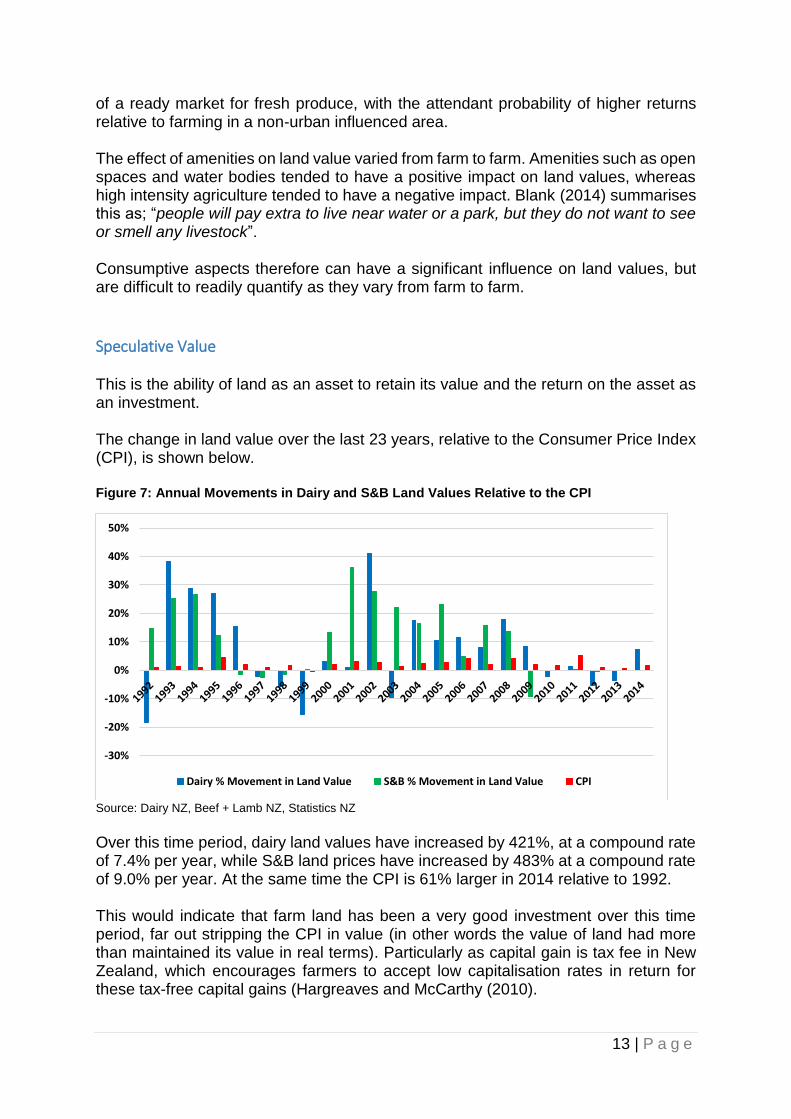
Speculative Value This is the ability of land as an asset to retain its value and the return on the asset as an investment. The change in land value over the last 23 years, relative to the Consumer Price Index (CPI), is shown below. Figure 7: Annual Movements in Dairy and S&B Land Values Relative to the CPI
Source: Dairy NZ, Beef + Lamb NZ, Statistics NZ
Over this time period, dairy land values have increased by 421%, at a compound rate of 7.4% per year, while S&B land prices have increased by 483% at a compound rate of 9.0% per year. At the same time the CPI is 61% larger in 2014 relative to 1992. This would indicate that farm land has been a very good investment over this time period, far out stripping the CPI in value (in other words the value of land had more than maintained its value in real terms). Particularly as capital gain is tax fee in New Zealand, which encourages farmers to accept low capitalisation rates in return for these tax-free capital gains (Hargreaves and McCarthy (2010).
-30%
-20%
-10%
0%
10%
20%
30%
40%
50%
Dairy % Movement in Land Value S&B % Movement in Land Value CPI

14 | P a g e
As a comparison, returns on various investment options in New Zealand over the period 1989- 2009 were: Table 4: Investment Returns In New Zealand 1989 - 2009
Return (% - CAGR)
Cash Deposits 7.1
Domestic Bonds 8.7
Domestic Shares 7.2
International shares (unhedged) 4.9
Residential property 10.2
Commercial property 6.7 Source: Reserve Bank 2012
Nevertheless, the degree of capital gain is dependent on the time period under investigation. As Figure 7 indicates, the movement in land prices has turned negative at different times. A person buying a farm in 2008, for example, will have gained 5% in value in a dairy farm, or -8% in a sheep & beef farm, relative to a 13% movement in the CPI, through to 2014. As can be seen in Figure 7, capital gains were significant in the early to mid1990’s, and again over the period 2000 – 2008. The relationship between capital gains relative to profitability would appear to be quite weak, with a correlation of -9% between the percentage movement in land prices lagged one year behind farm profitability (measured by EFS) for dairy farms, but slightly better for sheep & beef farms, with a correlation of 24%. This is illustrated below.
Figure 8: Dairy EFS versus Percent Change in Land Value, Lagged One Year.
Source: Dairy NZ
Access to credit While changes in profitability would be one driver for the change in land values, it is not necessarily a strong one, as discussed earlier. Another factor is the access to debt.
-30%
-20%
-10%
0%
10%
20%
30%
40%
50%
$0
$500
$1,000
$1,500
$2,000
$2,500
$3,000
$3,500
19
91
19
92
19
93
19
94
19
95
19
96
19
97
19
98
19
99
20
00
20
01
20
02
20
03
20
04
20
05
20
06
20
07
20
08
20
09
20
10
20
11
20
12
20
13
20
14
% C
han
ge in
lan
d v
alu
e
EFS
$/h
a
EFS/Ha % Movement in land Value

15 | P a g e
Using a longer term dataset from Quotable Value relative to Reserve Bank agricultural debt information shows a strong correlation:
Figure 9: Land Values Relative to Aggregate Agricultural Debt
Source: Quotable Value, NZ Reserve Bank. Note QV land data series finishes in 2010.
The correlation over this time period between the aggregate agricultural debt and dairy land prices is 97%, and 95% for grazing (read sheep & beef) land. This is reinforced when considering just dairy land value and dairy debt, which has a correlation of 96%. Figure 10: Dairy Land Value relative to Aggregate Dairy Debt
Source: Dairy NZ, NZ Reserve Bank
This would indicate that (ready) access to credit is a major factor in driving land values. Although in noting this, over the last 5 years land prices have not moved significantly after dropping in 2008/2009 post the GFC. Over this 5 year period credit has been very available, and interest rates have been dropping; the correlation of dairy land prices and debt from 2010 to 2015 is -34%.
0
500
1000
1500
2000
2500
0
10,000
20,000
30,000
40,000
50,000
60,000
19
80
19
82
19
84
19
86
19
88
19
90
19
92
19
94
19
96
19
98
20
00
20
02
20
04
20
06
20
08
20
10
E
Land Value IndexDebt $m
Aggregate Ag Debt Dairy Land Value Grazing Land Value
$0
$5,000
$10,000
$15,000
$20,000
$25,000
$30,000
$35,000
$40,000
DNZ $/ha Dairy Debt ($ 000)

16 | P a g e
One US study (Tegene and Kuchler, 1990) investigated whether or not farmland prices were determined by market fundamentals, such as discounted returns from the most productive land use, or whether self-fulfilling rumours about potential farmland price movements result in actual price movements. They found “little evidence to reject the hypothesis that market fundamentals determine farmland prices”. They also noted “The lack of evidence for price bubbles indicates two explanations for the well-known farmland price rise of the 1970's and the decline of the 1980's. One explanation is that expectations were rational and investments were made on the basis of reasonable expectations for earnings. The price changes were, on that basis, simply a matter of conditions changing unexpectedly. Alternative explanations not ruled out by the findings presented here are that expectations did not satisfy the rationality condition, or that investors did not make investments on the basis of the present value of expected earnings”. In their study, Barton et al, (2005) found a direct relationship between appreciation and land supplied to development, in the sense that in addition to its productive use, farmland in New Jersey also exhibited similar characteristics to that of a financial asset. They found that “The relationship, however, is found to be positive at rates of farmland value appreciation in excess of the risk free rate of return. This suggests an identifiable speculative demand component whereby farmland owners retain farmland at high rates of appreciation. Results also support the conjecture that when the rate of appreciation is lower than the risk free rate, the speculative behaviour of farmland owners is to keep less land in agriculture”. It is important to note that within this study “speculation” has a slightly different connotation in that the study considered the development of agricultural land into peri-urban development, and is perhaps more related to an inflation hedge. Within New Zealand, land prices have been relatively flat since 2008 (The Global Financial Crisis), despite ready availability of credit, and (in the case of dairying), generally good payouts. [Notwithstanding individual farms have sold well, depending on their circumstances]. With low dairy payouts in 2014/15 and 2015/16, dairy farm prices have not reduced as could be expected if productive forces dominated. In this respect therefore land values have held up largely driven by expectations that future profitability would be restored and/or expectations of land use change to a more profitable use, is still a viable option. Nevertheless, the speculative component of farmland values in New Zealand have been a significant feature over the last 2-3 decades, with aggregate increases in values over that period well in excess of the rate of inflation. While it has diminished over the last seven years, whether this endures remains to be seen.
Transactional Influences A number of transactional factors can influence the price of a farm on sale day. While these exist, there is minimal empirical information available to analyse them. They include:

17 | P a g e
(i) Mortgagee sale. The expectation is that such “forced” sales will reduce the price although this varies significantly depending on how the sale is handled, as well as demand from buyers.
(ii) Sale to family members, such as a succession sale. Often in these circumstances the price on the day is the current value of the property, with the family (i.e. parents) often leaving in a significant sum of money as a second mortgage at a (often very) concessional interest rate.
(iii) Scale of operation. Often very large farms can sell at above “market” value due to their economy of scale, which is perhaps more of a productive rather than a transactional factor. Often farmers will pay above market values for adjoining pieces of land, in expectation that this will result in better economies of scale for the whole operation.
Summary Overall, the analysis shows that land values are very much driven by a combination of productive, consumptive, and speculative factors. While productive factors could be considered to be the major drivers, the analysis has shown the relationship between farm profitability and farm price to be not that strong, and in the case of sheep & beef farming over the last two decades, its value has been much more strongly correlated with the dairy payout rather than its own profitability. Consumptive factors tend to be more personal drivers, whereas productive and speculative are much more financially orientated, and for each farm sale, each factor would have a different weighting.
Value versus Price It is important to remember that price and value are not the same. Value drives demand, but price is set by the intersection of supply and demand (Masnick, 2008). If supply is greater than demand, then regardless of the value of the item in question, its price will be pushed downwards, and similarly, if demand (=value) is high and supply limited, then prices will increase. Price often appears to be more influenced by immediate economic, political and social circumstances than by a longer term economic view, whereas value is an economic concept, and for an income producing asset, could be described as the present value of future benefits (Wilson, 2015). In this respect therefore, price could be expected to fluctuate more often than value, especially as value is not realised until the asset is sold at a price; value is not gained or lost until the asset is realised for money at more or less than the original purchase price plus any capital spend in the interim period (Wilson 2015). In other words the volatility of price could be expected to be greater than that of value. This difference in volatility is illustrated below:

18 | P a g e
Figure 11: Conceptual Diagram of Trends in Price and Value over Time
Based on Wilson 2015
This could help to explain why land prices do not drop as much as expected in relation to drops in profitability, as per the drop in dairy profitability/payouts in 2014/15 and 2015/16. Two key aspects are at play here:
(i) The supply of farms for sale always reduces at times of low profitability, as farmers perceive that the value of their farms is greater than the current profitability would infer, and hence only those farmers who need to sell do so, and
(ii) Buyers, who probably hold an inherently higher value of farming, but are hoping to buy on the cheap, are forced to pay closer to their value limit due to the restriction in supply.
0
5000
10000
15000
20000
25000
30000
35000
40000
45000
$
Time
Value Price

19 | P a g e
Impact of Environmental Constraints Since the advent of the Resource Management Act (1991), there has been an increasing emphasis on reducing the environmental footprint of our farming systems. This has been reinforced with the National Policy on Freshwater Management, which directs Regional Councils to implement policies to improve water quality in their regions. The end result of this is the high likelihood of Councils imposing limits on diffuse discharges on nutrients (nitrogen and phosphorous), microbes, and sediment, from farmland. Currently Horizons and Environment Canterbury are in the lead in imposing hard limits on the discharge of nitrogen. In addition to this is the Emissions Trading Scheme (ETS) with respect to carbon emissions. Currently agriculture in New Zealand is exempt from this, although its likely inclusion is a matter of time and politics. Both these factors will have an impact on farm profitability and the flexibility of land use change, and hence on land values.
Impact on Farm Profitability
Diffuse Discharges to Water The impact of reducing diffuse discharges to water is that farmers are/will have to implement a range of mitigation practices, which in turn involves a range of physical factors, e.g. improved effluent systems, fencing off streams, developing riparian margins, developing wetlands, feedpads/wintering barns, etc, and/or a range of farm management changes such as reduced/changed fertiliser inputs, altered grazing management practices, reduced/changed supplementary feeding regimes, and reduced stocking rates. All of which impose a cost of some degree on the farm business and reduce profits. These can vary significantly, depending on region, soil types, farming system, etc. Examples include: Table 5: Impacts on environmental mitigations on farm profitability
Source Year Mitigation Impact on Profit
Howarth & Journeaux 2015 Low N feed 0 to -7%
Change N fertiliser usage
-1 to -10%
Use of feedpad +14 to -11%
Dairy NZ 2014 Range of mitigations to reduce N leaching from 10% to 40%
-4% to -35%
McDowell et al 2013 Range of mitigations No $ costings given, although relative costings varied from 0 to 100.

20 | P a g e
So the overall situation can be complex and the impact on farm profitability can vary between different farms. Given the wide variability of the impact of discharge constraints on profitability, and the less than perfect relationship between profitability and land values, it is not possible to be too definitive about the relationship between discharge constraints and land values. But the likelihood of constraints having an adverse effect on land values, via impacts on farm profitability, is high.
Carbon Charges As noted, agriculture is currently exempt from the ETS. Given the assumption that at some stage it won’t be, the imposition of the charge will directly impose a cost of farms, reducing their profitability. The current intent is that the charge would be gradually imposed over a number of years, would be based on an output intensity basis, and with the point of obligation at an industry level (MPI 2015). This means that the main “carbon charge” at the farm level would be a reduction in payout/schedules, as the processor looked to recoup the charge levied. It also means that the only means of mitigating the charge would be for farms to try and offset it by investing in forestry and thereby speculating on the carbon charge. Efficiency gains at a farm level would not mitigate the levy until sufficient farms had improved their efficiency to the point where the industry as a whole could show a gain. The impact on farm profitability could therefore be significant, over time.
Impact on Future Flexibility One of the strengths of New Zealand agriculture has been the ability to rapidly change land use, largely driven by the relative profitability’s involved. With the advent of environmental constraints, this ability will be curtailed. This would be both with respect to diffuse discharges to water, particularly nutrients, and carbon charges. Given this, the “development potential/speculative” component of the land value would be severely curtailed. In this respect this “loss of future opportunity” may well be the largest impact that environmental constraints will have on land values. Indicative changes in land values due to land use change:
(i) Conversion from forestry to dairying: Forestry land purchased for (circa) $3,000-$5,000/ha (net of trees) Conversions costs circa $15,000/ha Resultant dairy farm worth circa $25,000-$30,000/ha
Assuming the Regional Council had assigned nutrient discharge limits to individual farms, the above conversion would not be possible unless nutrient trading was available, and even then the cost of purchasing the

21 | P a g e
discharge rights would (a) detract from offering more for the land, and (b) increase the conversion costs.
Similarly, if a carbon charge was payable as a result of the conversion out
of trees, this would significantly add to the conversion costs. At the current carbon cost of circa $6/tonne, it adds $4,500-$5,000/ha to conversion costs (and hence makes many conversions marginal). At a carbon cost of $25/tonne (current carbon tax on energy), it would add around $20,000/ha to the conversion cost, which would effectively stop any conversions.
(ii) Conversion from sheep & beef to dairying. Sheep & beef land purchased at $10,000-$15,000/ha Conversion costs $5,000-$10,000ha Resultant dairy farm worth circa $25,000-$30,000/ha
The same issue would arise with nutrient discharge limits as with forestry, and while there would not be a one-off carbon charge as per forestry, the carbon cost to dairying would be higher (given higher greenhouse gas emissions) which would reduce its profitability (and reduce the incentive to change in the first place).
On the assumption that dairying is currently the “highest/best use” for suitable pastoral land, then while the advent of environmental constraints will reduce the profitability of dairying, it will also severely impact on the ability of forestry and sheep & beef land to be converted. In this sense therefore, the biggest proportional impact of environmental constraints on land value could be on the value of forestry, under-developed land, and sheep & beef land. Currently, as Councils determine the means to reduce nutrient discharges and improve water quality, modelling work in these regions is making the assumption that there will be (or needs to be) a degree of “reverse” land use conversion into forestry in order to meet catchment level limits; e.g. dairy sheep & beef forestry This is yet to happen, but if it does, it will result in a (potentially significant) loss in land value. An indication of the land value differential is outlined below; Table 6: Differences in Farm Land Values (Land & Buildings)
Farm Type/Source Year Value $/ha
Dairy: Dairy NZ – National Average 2013/14 36,365
Sheep & Beef: Beef + Lamb NZ – National Average 2013/14 8,182
Forestry: Telfer Young – North Island Average 2013/14 2,486* *Net of Trees
Given the degree of loss of value as a result such land use change, it could be expected that this “reverse” land use change would be resisted, and hence be very sticky.

22 | P a g e
The degree of potential land value loss can be illustrated via the modelling done for the Waikato/Waipa water quality improvement scenarios (Doole et al 2015), using the value differentials outline in Table 6 above. Table 7: Estimated Impact on Land Value of Land Use Change
Land Use Change Hectares
Reduction in Land Value ($ million)
Dairy to Forestry 5,579 189
Dairy to Drystock 15,656 441
Drystock to Forestry 11,251 64
Total 32,486 694
Impact of Environmental Constraints: Taupo and Rotorua Lake Catchments Recent work by Telfer Young (http://www.telferyoung.com) on the Taupo and Rotorua Lake catchments have shown a differential in land prices as a result of restrictions on nitrogen leaching. The Waikato Regional Councils’ "Variation No. 5 - Lake Taupo Catchment" to the Waikato Regional Plan, which was proposed in 2005 and became operative in 2011, has capped nitrogen leaching discharges for all farms in the catchment. Similarly the Bay of Plenty Regional Council is looking to impose similar restrictions in the Rotorua Lake catchment, following on from the implementation of “Rule 11” in 2007 which restricted land use intensification through nutrient controls. Telfer Young’s analysis (M Craven, pers com) of land sales in the Lake Taupo and Lake Rotorua catchments showed the following: Figure 12: Analysis of sales Lake Taupo/Rotorua catchments 2007-2012 ($/ha)
Source: Telfer Young
$12,225
$10,214
$16,751 $16,233
$0
$2,000
$4,000
$6,000
$8,000
$10,000
$12,000
$14,000
$16,000
$18,000
Dairy Support/Dry Stock
Lake Non-Lake

23 | P a g e
This shows a 27% discount for dairy farms, and a 37% discount for drystock farms, within the lake catchment. The higher discount for the drystock farms supports the theory that they will bear a proportionally higher cost of environmental constraints due to the inability to convert to a higher intensity/more profitable land use (albeit the figures in figure 12 are based on very limited data). In Canterbury the region is in the early stages of the transition towards environmental constraints being applied, particularly around nitrogen leaching. The region is split into eight zones, each with their different requirements and sensitivities. Definitive farm sale information is not readily available, but it would appear that purchasers are becoming more cautious and looking to identify factors that may restrict development, e.g. farms with lighter soils near sensitive water bodies which may have higher leaching losses, or nitrogen allocations which may inhibit possible future farming systems. The proposed approach of using the “Matrix of Good Management” as a means of farming within the environmental constraints is still in development, and prospective land owners are uncertain of the final outcome, adding to their caution. If nothing else, auctions as a means of farm sale have effectively ceased due to the difficulty of doing due diligence prior to the auction (P Mills, pers com). If the differentials outlined in Figure 12 are extrapolated nationally as an indicative exercise, again using the values shown in Table 6, the impact is as follows: Table 8: Estimated National Impact of Reduction in land Values due to Environmental Constraints
Reduction in Value ($ Billion)
Dairy farms 16.8
Sheep & Beef farms 23.6
Total 40.4
This could be compared with aggregate debt for dairying ($37.7 billion) and sheep & beef ($11.2 billion) (as at 30 June 2015, Reserve Bank). The implication from Table 7 is that the credit risk of farming, and the credit risk of banks, would be significantly increased. This would be a transitional effect – it would be current landowners that would bear the brunt of this impact, before a new equilibrium was reached. The process though could take many years.

24 | P a g e
Conclusions As this analysis indicates, within the generic components of productive, consumptive, and speculative factors, there are a wide range of factors which influence the value of farm land. While productive factors could be expected to be a significant influence, the analysis indicates that it is moderate at best, and for sheep & beef land the profitability of another land use (dairying) was a greater influence than its own profitability. Consumptive factors would appear to have a major influence, but, apart from acknowledging this, are difficult to readily quantify generically due to their variation between farms. Similarly, speculative influences vary, driven in themselves by a range of factors such as access to credit, the profitability of enterprises, and the potential for land use change. Environmental constraints, in the form of reduced discharges of contaminants to water, and (potentially) greenhouse gases, will have a two-fold effect on farming;
(i) By increasing costs/decreasing profitability, which affects the productive component of land value, and
(ii) By significantly reducing the opportunity to intensify production, both in-situ, and via land use change, which affects the speculative component of land value.
The impact via consumptive factors is again difficult to determine generically. While (for example) an improvement in water quality within a river or lake may result in improved consumptive value for properties bordering the river/lake, quite possibly the consumptive value for those properties was already high, and an improvement in water quality may only result in a relatively small increase in land value. Alternatively, if the pre-existing water quality was very poor and the improvement in quality as a result of the constraints meant that the river/lake was now swimmable and/or fishable, the rise in consumptive value could be high. Given the complexity of the interactions between the factors affecting land value, it is difficult to readily quantify the degree to which environmental constraints will impact on land value, but the probability of an adverse impact is very high. The limited data to date, from catchments affected by constraints, would support this. On the assumption that dairying is (currently) the best/highest use for pastoral farming, then dairy land values will be mostly impacted by constraints that affect profitability. Proportionally, however, the effect on forestry, under-developed land, and sheep & beef land values will be higher, due to a combination of profitability effects, but especially so due to the second effect noted; the reduced ability for land use change. In a number of catchments under consideration of constraints on contaminant discharges, the modelling used has assumed some degree of “backward” land use

25 | P a g e
change in order to meet the new limits. If this occurs, one could expect the process to be very sticky, and the (adverse) impact on land values will be severe. At a national level, the implication of the impact of environmental constraints on land values is that the credit risk of farming, and the credit risk of banks, would be significantly increased, although this would be a transitional effect – it would be current landowners that would bear the brunt of this impact, before a new equilibrium was reached.

26 | P a g e
References Barton, N., Adelaja, S., Seedang, S. 2005. Testing Speculative Behaviour In
Farmland Demand. http://ageconsearch.umn.edu/bitstream/19308/1/sp05ba07.pdf
Blank, S.C. 2014. The Economics of American Agriculture: Evolution and Global
Development. https://books.google.co.nz/books?id=ITffBQAAQBAJ&pg=PA206&lpg=PA206&dq=income+earning+potential+versus+consumptive+values&source=bl&ots=3Uj2diu4ro&sig=FZX9gTtNV3xoQMebm5g5tc5YkM4&hl=en&sa=X&ved=0CD0Q6AEwBGoVChMIqZzjza6OyAIVRY-UCh3-Zwk3#v=onepage&q=income%20earning%20potential%20versus%20consumptive%20values&f=false
Craven, M. Telfer Young. Personal communication Dairy NZ, 2014. Waikato Dairy Farm Nitrogen Mitigation Impacts: Analysis of Waipa-
Franklin and Upper Waikato Dairy Farms. Report to Waikato Regional Council.
Doole, G., Elliot, S., McDonald, G. 2015. Economic evaluation of scenarios for water-
quality improvement in the Waikato and Waipa catchments. Paper prepared for the Healthy Rivers Wai Ora Collaborative Stakeholder Group.
Falk, B., Lee, B-S. 1996. Fads versus Fundamentals in Farmland Prices. Iowa State
University, Staff Paper No. 281. http://ageconsearch.umn.edu/bitstream/18248/1/isu281.pdf
Hargreaves, B., McCarthy, I. 2010. Is New Zealand farm land worth what it will
produce? Pacific Rim Real Estate Society Conference. http://www.prres.net/papers/Hargreaves_Is_New_Zealand_farm_land_worth_what_it_will_produce.pdf
Howarth, S. Journeaux, P. 2015. Nitrogen Mitigation Study. An Internal Report
Prepared for The Fertiliser Association of NZ Masnick, M. 2008. News Is Valuable, But Value And Price Are Two Separate Things.
Techdirt. https://www.techdirt.com/articles/20080121/19180527.shtml McDowell, R.W., Wilcock, B., Hamilton, D.P. 2013. Assessment of strategies to
mitigate the impact or loss of contaminants from agricultural land to fresh waters. http://www.mfe.govt.nz/publications/fresh-water/assessment-strategies-mitigate-impact-or-loss-contaminants-agricultural
Mills, P. Property Advisory. Personal communication. MPI, 2015. Agriculture & the Emissions Trading Scheme.
http://archive.mpi.govt.nz/agriculture/agriculture-ets
27 | P a g e
Pope, C.A. 1985. Agricultural Productive and Consumptive Use Components of Rural Land Values in Texas. Am. J. Agr. Econ. (1985) 67 (1):81-86.
Reserve Bank of NZ, 2012. Asset returns and the investment choices of New
Zealanders. Bulletin, Vol. 75, No. 3.
http://www.rbnz.govt.nz/research_and_publications/reserve_bank_bulletin/2012/2012sep75_3watson.pdf
Reserve Bank of NZ, 2015. C27 Banks: agriculture credit by industry.
http://www.rbnz.govt.nz/statistics/tables/c27/ Tegene, A., Kuchler, F. 1990. The Contribution of Speculative Bubbles to Farmland
Prices. Resources and Technology Division, Economic Research Service, U.S. Department of Agriculture. Technical Bulletin No. 1782. http://naldc.nal.usda.gov/naldc/download.xhtml?id=CAT10415700&content=PDF
Torell, L. A., Rimbey, N.R., Ramirez, O.A., McCollum, D.W. 2005. Income Earning
Potential versus Consumptive Amenities in Determining Ranchland Values. Journal of Agricultural and Resource Economics 30(3):537-560. http://www.waeaonline.org/jareonline/archives/30.3%20-%20December%202005/JARE,Dec2005,pp537,Torell.pdf
Verheye, W. 2003. The Value and Price of Land. Encyclopaedia of Life Support
Systems. Land Use, Land Cover and Soil Sciences, Vol III. http://www.eolss.net/sample-chapters/c19/E1-05-03-03.pdf
Wilson, K. 2015. Commodity Price Cycles and Land Prices – Values. NZIPIM
Journal December 2015