the effect of economic value added (eva) on price to …
TRANSCRIPT
Volume 1, Issue 5, November 2020 E-ISSN : 2721-303X, P-ISSN : 2721-3021
Available Online: https://dinastipub.org/DIJEFA Page 889
THE EFFECT OF ECONOMIC VALUE ADDED (EVA) ON PRICE TO BOOK
VALUE THE ROLE OF INSTITUTIONAL OWNERSHIP IN RETAIL SECTOR
COMPANIES LISTED ON THE INDONESIA STOCK EXCHANGE
Apriyani1, Nur Aisyah F Pulungan
2
1) Universitas Mercubuana, Jakarta, Indonesia
2) Universitas Mercubuana, Jakarta, Indonesia
ARTICLE INFORMATION
Received: 5 September 2020
Revised: 15 October 2020
Issued: 02 December 2020
Corresponding author: first
author
E-mail: [email protected]
DOI: 10.38035/DIJEFA
Abstract: This study examines and analyzes the effect
of Economics Value Added (EVA) on the price to book
value mediated by institutional ownership in retail sector
companies listed on the Indonesia Stock Exchange
(IDX). The object of this study is the sector of retail with
shares of sharia when listed on the Indonesia Stock
Exchange (BEI) period 2015-2019. In order to achieve
the goals and objectives, the company increases it’s
value by increasing shareholders. Improving the walfare
on shareholders can be done through investment and
financial policies, and is reflected in share price in the
capital market. The higher the share price, the better the
owner’s walfare, and the company’s value will also
increase. The population of this research is the retail
companies as many as 27 companies when the sample is
12 company’s by using a purposive sampling method
met criteria for the sample. The data is further analyzed
using SmartPLS Vs.3.2.9 by looking at the result of
descriptive analysis, coefficient path, and path analysis.
The result of the study showed that Economic Value
Added (EVA) has a negative and significant effect to
Price to Book Value (PBV), the Economic Value Added
(EVA) has a negative and not significant effect to
institutional ownership, the institutional ownership has a
negative and significant effect to Price to Book Value
(PBV), in addition institutional ownership does not
mediate the relationship between Economic Value
Added (EVA) and Price to Book Value (PBV).
Keywords: Economics Value Added (EVA),
Institutional Ownership, Price to Book Value (PBV).
INTRODUCTION
Since the start of the issue of unicorns and the fast growth in digital business system,
Indonesia is weakening of economic growth. It is comparable to low global economic. The
Volume 1, Issue 5, November 2020 E-ISSN : 2721-303X, P-ISSN : 2721-3021
Available Online: https://dinastipub.org/DIJEFA Page 890
convergence of the direction growth the global economy is seen in a slowdown that occurs in
the US , Europe , Chinese , and Japan push the decrease in the projected economic growth of
Indonesia. A bad conditions of economic growth a companies had financial distress and still
go out of business and laying off employees. The impact be people down there was power.
Indicate the slowing economic growth is not as strong as the early consumption market.
The purchasing power of the people in the retail industry sector back into the spotlight
by the presence of while of retail industry based in the era of digital 4.0. In the beggining of
the year 2019, Pada awal tahun 2019, Hero Supermarket Tbk announced about closed to 26
of the store they owned. In one year ago, the fashion retail has out of business, such as Lotus,
Dorothy Perkins, New Look, Clarks, Banana Republic, up to GAP. (Source : CNN Indonesia
June 6th, 2019).
The impact of the spread of pandemics covid-19 in indonesia increase the drop of the
retail industry is not normal and has never happened , where sales fell 90 % and pushed the
owners to close their business and could result in a decrease the cashflow (CNBC Indonesia :
April 8th, 2020). These conditions worsened the economics in Indonesia. The impact of the
technology bring a hug impact on teh changes in the retail company to use the new modelsto
won the competetion.
Companies attending the rivalry certainly has a good reputation for investor. A good
reputation can be seen from the company’s value. The company’s value can be measured by
the price to book value ( pbv ) and price ratio ( earning per share) will show good condition
compared with the market price for the company. The higher the company’s value,will
maked the market believed the prospect of the company’s future. Therefore the company
values can be measured with Price to Book Value ( PBV) and Price Earning Ratio (PER) that
is very important for the investor and the potential investors to designating an investment
decision.
Not only on competition strategy with the emergence of new tools innovate, but also requires
an instrument performance assessment new justice can pass judgment account the interests of
all parties. Some this approach is Economic Value Added (EVA). This approach has been
in practice and accepted as an assessment of the performance of profit and non profit
organizations. EVA is economic value added that measured extent to which the company has
improved shareholder value (Brigham and Houston, 2011). With increase of EVA,
shareholders may be get more affluence if the EVA can get the contribution to company
values.
The goal of the company is highest the company values by increasing the affluence a
shareholders. To achieve this goal, the shareholders hand over the management to the
manager. The decision taken by manager but must also protecting the interests of manager for
the best interests of stockholders. The selection of manager the manager by the shareholders
to managing the company’s in this fact often controvert with manager personal interest.
In Financial context, the agency problem comes between the principal and the agency.
The institutional ownership had a very important role in minimized agency conflict occurring
between the managers and shareholders. The existence of the institutional investors,
considered capable of being effective monitoring mechanism in every the decision taken by
Volume 1, Issue 5, November 2020 E-ISSN : 2721-303X, P-ISSN : 2721-3021
Available Online: https://dinastipub.org/DIJEFA Page 891
manager including in the resolution policy debt. The institutional ownership is the percentage
of institutional ownership of shareholders by a legal entity or, financial institutions, insurance
companies, pension fund, bank, and the other institutional (Hery, 2017). With the institutional
ownership , stakeholders tend to have much more confidence of the company , and this can
be a values added for the company. (Hery, 2017).
Handoko (2008) has a study about the effect of EVA, ROE, ROA, and the EPS on
changes the stock price of the LQ 45 company’s on the Indonesia Stock Exchange (IDX), and
found that EVA, ROE, and ROA has not significant effect on the changes of stock price.
This shows that economic value added will not forever affect the company values with stock
prices indicator.Compared with the findings above, Shahirah and Lantania (2016) found that
EVA, MVA, dividend policy, and managerial ownership have a significant positive effect on
company values.
Economic Value Added never can’t influence on company values.Same with the
study from Fahmi Nugraha and Muhammad Doddy A. Bahtiar (2012) on them study “The
Effect Return On Equity and Economic Value Added to company values (the role in the
company’s with the syaria stock in Indonesia Stock Exchange (IDX)”. The conclusion that is
statistically EVA has no effect to Price to Book Value at the trust 95%. Table 1 summarizes
the results of previous research.
Table 1 : Research Gap of Previous Research Results
Variables Authors Findings
EVA
Syahirah dan lantania (2016) Significant
Handoko (2008)
Nugraha dan Bahtiar (2012) Not significant
Institutional Ownership Wongso (2012) Not Significant
The purpose of this study is to analyze the effect of EVA to PBV, analyze the effect
of EVA to Institutional Ownesrhip, analyze the effect of Institutional Ownesrhip to PBV,and
analyze the effect of Institutional Ownesrhip mediating the effect of EVA on PBV.
The benefits of this research are :
1. As a consideration for the investors to investment in a company with identify the
effects of EVA, and institutional ownership on the retail company’s.
2. As a consideration for the management of the company’s in retail sector to
identification insight the factors of EVA, and institutional ownesrhip affect to cmpany
values.
3. As a reference and further research information related to EVA, Institutional
ownership and company values.
LITERATURE REVIEW
According to Brigham and Houston (2010:7), " The purpose of the main companies
that maximize the value of the company is used as a measured of the success of the company
due to the increased value of the company means the rising prosperity of the owner or the
shareholders". The company values is the value today of a series of flows of cash entry that
will be produced by the company in the future period (Endri and Fathony , 2020 ). The
Volume 1, Issue 5, November 2020 E-ISSN : 2721-303X, P-ISSN : 2721-3021
Available Online: https://dinastipub.org/DIJEFA Page 892
company values show that how good or bad management to manage the equity , this is can be
seen from the performance measurement of finance were achieved. The measurement of the
company value has developed from conventional to modern and has a better ability to
measure company value. Therefore, various parties with an interest in the company can
assess the company value using various approaches according to their respective needs. The
company value can be measured by Tobin's Q, Price Earning Ratio (PER), and Price to Book
Value (PBV).
PBV or the ratio of stock prices to book value is often used to assess the price of a
stock, whether cheap or expensive, which is usually called stock valuation. Companies with
PBV below one are typically considered cheap shares, while PBV ratios above one can be
considered expensive shares. PBV ratio shows how many shareholders finance the
company’s net assets. PBV can be calculated by dividing the price per share of the company
concerned with the book value per share. (Basuki dan Pulungan,2020). Price to Book Value
(PBV) is the ratio of the share price to book value of a company's equity, which measures the
market values on management and the organization as a growing company. Price to Book
Value (PBV) is often used as a reference in determining the value of a stock relative to its
market price. (Hery, 2018). In the other side, Franita (2018) show that the Price to Book
Value (PBV) is a comparison of the price a share to book value. The Price to Book Value
(PBV) show how far a company is able to create company value relative to the amount of
invested capital, so that the higher of Price to Book Value (PBV) ratio, the more company
successful is in creating value.
According to Brigham and Houston (2010: 111), "Economic Value Added (EVA) is a
measure of the economic value added produced by a company as a result of activities or
management strategies". A positive EVA indicates that the company has succeeded in
creating value for the owner of capital because the company is able to generate a level of
income that exceeds level the cost of capital. This matter same with the goal to maximised
the company values. In the otherwise, if EVA has negative value is showing that the
company decline, because of the turnover rate is lower than the cost of capital. The existence
of EVA becomes relevant for measuring performance based on the economic value generated
by a company, with the presence of EVA, the owner of the company will reward activities
that add value and remove facilities that damage or reduce the overall value of a company
and assist management in determining the company's internal goals for implications. long
term and not just short term.
Institutional ownership is the percentage of share ownership owned by legal entities
or financial institutions, such as insurance companies, pension funds, mutual funds, banks,
and other institutions (Ayuningtyas, 2013). With institutional ownership, stakeholders tend to
have more confidence in the company, and this can be an added value for the company
(Sastriana, 2013). The existence of ownership by institutions such as insurance companies,
banks, investment companies, and other institutions can encourage more optimal supervision.
Such oversight will ensure that managers act in the best interests of the company owners, not
just for their own interests.
The hypothesis of this study based on previous research and theory is as follows :
Volume 1, Issue 5, November 2020 E-ISSN : 2721-303X, P-ISSN : 2721-3021
Available Online: https://dinastipub.org/DIJEFA Page 893
H1 : EVA has a positive and significant effect on PBV.
H2 : EVA has positive and significant effect on institutional ownership.
H3 : Institutional ownership has a positive and significant effect on PBV.
H4 : Institutional ownership mediates the effect of EVA on PBV
RESEARCH METHODS
Sugiyono (2016: 2) "The research method is basically a scientific way to obtain data
with specific purposes and uses". Based on this statement, research design means a series of
research processes starting from planning to conducting research. This research using a
causal design, because this causal design examines in depth and thoroughly the causal
relationship as well as to find out how the relationship between variables and the problem
refers to the objective research, it’s to find out what is there has effect of economic value
added (EVA ) on firm value with institutional ownership as mediator . The independent
variable (X) in this study is EVA (X), the Intervening variable is Institutional Ownership (Z )
and the dependent variable is PBV (Y). The operational definitions of some of the variables
that have been described are as follows:
1. PBV in this study is calculated based on the distribution of market value or
closing price with the book value of a stock in a ritel company listed on the
Indonesia Stock Exchange in the period 2015-2019 expressed in ratio scale.
2. EVA in this study is calculated based on the NOPAT reduced by the WACC dan
Capital expressed in ratio scale.
3. Institutional ownership in this study is calculated based on the institutional stock
indicator divided by the total of shares expressed in ratio scale .
The object Object in this study is retail sector companies listed on the Indonesia
Stock Exchange (IDX) in 2015-2019. The subject of the research is the annual report of retail
companies whose data are taken directly from the Indonesia Stock Exchange (IDX) website,
www.idx.co.id. The population in this study is 27 companies with the sample selection was
determined by the purposive sampling method with several provisions, namely (1) registered
on the Indonesia Stock Exchange (IDX), (2) actively reporting financial reports and annual
reports for the 2015-2019 period, (3) are classified as Islamic stocks.
Table 2: Sample selection Process Sample Criteria Result
Registered on the Indonesia Stock Exchange (IDX) 27
Classified as Islamic stocks. 18
Actively reporting financial reports and annual reports for the 2015-2019 12
Number of company analyzed 12
Based on the sample selection result in table 2, it can be seen that, from all retail
companies listed on Indonesia Stock Exchange (IDX) during 2015-2019, there were only 12
companies that could be used as research samples. The retail companies could be used as
research can be seen on the tables 3 as below :
Table 3 : Sample of research
CODE COMPANY
Volume 1, Issue 5, November 2020 E-ISSN : 2721-303X, P-ISSN : 2721-3021
Available Online: https://dinastipub.org/DIJEFA Page 894
ACES Ace Hardware Indonesia Tbk
CENT Centrama Telekomunikasi Indonesia Tbk
CSAP Catur Sentosa Adiprana Tbk
ERAA Erajaya Swasembada Tbk
HERO Hero Supermarket Tbk
KOIN Kokoh Inti Arebama Tbk
LPPF Matahari Department Store Tbk
MAPI Mitra Adi Perkasa Tbk
MPPA Matahari Putra Prima Tbk
RALS Ramayana Lestari Sentosa Tbk
RANC Supra Boga Lestari Tbk
SONA Sona Topas Tourism Industry Tbk
FINDINGS AND DISCUSSION
Descriptive Statistics
The description of the findings begins with a descriptive analysis. Testing with
descriptive statistics will provide an overview or description of data seen from the amount of
data (N), the average value (mean), standard deviation, variance, maximum, and minimum
value of each variable (Ghozali, 2016). The standard deviation value which is still lower than
the mean value indicates good data distribution and normal distribution, so that it will give
good analysis results, while the standard deviation value that exceeds the mean suggests the
data distribution is not good because many data fluctuations are leading to unfavorable
analysis results.
Table 4: Results of Descriptive Analysis
Variable Mean Median Min Max St.Dev
EVA 1.351 21.274 -16.841 41.878 6.975
KI 0.766 0.800 0.320 1.760 0.273
PBV 3.605 1.890 0.000 46.430 6.963
Source : SmartPLS Analyzed
Based on the results of the descriptive analysis in Table 4, the analysis show
that the PBV value has the mean value 3.605 and the standard deviation is 6.963, the lowest
value of 0,000 and the highest value of 46.43. Based on the results of descriptive analysis, the
PBV deviation standard value exceeds the mean PBV value. It show that PBV has a data
distribution that is not very good and contains data with possible fluctuations that cause
unfavorable analysis results. Grap of PBV value during the period 2015-2019 in 12 sample
companies can be seen in picture 1 as below :
Volume 1, Issue 5, November 2020 E-ISSN : 2721-303X, P-ISSN : 2721-3021
Available Online: https://dinastipub.org/DIJEFA Page 895
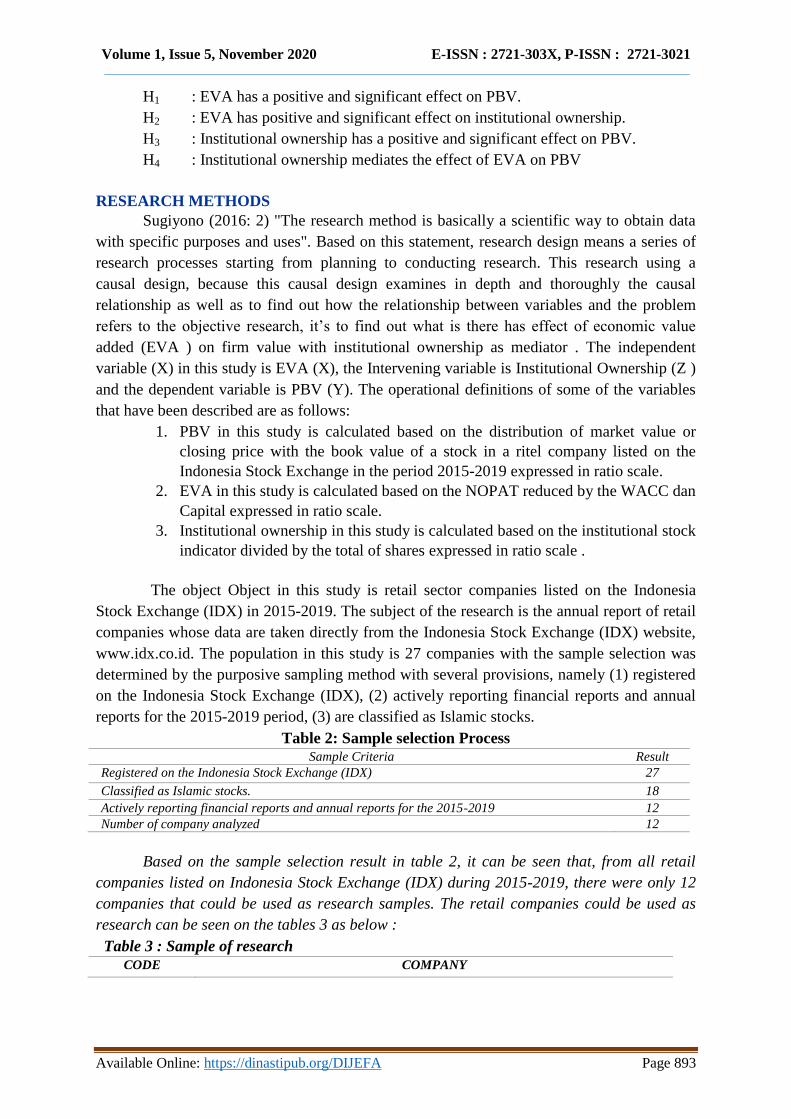
Picture 1. PBV Value Of Sample Companies in 2015-2019
Based on the value chart on picture 1 show that the Sona Topas Tourism
Industry company is the company that most often has a very high PBV value when compared
to other retail companies. In the otherside, Matahari Departement Store (LPPF) is the
company that most often has a lowest PBV value when compared to other retail companies
during 2015-2019.
The variable of EVA in the table 4 show that the standard deviation of EVA is
6,975 and the mean is 1,351, the lowest value is -16,841 and the highest value is 41,878. So
that, the EVA deviation standard value exceeds the mean EVA value It show that EVA has a
data distribution that is not very good and contains data with possible fluctuations that cause
unfavorable analysis results. Graph of EVA value during the period 2015-2019 in 12 sample
companies can be seen in picture 2 as below :
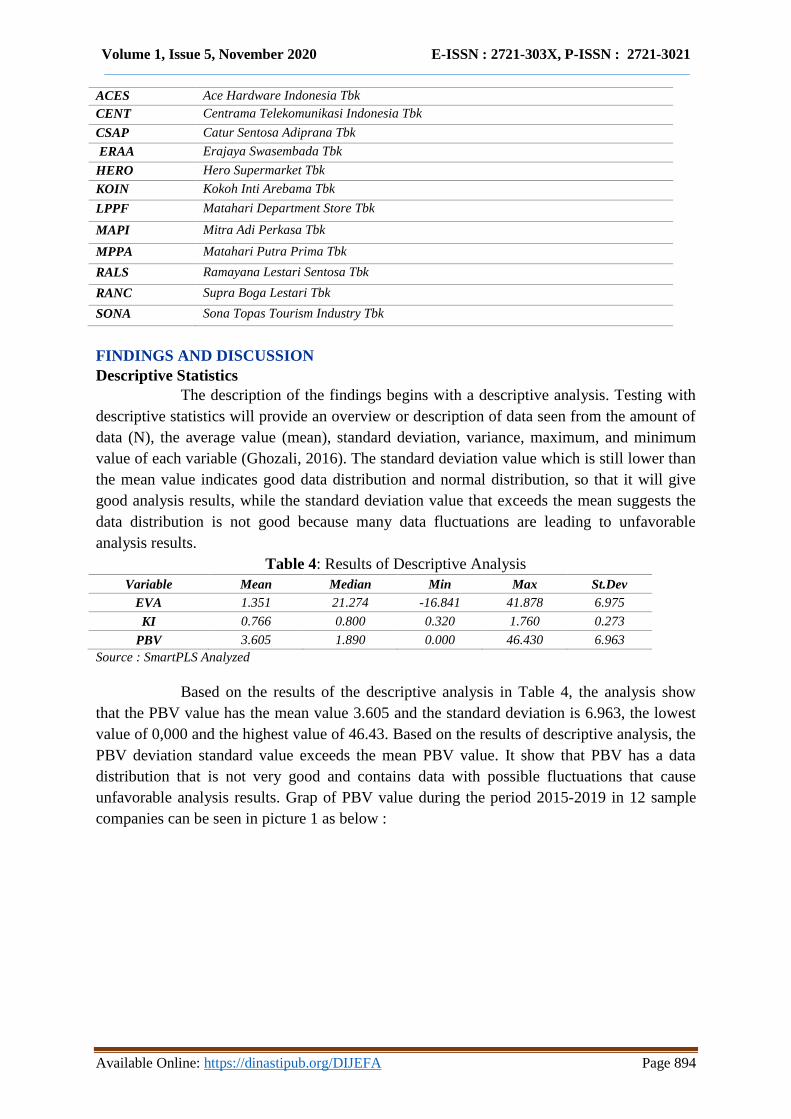
Picture 2. EVA Value Of Sample Companies in 2015-2019
Based on the value chart on the picture 2 show that the Centrama
Telekomunikasi Indonesia (CENT) company company is the company that most often has a
very low EVA value,while the Sona Topas Tourism Industry (SONA) company is the
company that most often has a highest EVA value when compared to other retail companies
during 2015-2019.
The Mean based on the results of the descriptive analysis in Table 4 of the
institutional variable is 0,766 and the standard deviation is 0,273, the lowest value is 0,320
and the highest value is 1,760. The standard deviation is less than the mean values it show
that institutional ownership has a data distribution that is good. Graph of institutional value
during the period 2015-2019 in 12 sample companies can be seen in picture 3 as below :
Volume 1, Issue 5, November 2020 E-ISSN : 2721-303X, P-ISSN : 2721-3021
Available Online: https://dinastipub.org/DIJEFA Page 896
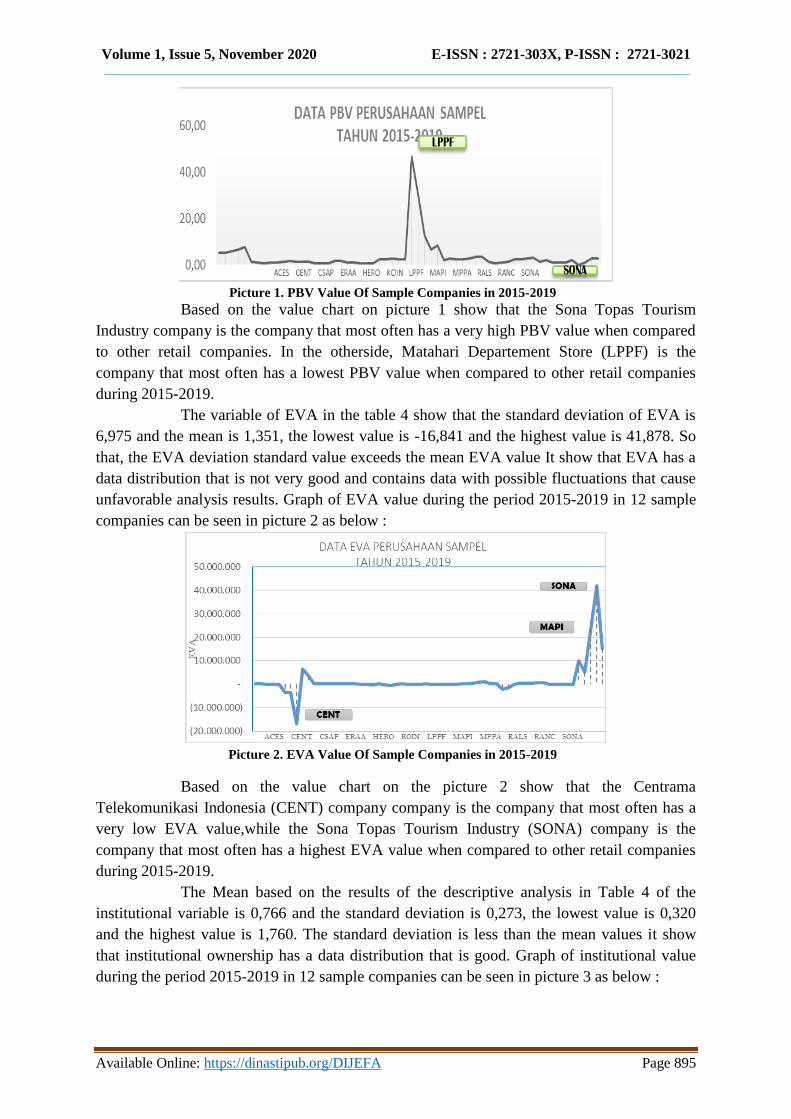
Picture 3. Institutional Ownership Value Of Sample Companies in 2015-2019
Based on the picture 3, Ace Hardware Indonesia (ACES) is the company that
most often has a lowest institutional ownership value when compared to other retail
companies during 2015-2019, and the Catur Sentosa Adiprana (CSAP) company is the
company that most often has a very high institutional ownership value when compared to
other retail companies.
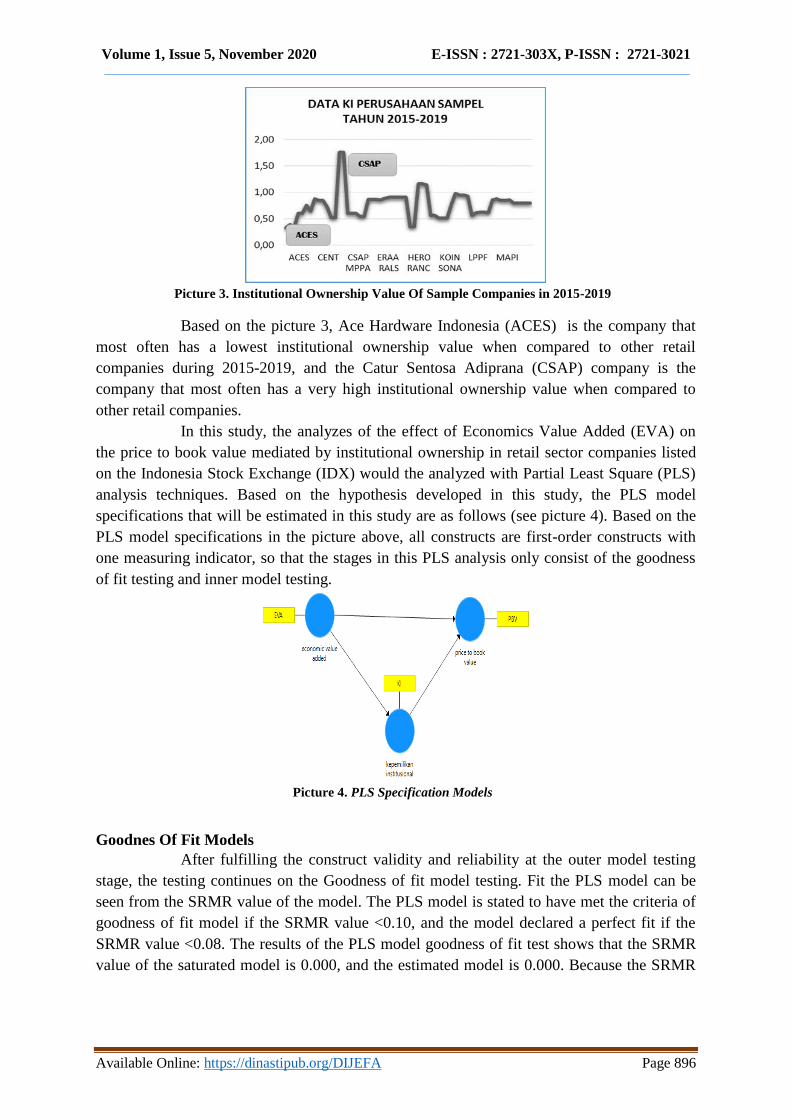
In this study, the analyzes of the effect of Economics Value Added (EVA) on
the price to book value mediated by institutional ownership in retail sector companies listed
on the Indonesia Stock Exchange (IDX) would the analyzed with Partial Least Square (PLS)
analysis techniques. Based on the hypothesis developed in this study, the PLS model
specifications that will be estimated in this study are as follows (see picture 4). Based on the
PLS model specifications in the picture above, all constructs are first-order constructs with
one measuring indicator, so that the stages in this PLS analysis only consist of the goodness
of fit testing and inner model testing.
Picture 4. PLS Specification Models
Goodnes Of Fit Models
After fulfilling the construct validity and reliability at the outer model testing
stage, the testing continues on the Goodness of fit model testing. Fit the PLS model can be
seen from the SRMR value of the model. The PLS model is stated to have met the criteria of
goodness of fit model if the SRMR value <0.10, and the model declared a perfect fit if the
SRMR value <0.08. The results of the PLS model goodness of fit test shows that the SRMR
value of the saturated model is 0.000, and the estimated model is 0.000. Because the SRMR
Volume 1, Issue 5, November 2020 E-ISSN : 2721-303X, P-ISSN : 2721-3021
Available Online: https://dinastipub.org/DIJEFA Page 897
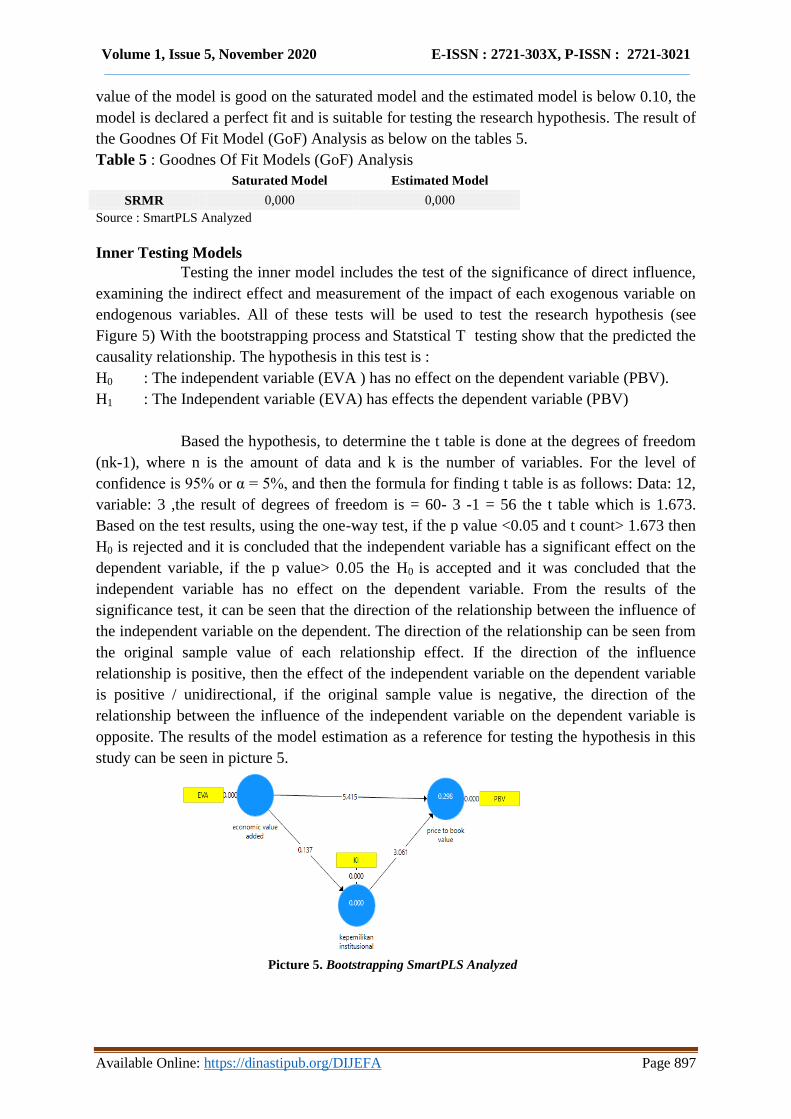
value of the model is good on the saturated model and the estimated model is below 0.10, the
model is declared a perfect fit and is suitable for testing the research hypothesis. The result of
the Goodnes Of Fit Model (GoF) Analysis as below on the tables 5.
Table 5 : Goodnes Of Fit Models (GoF) Analysis
Saturated Model Estimated Model
SRMR 0,000 0,000
Source : SmartPLS Analyzed
Inner Testing Models
Testing the inner model includes the test of the significance of direct influence,
examining the indirect effect and measurement of the impact of each exogenous variable on
endogenous variables. All of these tests will be used to test the research hypothesis (see
Figure 5) With the bootstrapping process and Statstical T testing show that the predicted the
causality relationship. The hypothesis in this test is :
H0 : The independent variable (EVA ) has no effect on the dependent variable (PBV).
H1 : The Independent variable (EVA) has effects the dependent variable (PBV)
Based the hypothesis, to determine the t table is done at the degrees of freedom
(nk-1), where n is the amount of data and k is the number of variables. For the level of
confidence is 95% or α = 5%, and then the formula for finding t table is as follows: Data: 12,
variable: 3 ,the result of degrees of freedom is = 60- 3 -1 = 56 the t table which is 1.673.
Based on the test results, using the one-way test, if the p value <0.05 and t count> 1.673 then
H0 is rejected and it is concluded that the independent variable has a significant effect on the
dependent variable, if the p value> 0.05 the H0 is accepted and it was concluded that the
independent variable has no effect on the dependent variable. From the results of the
significance test, it can be seen that the direction of the relationship between the influence of
the independent variable on the dependent. The direction of the relationship can be seen from
the original sample value of each relationship effect. If the direction of the influence
relationship is positive, then the effect of the independent variable on the dependent variable
is positive / unidirectional, if the original sample value is negative, the direction of the
relationship between the influence of the independent variable on the dependent variable is
opposite. The results of the model estimation as a reference for testing the hypothesis in this
study can be seen in picture 5.
Picture 5. Bootstrapping SmartPLS Analyzed
Volume 1, Issue 5, November 2020 E-ISSN : 2721-303X, P-ISSN : 2721-3021
Available Online: https://dinastipub.org/DIJEFA Page 898
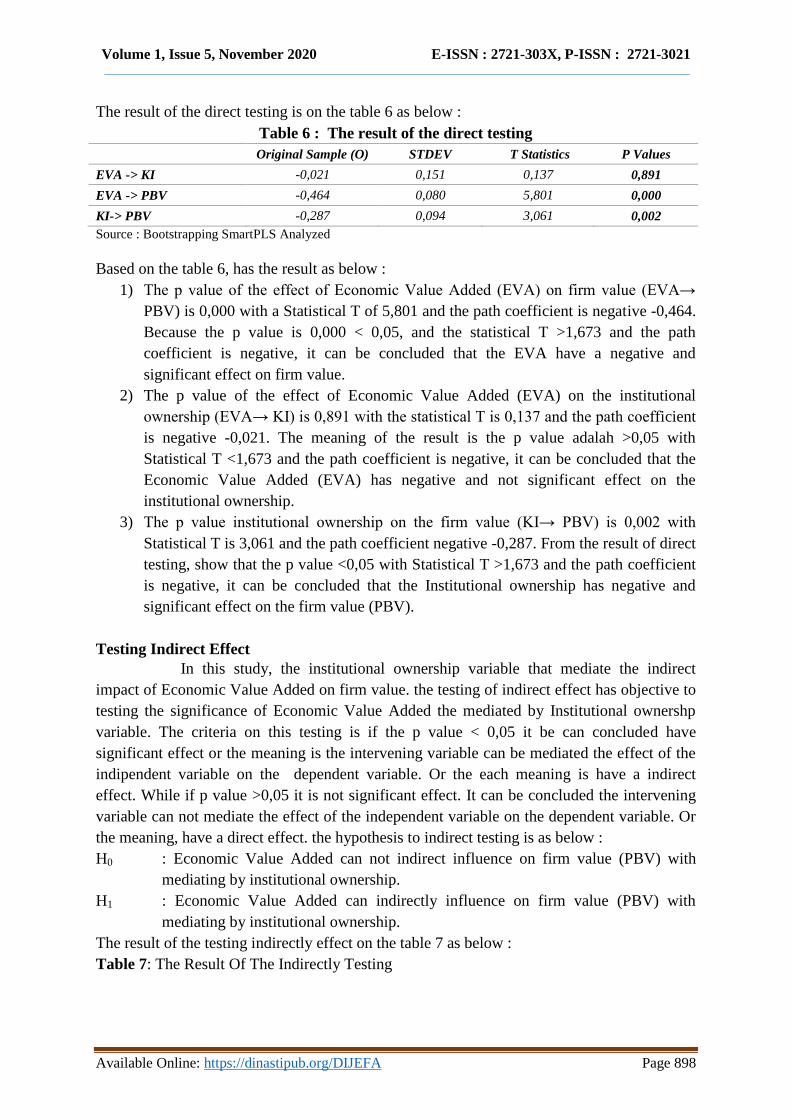
The result of the direct testing is on the table 6 as below :
Table 6 : The result of the direct testing
Original Sample (O) STDEV T Statistics P Values
EVA -> KI -0,021 0,151 0,137 0,891
EVA -> PBV -0,464 0,080 5,801 0,000
KI-> PBV -0,287 0,094 3,061 0,002
Source : Bootstrapping SmartPLS Analyzed
Based on the table 6, has the result as below :
1) The p value of the effect of Economic Value Added (EVA) on firm value (EVA→
PBV) is 0,000 with a Statistical T of 5,801 and the path coefficient is negative -0,464.
Because the p value is 0,000 < 0,05, and the statistical T >1,673 and the path
coefficient is negative, it can be concluded that the EVA have a negative and
significant effect on firm value.
2) The p value of the effect of Economic Value Added (EVA) on the institutional
ownership (EVA→ KI) is 0,891 with the statistical T is 0,137 and the path coefficient
is negative -0,021. The meaning of the result is the p value adalah >0,05 with
Statistical T <1,673 and the path coefficient is negative, it can be concluded that the
Economic Value Added (EVA) has negative and not significant effect on the
institutional ownership.
3) The p value institutional ownership on the firm value (KI→ PBV) is 0,002 with
Statistical T is 3,061 and the path coefficient negative -0,287. From the result of direct
testing, show that the p value <0,05 with Statistical T >1,673 and the path coefficient
is negative, it can be concluded that the Institutional ownership has negative and
significant effect on the firm value (PBV).
Testing Indirect Effect
In this study, the institutional ownership variable that mediate the indirect
impact of Economic Value Added on firm value. the testing of indirect effect has objective to
testing the significance of Economic Value Added the mediated by Institutional ownershp
variable. The criteria on this testing is if the p value < 0,05 it be can concluded have
significant effect or the meaning is the intervening variable can be mediated the effect of the
indipendent variable on the dependent variable. Or the each meaning is have a indirect
effect. While if p value >0,05 it is not significant effect. It can be concluded the intervening
variable can not mediate the effect of the independent variable on the dependent variable. Or
the meaning, have a direct effect. the hypothesis to indirect testing is as below :
H0 : Economic Value Added can not indirect influence on firm value (PBV) with
mediating by institutional ownership.
H1 : Economic Value Added can indirectly influence on firm value (PBV) with
mediating by institutional ownership.
The result of the testing indirectly effect on the table 7 as below :
Table 7: The Result Of The Indirectly Testing
Volume 1, Issue 5, November 2020 E-ISSN : 2721-303X, P-ISSN : 2721-3021
Available Online: https://dinastipub.org/DIJEFA Page 899
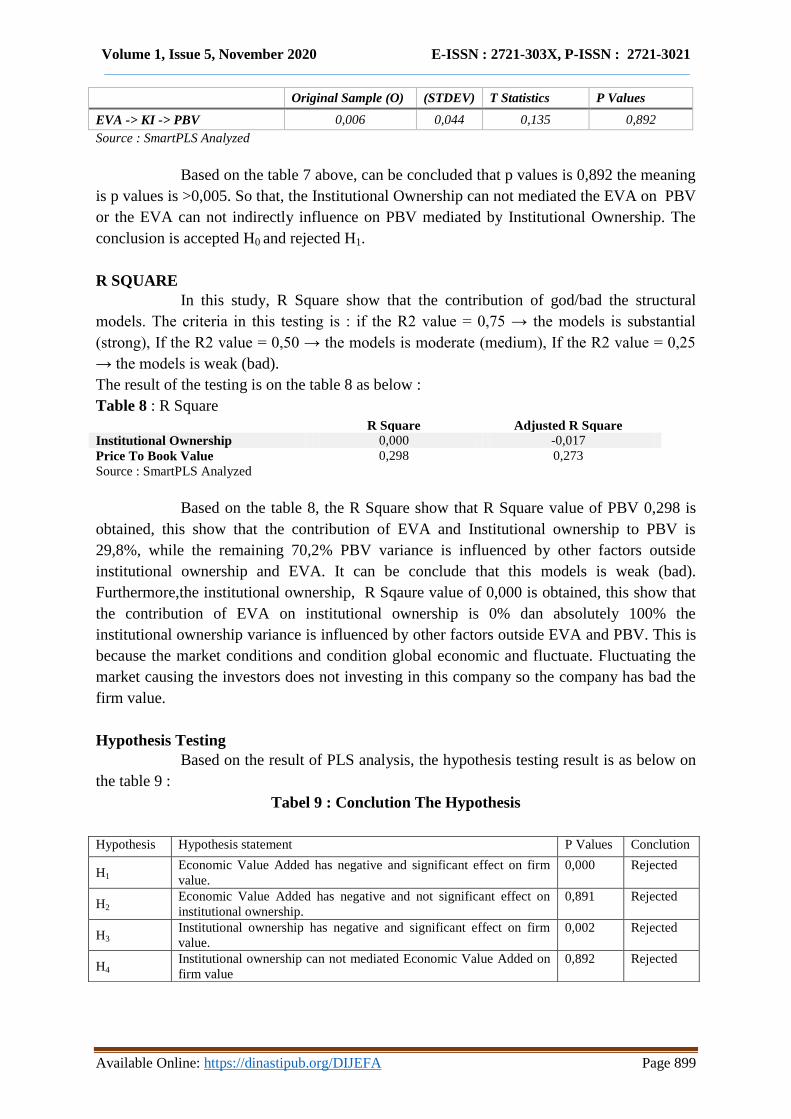
Original Sample (O) (STDEV) T Statistics P Values
EVA -> KI -> PBV 0,006 0,044 0,135 0,892
Source : SmartPLS Analyzed
Based on the table 7 above, can be concluded that p values is 0,892 the meaning
is p values is >0,005. So that, the Institutional Ownership can not mediated the EVA on PBV
or the EVA can not indirectly influence on PBV mediated by Institutional Ownership. The
conclusion is accepted H0 and rejected H1.
R SQUARE
In this study, R Square show that the contribution of god/bad the structural
models. The criteria in this testing is : if the R2 value = 0,75 → the models is substantial
(strong), If the R2 value = 0,50 → the models is moderate (medium), If the R2 value = 0,25
→ the models is weak (bad).
The result of the testing is on the table 8 as below :
Table 8 : R Square
R Square Adjusted R Square
Institutional Ownership 0,000 -0,017
Price To Book Value 0,298 0,273
Source : SmartPLS Analyzed
Based on the table 8, the R Square show that R Square value of PBV 0,298 is
obtained, this show that the contribution of EVA and Institutional ownership to PBV is
29,8%, while the remaining 70,2% PBV variance is influenced by other factors outside
institutional ownership and EVA. It can be conclude that this models is weak (bad).
Furthermore,the institutional ownership, R Sqaure value of 0,000 is obtained, this show that
the contribution of EVA on institutional ownership is 0% dan absolutely 100% the
institutional ownership variance is influenced by other factors outside EVA and PBV. This is
because the market conditions and condition global economic and fluctuate. Fluctuating the
market causing the investors does not investing in this company so the company has bad the
firm value.
Hypothesis Testing
Based on the result of PLS analysis, the hypothesis testing result is as below on
the table 9 :
Tabel 9 : Conclution The Hypothesis
Hypothesis Hypothesis statement P Values Conclution
H1 Economic Value Added has negative and significant effect on firm
value.
0,000 Rejected
H2 Economic Value Added has negative and not significant effect on
institutional ownership.
0,891 Rejected
H3 Institutional ownership has negative and significant effect on firm
value.
0,002 Rejected
H4 Institutional ownership can not mediated Economic Value Added on
firm value
0,892 Rejected
Volume 1, Issue 5, November 2020 E-ISSN : 2721-303X, P-ISSN : 2721-3021
Available Online: https://dinastipub.org/DIJEFA Page 900
Based on the table 9 above, can be concluded as below :
1) The p value the effect of Economic Value Added (EVA) on firm value (EVA→ PBV)
is 0,000 with statistic T is 5,801 and path coefficient is negative -0,464. The meaning
is, p value 0,000 < 0,05,and statistic T >1,673 and path coefficient is negative so can
be concluded that the Economic Value Added the EVA have a negative and
significant effect on firm value. so that, H1 is rejected or the EVA→ PBV accepted
the H0 and rejected the H1.
2) The p value the effect of Economic Value Added (EVA) on the Institutional
Ownership (EVA→ KI) is 0,891 with Statistic T is 0,137 and the path coefficient is
negative -0,021. The meaning is p value >0,05 with Statistic T <1,673 and the path
coefficient negative, show that Economic Value Added (EVA) have negative and not
significant effect on the Institutional Ownership. It can be concluded that EVA→ KI
is accepted H0 or rejected H1.
3) The p value of Institutional Ownership on firm value (KI→ PBV) is 0,002 with
Statistic T is 3,061 the path coefficient is negative -0,287. By direct testing show that
p value <0,05 with Statistic T >1,673 and the path coefficient is negative so that the
Institutional Ownership has negative and significant effect on firm value (PBV).the
meaning is KI→ PBV accepted H0 or rejected H1.
4) The result of indirect effect is Economic Value Added on firm value mediated by
Institutional Ownership (EVA→ KI→PBV) is 0,892 that sh yang artinya p values
adalah >0,005. So that,the institutional ownership can not mediated the EVA on PBV
or the meani g is accepted H0 and rejected H1.
DISCUSSION
The Effect Eva On Pbv
Based on the result of the PLS analysis, it was concluded that the
Economic Value Added has negative and significant effect on firm value (PBV). If
the company is able to produce the rate of return is greater than from cost of capital, it
can be seen that the company succeeded to creating the value for owners of capital
and to encourage the demand for shares. If the EVA positive, the higher of firm value
would impact on investor interest when investing, if the EVA value is negative, the
firm value will be low and will result in low investor interest when investing in stocks
(Septiyanti, 2015). The result in this study is, EVA has negative and significant effect
on firm value (PBV), so that conclude the EVA in the retail company has not been
able to increase firm value. This result of this study, supported by the result of statistic
descriptive with the conclude is a tendency for a high EVA, the company is Ace
Hardware Indonesia Tbk (ACES) with a low PBV value of 6.68. The results of the
study that indicated that EVA had a negative effect on firm value (PBV) was a study
by Sobahi et al. (2019) entitled "The Effect of Economic Value Added and Market
Value Added on Firm Value (Case Study at Bank BCA which is listed on the IDX
2007 period) -2017) ”. Based on these results, the partially Economic Value Added
(EVA) does not have a significant effect on firm value at PT. Bank Central Asia, Tbk
for the period 2007-2017 and there is a low and negative relationship.
Volume 1, Issue 5, November 2020 E-ISSN : 2721-303X, P-ISSN : 2721-3021
Available Online: https://dinastipub.org/DIJEFA Page 901
The Effect Eva On Institutional Ownership
Based on the result of PLS analysis, it was concluded that the Economic
Value Added has negative and not significant effect on Institutional Ownership. The
all company of retail sector has the highest of Economic Value Added are not
necessarily able to have a high percentage of institutional ownership either. This is
because institutional investors have a tendency to compromise or side with
management and ignore the interests of minority shareholders. In addition, the greater
the proportion of institutional ownership, the more influence it has on the use of
economic resources which causes high capital costs, so that when institutional
ownership increases, the company's performance will decline. The results of this study
are in line with research conducted by Fitria (2018) in her research entitled "The
Effect of Debt Policy, Managerial Ownership, Institutional Ownership, and Good
Corporate Governance on Economic Value Added)" with the results of research on
institutional ownership having a negative effect on EVA.
The Effect Institutional Ownership On Pbv
Based on the PLS analysis, can be concluded that Institutional
Ownership has negative and significant effect on firm value (PBV). The Institutional
investors with majority shareholdings are, more likely to side with and cooperate with
management to prioritize their personal interests over the interests of minority
shareholders. This is a negative signal for outsiders because the strategy of
institutional investors alliances with tends management to adopt suboptimal company
policies. This result that the negative and significant effect indicates that the investors,
are doing the investing analysis not see the side of institutional ownership. This is
because companies that work in high institutional supervision do not always provide
good performance output. Thus, high institutional ownership does not provide a good
signal to investors, and does not increase firm value in the end. The result of this
study is, the Institutional Ownership has negative and significant effect on PBV, so
that supported by the result on the study from Rahma (2014) entitled "The Effect of
Managerial Ownership, Institutional Ownership, and Company Size on Funding
Decisions and Company Value" which results in the decision that Ownership
Institutional negatively affects PBV.
The Institutional Ownership Not Mediate Eva On Pbv
The institutional ownership will tend to control the company. The
control from institutional owners, will prevent occurence that are not desirable from
the company. This matter, would maked company financing more effective and
efficient, which will attract both investors and potential investors . However, the
results of this study indicate that ki does not mediate eva on pbv, the meaning that
institutional ownership does not cause effect eva on pbv. The ownership of shares by
the institution is not able to contribute in determining the level of income that exceeds
the level of the cost of capital, so that the economic value as a result of activities or
company management strategies is not able to attract investors to invest which in turn
can reduce the firm value. This result of this study is supported by fadillah (2018)
entitled "the effect of tax avoidance on company value with institutional ownership as
Volume 1, Issue 5, November 2020 E-ISSN : 2721-303X, P-ISSN : 2721-3021
Available Online: https://dinastipub.org/DIJEFA Page 902
a moderation variable" which resulted in a study that institutional ownership did not
moderate or weaken the relationship between tax avoidance and firm value.
CONCLUSION AND SUGESTION
The result of this research conducted have been calculated using sem (structural
equation modeling) with the smart pls program. This research anaylized the variables has
related with economic value added on firm value (pbv) by the moderate variable is
institutional ownership on the retail sector was listed on the indonesia stock exchange (idx)
period 205-2019. From the analyzed can be drawn, and the following conclusions can be
drawn : economic value added (eva) has a significant negative effect on firm value (pbv),
economic value added (eva) has a not significant and negative effect on institutional
ownership, institutional ownership has a significant and negative effect on firm value (pbv),
and eva cannot have an indirect effect through institutional ownership on firm value (pbv) in
the retail company listed on indonesia stock exchange (idx) period 2015-2019.
Based on the hypothesis testing result from processing eva, institutional ownership,
and corporate value (pbv) it can be suggested as follows : for the company to be able
increasing the eva for interesting the investors with the strikes of the online retail industry so
that it is not less competitive, and for the future research hopefully to be able increasing the
other variables as dependent variable such as : tobins’q,per,and others.
REFERENCE
Amanda Wongso. 2012. The Influence of Dividend Policy, Ownership Structure and Debt
Policy on Firm Value in the Perspective of Agency Theory and Signaling Theory.
Accounting journal.
Ayuningtyas.Dwi. 2013. "The Effect of Profitability on Firm Value: Dividend Policy and
Investment Opportunities as Intermediate Variables". Journal of STIESIA. Surabaya.
Baridwan, Zaky & Legowo, Ary. 2002. Association between EVA (Economic Value Added),
MVA (Market Value Added) and Profitability Ratio to Stock Prices. Theme, Vol III.
September.
Basuki, Nur Aisyah FP, Udin. 2020. The Effect Of Innovation on Price To Book Value: The
Role Of Managerial Ownership in Indonesian Companies. Journal of Asian Finance,
Economics and Business Vol 7 No 5 (2020) 249 - 258.
Brigham, Eugene F. and Houston, Joel F. 2011. Basic Fundamentals of Financial
Management Translation. Edition 10. South Jakarta.
Brigham, Eugene F. And JF Houston. 2010. Fundamentals of Financial Management.
Edition 11. Jakarta: Four Salemba.
Cashmere. 2014. Banking Basics. Revised Edition, Twelfth Edition, PT. Raja Grafindo
Persada, Jakarta.
Volume 1, Issue 5, November 2020 E-ISSN : 2721-303X, P-ISSN : 2721-3021
Available Online: https://dinastipub.org/DIJEFA Page 903
Chitsimran and Kaur. 2018. An Analysis Of EVA & MVA of Indian Cement Industries.
International Journal of Innovative Research and Advanced Studies (IJIRAS) Volume 5
Issue 5, May 2018.
CNN Indonesia. 2019. Economic Growth in the Second Quarter of 2019 'Only' 5.05 Percent,
accessed on 06 November 2019, https://www.cnnindonesia.com/ekonomi.
Endri and Fathony. 2020. Determinants Of Firm's Value: Evidence From Financial Industry.
Management Science Letters 10 (2020). Mercu Buana University, Jakarta, Indonesia.
Fadillah Haqi. 2018. The Effect of Tax Avoidance on Company Value with Institutional
Ownership as a Moderation Variable. JIAFE (Accounting Scientific Journal, Faculty of
Economics)Vol.4No. 1, June 2018, p. 117-133 https://journal.unpak.ac.id/index.php/jiafe
P-ISSN: 2502-3020, E-ISSN: 2502-4159 .
Fahmi, Irham. 2014. Analysis of Financial Statements. Bandung: Alfabeta.
Franita and Riska. 2018. Mechanism for Good Corporate Governance and Corporate Value.
Aqli. Field
Ghozali, Imam. 2016. Multivariete Analysis Application with IBM SPSS 23 Program (8th
Edition). VIII printing. Semarang: Diponegoro University. Publishing Agency.
Handoko, Wahyu. 2008. Effect of Economic Value Added, ROE, ROA and EPS on Changes
in Stock Prices in LQ 45 Category. Thesis. Surakarta: Muhammadiyah University of
Surakarta.
Hery. 2017. Accounting Research Studies. PT.Grasindo Jakarta
Hery. 2018. Modern Internal Auditor.PT. Grasindo, Member of IKAPI, Jakarta. Indonesia
Stock Exchange, accessed on December 2, 2019. https://www.idx.co.id.
Karmilah Evi, Rita Nurmalina, Budi Setiawan. 2015. The Effect of Value Creation Based
Performance and Macroeconomic Variables on the Stock Return of the Animal Feed
Industry. Journal of Management & Agribusiness, Vol. 13 No. 2, July 2016.
Kumar and Subramanyam, 2015. Shareholders' Value Analysis: Eva & Mva In Relation To
Stock Market Returns With Reference To The Indian Cement Industry. Research Scholar,
Acharya Nagarjuna University. https://ssrn.com/abstract=2971332.
Nugraha and Bahtiar, 2012. The Effect of Return On Equity and Economic Value Added on
Firm Value (Case Study of Companies that Issue Shares in the List of Sharia Securities).
Islamic Journal of Accounting and Finance.
Rahma Alfiarti . 2014. Effect of Ownership Managerial , Ownership Institutional , and the
size of the Company Against Decisions Funding and Value of the Company. Journal of
Business STRATEGY Vol. 23 No. 2 Dec. 2014.
Rahma Irsadila, Dheasey Amboningtyas, Edward Gagagh PT. 2018. The Influence Of The
Company's Financial Performance Using Eva, Mva, And Per Methods On Stock Returns.
Online Journal of Students of the Faculty of Economics, University of Pandanaran
Semarang.
Ruky, S M. 1999. Assessing Inclusion in Companies. Gramedia Pustaka Utama, Jakarta.
Volume 1, Issue 5, November 2020 E-ISSN : 2721-303X, P-ISSN : 2721-3021
Available Online: https://dinastipub.org/DIJEFA Page 904
Sastriana, Dian, 2013, "The Effect of Corporate Governance and Firm Size on Companies
Experiencing Financial Difficulties", Thesis (unpublished), Diponegoro University
Undergraduate Program.
Septiyani, Melinda. 2015. The Effect of Economic Value Added and Market Value Added on
Firm Value in Companies in the LQ-45 Index 2010-2013. Faculty of Economics and
Business, Islamic University, Bandung.
Sobahi Irma Nurmalita, Enas, Elin Herlina. 2019. The Effect of Economic Value Added and
Market Value Added on Firm Value (Case Study at BCA Bank which is listed on the IDX
for the period 2007-2017). Business Management and Enterprise Journal. Volume 1
Number 2.
Sugiyono. 2016. Quantitative Research Methods, Qualitative and R & D. Issuer: PT.
Alphabet. Bandung.
Syahirah and Lantania, 2016. The Effect of Market Value Added, Economic Value Added,
Dividend Policy and Managerial Ownership on Firm Value in Manufacturing
Companies Listed on the Indonesia Stock Exchange in 2010-2014. Scientific Journal of
Accounting Economics Students (JIMEKA). Vol. 1, No. 1, (2016) Pages 1-12.
Wedayanthi and Darmayanti, 2016. The Effect of Economic Value Added, Independent
Commissioner Board Composition and Return On Assets on Firm Value. E-Journal of
Management of Udayana University, Vol. No. 6, 2016: 3647-3676. IS SN: 2302-8912.