the effect of desdyni mission on volcano...
TRANSCRIPT

The effect of DESDynI mission on volcano deformation modeling
The effect of DESDynI mission on volcano deformation modeling
Sang‐Ho Yun, Paul Rosen, Paul LundgrenJet Propulsion Laboratory
Howard Zebker, Paul SegallStanford University
1
National Aeronautics andSpace Administration
Jet Propulsion LaboratoryCalifornia Institute of Technology FRINGE 2009 WORKSHOP

(N+4)‐D measurements of volcanic activities
2
Temporal Domain (1)
GPS, seismometer, tilt meter, …Temporal Domain (1)
GPS, seismometer, tilt meter, …
Spectral Domain (N)
Hyperspectral
imagerySpectral Domain (N)
Hyperspectral
imagery
Spatial Domain (3)
InSAR, Optical imagery Spatial Domain (3)
InSAR, Optical imagery
FRINGE 2009 WORKSHOP

Question
3
What happens weeks, days and hours before and during volcanic eruptions?
EQs & Tectonics Seed Question 7: What kinds of new tectonics/volcanic
processes will be detectable with Sentinel data? How will it improve what we
already detect with current systems?
Volcanoes Seed Question 1: Is ALOS sufficient, and if not will other satellites
such as RADARSAT, TerraSAR‐X and COSMO‐SkyMed be able to fill the
void?
FRINGE 2009 WORKSHOP

Sierra Negra, Galápagos
4Chadwick et al., 2006
Geist
et al., 2008
Amelung, Jónsson
et al., 2000

Events we have been missing?
The caldera center of Sierra Negra
has uplifted for 26 years and erupted for 8 days in October 2005
(Amelung
et el. 2000; Chadwick et al. 2006; Yun et al. 2007; Geist
et al. 2008).
5
1979 1992 2000 20061997
Vertical motion of caldera center
FRINGE 2009 WORKSHOP

Spatial distribution of events
6
ASTER (2005/11/02) + SRTM DEM
2 km
aa
bb
cc
dd
?a. Uplift: 26 years
b. Faulting: seconds
c. Lateral flow: < 3 hours
d. Uplift + dike: < 3 hours
e. Fissure eruption: 4 days
f. Vent eruption: 4 days
(Geist et al., 2008)
ee
ff
?
FRINGE 2009 WORKSHOP

Magma chamber geometry
7
2 km
Best‐fit model using the binary parameter
optimization with a uniform pressure
boundary condition (Yun, 2007)
FRINGE 2009 WORKSHOP

Best‐fit composite model
8
Fault slip + dike opening
+ sill opening/closing.
Based on InSAR (Yun et
al., 2007), GPS (Chadwick
et al., 2006), seismic (Mw
5.4), fieldwork data (Geist
et al., 2008), and ASTER
image.
Inversion constrained by
InSAR data adjusted with
GPS data to isolate
eruption period. (94%
data variance explained).
Faulting event caused
irreversible deformation
along the western edge
of the sill (Yun 2007).
Fault slip
Dike opening
Sill closing

9
Simulated interferograms of volcanic deformation for 46 days starting from 12 days before the eruption of Sierra Negra volcano, Galapagos, based on InSAR data processing (Yun et al., 2007) and geophysical inversion (Yun 2007). An earthquake (Mw 5.4) occurred three hours prior to the eruption, which induced lateral magma migration. During the three hours dike intrusion occurred, which caused fissure eruption on the northern rim of the caldera. Most of the non-steady deformation occurred during the 8-day eruption, but they are quickly dominated by the large co-eruptive subsidence signal and covered by lava flow. The maximum co-eruptive subsidence was about 5.4 m.
-8 days -4 days -3 hours -2 hours
Eruption begins
+3 days +6 days +8 days +34 days
Eruption ends
-1 ~ 0 hours
Earthquake Mw 5.4 Lateral magma migration
Co-eruptive subsidence
Pre-eruptive uplift
Post-eruptive uplift
-12 days
Dike
Faults
Lava
Sierra Negra4 km
Reconstructed interferograms
“ALOS”
FRINGE 2009 WORKSHOP Envisat
15 cm / fringe

Were there other week‐long events?
Cerro Azul
volcano eruption, Galapagos
14 days, 2008 (Dennis Geist, personal comm.)
Afar dike intrusion, East Africa
10 days, 2007 (Calais et al., Nature 2008, Wright personal comm.)
Papua New Guinea dike intrusion
14 days, 2006 (Wicks, personal comm.)
Miyakejima
volcano eruption, Japan
13 days, 2000 (Ukawa
et al., EPS 2000)
…
10FRINGE 2009 WORKSHOP

Volcano eruption database
11
3872 eruption events recorded for 1900/1/1 –
2800/12/31
(Global Volcanism Program, Smithsonian Institution, Siebert and Simkin 2002‐)
Number of volcanoes that have erupted since 1900 with no uncertainty in month = 333
FRINGE 2009 WORKSHOP

40 eruptions / year
12
WW I WW II
Reporting and population trend
instead of increased volcanism
The apparent sharp increase in the
mid‐20th century following WWII
reflects the onset of the IAVCEI
regional cataloging of volcanic
events and the beginning of
publication of annual catalogs of
volcanic activity (Siebert, personal
comm.)
FRINGE 2009 WORKSHOP

13FRINGE 2009 WORKSHOP

Probability of eruption during a 5‐year mission
14
Acatenango 0.1286 Concepcion 0.6005 Jan Mayen 0.0448 Marchena 0.0448 Rocard 0.0877 Tori-shima 0.1676Adatara 0.0877 Copahue 0.0448 Kaba 0.2050 Marion Island 0.0448 Ruang 0.1676 Trident 0.3382Agung 0.0448 Cotopaxi 0.0877 Kaitoku Seamount 0.0448 Masaya 0.4975 Ruapehu 0.8544 Tristan da Cunha 0.0877Ahyi 0.0448 Cumbal 0.0448 Kanaga 0.0877 Mauna Loa 0.4739 Ruby 0.0877 Tungurahua 0.0877Akademia Nauk 0.0448 Curacoa 0.0448 Kanlaon 0.6005 Mayon 0.5200 Ruiz, Nevado del 0.0877 Tupungatito 0.2050Akan 0.5415 Dabbahu 0.0448 Karangetang [Api Siau] 0.7475 McDonald Islands 0.0448 Rumble III 0.1286 Ubinas 0.0448Akita-Komaga-take 0.0877 Dalaffilla 0.0448 Karkar 0.1286 Medvezhia 0.0448 Sabancaya 0.1286 Ukinrek Maars 0.0448Akita-Yake-yama 0.1286 Deception Island 0.0877 Karthala 0.4492 Merapi 0.6005 Sakura-jima 0.3679 Ulawun 0.6966Akutan 0.5200 Dempo 0.4739 Karymsky 0.3382 Meru 0.0448 San Cristobal 0.4233 Unnamed 0.3072Alaid 0.2050 Didicas 0.0877 Kasatochi 0.0448 Metis Shoal 0.1286 San Jorge 0.0448 Unzen 0.0877Alayta 0.0448 Dieng Volc Complex 0.3382 Katla 0.0448 Michael 0.3382 San Miguel 0.3679 Usu 0.1676Ambrym 0.7102 Eastern Gemini Seamount 0.0448 Katmai 0.0448 Michoacan-Guanajuato 0.0448 San Pedro 0.0448 Vailulu'u 0.0877Amukta 0.0448 Ebeko 0.3072 Kavachi 0.6005 Miravalles 0.0448 San Salvador 0.0448 Veniaminof 0.4739Anatahan 0.1676 Egon 0.1676 Kelimutu 0.0877 Miyake-jima 0.3679 Sangeang Api 0.2050 Vestmannaeyjar 0.0877Aniakchak 0.0448 Epi 0.1676 Kelut 0.3382 Momotombo 0.0448 Santa Ana 0.1286 Vesuvius 0.0448Aoba 0.0877 Erebus 0.0877 Kerinci 0.4739 Monowai Seamount 0.1286 Santa Maria 0.0448 Villarrica 0.6966Ardoukoba 0.0448 Etna 0.9694 Kharimkotan 0.0448 Montagu Island 0.0448 Santorini 0.1676 Visoke 0.0448Arenal 0.0448 Falcon Island 0.0448 Kick 'em Jenny 0.3962 Moua Pihaa 0.0877 Sarychev Peak 0.3072 Waiowa 0.0448Asama 0.8731 Farallon de Pajaros 0.1286 Kikai 0.3072 Mutnovsky 0.2406 Savai'i 0.0877 Watt, Morne 0.0448Askja 0.0448 Fayal 0.0448 Kilauea 0.9036 Nasu 0.0877 Seguam 0.1286 Westdahl 0.1286Aso 0.9234 Fernandina 0.4233 Kirishima 0.2747 Negra, Sierra 0.2050 Semeru 0.4975 White Island 0.4739Atka 0.0448 Fogo 0.0877 Kiska 0.0877 Negro, Cerro 0.5415 Shikotsu 0.6355 Wolf 0.1676Augustine 0.2406 Fournaise, Piton de la 0.6005 Kizimen 0.0448 Niigata-Yake-yama 0.2747 Shiretoko-Iwo-zan 0.0448 Wrangell 0.1286Avachinsky 0.2406 Fourpeaked 0.0448 Kliuchevskoi 0.9036 Nikko-Shirane 0.0448 Shishaldin 0.4739 Yake-dake 0.6355Awu 0.2406 Fuego 0.5200 Kolokol Group 0.0877 Nila 0.0877 Shiveluch 0.4492 Yucamane 0.0448Axial Seamount 0.0448 Fukujin 0.0877 Komaga-take 0.3382 Nishino-shima 0.0448 Sirung 0.2050 Yunaska 0.0448Azul, Cerro 0.2050 Fukutoku-Okanoba 0.3072 Korovin 0.1676 Niuafo'ou 0.2050 Slamet 0.6966 Zao 0.0448Azuma 0.0877 Galeras 0.3962 Koryaksky 0.1286 North Gorda Ridge 0.0448 Socorro 0.0877 Zavaritzki Caldera 0.0448Babuyan Claro 0.0448 Galunggung 0.1286 Krafla 0.2406 Novarupta 0.0448 Soputan 0.6823 Zheltovsky 0.0448Bagana 0.2406 Gamalama 0.4739 Krakatau 0.7588 Nyamuragira 0.7588 Sorikmarapi 0.0877 Zhupanovsky 0.0877Bam 0.2747 Gamkonora 0.2050 Kuchinoerabu-jima 0.3679 Nyiragongo 0.2406 Soufriere Guadeloupe 0.0877Banda Api 0.0448 Garbuna Group 0.1286 Kuju 0.0448 Okataina 0.4492 Soufriere Hills 0.0877Banua Wuhu 0.0877 Gareloi 0.0877 Kupreanof 0.0448 Okmok 0.3382 Soufriere St. Vincent 0.1286Barcena 0.0448 Gaua 0.2747 Kurikoma 0.0448 On-take 0.0448 Spurr 0.0877Bardarbunga 0.0877 Gede 0.2050 Kusatsu-Shirane 0.4739 Oshima 0.7898 St. Andrew Strait 0.0448Barren Island 0.1676 Gorely 0.2050 Kuwae 0.2406 Pacaya 0.2406 St. Helens 0.1676Batur 0.4492 Goriaschaia Sopka 0.0448 Kverkfjoll 0.0448 Pagan 0.3072 Stromboli 0.0877Bayonnaise Rocks 0.2050 Great Sitkin 0.0448 La Palma 0.0877 Pago 0.1286 Sumbing 0.0877Bezymianny 0.8671 Grimsvotn 0.1676 Langila 0.5621 Paluweh 0.2747 Sundoro 0.1676Bogoslof 0.1286 Grozny Group 0.1676 Lascar 0.5621 Papandayan 0.1286 Suoh 0.0448Bristol Island 0.0877 Guagua Pichincha 0.3382 Lassen Volc Center 0.0448 Pavlof 0.5817 Supply Reef 0.0877Bulusan 0.3679 Heard 0.3072 Lautaro 0.0448 Pelee 0.0877 Suwanose-jima 0.4233Calbuco 0.1676 Hekla 0.2747 Lengai, Ol Doinyo 0.3382 Perbakti-Gagak 0.0448 Taal 0.3679Callaqui 0.0448 Home Reef 0.0877 Leroboleng 0.0448 Peuet Sague 0.1286 Tacana 0.0877Cameroon 0.3072 Hudson, Cerro 0.0877 Lewotobi 0.4233 Pilas, Las 0.0877 Tair, Jebel at 0.0448Camiguin 0.0448 Huila, Nevado del 0.1286 Llaima 0.6184 Pinatubo 0.1286 Talang 0.3072Carran-Los Venados 0.1286 Hunga Tonga-Hunga Ha'apai 0.0448 Loihi 0.0448 Planchon-Peteroa 0.1676 Tandikat 0.0448Cendres, Ile des 0.0448 Ibu 0.2050 Lokon-Empung 0.5415 Poas 0.6966 Tangkubanparahu 0.3679Cereme 0.0877 Ijen 0.2406 Long Island 0.2050 Popocatepetl 0.2050 Tao-Rusyr Caldera 0.0448Chaiten 0.0448 Iliboleng 0.3679 Lonquimay 0.0448 Purace 0.2050 Teahitia 0.1676Chichon, El 0.0448 Iliwerung 0.3072 Lopevi 0.5817 Puyehue-Cordon Caulle 0.0877 Telica 0.6674Chiginagak 0.0877 Inielika 0.0877 Macdonald 0.3679 Rabaul 0.3072 Tenerife 0.0448Chikurachki 0.4233 Ioto [Iwo-jima] 0.3962 Mahawu 0.0448 Ranakah 0.0448 Tengger Caldera 0.6674Chillan, Nevados de 0.0877 Irazu 0.2406 Maipo 0.0448 Raoul Island 0.0877 Terceira 0.0448Chirinkotan 0.1286 Irruputuncu 0.0448 Makian 0.0448 Raung 0.7696 Tiatia 0.0877Chokai 0.0448 Iwate 0.0448 Makushin 0.1286 Redoubt 0.1676 Tinakula 0.2747Cleveland 0.3962 Iwo-Tori-shima 0.1286 Maly Semiachik 0.0448 Reventador 0.3679 Tofua 0.0448CoAxial Segment 0.0448 Iya 0.0877 Manam 0.5621 Rincon de la Vieja 0.4492 Tokachi 0.4233Colima 0.3072 Izalco 0.3382 Manda Hararo 0.0448 Rinjani 0.2747 Tolbachik 0.4975Colo [Una Una] 0.0448 Izu-Tobu 0.0448 Marapi 0.7356 Ritter Island 0.1676 Tongariro 0.6674

Detectability
Binary parameter of a remote sensing mission
A function of the mission’s revisit period and the duration of a volcanic event.
Detectability
= 1 if:
The mission has a non‐zero probability to perfectly image the event (Case A).
The mission has 100 % probability of acquiring data during the event (Case B).
Detectability
= 0 otherwise
15
Case A Case B
FRINGE 2009 WORKSHOP

Expected detectability
improvement
The duration of 1209 eruptions (31.2 % of
total) were shorter than 46 days (ALOS’
revisit period).
The duration of 518 eruptions (13.4 % of
total) were between 8 days (DESDynI) and
46 days (ALOS).
43 % of the “missing”
events by ALOS will
be “detected”
with DESDynI.
During its 5‐year mission, 30 eruption
events are expected to be further
“detected”
with DESDynI.
16
DESDynI ALOSFRINGE 2009 WORKSHOP
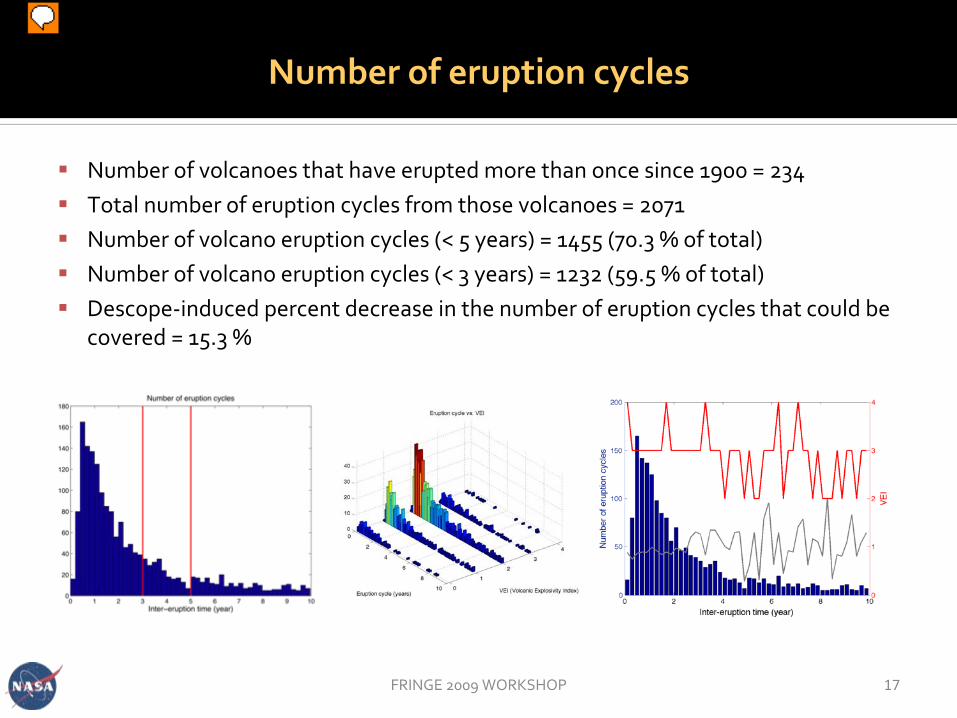
Number of eruption cycles
Number of volcanoes that have erupted more than once since 1900 = 234
Total number of eruption cycles from those volcanoes = 2071
Number of volcano eruption cycles (< 5 years) = 1455 (70.3 % of total)
Number of volcano eruption cycles (< 3 years) = 1232 (59.5 % of total)
Descope‐induced percent decrease in the number of eruption cycles that could be
covered = 15.3 %
17FRINGE 2009 WORKSHOP

18
Simulated interferograms of volcanic deformation for 46 days starting from 12 days before the eruption of Sierra Negra volcano, Galapagos, based on InSAR data processing (Yun et al., 2007) and geophysical inversion (Yun 2007). An earthquake (Mw 5.4) occurred three hours prior to the eruption, which induced lateral magma migration. During the three hours dike intrusion occurred, which caused fissure eruption on the northern rim of the caldera. Most of the non-steady deformation occurred during the 8-day eruption, but they are quickly dominated by the large co-eruptive subsidence signal and covered by lava flow. The maximum co-eruptive subsidence was about 5.4 m.
-8 days -4 days -3 hours -2 hours
Eruption begins
+3 days +6 days +8 days +34 days
Eruption ends
-1 ~ 0 hours
Earthquake Mw 5.4 Lateral magma migration
Co-eruptive subsidence
Pre-eruptive uplift
Post-eruptive uplift
-12 days
Dike
Faults
Lava
Sierra Negra4 km
Reconstructed interferograms
FRINGE 2009 WORKSHOP
“ALOS”
Envisat
15 cm / fringe

The Fringe Movie
19
Note: Frame
interval is not
constant
Uplift: 1 frame / dayFaulting:
2 frames / secMagma move: 8 frames / hrDike intrusion: 8 frames / hrSubsidence: 1 frame / day
FRINGE 2009 WORKSHOP

20
-8 days -4 days -3 hours -2 hours
Eruption begins
+3 days +6 days +8 days +34 days
Eruption ends
-1 ~ 0 hours
Earthquake Mw 5.4 Lateral magma migration
Co-eruptive subsidence
Pre-eruptive uplift
Post-eruptive uplift
-12 days
Dike
Faults
Lava
Sierra Negra4 km
Reconstructed interferograms revisited
Simulated interferograms of volcanic deformation for 46 days starting from 12 days before the eruption of Sierra Negra volcano, Galapagos, based on InSAR data processing (Yun et al., 2007) and geophysical inversion (Yun 2007). An earthquake (Mw 5.4) occurred three hours prior to the eruption, which induced lateral magma migration. During the three hours dike intrusion occurred, which caused fissure eruption on the northern rim of the caldera. Most of the non-steady deformation occurred during the 8-day eruption, but they are quickly dominated by the large co-eruptive subsidence signal and covered by lava flow. The maximum co-eruptive subsidence was about 5.4 m.
FRINGE 2009 WORKSHOP
“ALOS”
Envisat
15 cm / fringe

Conclusions
21
Dike intrusions and fast magma migration (such as the ones induced by
faulting events) are likely to be captured by
DESDynI mission.
31.2 % of volcanic eruptions are not detected by ALOS. 43 % of them will be
detected by DESDynI. This is about 30 eruptions for 5 years.
Descoping
from 5 years to 3 years would cause 40 % decrease in number of
events covered and 15.3 % decrease in the number of eruption cycles
covered.
ALOS, Envisat, ERS, and Radarsat
are not frequent enough to detect such
events. TerraSAR‐X might detect them. COSMO‐SkyMed
is likely to image
those events, if data are available.
FRINGE 2009 WORKSHOP