the effect of customer service strategies on customer
TRANSCRIPT

THE EFFECT OF CUSTOMER SERVICE STRATEGIES ON CUSTOMER
LOYALTY: EVIDENCE FROM CIC INSURANCE GROUP- NAKURU
COUNTY
ADIKHA LIDAULI PAUL
A Research Project Submitted to the School of Business and Economics in
Partial Fulfillment of the Requirement for the award of Master Degree of
Business Administration (Strategic Management Option) Kabarak University
November, 2016

ii
DECLARATION AND APPROVAL
Declaration
This research project is my original work and has not been presented for a degree in
any other University or institution of higher learning and this is to the best of my
knowledge.
Signature …………………………………… Date ……………………………………
Adikha Lidauli Paul
GMB/NE/0131/01/14
Approval
This research project has been submitted for examination with our approval as
University supervisors
Signature……………………………………Date……………………………………
Dr Maina Waiganjo,
Senior Lecturer
School of Business and Economics
Kabarak University
Signature……………………………………Date……………………………………
Mr. Philip Ragama,
Senior Lecturer
School of Computer Science and Bioinformatics
Kabarak University

iii
ACKNOWLEDGEMENTS
All the glory and honour be to the almighty God for His blessings and guidance
throughout this whole work. I‟m also indebted and grateful to my family for the
immense support, endurance and understanding during my whole study period. Your
love and encouragement provided a perfect environment for me to pursue and
complete this degree. I owe this to you my wife and sons. This study wouldn‟t be
complete without the invaluable input, contribution and technical guidance of my
supervisors; Dr. Maina Waiganjo and Mr. Philip Ragama. Their selfless support and
availability for consultation will always stand out throughout this study.

iv
DEDICATION
This research project is dedicated to my wife, children and parents.

v
ABSTRACT
The aim of this study was to investigate the effect of customer service strategies on
customer loyalty of insurance firms. The study specifically sought to establish the
extent to which quality service, service bay ambience and technology support
strategies affect loyalty of CIC insurance Group customers in Nakuru County. In
order achieve the study objective, 15,487 customers in Nakuru and Naivasha branches
formed the target population upon which a sample size of 222 respondents was drawn
for the study using Nassiuma‟s formula. Data was collected by use of a pre tested
structured questionnaire containing both open and close ended questions. Descriptive
statistics (frequencies, percentages) and Chi-square test as well as inferential statistics
(Pearson‟s Correlation and regression analysis) were used to analyze data. The
findings of the study were presented using tables. The theories upon which this study
was anchored include; relationship commitment model, conversion model and service
quality model (SERVDUAL). The study revealed that when all the independent
variables (Quality service strategy, Service bay ambience strategy and Technology
support strategy) are combined; only explain 21.7% of the variations in customer
loyalty in the insurance industry could be explained by the results of the study
findings. The findings also revealed that quality service strategy had an insignificant
effect on customer loyalty at 5% level of significance (β1=0.042; p=0.741). However,
service bay ambience strategy (β2=0.253; p=0.019) and technology support strategy
(β3=0.534; p=0.000) respectively significantly influenced the loyalty of customers in
the insurance industry. From the findings, it can be concluded that technology support
strategy had a greater influence on customer loyalty followed by service bay
ambience strategy and the least being quality service strategy. The study recommends
that the insurance firms should incorporate more of technology support strategy
amongst their customer service strategies more so in this information and
communication technology era. Further research needs also to be carried out on firms
in other industries so as to find out whether these variables will hold true.
Key words; Customer service Strategies, Customer loyalty, Quality service
strategies, Service bay ambience strategies, Technology support strategies.

vi
TABLE OF CONTENT
DECLARATION AND APPROVAL ..................................................................... ii
ACKNOWLEDGEMENTS .................................................................................. iii
DEDICATION......................................................................................................... iv
ABSTRACT .............................................................................................................. v
LIST OF TABLES .................................................................................................. ix
LIST OF FIGURES ................................................................................................. x
ACRONYMS AND ABBREVIATIONS ............................................................... xi
CHAPTER ONE:INTRODUCTION ..................................................................... 1
1.1 Background of the Study ..................................................................................... 1
1.1.2 Global Insurance Outlook ................................................................................. 2
1.1.3 Insurance Situation in Kenya ............................................................................ 3
1.2 Statement of the Problem ..................................................................................... 4
1.3.1 Genaral Objective ............................................................................................. 5
1.3.2 Specific Objectives ........................................................................................... 5
1.4 Research Hypotheses ........................................................................................... 5
1.5 Scope of the Study ............................................................................................... 6
1.6 Significance of the Study ..................................................................................... 6
1.7 Limitations/delimitation of the Study .................................................................. 6
1.8 Definitions of Operational Terms ........................................................................ 7
CHAPTER TWO:LITERATURE REVIEW ........................................................ 8
2.1 Introduction .......................................................................................................... 8
2.2 Theoretical Literature ........................................................................................... 8
2.2.1 RelationshipCommitmentModel .................................................................... 8
2.2.2. A Holistic Approach to Satisfaction, Trust and Switching Barriers ................ 9
2.2.3 Conversion Model ........................................................................................... 11
2.2.4 A Holistic Approach to Quality, Price, Indifference and Inertia .................... 12
2.2.5 The three level of RetentionStrategies ........................................................ 14
2.2.6 Service Quality Model (SERVQUAL) ........................................................... 16
2.2.6.1 Dimensions of Service Quality .................................................................... 16
2.3 Empirical Review............................................................................................... 18
2.3.1 Customer Loyalty............................................................................................ 18
2.3.2 Quality Service Strategy ................................................................................. 19
2.3.3 Service Bay Ambience Strategy ..................................................................... 22

vii
2.3.4 Technology Support Strategy ......................................................................... 23
2.4 Reasons for Customer retention ......................................................................... 24
2.5 Conceptual Framework ...................................................................................... 25
CHAPTER THREE:RESEARCH METHODOLOGY ..................................... 26
3.1Introduction ......................................................................................................... 26
3.2Research Design.................................................................................................. 26
3.3 Target Population ............................................................................................... 26
3.4 Sampling Procedure and Sampling Technique .................................................. 26
3.5 Data Collection Instruments and Procedure ...................................................... 27
3.6 Validity and Reliability of Research Instrument ............................................... 28
3.7 Data Analysis Method and Presentation of Findings ......................................... 28
3.8 Ethical Measures ................................................................................................ 29
CHAPTER FOUR:DATA ANALYSIS, INTERPRETATIONS AND
DISCUSSIONS ....................................................................................................... 30
4.1 Introduction ........................................................................................................ 30
4.1.1 Response Rate ................................................................................................. 30
4.2 General Characteristic of the Respondents ........................................................ 30
4.2.1 Gender by Marital Status of the Respondents................................................. 31
4.2.2 Age of the respondent in years........................................................................ 31
4.3 Customer Service Strategies .............................................................................. 32
4.3.1 Quality Service Strategy ................................................................................. 32
4.3.2 Service Bay Ambience Strategy ..................................................................... 35
4.3.3 Technology Support Strategy ......................................................................... 37
4.4 Inferential Statistics ........................................................................................... 40
4.4.1 Correlation Analysis ....................................................................................... 40
4.4.2 Regression Analysis ........................................................................................ 41
4.4.3 Anova Results ................................................................................................. 42
4.5 Hypotheses Testing ............................................................................................ 43
4.5.1 Specific objectives .......................................................................................... 43
CHAPTER FIVE:SUMMARY OF FINDINGS, CONCLUSIONS AND
RECOMMENDATIONS ...................................................................................... 45
5.1 Introduction ........................................................................................................ 45
5.2 Summary of Findings ......................................................................................... 45
5.3 Conclusions ........................................................................................................ 47

viii
5.4 Recommendations .............................................................................................. 47
5.5 Recommendation for Further Research ............................................................. 48
REFERENCES ...................................................................................................... 49
APPENDICES ....................................................................................................... 69
APPENDIX I: LETTER OF INTRODUCTION ..................................................... 69
APPENDIX II: QUESTIONNAIRE ........................................................................ 70

ix
LIST OF TABLES
Table 3.1: Sample Size ................................................................................................ 27
Table 4.1: Shows the response rate of the respondents ............................................... 30
Table 4.2: Gender of the Respondents by Marital Status ............................................ 31
Table 4.3: Age of the respondent in years ................................................................... 31
Table 4.4: Duration with the firm in years ................................................................... 32
Table 4.5: Quality Service Strategy ............................................................................. 33
Table 4.6: Service Bay Ambience Strategy ................................................................. 35
Table 4.7: Technology Support Strategy ..................................................................... 38
Table 4.8: Summary of correlations............................................................................. 40
Table 4.9a: Multiple Linear Regression Analysis Model Summary............................ 42
Table 4.9b: ANOVA Results ....................................................................................... 42
Table 4.9c: Multiple Linear Regression Results .......................................................... 42

x
LIST OF FIGURES
Figure 2.1: Three levels of retention Strategies ........................................................... 14
Figure 2.2: Conceptual framework showing the relationship between independent
variables and dependent variable. ................................................................................ 25

xi
ACRONYMS AND ABBREVIATIONS
AKI Association of Kenya Insurers
COMESA Common Market for Eastern and Southern Africa
CRM Customer Relationship Management
EAC East African Community
SADC Southern African Development Community (SADC)
GDP Gross Domestic Product

1
CHAPTER ONE
INTRODUCTION
1.1 Background of the Study
In recent times, the importance of customers to organizations has been highlighted by
many researchers and academicians all around the world. Top performing institutions
believe that customers are the purpose of what they do and they very much depend on
them; customers are not the source of a problem and they should never make a wish
that customers “should go away” because their future and security will be put in
jeopardy(Zairi, 2000).
Globally, firms are experiencing new changes. Financial liberalization and
deregulation together with globalization of markets exacerbated the intensity of
competition. This coupled with rapid technological advancement and improved
communication systems, have contributed to the increasing integration and
resemblance amongst institutions. As a result, firms are now faced with very high and
intense competition (Harvey, 2010). Therefore, insurance firms must develop
customer-oriented strategies in order to compete successfully in the competitive
business environment and various strategies are formulated to retain the customer and
the key of it all is to increase the service quality level.
Customers are a key factor that keeps an organization operating effectively hence
developing and maintaining customer relationships is vital for competitive advantage.
Therefore, acquiring and retaining customers whose lifetime value to the firm is
propitious affords a company opportunity to achieve its objectives (Wangondu,
2008).Successful customer retention starts with the first contact an organization has
with a customer and continues throughout the entire lifetime of the relationship. A
company's ability to attract and retain new customers, is not only related to its product
or services, but strongly related to the way it services its existing customers and the
reputation it creates within and across the marketplace. This has led to customer
support service emerging as a strong tool for companies to build a strong relationship
with their customers (Qasim & Asadullah, 2012).
A business that wants to succeed in today‟s global competitive market, where
customers are empowered and brand loyalty erosion is increasing, will have to

2
strategically incorporate move to customer relationship management (CRM).
Customer relationship management enables organizations to provide excellent real-
time customer service through the effective use of individual account information
(Kotler & Keller, 2006).
The core CRM processes are customer acquisition, customer retention, customer
development and customer service. Customer acquisition strategies aim to increase
the number of customers in the customer base. On the other hand customer retention
strategy aims to keep a high proportion of current customers by reducing customer
defections and customer development strategy aims to increase the value of those
retained to the company (Ahmad & Buttle, 2001). Customer service is the act of
taking care of the customer's needs by providing and delivering professional, helpful,
high quality service and assistance before, during, and after the customer's
requirements are met (Mckinney, 2015).
1.1.2 Global Insurance Outlook
The economic environment for insurers improved marginally in 2015, as global real
Gross Domestic Product (GDP) rose by 2.7%, near the 10-year annual growth rate
average of 2.8%. The improvement was driven by the advanced markets, led by the
UK. Growth in USA accelerated slightly to 2.4% and was also stronger (but uneven)
in Western Europe. In Advanced Asia, growth slowed due to ongoing sluggishness in
Japan. In contrast, the emerging markets grew at a slower aggregate rate of 4.1% in
2015, down from 4.6% in 2014. Many countries struggled with domestic challenges,
structural deficiencies and uncertainty about the impact of USA Federal Reserve
(Fed) cutting back its quantitative easing program. Advanced countries‟ equity
markets outperformed their emerging market peers and government bond yields
remained very low(AKI, 2015).
However, rising competition, soft pricing conditions and tight profit margins have
been some of the key challenges in the sector. To effectively surmount these
problems, many insurers are investing in technological solutions that improve front-
end sales, distribution and customer service, and enhance back-end operational
efficiency and expense management. Many insurers are investing in digital platforms
that strengthen their relationships with customers across all product classifications and

3
geographies. Their goal is to empower both businesses and consumers to better shop
for insurance, making products more transparent, easier-to understand and compare.
Across all regions, insurers are capitalizing on data analytics, cloud computing and
modeling techniques to sharpen their market segmentation strategies, reduce claims
fraud and strengthen underwriting and risk management. They are also investing in
technological solutions to optimize processes, increase collaboration across the
enterprise, and demonstrate capital adequacy and financial solvency for regulatory
compliance purposes(Crawford, 2015).
1.1.3 Insurance Situation in Kenya
In Kenya there were 49 operating insurance companies as at the end of 2015; 25 in
general/short-term insurance, 13 in life insurance and 11 composite companies. The
penetration of insurance in the country is estimated at 2.92%. Emerging risks such as
Micro insurance, oil & gas and initiatives such as adoption of alternative distribution
channels (bancassurance) and use of technology will improve insurance penetration
level in Kenya. Kenyan insurance companies have been spreading their foothold in
the region covering EAC, COMESA and SADC. This has been necessitated by their
customers showing business interests in manufacturing, tourism, transport &
communication, building and construction across the region to be covered by the
same insurer. Insurers such as Jubilee, APA, CIC, UAP, Heritage, MayFair among
others have found it necessary to establish offices across East, Central and to a certain
extent Southern Africa(AKI, 2015).
In addition, some players in this sector have seen the need to redefine their business
model by choosing to be listed in the stock market. To this end, the number of listed
insurance firms has increased from 3 in 2010 to the current 6. Growth in the financial
sector has motivated insurance industry players to expand as they seek to take their
financial services to practically all areas. The insurance sector is bound to benefit
from increased financial services penetration, ignited by aggressive low-
income/micro-enterprises banking initiatives and explosion of mobile money transfer.
The industry has also witnessed improved regulation, setting minimum premiums
chargeable for certain classes of business thereby reducing undercutting and unfair
competition. In addition, the regulator (Insurance Regulatory Authority) has increased
minimum capital requirements thereby improving capitalization and strengthening

4
solvency. Most important of all, managerial capacity and use of risk based models in
pricing premiums has been greatly enhanced over the past decade(Standard
Investment Bank, 2013).
As these firms seek alternative models to secure their financial soundness, it is
important to note that the core business and main source of finance for these insurance
firms is rendering services. It is therefore prudent that as much as other avenues seem
lucrative, customer service is of utmost importance since these firms derive their
longevity from customers whose acquisition, retention, development and satisfaction
relies solely on efficient delivery of services.
1.2 Statement of the Problem
In recent times, the insurance industry has undergone a series of changes as a result of
financial reforms necessitated by the globalization of financial services and economic
development as well as advancement of communication and information technologies.
Predictably, players in the insurance industry are now facing extreme competition in
the current environment. This is complicated by a low insurance cover uptake
nationally and the race for this limited market is now stronger than ever before as the
number of players rose to 51 in 2015 from 48 in 2014 (AKI, 2015)
In order to keep and expand market share some insurers have started using pricing as
an arsenal for market share growth by charging unsustainable premiums. This has
consequently compromised service delivery as most insurers are not able to fund
infrastructure for efficient delivery of services and claims settlement. Attempts by the
government to prod the insurers to merge by increasing the minimum capital
requirements have not borne fruit either (Mbogo, 2011).
Given that Insurance industry is a service oriented industry quality is of essence.
However, complaints from subscribers on poor service quality have increased in
recent times. This has been characterized by lengthy investigations and delayed
claims settlement which has led to customer attrition thereby endangering the
corporate image of these firms. In order to address this problem and to retain the
existing customers while attracting new ones, insurance companies‟ have periodically

5
adopted several customer service strategies that are expected to influence customer
loyalty
CIC insurance Group being the fifth largest insurance company in Kenya with a
market share of 6.6% has an ambitious goal to be the market leader by 2018 (CIC
Insurance Group Five year strategic plan 2013 – 2018). In order to achieve this goal
under the current competitive environment CIC Insurance Group for the last two years
has implemented a series of strategies mainly targeting the improvement on service
quality, service bay ambience and technological support to increase customer loyalty
since opinions customers have on the service they get determines greatly whether they
will continue transacting with the firm or not. It is against this background that this
study sought to investigate whether these key customer service strategies significantly
affect loyalty of insurance customers in CIC insurance group.
The objectives of this study were as follows:
1.3.1 Genaral Objective
The general objective of this study was to examine the effects that the selected
customer service strategies has on customer loyalty in the insurance industry.
1.3.2 Specific Objectives
i) To ascertain whether quality service strategyaffects customer loyalty in the
insurance firms.
ii) To determine whether service bay ambience strategy affects customer loyalty
in the insurance firms.
iii) To analyse the effect of technology support strategyon the loyalty of
customers in the insurance firms.
1.4 Research Hypotheses
The type of hypothesis used by the researcher in the study is simple null
hypothesis. These are used as the researcher believes there is no relationship
between two variables or when there is inadequate theoretical or empirical
information to state a research hypothesis. The choice of null hypothesis was also
to allow the study findings to contradict the hypothesis and prove the point that
6
there is a definite relationship.
H01: Quality service strategy has no significant effect on customer loyalty inthe
insurance firms.
H02: Service bay ambience strategy has no significant effect on customer loyalty in
the insurance firms.
H03: Technology support strategy has no significant effect on customer loyalty in
the insurance firms.
1.5 Scope of the Study
The study was carried out within Nakuru County due to its proximity and accessibility
to the researcher, with particular focus on CIC insurance group since it is one of the
largest insurance firms in terms of customer base in the county. The study targeted all
the customers who had running policies with the insurer at the time of study and
covered the three study dimensions of customer service strategies namely the quality
service, service bay ambience and use of technology and most importantly how these
factors affect the loyalty of customers in the insurance industry.
1.6 Significance of the Study
The knowledge created from this research is likely to add to the current information
on the subject matter of customer service and its effect on customer loyalty. It is
expected that the study findings will assist the insurance firms construct and focus on
functional customer service management strategies in order to stabilize and improve
customer relations and also on their loyalty. The findings of this study are likely to
motivate and present an opportunity to other researchers also interested in carrying
out further research in this area. The study findings will also serve as reference
material for scholars.
1.7 Limitations/delimitation of the Study
The researcher acknowledges that the findings of this study may not be generalized
because data was collected from one insurance company‟s customers in one County.
More studies therefore will be necessary before drawing the general conclusions. It
was also be difficult to establish the honesty of respondents in their responses.

7
1.8 Definitions of Operational Terms
Customer loyalty-Oliver defined loyalty of customer as having a deep commitment
to buying again and constant customer of a product or service or preferred product
(Oliver, 1999).In this study, customer service will be measured in terms of
willingness to recommend, repurchase intention, intention to stay and identification
with the organization brand.
Customer service strategy- Customer service is defined as an organization‟s ability
to meet the needs and desires of its customers. It is the ability of an organization to
consistently exceed the expectations of its customers (Nick, 2004). Customer service
strategies will be measured in terms of quality service, service bay ambience and
technology support.In this study customer service strategies include; quality service,
service bay ambience and technological support.
Quality service strategy- Service quality as a measure of compliance with the
expectations of customers‟ service levels(Javadin, Khanlori, & Stiri, 2009). In this
study, customer service will be measured in terms of reliability, responsiveness,
assurance, empathy and handling time.
Service bay ambience strategy- According to Shikdar (2002), ambience includes
ergonomic components of the tangible workplace environment that comprise spatial
layout and functionality. In this study, this includes equipment, sitting area facilities,
communication materials, personnel, noise, lighting, seating arrangement, air
conditioning and decorations.
Technology support strategy-As defined by Banta(2009), technology support is a
broad concept that deals with use and knowledge of tools and crafts and how its use
affects the ability to control and adapt to the social and physical environment. In this
study technology support is the act of availing these support tools which are
appropriate and up to date that aid customers and employees and will be measured in
terms of availability of internet connectivity, appropriate computers and applications,
their ease of use, efficiency and effectiveness of data management and how it helps
employees to save on time.

8
CHAPTER TWO
LITERATURE REVIEW
2.1 Introduction
The impact of customer service strategies on customer loyalty is a widely discussed
topic in literature. This section targets popular journals and various text books that
contain fruitful information on various customer service strategies dimensions as well
as its effect on customer loyalty. Finally this chapter gives a summary and highlights
on the gaps and issues reviewed as well as the conceptual framework.
2.2 Theoretical Literature
Various theories have been advanced to explain the relationship between customer
service strategies and customer loyalty. It suffices to state that strategies adopted may
make a theory work in one place while making it irrelevant in another. Relevant
theories to this study are hereby reviewed with the aim of helping the researcher get a
better understanding of the customer service strategies as propounded by other
researchers in the field of study.
2.2.1 Relationship Commitment Model
Sharma and Patterson (1999) provided a model showing the determinants of
relationship commitment. The model consists of three factors such as
communication effectiveness, technical quality and functional quality, all affected
by trust in the relationship which in turns affect relationship commitment.
Trust is defined by the authors as the belief that the service provider can be relied
on to behave in such a way that the long-term interests of the buyer will be served
(Sharma & Patterson,1999). This implies reliance on, or confidence in, the
process or person. Hence, the greater is the level of trust, the stronger is the
relationship commitment. The factor of trust was also looked at by (Morgan &
Hunt, 1994) who argues that trust has a positive relation to the extent through
which the firms share similar values.
Quality service according to Sharma and Patterson (1999) is divided into two main
components: technical quality and functional quality. Technical quality is related to
the actual outcomes or the core service as perceived by the client. Here, the

9
competency of the professionals in achieving the best return on investment for their
client at acceptable levels of risks is viewed. Technical quality is relevant to the
promised service. Functional quality on the other hand is rather than concerned with
“what” is delivered, deals with “how” the service is delivered. It is concerned with the
interaction between the service provider and service receiver, and is assessed in a
highly subjective manner. The authors further argue that trust had a great impact on
how quality is delivered, both in terms of functional- and technical quality.
Consequently, it is argued that the greater the perceived technical quality, the stronger
is the trust in the relationship, and the greater the perceived quality of the advisor, the
stronger is the level of trust in the relationship. Additionally, the greater the quality is
perceived, the stronger is the relationship commitment. (Sharma & Patterson, 1999)
Effective communication is referred to the formal as well as the informal sharing of
meaningful and timely information between a client and an advisor in an empathetic
manner. The purpose of such is to educate and keep clients informed about their
investments in a language that they can understand. Strong communication skills are
required to ensure that clients understand investments and thus become more
confident in their ability to assess financial risks and outcomes. Effective
communications also help customers through the unavoidable ups and downs of
variable investment performances. Consequently, the greater is the communication
effectiveness, the stronger is the relationship commitment (Sharma & Patterson,
1999).
2.2.2. A Holistic Approach to Satisfaction, Trust and Switching Barriers
Ranaweera and Prabhu (2003) drafted a holistic approach that examines the combined
effects of satisfaction, trust and switching barriers on customer retention. The authors
here define customer retention as the propensity for customers to stay with their
services providers. The framework provided has two functions; its first function is to
examine the main effects of the three variables on customer retention independently
and its second function is to examine the interaction effects that trust and switching
barriers has on customer retention in the presence of satisfaction.
Customer satisfaction is conceptualized by the authors as the evaluation of an emotion
and proclaims that the higher is the satisfaction, the higher is the level of retention

10
(Ranaweera & Prabhu,2003). Fornell (1992),indicated that the more satisfied a firm‟s
customers are, the more they remain loyal to the firm. Hence, firms have devoted lots
of efforts on managing and increasing customer satisfaction (Ranaweera & Prabhu,
2003). Satisfied customers are perceived as indispensable means of creating
sustainable advantages in competitive environments (Patterson, Johnson, & Spreng,
1997). The authors further refer to Anderson and Sullivan (1993) who stated the
following: “Investing in customer satisfaction is like taking out an insurance policy. If
some hardship temporarily befalls the firm, customers will be more likely to remain
loyal”.
Patterson et al. (1997) further look at customer dissatisfaction as the difference
between an individual‟s pre-purchase expectations and post-purchase performance of
the product or service. Ranaweera and Neely(2003) stated that it has been common
earlier for research on service quality to be focused on measures of customer
satisfaction. However today, mere satisfaction does not ensure customer retention and
therefore, the focus in recent research has somewhat shifted from studying drivers of
customer satisfaction to examining drivers of customer behaviors such as repurchase
habits (ibid). Although customer satisfaction is a good base to start with when
retaining customers, it is not the only influencing factor. Richards (1996) argues that
some customers even though they are satisfied will leave the firm while others who
are dissatisfied will remain.
Trust is conceptualized as existing when one party has confidence in the other party‟s
reliability and integrity. The authors argue in the article that several studies have
recognized that even though firms manage to properly satisfy their customers, they
may be unable to retain them. Hence, satisfaction alone is inadequate to ensure long-
term customer commitment to a single provider. Due to costs related to the
termination of the relationship, once trust has been built, the probability of each party
ending the relationship decreases (Ranaweera & Prabhu, 2003).
Gounaris(2003) argues that trust is a vital element in any type of relationship. The
more a customer trusts a supplier, the higher is the perceived value of the relationship.
Consequently, the greater the chances that the customer remains in the relationship
will be. Furthermore, trust is an important factor in the perceived quality of services,

11
especially in business to business services. Trust is developed successively as a result
of gradual dependence on the relationship resulting from mutual adaptation to the
other party‟s needs.
The perceived switching barriers are conceptualized as the consumers‟ evaluation of
the resources and opportunities needed to perform the act of switching as well as the
constraints preventing it (Ranaweera & Prabhu, 2003). Hence, the authors argue that
the higher the level of perceived cost is, the higher is the probability for the customer
to remain. The factor of switching or termination costs is also identified by Morgan
and Hunt (1994) as contributing to the maintaining of relationships. However, the
authors view switching costs as being only of economical nature. Sharma and
Patterson (2000), discuss of switching cost as being in addition of economical nature,
of both psychological and emotional nature. The authors further present a few
examples of switching costs such as social bonds, personal rapport and trust which
have been built over time. The authors argue that switching costs may act as a present
psychological exit barrier even when performance of the core service is less than
satisfactory. Other exit barriers proposed by the authors are the difficulties in
evaluating professional services, that clients cannot evaluate the service before
purchasing it.
2.2.3 Conversion Model
The conversion model is based on the fact that it is not enough to satisfy customers as
satisfaction alone does not predict customer behavior. Satisfied customers will leave,
dissatisfied customers will remain and therefore, rather than discussing customer
satisfaction, firm should discuss customer commitment (Richards, 1996). Further, the
author agrees that customer satisfaction helps to make the customers committed,
however the building of committed customers involves more than merely satisfying
them. Other than customer satisfaction, he identified three factors as drivers of
commitment.
The first factor is the level of involvement in the brand and the category. The more
people are involved in a given choice, the more carefully they will choose and once
they have made their choices they often stick to it. Hence, if the customer is
dissatisfied but involved, his primary strategy will be to try and repair the relationship

12
rather than seeking other alternatives. If the customers are both dissatisfied and
uninvolved, they would not even care about fixing the relationship but simply switch
providers. Involvement creates a willingness to tolerate dissatisfaction (Richards,
1996). Consumers‟ involvement in the buyer-seller interchange integrates several
subsets such as customer control, customer participation and level of contact. The
more a customer is involved, the more he/she has confidence in the service provider
and also in the outcomes (Beckett, Hewer, & Howcroft, 2000).
The second factor is the attraction of the alternatives. One of the arguments of
Richards (1996) is that the more the alternatives attract, the more dissatisfied
customers will converse, meaning switch service provider. If the alternatives available
are not considered as being “good” conversion may then be delayed in spite of
dissatisfaction. On the other hand, if the alternatives attract, customers may converse
even though they are highly satisfied. Sharma and Patterson (2000) state that when
customers are not aware of the available substitutes or competing alternatives they
may continue in a service relationship even though it is a less satisfactory one.
Patterson and Smith(2000) in their study conclude that when customers are aware of,
and perceive other suppliers as offering a differentiated service in terms of price,
service and/or quality of technical outcomes, they tend to be less committed to one
supplier.
The third factor is the extent of ambivalence meaning insecurity caused by the range
of choices. The author argues in his article that the advantages respectively the
disadvantage of each alternative should be compared and reviewed. Being in a state of
ambivalence according to the author is when the customers are in a state in which
they will wave whether to stay or leave. Ambivalence makes the customers less
committed, although conversion is delayed as neither choice offer obvious advantages
(Richards, 1996).
2.2.4 A Holistic Approach to Quality, Price, Indifference and Inertia
Ranaweera and Neely (2003), drafted a holistic approach to customer retention
incorporating service quality perceptions, price perceptions, customer indifference,
and inertia.

13
Several studies have shown that there is a direct positive link between perceived
service quality and customer repurchasing intentions (Ranaweera & Neely, 2003,
Reichheld, (1996); and Zeithalm, 1988). When defining service quality, Ranaweera
and Neely (2003) follows the definition of Zeithalm (1988) that service quality is a
consumer‟s appraisal of a service‟s overall excellence or superiority. The authors
further conclude that service customers may place a greater importance on the quality
of the service rather than on the cost of acquiring that service.
Ranaweera and Neely (2003) hold the hypothesis that the better the perceived price is,
the greater is the level of repurchase intentions. However, little research has been
conducted on the correlation between price perceptions and customer retention and
therefore, they argue that future research is needed in the area. In their study, they
found that there was a direct relation between price perceptions and customer
behavioral intentions. They further argue that the higher the level of inertia is, the
greater is the level of repurchase intentions. Their definition of inertia is based as the
one of Huang & Yu(1999), a non-conscious form of retention. Huang and Yu (1999)
make a distinction between inertia and loyalty by the level of consciousness involved
in the decision to continue to purchase from the same provider. Therefore, they argue
that consumer research should not be limited in researching conscious decisions but
also non-conscious ones or involuntary customer relationships. The greater the
degrees of inertia, the more likely the customers are to be sensitive to promotions or
similar attempts by competitors to attract them(Gupta, Chintagunta, Kaul, & Wittnik,
1996).
Finally, the authors propose that the higher the level of customer indifference, the
greater is the level of repurchase intentions. Ranaweera and Neely (2003) argue that
those who have positive perceptions of the service and also show a certain level of
indifference, are the least likely to leave as their service expectations are fulfilled, and
at the same time, they see no gains from switching. The authors further state that
literature on measuring customer indifference is rather scarce and has sometimes been
used in the marketing literature in relation to consumer‟s attitude towards advertising,
described as neither positive nor negative.

14
2.2.5 The three level of Retention Strategies
Framework for understanding types of retention strategies created by Zeithalm
and Bitner (1996)is presented below. As can be viewed in Figure 2.1, the
framework displays three levels and each successive level ties the customer a bit
closer to the firm. Furthermore, at each level, greater level of customization of the
services is required.
Level
Types of bond(s)
Marketing Orientation
Degree of
service
customization
Primary
marketing
mix Element
Potential for
sustained
competitive
differentiation
1
Financial
Customer
Low
Price
Low
2
Financial & Social
Client
Medium
Personal communications
Medium
3
Financial, Social & structural
Client
Medium to High
Service delivery
High
Figure 2.1: Three levels of retention Strategies
Source: Zeithalm & Bitner (1996)
Level 1
At this level the customer‟s primary tie to the firm is through financial incentive
and this can be for instance customers wanting lower prices for high amount
purchases or lower prices for those customers who have been with the firm for a
longer time. One example provided in the book is the frequent flyers aiming at
providing financial incentives and rewards for those customers who bring more of
their business to a particular airline. One reason why firms employ these
measures is because they are rather inexpensive and they enable the firm to
achieve short-term gains. However, such incentives generally do not provide
long-term advantages to firms and the authors argue that although price and other
financial incentives are usually important to customers, they are not that hard for
competitors to imitate as the only customized part of the marketing mix is the
price (Zeithalm & Bitner, 1996).

15
Level 2
Strategies at this level, ties the customers to the firm through both financial and
social incentives. Here, the customers are perceived as clients meaning that they
are individuals whose needs and want, the firm tries to understand. The services
provided by the firm are customized and marketers here find ways to stay in
touch with their customers, hence developing social bonds with them. Further,
the authors argue that social bonds are especially important and common among
professional service providers and their clients as well as personal care providers
(Zeithalm&Bitner,1996).
Moreover, technology can help in creating social bonds, technologies such as for
instance personalized customer information systems which are updated
regularly. This will be viewed in more details later in this chapter. The authors
continue to argue that relationships among the customers of a firm are important
overtime and they keep them from switching to another provider. It is not
guaranteed that social bonds will tie the customer permanently to a firm,
however it creates difficulties for competitors to imitate than are financial
incentives alone. Also, when customers do not have strong incentives to shift to
another provider, it is the social bonds that can encourage customers to stay.
(Zeithalm & Bitner, 1996)
Level 3
Strategies employed by firms which are at this level, are the most difficult to
imitate. Other than financial and social bonds, it also includes structural bonds
which are created by providing services that are highly customized and
frequently designed right into the service delivery system for that client. By
tying into one of the systems of a customer, the firm may save time as well as
keeping a better track of the customer; however, customers may have the fear
that tying them too much to one provider will lead to them missing other
opportunities and advantages from other providers in the future (Zeithalm &
Bitner, 1996).

16
2.2.6 Service Quality Model (SERVQUAL)
Quality is a multi-dimensional observable fact. Thus, reaching the service quality
without distinguishing the important aspects of quality is impossible. In his discussion
of service quality, Grönroos (2004) refers to three dimensions of output technical
quality, service performance quality, and organization‟s mental picture. Although
these attempts have had a major role in division of service quality into process quality
and output quality, they lack enough details.
Service quality has become an important research topic because of its apparent
relationship to costs, profitability, customer satisfaction, customer retention and
positive word of mouth (Boulding et al., 1993). Initially, SERVQUAL formulated by
Parasuraman, Zeithaml and Berry(1985) highlighted ten various components. Later,
these ten components were collapsed into five different dimensions of Reliability,
Responsiveness, Assurance, Empathy and Tangibility as a basis for making a tool for
testing the service quality. However, SERVQUAL‟s five dimensions (Reliability,
Responsiveness, Assurance, Empathy and Tangibility) are not universal hence the
model fails to draw on established economic, statistical and psychological theory
(Buttle, 1996). The fact that SERVQUAL has critics does not render the measuring
tool moot. Rather, the criticism received concerning SERVQUAL measuring tool may
have more to do with how researchers use the tool.
According to Nyeck, Morales, Ladhari, and Pons (2002), the SERVQUAL measuring
tool remains as the most complete attempt to conceptualize and measure service
quality. Other researchers have proved that SERVQUAL model by Parasuraman is the
best measure of service quality in the service industry. Incidentally, the SERVQUAL
measuring tool‟s main benefit is its ability that allows researchers to examine
numerous service industries such as; healthcare, banking, financial services, and
education.
2.2.6.1 Dimensions of Service Quality
Parasuraman et al. (1985) established a model based on dimensions of service quality
that customers use to assess the service. There are ten potentially overlapping
dimensions namely, Assurance, Reliability, Tangibles, Empathy, Responsiveness
Customer Satisfaction and Retention Courtesy, Understanding/Knowing the

17
Customer, Responsiveness, Communication, Credibility, Security, Competence and
Access. However, Parasuraman et al. (1988), revised the SERVQUAL model items
into twenty-one item scale that are covered in five (5) dimensions that customers can
receive from specific servicing company. These include the following:
Tangibles-Those things which have a physical existence and can be seen and
touched. In context of service quality, tangibles can be referred to as Information and
Communications Technology (ICT) equipment, physical facilities and their
appearance; ambience, lighting, air conditioning, seating arrangement, materials
associated to the service (credit and debit sheets, cheque books etc), decorations; and
lastly but not least, the services providing personnel of the organization (Blery et al.,
2009). These tangibles are deployed, in random integration, by any organization to
render services to its customers who in turn assess the quality and usability of these
tangibles.
Reliability-According to Parasuraman et al. (1988) reliability is how the service
provider is able to provide service to a customer as promised, dependable in handling
customers‟ service problems, performs service right the first time, provide service at
promised time and keep customers informed about when services will be performed.
Reliability means the ability of a service provider to provide the committed services
truthfully and consistently (Blery, et al., 2009). Customers want trustable services on
which they can rely.
Assurance -Assurance is developed by the level of knowledge and courtesy displayed
by the employees in rendering the services and their ability to instill trust and
confidence in the customer (Blery et al., 2009). This aspect of service quality shows
how knowledgeable employees are able to render quality service to customers. Thus,
the ability of employees to instill confidence in customers, making them feel safe in
their transactions, consistently courteous towards customers, the ability to answer
customer questions appropriately.
Empathy-Empathy means taking care of the customers by giving attention at
individual level to them (Blery et al., 2009). It involves giving ears to their problems
and effectively addressing their concerns and demands. It is the firm‟s ability to

18
render customer individual attention, deal with customers in a caring fashion, have the
customers‟ best interest at heart and understand the needs of their customers.
Commenting on this Parasuraman et al (1988), said that customers want to feel
understood and important to the service providers‟ firm.
Responsiveness-According to Parasuraman et al (1988), this represents the ability,
readiness and willingness of staff to provide prompt service to customers within the
shortest possible time. Customers in general expect prompt responds to their request
immediately, as they do not want to be kept waiting.
2.3 Empirical Review
2.3.1 Customer Loyalty
Heskett, Jones, Loveman, Sasser and Schlesinger(1994), suggested that customer
loyalty motivates customers for repeat purchases and persuade them to refer those
products or services to others. Duffy(2003) proposed that customer loyalty is a feeling
of association which a customer has towards a brand. This feeling incites customer for
acquiring a good or service repeatedly. Subsequently this generates sizeable and better
financial outcomes for the firm. Customer loyalty is formed under the six assumptions
namely: It is a function of psychological processes, bias (which is random), decision
making unit, alternative brands, behavioral response (the final purchase); and is
expressed over time (post-purchase behavior).
Generally, every insurance company aims at earning profits, expanding its business
by offering more diversified products or services over time and capturing a larger
market share progressively. Customer loyalty can favorably contribute towards this
basic aim of the firms (Hayes, 2008). It is an effective tool for generating repeat sales
from the customers (Chu, 2009). Furthermore these loyal customers can serve as
effective elements in the marketing mechanism when they refer their Insurance
Company to more people. In this way these existing customers contribute towards
increasing their respective insurance Company‟s customer base and market share. The
financial base of any Insurance company is largely dependent on this phenomenon

19
2.3.2 Quality Service Strategy
Services are a continuous process of on-going interactions between customers and
service providers comprising a number of intangible activities provided as premium
solutions to the problems of customers and including the physical and financial
resources and any other useful elements of the system involved in providing these
services (Grönroos, 2004).
Premium service quality is a key to gain a competitive advantage in services industry.
The satisfaction level of customers is dependent on their perception of service quality
and the trust in service provider (Ismail, Haron, Ibrahim, & Isa2006; Aydin & Özer,
2005; and Parasuraman, Zeithaml, & Berry, 1988). By providing better quality
services to customers, a firm revives the perception of customers about quality of
services.
Particularly in the Insurance industry, premium service quality plays a pivotal role for
customers in evaluating the performance of a service provider and is the key to gain
customer satisfaction and customer loyalty. An insurance firm can gain competitive
advantage and build long term relationship with its customers by providing premium
quality services. Several evidences found in literature establish that there is a
significant correlation between service quality and customer satisfaction
(Sureshchandar, Rajendran, & Anantharaman, (2002); Boulding, Kalra, Staelin, &
Zeithaml (1993); and Bitner (1990). Also,(Spreng, 1996) provided evidence of the
significant correlation between service quality and customer loyalty.
Boahene and Agyapong (2011), in analyzing the antecedents of customer loyalty in
Ghana, concluded, that firm‟s management needs to emphasize quality. They
emphasized, that because service firms do not provide tangible products, their service
is usually assessed through measures of the service provider‟s relationship with
customers. Service quality was found in the study to correlate positively and
significantly with customer loyalty.
A strong relationship between customer loyalty and service quality has been
confirmed by many researchers (Bloemer, De Ruyter, & Peeters, (1999); Oliva,
Oliver, & MacMillan, (1992).Evidences of strong and direct relationship between

20
customer loyalty and service quality have also been given by Heskett et al. (1994).
While Bloemer et al. (1999) have stated that service quality results in customer
loyalty; whereas if level of customers‟ satisfaction tends to be relatively high, it may
also act as a vital promoter of customer loyalty. However in today‟s highly dynamic
and competitive environment attaining higher levels of customer satisfaction and
customer loyalty, especially in the services sector, may be a tough task for many
organizations. Also notably many researchers have proved willingness to recommend
and repurchase intention as dimensions of the customer loyalty. Further they found
that service quality has a strong positive impact on these dimensions of customer
loyalty (Ehigie, 2006; Bloemer et al., 1999).
In a study carried out in Malaysian banking sector to investigate the relationship
between service quality and customer loyalty, Sureshchandar, Rajendran, &
Anantharaman, (2003); and Brown and Mitchell, (1992) found that reliability is the
strongest dimension of service quality. It was established by Bitner (1990) that
customer loyalty is much strongly impacted by assurance than any other dimension of
service quality. Later on customer loyalty improves level of customers‟ satisfaction.
In services industry, particularly in the insurance sector, due to presence of tough
competition, the customer-base of loyal customer may not be broadened without
giving individual care and attention to customers (Jabnoun& Al-Tamimi, 2003). A
broader customer base of loyal customers may be won if the services delivery staff is
strongly committed to providing premium quality services as well as is able to
effectively handle conflicts in a timely manner (Malhotra, Ulgado, Agarwal,
Shainesh, & Wu, 2005; Ndubisi & Wah, 2005).
Empathy is crucial because if organization provides extra attention to their customer
there will be chances that customers will feel more satisfied and become loyal to the
organization. Empathy is about the personal attention, extra care and better
understanding toward customers. And showing them they are special and important
by showing kindness, affection and looking them as close friends to make them feel
special. Empathy is all about entertaining the customers in terms of place, better
communication and time.

21
Researchers have proved that most people are influenced by this dimension of service
quality. In empathy employees give attention and extra care to their customers that
can increase the quality of services and make customers feel special. This increases
customer loyalty and customer satisfaction. To satisfy the customers‟ needs,
management should improve service quality through empathy. Organizations must
pay attention to the customer objections (Betty, 2011). Some studies have proposed
that empathy and customer satisfaction have no positive relationship, because
majority of users like advance facilities in the insurance companies. But sometime it
is important to customers that the employees of the organization pay special attention
and extra care when they deal with them.
So far as Empathy is still vital element of service quality so financial institutes should
sustain and improve the empathy (Munusamy, Chelliah & Mun., 2010). Temporarily
empathy has been found to have an important but inverse influence on customer
satisfaction. Some researchers said that the level of empathy should be good because
customers want staff of the organizations to give individual attention to them during
working time.
Responsiveness has been considered as an important factor. Determination to enhance
speed of processing information and a customer is assumed to have a positive
influence on customer satisfaction in the insurance company. Balunywa (1995),
stresses that when a customer has a demand, meet it, be easily offered and available to
customer. Customers in general support immediate response to their demands,
because they do not want to wait for long time (Ruby et al., 2012). If an insurance
company fails to provide service to a customer at certain time, it can recover this
failure by providing prompt services in professional way (Adeoye & Lawanson,
2012). Responsiveness relates to performance criterions and can be treated as process
quality.
Considering the insurance sector, this service quality dimension is very important for
consumers as they do not want to face trouble with their business matters. They want
to acquire services free of blunders, performed according to criterions, correctly,
quickly and within time (Culiberg & Rojsek, 2010.). Propensity and readiness of
insurance companies to help their customers and satisfy their demands, instantly reply

22
to their criticisms, and quickly solve their problems (Mohammad & Alhamadani,
2011).Once the customer has assurance about the quality dimensions of the product
and responsiveness of the employees of an institute; the chances of a customer
becoming a loyal and committed customer increases (Ree & Van, 2010).
Previous data suggests that responsiveness has association but no significant impact
on customer satisfaction. We can determine that there should be responsiveness in
providing quality service, but it is not compulsory. Human responsiveness can
sometimes have emotional and sentimental effects causing reduction in productivity.
These are the different perceptions of insurance company‟s customers about dealing
with machines or employees (Munusamy et al., 2010).
2.3.3 Service Bay Ambience Strategy
It was established by Jabnoun and Al-Tamimi, (2003) that institutions with better
ambience enhance customer loyalty in a better way. Association between service
quality and customer loyalty in service sector of Sweden is also examined by
(Zineldin, 2005). The fact that insurance companies may create a strong and long-
term relationship with their customers by combining tangible and intangible attributes
of premium quality in products and services they provide, was also true in this case.
Customers expect up-to-date equipment, attractive printed material, well arranged
interior and properly dressed employees (Culiberg & Rojsek, 2010). A study by
Saghier and Nathan (2013) showed that the relationship between tangibles and
customer satisfaction was not significant enough. They found that infrastructure
facilities are not important enough to say that they are a must in providing good
service, but required in delivering good quality of service. This was not in line with
the study by Nabi, (2012) which he concluded that customers preferred an insurance
company with convenient location. While a Company using modern technology for its
operations and having well organized waiting cues will be of less importance insight
of customers comparatively, though tangible dimension had been proved in the study
carried out by Munusamy et al, (2010) to have a significant relationship with
customer satisfaction.

23
Brady and Cronin (2001) found that consumers react not only to products, but also to
the features that accompany the product. They asserted that consumers not only make
their purchase decision and respond to more than simply the tangible product or
service being offered but respond to the total product. One of the most significant
features of the total product is the place where it is bought or delivered. Atmospherics
relates to the effort to design buying environments to produce specific emotional
effects in the buyer that enhance his purchase probability. In some cases, the place,
more specifically the atmosphere of the place, is more influential than the product
itself in the purchase decision. In some cases, the atmosphere is the primary product.
They called this “atmospherics” or “the effort to design buying environments to
produce specific emotional effects in the buyer which enhance his purchase
probability.”
Hirschman and Holbrook (1982) reached a similar conclusion on the importance of
ambient conditions, finding that sensory input associated with a product led to
emotional arousal and caused consumers to recall the product or the events
surrounding their interaction with the product or to imagine a sequence of future
events. In some cases, this sensory input was recalled more clearly than was the
product itself and the emotions triggered were of greater importance than the utility of
the product in customers‟ ultimate choice of products. Atmospheric clues affect
consumer moods and emotions which, in turn, affect purchase behavior and response
to products (Jiang & Wang, 2006).
2.3.4 Technology Support Strategy
In acceptation of technology, it is assumed that subjective beliefs and ease of use are
always the main determinants of the decision for using that technology. (Yaghoobi &
Shakeri, 2008)in their study on comparative analysis of technology acceptance model
with emphasis on the adoption of Internet banking found out that that ease of use
represented the respondents' coping abilities and skills needed for using the system.
According to accepting technology model, the use of information technology is
specified by the willingness to use the specific system and the willingness to use is
determined by the usefulness of the technology from consumer perspective and ease
of use of the system (Mahmoodi, Forozandeh, & Ahmadi, 2009).

24
Navigation, product information, and site design are critical to e-satisfaction
(Szymanski & Hise 2000). Thus, a key to building a usable Website is to create good
links and navigation mechanisms (Mannix (1999); Radosevich (1997). An advantage
of the ICT is its capacity to support interactivity for users (Palmer 2002), and online
consumers are influenced by the interactivity of the Website (Alba et al. (1997);
Jarvenpaa & Todd (1997). Fast, interactive, uncluttered, and easy-to-navigate sites
with quality searching capabilities should be perceived more favorably by consumers.
The features evaluated within the attribute of usability and site design are: providing a
user-friendly interface, an interactive site, and possessing adequate searching
capabilities.
2.4 Reasons for Customer retention
There are sound financial reasons for the growing popularity of relationship
marketing. Research has shown that the cost of attracting a new customer is estimated
to be five times the cost of keeping a current customer happy. This is because the
expense of acquiring customers is incurred only in the beginning stages of the
commercial relationship (Reichheld & Kenny, 1990). In addition, longer-term
customers buy more and, if satisfied, may generate positive word-of-mouth promotion
for the company. Additionally, long-term customers also take less of the company‟s
time and are less sensitive to price changes. These findings highlight the opportunity
for management to acquire referral business, as it is often of superior quality and
inexpensive to obtain. Thus, it is believed that reducing customer defections by as
little as five percent can double the profits (Healy, 1999).
The key factors influencing customers‟ selection of a company include the range of
services, rates, fees and prices charged (Abratt & Russell, 1999).It is apparent that
superior service alone is not sufficient to satisfy customers. Prices are essential, if not
more important than service and relationship quality. Furthermore, service excellence,
meeting client needs, and providing innovative products are essential to succeed in the
service industry. Most institutions claim that creating and maintaining customer
relationships are important to them and they are aware of the positive values that
relationships provide (Colgate, Stewart, & Kinsella, 1996).

25
2.5 Conceptual Framework
The conceptual framework shows the relationship between the dependent and
independent variables. The independent variables are the quality service, service bay
ambience and technology support. It is expected that the independent variables will
influence the one dependent variable being customer loyalty.
Independent Variable Dependent
Variable
Moderating Variables
Figure 2.2: Conceptual framework showing the relationship between
independent variables and dependent variable.
Quality Service Strategy
Reliability
Responsiveness
Assurance
Empathy
Handling hours
Service Bay Ambience
Strategy
Equipment
Sitting Area Facilities
Communication
Materials
Personnel
Noise
Lighting
Seating arrangement
Air conditioning
Decorations
Customer Loyalty
Willingness to
recommend others
Repurchase intention
Intention to stay
Identification with
Organization brand
New government Policies
Insurance Regulatory Authority
Association of Kenya Insurers
Technology Support Strategy
Data Management
Social media
Mobile transactions
Time saving
Ease of use

26
CHAPTER THREE
RESEARCH METHODOLOGY
3.1Introduction
This chapter elaborates on the methodological procedures adopted in data collection
and analysis. Areas also covered and discussed are: the research design, the target
population of study, the location of the study, the sampling procedure and sample
size, the data collection instruments and procedure, validity and reliability of research
instrument and finally data analysis methods and presentation of findings in the study.
3.2Research Design
The descriptive survey design was adopted given the nature of the study. As
Kerlinger, (1973) pointed out, survey is the best research design for obtaining social
facts, beliefs and attitudes for both large and small populations to discover relative
distribution and interrelation of sociological and psychological variables. Open and
closed ended questionnaires were used as the main tool for data collection. This is
because it is an efficient method of collecting data involving characteristic of sample
of a population, current practices, conditions or needs (Chandran, 2004).The
experiences and opinions of the respondents gathered from the interviews provided
informed inputs to the data in this study.
3.3 Target Population
According to Babbie (2002), target population refers to the entire group of people,
events, or things of interest that the researcher wishes to investigate. Given that this
study was descriptive in nature adopting case study design, it involved all the 15,487
CIC insurance customers in Nakuru County.
3.4 Sampling Procedure and Sampling Technique
According to Kerlinger (1973) Sampling entails taking a portion of a population as
representative of that population. In this study, sample size was calculated using the
formula propounded by Nassiuma, (2000).
𝑛 =𝑁𝐶2
𝐶2+(𝑁−1)𝑒2.…………………………. (1)
Where n = sample size, N= population size C = Coefficient of variance, e=standard
error of stratified sampling.
27
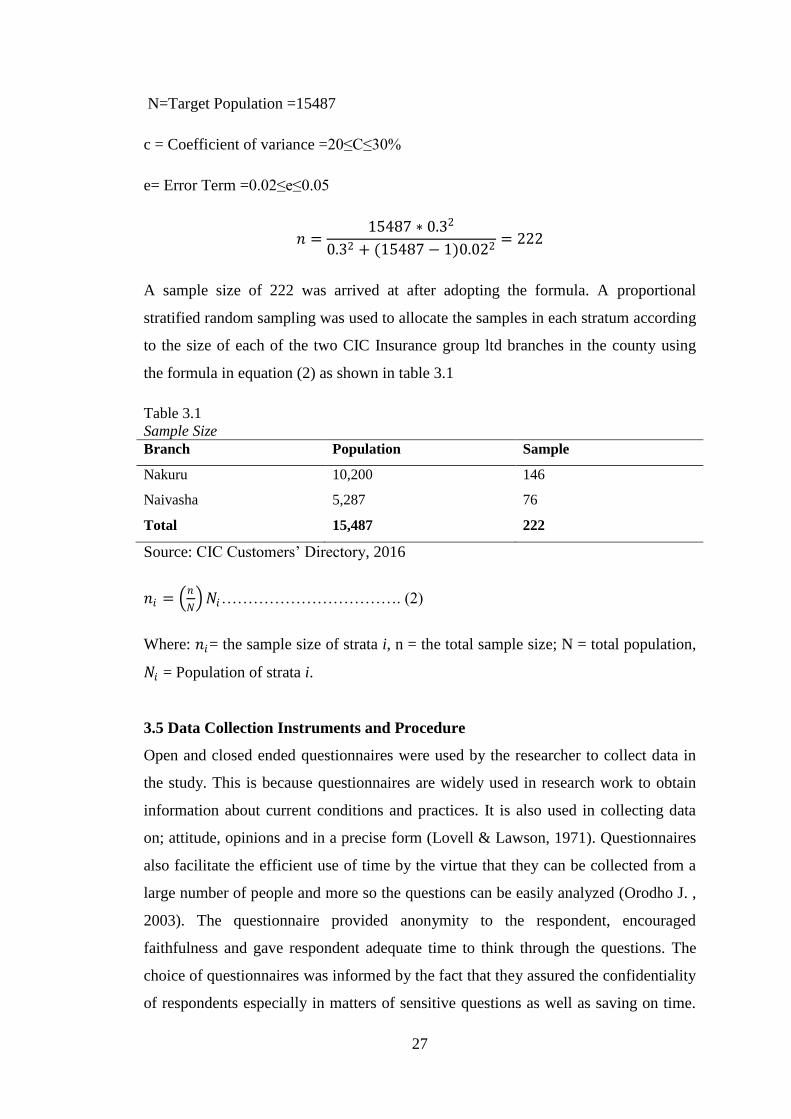
N=Target Population =15487
c = Coefficient of variance =20≤C≤30%
e= Error Term =0.02≤e≤0.05
𝑛 =15487 ∗ 0.32
0.32 + (15487 − 1)0.022= 222
A sample size of 222 was arrived at after adopting the formula. A proportional
stratified random sampling was used to allocate the samples in each stratum according
to the size of each of the two CIC Insurance group ltd branches in the county using
the formula in equation (2) as shown in table 3.1
Table 3.1
Sample Size
Branch Population Sample
Nakuru 10,200 146
Naivasha 5,287 76
Total 15,487 222
Source: CIC Customers‟ Directory, 2016
𝑛𝑖 = 𝑛
𝑁 𝑁𝑖……………………………. (2)
Where: 𝑛𝑖= the sample size of strata i, n = the total sample size; N = total population,
𝑁𝑖 = Population of strata i.
3.5 Data Collection Instruments and Procedure
Open and closed ended questionnaires were used by the researcher to collect data in
the study. This is because questionnaires are widely used in research work to obtain
information about current conditions and practices. It is also used in collecting data
on; attitude, opinions and in a precise form (Lovell & Lawson, 1971). Questionnaires
also facilitate the efficient use of time by the virtue that they can be collected from a
large number of people and more so the questions can be easily analyzed (Orodho J. ,
2003). The questionnaire provided anonymity to the respondent, encouraged
faithfulness and gave respondent adequate time to think through the questions. The
choice of questionnaires was informed by the fact that they assured the confidentiality
of respondents especially in matters of sensitive questions as well as saving on time.
28
The self-administration method was mainly adopted in the administration of the
questionnaires during the study.
3.6 Validity and Reliability of Research Instrument
According to Gray (2004), Validity is the degree to which data in a research is
accurate and credible while reliability is the degree to which an instrument will
produce similar results at different periods. A pilot study was conducted by the
researcher through administration of the questionnaire to a few respondents in the two
CIC Insurance branches. The number of respondents represented a substantial
population that helped to verify the usefulness of the data collection instruments
employed in the study. Subsequently, the questionnaire was reviewed and revised
through which the leading and redundant questions were phased out. These questions
were also replaced with more relevant and logical ones that helped to capture the
required responses for the study. A reliability coefficient of 0.7 or over was assumed
to reflect the internal reliability of the instruments. The instruments gave a
Cronbach‟s coefficient alpha value of 0.81 implying it was above the recommended
value and therefore suitable for administration.
3.7 Data Analysis Method and Presentation of Findings
To enable the researcher describe and examine the relationship between variables,
descriptive and inferential statistics were employed in the data analysis. The
descriptive statistics employed included, frequencies, percentages and a chi-square
test. The results from the descriptive statistic were presented by use of tables.
Pearson‟s Correlation on the other hand was used to show the direction and strength
of the relationship between customer service strategies and customer loyalty while
regression analysis helped to determine the degree in which the independent variables
(quality service, service bay ambience and technology) could explain the change in
customer loyalty. The regression equation given below:
𝑌 = 𝛽0 + 𝛽1𝑋1 + 𝛽2𝑋2 + 𝛽3𝑋3 + 𝜀
Where Y= Weights from customer loyalty, 𝑋1= Weights from quality service,
𝑋2=Weights from service bay ambience and 𝑋3= Weights from technology use, while
β0, β1, β2 and β3 are the coefficients and ε being error term.

29
3.8 Ethical Measures
Throughout the conduct of this study, the principle of voluntary participation by
respondents was observed and the data was collected with the informed consent of all
the participants. Furthermore, the privacy and confidentiality of participants has been
assured and information sought has not been made available to anyone who is not
directly involved in the study. The principal of anonymity has also been guaranteed
by keeping the participants anonymous throughout the study.

30
CHAPTER FOUR
DATA ANALYSIS, INTERPRETATIONS AND DISCUSSIONS
4.1 Introduction
The chapter consists of the presentations of the analyzed findings, their interpretation
and discussions. The results are presented as tested in accordance to the objectives of
the study. It begins with cross tabulation presentations of the demographic
characteristics of the respondents which include: age, educational level, tenure and
gender. The descriptive statistics for the study findings are presented by usechi-square
for each item to define the relative opinion of the respondents pertaining to that
particular item. Finally, the results from the correlations and the regression analysis
results are presented too.
4.1.1 Response Rate
Table 4.1
Response Rate of the Respondents
No. of questionnaires
Returned
No. of respondents
targeted
Response Rate (%)
162 222 73
Source: Research Data, 2016.
A total of 222 questionnaires were administered directly by the researcher. Among the
administered questionnaires, only 162 were returned resulting in a response rate of
73%, which is an acceptable proportion.
4.2 General Characteristic of the Respondents
Cross tabulations and frequency distributions were used to indicate variations of
respondents based on age, gender, tenure and length of service. Descriptive statistics
were helpful in illustrating the characteristics of the respondents and nature of the data
in tandem with the study objectives.

31
4.2.1 Gender by Marital Status of the Respondents
Findings related to the marital status of the respondents by gender are presented on
Table 4.2
Table 4.2
Gender of the Respondents by Marital Status
Source: Research Data, 2016.
According the results in table 4.2, we find that 51.2% of the respondents were married
while 29 % were single. Among the Married, female respondents represented 42.2%
while the male counterparts represented 62.5%. This implies that the marriage
institution is still held in high regards by most Kenyans and the reason for taking up
insurance cover could be due to the fact that they are seeking assurance and security
for their families.
4.2.2 Age of the respondent in years
Table 4.3
Age of the Respondent in Years
N Minimum Maximum Mean Std. Deviation
Age of the
Respondent
162 19.00 60.00 36.5247 9.44300
Valid N (list wise) 162
Source: Research Data, 2016.
The findings of the study displayed in Table 4.3, shows that the average age of the
respondents is 37 years with the youngest and the eldest being 19 years and 60 years
old respectively. This implies that the customers who have since taken up insurance
cover with the firm are adults aged 18 and above, implying that they are mature
Gender of the respondent Marital Status of the respondent Total
Single Married Separated Divorced Widowed Widow
Male Frequency 16 45 4 2 4 1 72
Percentage (%) 9.9 27.8 2.5 1.2 2.5 0.6 44.4
Female Frequency 31 38 10 5 1 5 90
Percentage (%) 19.1 23.5 6.2 3.1 0.6 3.1 55.6
Total Frequency 47 83 14 7 5 6 162
Percentage (%) 29.0 51.2 8.6 4.3 3.1 3.7 100
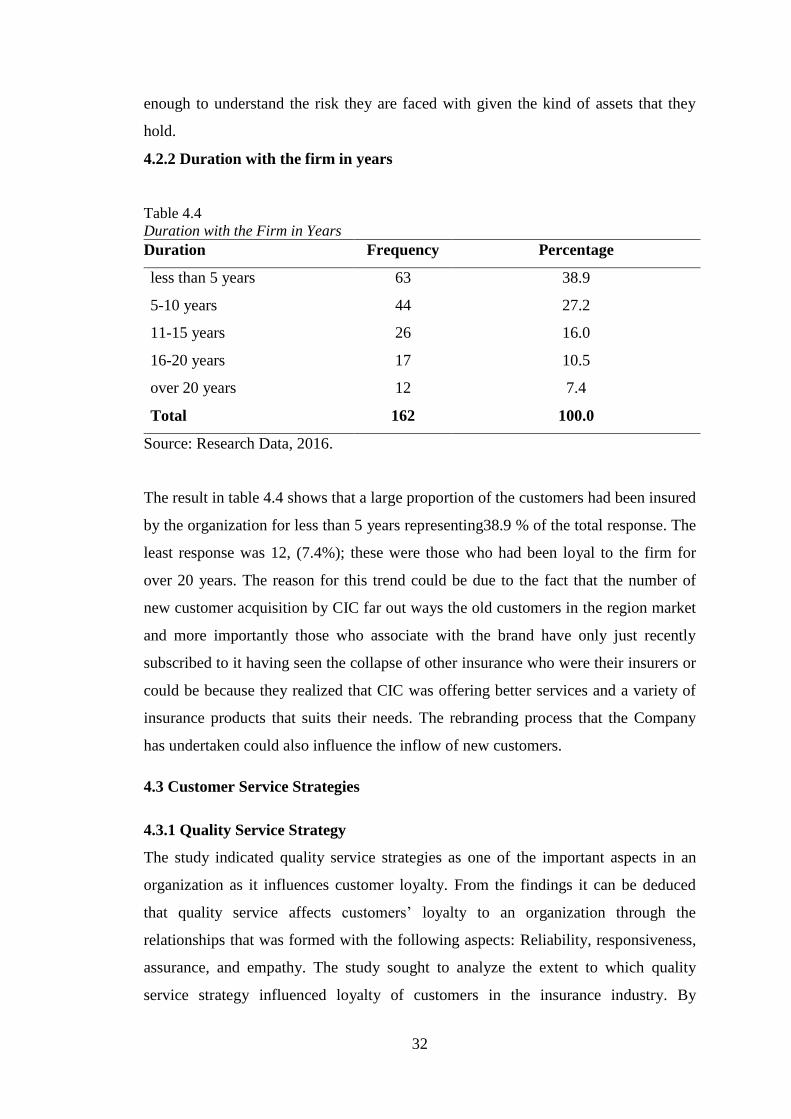
32
enough to understand the risk they are faced with given the kind of assets that they
hold.
4.2.2 Duration with the firm in years
Table 4.4
Duration with the Firm in Years
Duration Frequency Percentage
less than 5 years 63 38.9
5-10 years 44 27.2
11-15 years 26 16.0
16-20 years 17 10.5
over 20 years 12 7.4
Total 162 100.0
Source: Research Data, 2016.
The result in table 4.4 shows that a large proportion of the customers had been insured
by the organization for less than 5 years representing38.9 % of the total response. The
least response was 12, (7.4%); these were those who had been loyal to the firm for
over 20 years. The reason for this trend could be due to the fact that the number of
new customer acquisition by CIC far out ways the old customers in the region market
and more importantly those who associate with the brand have only just recently
subscribed to it having seen the collapse of other insurance who were their insurers or
could be because they realized that CIC was offering better services and a variety of
insurance products that suits their needs. The rebranding process that the Company
has undertaken could also influence the inflow of new customers.
4.3 Customer Service Strategies
4.3.1 Quality Service Strategy
The study indicated quality service strategies as one of the important aspects in an
organization as it influences customer loyalty. From the findings it can be deduced
that quality service affects customers‟ loyalty to an organization through the
relationships that was formed with the following aspects: Reliability, responsiveness,
assurance, and empathy. The study sought to analyze the extent to which quality
service strategy influenced loyalty of customers in the insurance industry. By

33
responding to the questions that described the various quality service strategies, the
respondents helped in achieving this objective.5- point Likert scale was used, that
ranged from:1=Strongly Agree to 5=Strongly Disagree and the results are shown
below in table 4.5
Table 4.5
Quality Service Strategy Statement SA
Freq(%)
A
Freq
%)
N
Freq(%)
D
Freq(%)
SD
Freq(%)
𝑿𝟐
P-
Value
The insurance firm provides
promised services in an
accurately and dependent
manner.
85(52.5)
70(43.2)
6(3.7)
0(0.0)
1(0.6)
138.3
0.0001
The staff attend/address to my
requests promptly 68(42.0)
87(53.7) 4(2.5) 2(1.2) 1(0.6) 215.0 0.0001
Every employee possesses
trustworthy behaviour that
reflects genuine commitments
in providing services.
64(39.5)
81(50)
16(9.9)
0(0.0)
1(0.6)
107.5
0.0001
The staff listen to the my
problems carefully providing
individualized attention to my
needs
68(42.0)
88(54.3)
5(3.1)
1(0.6)
0(0.0)
144.0
0.0001
The office opening and
closing hours are ideal for me
72(44.4)
72(44.4)
8(4.9)
5(3.1)
5(3.1)
161.5
0.0001
The firm staff are always
available on call and at the
customer service desk
64(39.5)
74(45.7)
19(11.9)
5(3.1)
0(0.0)
83.9
0.0001
Parking facilities and
accessibility are top notch
54(33.3)
65(40.1)
13(8.0)
11(6.8)
19(11.7)
78.5
0.0001
Source: Research Data, 2016
Table 4.5 shows that (95.7%) of the respondents (strongly agreed and agreed) (𝑥2=
138.3, P≤0.0001) that the insurance firm provides promised services in an accurately
and dependent manner. Majority of the respondents (95.7%) also (strongly agreed and
agreed) (𝑥2= 215, P≤0.0001) that the staff attended/addressed to their requests
promptly with a response rate of 53.7%.Ruby et al. (2012) supports this claim since

34
he found out that customers‟ in general support immediate response to their demands,
because they do not want to wait for long time. Adeoye and Lawanson (2012) also
found out that if an insurance company fails to provide service to a customer at
certain time, it can recover this failure by providing prompt services in professional
way. The results of respondents (89.5%) also significantly (𝑥2= 107.5, P≤0.0001)
(strongly agreed and agreed)that every employee possessed trustworthy behaviour
that reflected genuine commitments in providing services.This proposition is
supported by Bitner (1990) who established that customer loyalty is much strongly
impacted by assurance than any other dimension of service quality.
The findings also reveal that the staff listen to customers‟ problems carefully,
individualized attention was provided to suit their needsas 96.3% of the respondents
(strongly agreed and agreed) (𝑥2= 144.0, P≤0.0001).Betty (2011) supported this claim
by stating that in empathy, employees give attention and extra care to their customers
that can increase the quality of services and make customers feel special which in turn
increases customer loyalty and customer satisfaction. In order to satisfy the
customers‟ needs, management should improve service quality through paying
attention to the customer objections. These findings are also in line with those of
Munusamy, et.al (2010) who proposed that the some level of empathy is good
because customers want staff of the organizations to give individual attention to them
during working time.
The results of respondents (88.8%) significantly (𝑥2= 161.5, P≤0.0001) (strongly
agreed and agreed) that both the office opening and closing hours was ideal for most
them. When respondent were asked whether the firm‟s staff are always available on
call and at the customer service desk, 45.7% agreed (𝑥2= 83.9, P≤0.0001).Parking
facilities and its accessibility was considered by majority of the customers top notch
with 40.1% approval ( 𝑥2= 78.494, P≤0.0001). In line with the above outcomes, there
is high likelihood that quality service influences loyalty of customers to an
organization. These findings are in tandem with those of Bloemer et al. (1999) who
stated that service quality results in customer loyalty; whereas if level of customers‟
satisfaction tends to be relatively high, it may also act as a vital promoter of customer
loyalty. Ehigie (2006) also reported a strong positive relationship between service
quality and customer loyalty dimensions.

35
4.3.2 Service Bay Ambience Strategy
As viewed by Shikdar (2002), ambience includes ergonomic components of the
tangible workplace environment that comprise spatial layout and functionality. This
was an important aspect to customer loyalty and hence equipment, sitting area
facilities, communication materials, personnel, noise, lighting, seating arrangement,
air conditioning and decorations were the measures for service bay ambience that
were adopted in this study. The objective was achieved by asking the respondents to
respond to questions that best described their work life balance interactions. A 5-
point Likert scale was used, and the results shown in table 4.6.
Table 4.6
Service Bay Ambience Strategy
Statement SA
Freq(%)
A
Freq(%)
N
Freq(%)
D
Freq(%)
SD
Freq(%)
𝑿𝟐
P-value
The photocopier
machines are readily
available and sufficient
for customer use
63(38.9) 70(43.2) 19(11.7) 5(3.1) 5(3.1) 124.4
0.0001
The chairs provided are
comfortable for me 73(45.1) 75(46.3) 8(4.9) 5(3.1) 1(0.6) 178.9
0.0001 The office notice board,
brochures are clear and
easy to understand 58(35.8) 82(50.6) 18(11.1) 4(2.5) 0 95.5
0.0001
The staff are inviting and
well groomed 75(46.3) 76(46.9) 10(6.2) 0 1(0.6) 122.0
0.0001
The service bay is silent
enough and devoid of
unnecessary noise 69(42.6) 80(49.4) 9(5.6) 1(0.6) 1(0.6)
254.6
0.0001
There is sufficient
lighting in the service
bay (well illuminated) to
carry on transactions
74(45.7) 79(48.8) 8(4.9) 0 1(0.6) 128.9
0.0001
The working space area
is sufficient with proper
sitting arrangement 72(44.4) 83(51.2) 7(4.3) 0 0
62.5
0.0001
The temperature setting
in the office suit me 68(42.0) 76(46.9) 14(8.6) 4(2.5) 0 100.0
0.0001
The service bay is tidy,
clean and well decorated 94(58.0) 55(34.0) 11(6.8) 2(1.2) 0 134.0
0.0001
Source: Research Data, 2016

36
The results of the respondents 82.12.2% (strongly agreed and agreed) (𝑥2= 124.4,
P≤0.0001) that photocopier machines being readily available and sufficient for
customer use. When asked whether the chairs provided are comfortable 91.4%
(strongly agreed and agreed)(𝑥2= 178.9, P≤0.0001). The office notice board,
brochures were clear and easy to understand and the office staff considered inviting
and well-groomed with 97.5% of the respondents (strongly agreeing and agreeing)
(𝑥2= 122, P≤0.0001). The customers also appreciated the fact that the service bay is
silent enough and devoid of unnecessary noise with an approval rating of 49.4%(𝑥2=
254.6, P≤0.0001). They also agreed that there existed sufficient lighting in the service
bay that enabled carry out of transactions with 48.8% agreeing to this statement (𝑥2=
128.9, P≤0.0001).
Further still, 51.2% of the respondents agreed that the working space area is sufficient
with and that proper sitting arrangement had been observed(𝑥2= 62.5, P≤0.0001).The
temperature setting in the office was conducive for majority of the customersand the
service bay labelled tidy, clean and well decorated. This is evidenced by the fact that
49.4% and 58% of the respondents indicated their agreement and strongly agreed to
these statements respectively (𝑥2= 134.0, P≤0.0001).
These findings are in agreement with those of Culiberg and Rojsek, (2010) who found
out that customers expect up-to-date equipment, attractive printed material, well
arranged interior and properly dressed employees. This was also in line with the study
by Nabi, (2012) which concluded that customers preferred an insurance company with
convenient location. Brady and Cronin (2001) also found out that consumers react not
only to products, but also to the features that accompany the product. They asserted
that consumers not only make their purchase decision and respond to more than
simply the tangible product or service being offered but respond to the total product.
One of the most significant features of the total product is the place where it is bought
or delivered. Atmospherics relates to the effort to design buying environments to
produce specific emotional effects in the buyer that enhance his purchase probability.
In some cases, the place, more specifically the atmosphere of the place, is more
influential than the product itself in the purchase decision.

37
Hirschman and Holbrook (1982) reached a similar conclusion on the importance of
ambient conditions, finding that sensory input associated with a product led to
emotional arousal and caused consumers to recall the product or the events
surrounding their interaction with the product or to imagine a sequence of future
events. Jiang and Wang, (2006) also found out that atmospheric clues affect consumer
moods and emotions which, in turn, affect purchase behavior and response to
products.
4.3.3 Technology Support Strategy
Banta (2009), views technology as a broad concept that deals with use and knowledge
of tools and crafts and how its use affects the ability to control and adapt to the social
and physical environment. In this study technology support is the act of availing these
support tools which are appropriate and up to date that aid customers and employees
and was measured in terms of availability of internet connectivity, appropriate
computers and applications, their ease of use, efficiency and effectiveness of data
management and how it helps employees to save on time. All this showed that
technology support aspect affects loyalty of customers to an organization. 5- point
Likert scale was used, that ranged from: 1=Strongly Agree to 5=Strongly Disagree
and the results summarized in table 4.7

38
Table 4.7
Technology Support Strategy
Statement SA
Freq(%)
A
Freq(%)
N
Freq(%)
D
Freq(%)
SD
Freq(%)
𝑿𝟐
P-value
My organization, has a
comprehensive database
of customers‟ information 67(41.4) 78(48.1) 14(8.6) 1(0.6) 2(1.2) 170.5
0.0001
The staff gives prompt
services to customers
irrespective of their status
using online media.
56(34.6) 92(56.8) 11(6.8) 3(1.9) 0 127.6
0.0001
My organization, informs
me of any transaction on
my account within five
minutes using text
messages
55(34.0) 88(54.3) 18(11.1) 1(0.6) 0 111.9
0.0001
The company
disseminates information
to me (customer) through
e-mail and other
electronic platforms hence
reducing on waiting time
60(37.0) 89(54.9) 10(6.2) 1(0.6) 2(1.2)
196.8
0.0001
The technology support
system is user friendly
and I seldom experience
system breakdown when
carrying out transactions
electronically
55(34.0) 86(53.1) 16(9.9) 4(2.5) 1(0.6)
168.1
0.0001
For customer convenience
major transactions can be
effected online without
physical contact with the
staff e.g., policy change,
premium payment, etc
56(34.6) 80(49.4) 12(7.4) 12(7.4) 2(1.2)
141.3
0.0001
The organization pays
much attention to the
customers‟ needs using
hi-tech facilities to
improve customer
satisfaction
58(35.8) 82(50.6) 19(11.7) 2(1.2) 1(0.6)
160.7
0.0001
Source: Research Data, 2016
The results revealed that the 89.5% of the respondents (strongly agreed and agreed)
(𝑥2= 170.5, P≤0.001) that theorganization, had a comprehensive database of

39
customers‟ information. When asked whether the staff rendered prompt services to
them irrespective of their status using online media,56.8% of the customers agreed
(𝑥2= 127.6, P≤0.001).54.3% of the respondents also agreed to the idea that the
organization informed them of any transaction on their accounts within five minutes
using text messages(𝑥2= 112.0, P≤0.001). In regards to whetherthe company
disseminated information to them through e-mail and other electronic platforms hence
reducing on waiting time, 54.9% of the customer agreed to it (𝑥2= 196.8,
P≤0.001).Similarly, when a question in respect to whether the technology support
system was user friendly and seldom experienced system breakdown when carrying
out transactions electronically, 53.1% of the customers agreed to this statement (𝑥2=
168.1, P≤0.001).49.4% of the customers also appreciated the convenience in which
major transactions could be effected online without physical contact with the staff
such as policy change, premium payment (𝑥2= 141.3, P≤0.001).The organization was
also depicted as having paid much attention to the customers‟ needs using hi-tech
facilities to improve customer satisfaction with 50.6% approval score(𝑥2= 160.7,
P≤0.001).
These findings agreed with those of Yaghoobi & Shakeri, (2008) who found out that
ease of use represented the respondents' coping abilities and skills needed for using
the system. These results are also in line with those of Szymanski and Hise (2000)
who sited Navigation, product information, and site design as being critical to e-
satisfaction. Jarvenpaa and Todd (1997) also found out that fast, interactive,
uncluttered, and easy-to-navigate sites with quality searching capabilities would be
perceived more favorably by consumers. With the features evaluated within the
attribute of usability and site design are: providing a user-friendly interface, an
interactive site, and possessing adequate searching capabilities

40
4.4 Inferential Statistics
This section presented Correlation and multiple linear regression using stepwise
selection procedure analysis results to evaluate the relationship between the dependent
and independent variables.
4.4.1 Correlation Analysis
To determine the significance and degree of association of the variables Correlation
analysis was used. The main result of a correlation is called the correlation coefficient
(or "r"). It ranges from -1.0 to +1.0. The closer r is to +1 or -1, the more closely the
two variables are related. If r is positive, it means that as one variable gets larger the
other variable also gets larger. If r is negative it means that as one variable gets larger,
the other variable gets smaller (often called an "inverse" correlation).
Table 4.8
Correlations Results
Quality
Service
Service Bay
Ambience
Technology
Support
Customer
Loyalty
Quality
Service
Pearson
Correlation
1
Sig. (2-tailed)
Service Bay
Ambience
Pearson
Correlation
.489**
1
Sig. (2-tailed) .000
Technology
Support
Pearson
Correlation
.516**
.480**
1
Sig. (2-tailed) .000 .000
Customer
Loyalty
Pearson
Correlation
.298**
.374**
.445**
1
Sig. (2-tailed) .000 .000 .000
**. Correlation is significant at the 0.01 level (2-tailed).
Source: Research Data, 2016
The correlation statistics summary shown in table 4.8 indicates a moderately
significant positive association between the independent and dependent variables. The
correlation results, found that there was a significant relationship at 1% level of

41
significance between quality service strategy and loyalty of customers in the
insurance industry (r =0.298, p = 0.00). These findings agree with those of Spreng
(1996), whose evidence proved that there exists a significant correlation between
service quality and customer loyalty. This is also in agreement with Boahene and
Agyapong (2011) study in which service quality was also found to correlate positively
and significantly with customer loyalty.
The study also assessed whether service bay ambience strategy had an effect on the
loyalty of customers in the insurance industry and a slightly positive relationship (r =
0.374, p = 0.000) is noted. These results are in tandem with those of Jabnoun and Al-
Tamimi (2003) who establised that institutions with better ambience enhance
customer loyalty in a better way. However, these results are not in line with those of
Saghier and Nathan (2013) who found out that the relationship between tangibles and
customer satisfaction was not significant enough.
The study also sought to determine whether technology had a significant effect on the
customer loyalty in the insurance industry and found a positive relation (r = 0.445, p =
0.000). These findings are in line with those of Alba et al. (1997) and Jarvenpaa and
Todd (1997)who reported that online consumers are influenced by the interactivity of
the Website. On the contrary, Munusamy et al, (2010) reported that a company using
modern technology for its operations and having well organized waiting cues will be
of less importance insight of customers. The results therefore indicated that
technology support strategy exhibited a significant association with customer‟s
loyalty followed by service bay ambience strategy and the least being the quality
service strategy.
4.4.2 Regression Analysis
To produce a best fit line to predict independent variables on the dependent variable
multiple regression analysis was used. It was used to determine how each independent
variable affected the dependent variable and which of those factors are more
significant. Table 4.9 shows the results.

42
Table 4.9
Multiple Linear Regression Analysis Model Summary
Model R R Square Adjusted R
Square
Std. Error of the
Estimate
1 .482a .232 .217 5.06129
a. Predictors: (Constant), Technology, Service, Quality
Source: Research Data, 2016
The adjusted R square value of, r2= 0.217 indicate that when all the variables are
combined, the multiple linear regression model could explain approximately 21.7% of
the variation in loyalty of customers at CIC insurance group. This therefore implies
that 78.3% is explained by other factors which include; core offerings where
companies have focused intently on what they know appeals to the type of customers
they want to attract, and have determinedly concentrated on delivering what is
expected every time. The other factor is the elasticity level where Elasticity expresses
the importance and weight of a purchasing decision - effectively the level of
involvement or indifference. It could also be explained by the market place which is
determined by the opportunity to switch and the inertia loyalty.
4.4.3 Anova Results
The results of Anova performed on the independent and dependent variables are
summarized in table 4.9 b while the regression analysis results are also presented on
table 4.9c
Table 4.9b
ANOVA Results
Model Sum of Squares df Mean
Square
F Sig.
1
Regression 1222.845 3 407.615 15.912 .000b
Residual 4047.433 158 25.617
Total 5270.278 161
a. Dependent Variable: Loyalty
b. Predictors: (Constant), Technology, Service, Quality
Source: Research Data, 2016
The ANOVA results shown in table 4.9b indicated an overall significance of 0.000,
which is less than the level of significance of 0.05 meaning that all of the variables
contribute to the performance and determination of the loyalty of customers.

43
Table 4.9c
Multiple Linear Regression Results
Model Unstandardized
Coefficients
Standardized
Coefficients
t Sig. Collinearity
Statistics
B Std. Error Beta Tolerance VIF
1
(Constant) 8.075 1.696
4.761 .000
Quality Service .042 .128 .028 .331 .741 .659 1.518
Service Bay
Ambience
.253 .107 .199 2.369 .019 .690 1.449
Technology
Support
.534 .136 .335 3.922 .000 .666 1.503
a. Dependent Variable: Loyalty
Source: Research Data, 2016
The VIF (variance inflation factor) is much less than 10 for all the variables,
indicating that collinearity is not a problem between the independent variables.
The overall relationship between the dependent and independent variables will be of
the most importance in a linear regression model. The findings showed there was an
insignificant relationship between quality service strategy (0.042, p = 0.741) and
customer loyalty at CIC insurance group at 5% level of significance. The findings
however, indicated a significant relationship at 5% level of significance between
Service bay ambience strategy and technology support strategy and customer loyalty
at CIC insurance group with p-values of (0.253, p = 0.019) and (p=0.000)
respectively.
4.5 Hypotheses Testing
The specific objectives of the research are highlighted, hypotheses are tested and
implications discussed in this section.
4.5.1 Specific objectives
Ho1: Quality service strategy has no significant effect on customer loyalty in the
insurance industry.
Regression results showed that quality service as a customer service strategy
insignificantly influenced customers‟ loyalty to an organization (p = 0.741) hence we
fail to reject the null hypothesis. The implication of this is that despite the firms effort
to render promised services in an accurately and dependent manner, providing tailored

44
solutions to customers problems, staff attending to request in a timely manner, and
even the parking facilities made top notch and accessible customer loyalty is not
guaranteed.
Ho2: Service bay ambience strategyhas no significant effect on customer loyalty
in the insurance industry.
The regression results showed that the service bay strategy as a customer service
strategy significantly influenced customer‟s loyalty to an organization at 5% level of
significance (p= 0.019) and thus the null hypothesis was rejected. This means that
comfort of chairs at the service bay, service bay being tidy, silent enough and devoid
of unnecessary noise, well illuminated and the temperature setting suiting customers
were significant factors on customers‟ loyalty.
Ho3: Technology support strategyhas no significant effect on customer loyalty in
the insurance industry.
Regression results showed that the technology support strategy significantly
influenced customer loyalty in the insurance industry (p = 0.000) and thus the null
hypothesis was rejected. The implication of this is that availability of a
comprehensive database of customers‟ information, current applications and their ease
of use, dissemination of information to customers through e-mail and other electronic
platforms and major transactions being effected online without physical contact with
the staff are important factors of technology support that helps to boost customer
loyalty in the insurance industry.

45
CHAPTER FIVE
SUMMARY OF FINDINGS, CONCLUSIONS AND RECOMMENDATIONS
5.1 Introduction
Discussion, conclusions, and recommendations arising out of the research findings in
the previous chapter and areas for further study are presented in this chapter .The
overall objective of this study was to establish the relationship between customer
service strategies and customer loyalty in the insurance industry. On the other hand
the specific objectives of the study were to assess, examine and analyze the effect of
quality service strategy, service bay ambience strategy and technology support
strategy on loyalty of customers at CIC insurance group in Nakuru County.
5.2 Summary of Findings
According to the findings it showed that when all variables are combined it can
explain approximately 23.2% of the variations in loyalty of customers in the insurance
industry while 76.8% may be attributed to other factors not explained by the
variables.
According to the first objective of the study which was to ascertain whether quality
service strategy affects customer loyalty in the insurance firms, the data analysis and
interpretation of the questionnaires showed that majority of customers agreed that the
insurance firm provided promised services in an accurately and dependent manner.
They also agreed that the staff attend/address to my requests promptly, every
employee possessed trustworthy behaviour that reflected genuine commitments in
providing services, the staff listened to the their problems carefully providing
individualized attention to their needs, the office opening and closing hours were ideal
for them, the firm staff are always available on call and at the customer service desk
and that the parking facilities were accessible and are top notch. From the correlation
results, it was found that the quality service strategy has a significant positive effect
on loyalty of customers in the insurance industry meaning a significant relationship
exist between quality service strategy and customers‟ loyalty. According to regression
results it was the least important variable in customer loyalty in terms of influence.
46
To determine whether service bay ambience strategy affects customer loyalty in the
insurance firms was the second objective. According to the findings it showed that
majority of the respondents strongly agreed that the photocopier machines are readily
available and sufficient for customer use, the chairs provided are comfortable for
them, the office notice board, brochures are clear and easy to understand, the staff are
inviting and well groomed, the service bay is silent enough and devoid of
unnecessary noise, there is sufficient lighting in the service bay (well illuminated) to
carry on transactions, the working space area is sufficient with proper sitting
arrangement, the temperature setting in the office suited them and that the service bay
is tidy, clean and well decorated.
From the correlation results, it was found that the service ambience strategy has a
significant positive effect on customers „loyalty meaning significant relationship
exists between service bay ambience and loyalty of insurance customers. According
to regression results it was the second most important variable in loyalty of customers
at CIC insurance group.
Finally the study sought to analyse the effect of technology support strategy on the
loyalty of customers in the insurance sector. The findings revealed that majority of the
customers agreed that the organization had a comprehensive database of customers‟
information;the staff gave prompt services to customers irrespective of their status
using online media, the organization informed them of any transaction on their
account within five minutes using text messages, the company disseminated
information to them through e-mail and other electronic platforms hence reducing on
waiting time, the technology support system is user friendly and they seldom
experience system breakdown when carrying out transactions electronically, for their
convenience major transactions can be effected online without physical contact with
the staff for instance policy change, premium payment and that also the organization
pays much attention to the customers‟ needs using hi-tech facilities to improve
customer satisfaction .
From the correlation results, it was found that technology support has a significant
positive effect on loyalty of customers to an organization meaning a significant
relationship exist between technology support strategy and customer loyalty in the

47
insurance industry. According to regression results it was the most important variable
in boosting customers‟ loyalty.
5.3 Conclusions
Loyalty of customers in the insurance industry is influenced by various factors. The
findings revealed that technology support strategies were an important factor in
creating loyalty among customers as compared to the other two variables; (quality
service strategy and service bay ambience), at CIC insurance group. More
specifically, prompt services offered to customers irrespective of their status using
online media by the firm‟s staffhad a strong influence on loyalty of CIC insurance
group customers.
Many factors affect customers‟ loyalty to an organization that corporate
managers/supervisors need to be aware of and should put more effort to improve at all
times. According to the findings it was determined that the tidiness, cleanliness and
decoration of the service bay to a great extent influenced the perception of the
customers on whether to do business with the organization or not. This could be due
to the fact that first sight appearance illustrated how disorganized or organized an
organization could be. They also appreciated that the insurance firm rendered
promised services in an accurately and dependent manner which illustrated the quality
of services and value for money. Moreover, the availability of technology, the ease of
operating and how it helped them to save on time was also an important aspect that
came into play. Therefore, based on these findings, the study concludes that all of the
variables were important in the study with the most crucial being technology support
aspects.
5.4 Recommendations
As a result of the research findings, it is recommended that the strong strategies
influencing on loyalty of customers in the insurance industry be put into great
consideration. These consist of but not limited to: quality service, service bay
ambience and technology support. Encouraging customer service strategies may
increase their loyalty to an organization and hence reduce turn over and cost of
recruitment (advertisement). Service bay ambience was identified to be significant to

48
customers‟ loyalty. Therefore, attention need to be given especially to the appearance
and organization of the reception/service bay as it is a strong indicator of how things
are done behind the scenes, hence the intention of customer to remain with an
organization as he/she feels well placed, respected, valued and part of something
special.
Technology support being the most influential variable among the other two should be
of the greatest concern to every organization that have or plans to recruit more
customers. Insurance firms should strive towards availing modern technology; proper
internet connectivity and ease of use of the technology in order to enable customers to
access insurance services easily and conveniently, this will speed up the transactions
process and documentation as required of them on time. By ensuring that
organizational customer interaction is easy and enjoyable, the intention of the
customers‟ to stay with that organization increases and therefore securing their
loyalty.
5.5 Recommendation for Further Research
The researcher recommends further research to be done on firms in other industries, to
find out whether these variables will hold true. This study focused on customer
service strategies at CIC insurance group in Nakuru County. However, a similar
research can be carried out in other insurance firms so as to achieve generalizability of
findings.

49
REFERENCES
Abratt, R., & Russell, J. (1999). Relationship Marketing in Private Banking South
Africa. The International Journal of Bank Marketing, Vol. 17, No. 11. – pp. 5-
19.
Adeoye, B. & Lawanson, O. (2012) Customer satisfaction and its implication for
Banks performance in Nigeria. British journal of arts and social science vol.5
No. 1, 13-29
Aduda, J., Kiragu, K., & Ndwiga, J. (2013). The Relationshp Betwen Agency
Banking and Financial Performance of Commercial Banks in Kenya. Journal
of Finance, 1-2.
Agarwal, R. (2006). Non-Financial Measures of Performance. Responsibility
Accounting, 40-45.
Agnes, M. (2009). Webster’s New World College Dictionary (4th Ed). New York,
USA: Macmillian.
Agrawal, A., & Ribot, J. (2010). Accountability in Decentralisation: A Framework
with South Asian and Africa Cases. The Journal of Development Areas, No 33
pp 437-502.
Ahmad, R., & Buttle, F. (2001). Customer Retention: A Potentially Potent Marketing
Management Strategy. Journal of Strategic Marketing, 1, 29–45.
Ajala, V. O. (1996). Scholarly Writing Guide For Researchers. Ibadan: MayBest
Publishers.
AKI. (2015). Annual Report. Association of Kenya Insurers, 20-30.
Amit, R., & Livnat, J. (1988). A Concept of Conglomerate Diversification. Academy
of Management Journal, 28-59.
Anderson, & Sullivan. (1993). In Patterson, P.G., Johnson L.W., & Spreng, R.A.
(1997). Modeling the Determinants of Customer Satisfaction for Business-to-
Business Professional Services. Journal of Academy of Marketing Science,
25(1), pp. 4-17.

50
Armstrong, M. (2001). A handbook of human resource management practice (8th
Ed.). London: Kogan Page Ltd.
Atienza, M. E. (2009). Health Devolution, Civil Society Participation and
Volunteerism: Political Opportunities and Constraints in the Philippines.
Phillipines Journal of Public Administration, 56, 342-351.
Aydin, S., & Özer, G. (2005). The Analysis of Antecedents of Customer Loyalty in
the Turkish mobile Telecommunication Market. European Journal of
Marketing, 39(7/8),910-925.
Babbie, E. (2002). Survey Research Methods. (2nd ed.) . Belmont, CA: Wadsworth
Publishing.
Banta, D. (2009). What is Technology Assessment? International Journal of
Technology Assessment in Health Care, 25: Supplement 1 (2009), 7–9.
Bashaasha, B., Mangheni, M. N., & Nkonya, E. (2011). Decentralization and Rural
Service Delivery in Uganda. kampala. Kampala: International Food Policy
Research Institute.
Beam, J. (2009, April 20). What is Employee Turnover? Retrieved from WiseGEEK:
http://www.wisegeek.com/what-is-employee-turnover.htm
Beck, P. (2008). Financing Patterns around the World: Are Small Firms Different?
Journal of Financial Economics, 89, 467-87.
Beckett, A., Hewer, P., & Howcroft, B. (2000). An Exposition of Consumer Behavior
in the Financial Services Industry. International Journal of Bank Marketing,
18(1), pp.15-26.
Berman, P., & Bosset, T. (2010). A Decade of Health Sector Reform in Developing
Countries: What Have we Learned? Internationa Journal of Health Sciences ,
Vol 25: 459-476.
Best, J., & Khan, J. (2003). Research In Education. Boston: Allyn & Bacon.
Bhaskar, V. (2013). Financial Inclusion in India – An Assessment. Journal of
Finance, 2-3.

51
Bitner, M. J. (1990). Evaluating Service Encounters: The Effects of Physical
Surroundings and Employee Responses. The Journal of Marketing, 54(2), 69-
82.
Bitner, M. J. (1990). Evaluating Service Encounters: The Effects of Physical
Surroundings and Employee Responses. The Journal of Marketing, 54(2), 69-
82.
Blery, E., Batistatos, N., Papastratou, E., Perifanos, I., Remoundaki, G., & Retsina,
M. (2009). Service Quality and Customer Retention in Mobile Telephony.
Journal of Targeting,Measurement and Analysis for Marketing, 17(1), 27-37.
Bloemer, J., De Ruyter, K., & Peeters, P. (1999). Investigating Drivers of Bank
Loyalty:The Complex Relationship Between Image, Service Quality and
Satisfaction. International Journal of Bank Marketing, 16(7), 276-286.
Bloom, G., & Xingyuan, G. (1997). Health Sector Reform in India. Journal of Social
Science and Medicine, 45, 362-378.
Bold, C. (2011). Branchless Banking in South Africa. Cape Town: CGAP
Publication:Consultative Group to Assist the PoorTechnical Guide.
Bossert, T. J., & Beauvais, J. C. (2002). Decentralization of Health system in
Ghana,Zambia, Uganda, and the Philippines:A Comparative Analysis of
Decision Space. Journal of Health Policy and Planning, Vol 17: 314-324.
Bossert, T. J., & Beauvais, J. C. (2002). Decentralization of Health Systems in
Uganda, Zambia, Ghana, and The Phillipines: A comaprative Analysis of
Decision Space. Journal of Health Policy and Planning, 17, 314-324.
Bossert, T., Beauvais, J., & Bowser, D. (2007). Applied Research Study of
Decentralization of Health Systems in Ghana, Zambia, Uganda, and
Philippines. Bethesda: Partnerships for Health Reforms.
Boulding, W., Kalra, A., Staelin, R., & Zeithaml, V. A. (1993). A Dynamic Process
Model of Service Quality: From Expectations to Behavioral Intentions.
Journal of Marketing Research, 30(1), 7-27.

52
Brown, K. A., & Mitchell, T. R. (1992). Organizational Obstacles: Links with
Financial Performance, Customer Satisfaction, and Job Satisfaction in a
Service Environment. Human Relations, 46(6), 725-757.
Business Dictionary. (2015, June 14). Operatinal Performance. Retrieved from
Business Dictionary.com:
http://www.businessdictionary.com/definition/operational-performance.html
Buttle, F. (1996). Relationship Marketing. Relationship Marketing Theory and
Practice. London: Chapman.
Cascio, W. (1982). Costing Human Resources. Boston: Boston Kent publishing
company.
Centellas, M. (2000). Decentralisation and Democratisation in Bolivia . Miami.
Central Bank of Kenya. (2010). Guideline On Agent Banking. Nairobi: Government
of Kenya Printers.
Central Bank of Kenya. (2012). Developments In The Kenyan Banking Sector For The
Quarter Ended 30th June 2012. Nairobi: Government of Kenya.
Central Bank of Kenya. (2014). Bank Supervision Annual Report. Nairobi: CBK.
CGAP. (2006). Use of Agents in Branchless Banking for the Poor: Rewards, Risks,
and Regulation. Washington DC: CGAP Focus Note No.38.
CGAP. (2015, April 22). Agent management toolkit:Building a Viable Network of
Branchless Banking Agents. Retrieved from Advancing Financial Inclusion to
Improve the Lives of the Poor: http://www.cgap.org/sites/default/files/CGAP-
Technical-Guide-Agent
Chew, J., & Chan, C. (2008). Human Resource Practices,Organisational Commitment
and Intention to Stay. International Journal of Manpower, 503-522.
Chu, K.-M. (2009). The construction model of customer trust, perceived value and
customer loyalty. The Journal of American Academy of Business, Cambridge,
14(2), 98-103.
53
Cohen, L., & Manion, H. (1995). Research Methods in Education. London:
Rontledge.
Colgate, M., Stewart, K., & Kinsella, R. (1996). Customer Defection: A Study of the
Student Market in Ireland. The International Journal of Bank Marketing, Vol.
14, No. 3. – pp. 23.
Collins, A., & Green, H. (2006). Decentralization and Primary Health Care: Some
negative effects in Developing Countries. International Journal of Health
Sciences, Vol 234: 576-584.
Collins, D. (2010). Consumer Experience in Branchless Banking. Journal of Finance,
30-34.
Cooper, D., & Schindler, P. (2001). Business Research Method. Washington:
Macmilan.
Counttolenc, B. F. (2012). decentralisationand Governance in the Ghana health
Sector . Washington: The International Bank for Rconstruction and
development, The world Bank.
Crawford, S. (2015). Global Inusurance Outlook. Ey, 4-15.
Culiberg, B. and Rojsek, I. (2010). Identifying service quality dimensions as
antecedents to customer satisfaction in Retail Banking. Economic and
Business Review, 12 (3).
De Vos, A., & Meganick, A. (2009). What HR Managers do Versus What Employee
Value:Exploring both Parties View On Retention Management from a
Psychological Contract Perspective. Personal Review,38(1), 45-60.
Demirguc, K., Asli, & Leora, K. (2012). Financial inclusion in Africa: An overview.
World Bank Policy Research Working Paper No. WPS 6088.
Dohoo, I., Martin, W., & Stryhn, H. (2012). Methods in Epidemiologic Research.
Canada: VER Inc.
Donaldson, C., & Gerald, K. (2005). Economics of Health Care Financing: The
Visible Hand. New York: Palgrave Macmillan.

54
Duffy, D. L. (2003). Internal and External Factors which Affect Customer Loyalty.
Journal of Consumer Marketing, 20(5), 480-485.
Ehigie, B. O. (2006). Correlates of Customer Loyalty to their Bank: A Case Study in
Nigeria. International Journal of Bank Marketing, 24(7), 494-508.
El-Saharty, S., Kebede, S., Dubusho, P. O., & Siadat, B. (2009). Ethiopia: Improving
Health Service Delivery. Washington DC: The World Bank.
Enyonam, A. (2011). Effect of Customer Service on Customer Satisfaction; A Case
Study of Fidelity Bank-Adum Kumasi. Reseach Thesis, 17.
Fama, E. (1970). Efficient Capital Markets: A Review of Theory and Empirical Work.
Journal of Finance, 25:2, pp. 383–417.
Fornell, C. (1992). A National Customer Satisfaction Barometer: The Swedish
Experience. Journal of Marketing, 56(1), pp. 6-22.
Frankfort-Nachmias, C. &. (1996). Research Methods in Social Science (5th Edition).
London: World Publication.
Ganesan, S. (1994). Determinants of Long-term Orientation in Buyer-Seller
Relationships. Journal of Marketing, 58,1-19.
Genesys. (2006). Customer Service Strategies for the Insurance Industry. Industry
Strategy Guide, 1-22.
Getenga, M. (2010). Banking Sector Stability, Efficiency, and Outreach in Kenya.
Kenya Policies for Prosperity.
Glebbeek, A., & Bax, E. (2004). Is high employee turnover really harmful: An
empirical test using company records. Academy of Management Journal, 47:
277-286.
Goerdeler., K. M. (2013). Devolution of HC Services in Kenya. Retrieved May 3rd,
2014, from kmpgafrica Website: http://www.kmpgafrica.com//Devolution of
HC Services in Kenya/.
Gonzalez, M. (2009). Health Service Decentralization in Mexico. Journal of Health
Policy and Planning, 13, 345-456.

55
Gounaris, S. (2003). BTrust and Commitment Influences on Customer Retention:
Insights from Business-to-Business Services. Journal of Business Research ,
58,126-140.
Goverment of Kenya . (2010). Kenya Health Situation Analysis, Trends and
Distribution, 1994-2010 and Projections to 2030. Nairobi: Ministry of
Medical Services and Ministry of Public Health and Sanitation.
Gray, T. (2004). Educational Research: Competence for Analysis and Application.
Columbus, Toronto: Charles E Merrill Publishing.
Graziano, A. M. (2007). Research Methods: A Process of Inquiry (6th Edition). New
York.: Pearsons Education Inc.
Grobler, P., Warnich, S., Carrell, M., Elbert, N., & Hatfield, R. (2006). Human
Resource Management in South Africa (3rd ed.) . London: Thomson Learning.
Grönroos, C. (2004). The Relationship Marketing Process: Communication,
Interaction, Dalogue, Value. Journal of Business & Industrial Marketing,
19(2), 99-113.
Grundy, J., Healy, V., Gorgolon, L., & Sandig, E. (2003). Overview of Devolution of
Health Services in the Philippines. International Electronic Journal of Rural
and Remote Health Research, Education, Practice and Policy, 1445-6354.
Gupta, S., Chintagunta, P., Kaul, A., & Wittnik, D. (1996). Do Household Scanner
Data Provide Representative Inferences from Rand Choices: A Comparison
with Store Data. Journal of Marketing Research , Vol.33,383-398.
Harvey. (2010). Banking Reform in Ethiopia. Institute Of Development Studies, IDA
Working paper 37.
Hayes, B. E. (2008). The True Test of Loyalty. Quality Progress, 41(6), 20-26.
Health Action Report. (2011). Health financing in Kenya: The case for Reproductive
Health. Nairobi.

56
Health Sector Function Assignment & Competency Team. (2013). Health Sector
Function Assignment and Transfer Policy Paper. Nairobi: Ministry of Medical
Services & Ministry of Public Health and Sanitation.
Health Sector Report. (2012). Medium Term Expenditure Framework (MTEF) for the
Period 2013/14-2015/2016. Nairobi: Ministry of Medical services and
Ministry Public Health and Sanitation.
Healy, T. (1999). Why You Should Retain Your Customers? America's Community
Banker, Vol. 8, No. 9, September.pp. 22-26.
Heskett, J., Jones, T., Loveman, G., Sasser Jr., W., & Schlesinger, L. (1994). Putting
the Service Profit Chain to Work. Harvard Business Review, 105-111.
Hogan, B. (1991). How To Hatch New Businesses,. D&B Reports, 39(4), 54-55.
Huang, I., & Chuang, C. (2006). Constructing Factors Related to Worker Retention .
International Journal of Manpower,27(5), 491-508.
Huang, M., & Yu, S. (1999). Are Consumers Inherently or Situationally Brand Loyal?
A Set Intercorrelation Account for Conscious Brand Loyalty and Non
Conscious Inertia. Psychology and Marketing, Vol 16,534-544.
Hunter, D. J. (2007). Managing for Health. London: Routledge Taylor & Francis
Group.
Ignacio, M. (2008). Realizing the Potential of Branchless Banking: Challenges Ahead.
Journal of Finance, 10-12.
Ignacio, M. (2009). The Economics of Branchless Banking. . Innovations:
Technology,Governance, Globalization Vol.4, no.2.
Ismail, I., Haron, H., Ibrahim, D. N., & Isa, S. M. (2006). Service quality,
Clientsatisfaction and Loyalty Towards Audit Firms: Perceptions of Malaysian
public Listed Companies. Managerial Auditing Journal, 21(7), 738-756.
Ivatury, G., & Lyman, T. (2006). Use of Agents in Branchless Banking for the Poor:
Rewards, Risks, and Regulation. Washington D.C: CGAP Focus Note No. 38:
October.

57
Iveri Payment Technologies. (2014). Accesing the Unbanked:Branchless Banking for
Africa. Delivering a secure and cost-effective solution to gain new customers,
2-5.
Jabnoun, N., & Al-Tamimi, H. A. (2003). Measuring Perceived Service Quality at
UAE Commercial Banks . International Journal of Quality & Reliability
Management, 20(4),.
Jacob, K. (2005). Retailers as Financial Services Providers: The Potential and
Pitfalls of This Burgeoning Distribution Channel. Chicago: The Center for
Financial Innovation.
Jadhav, R. (2011). An Overview of the Banking Sector-India. Journal of Finance, 1-
3.
Javadin, S., Khanlori, A., & Stiri, M. (2009). Model to Assess the Impact of Service
Quality on Customer Loyalty and Sporting Services. Journal of Olympic, Issue
4, P 42.
Jensen, M., & Meckling, W. (1976). Theory of the Firm:Managerial Behavior,Agency
Costs,and Ownership Structure. Journal of Financial Economics, 3,305-60.
Jochelson, K. (2005). The Role of Government in Public Health. London: Kings Fund.
Kamau, J. (2012). The Relationship Between Agency Banking and Financial
Performance of Commercial Banks in Kenya. MBA Project,University of
Nairobi, 20-23.
Kapoor, S. (2010). Succeeding In UK With The Bank-Focused Model Of Mobile
Banking. Finacle Whiteboard.
Kenya Medical, Pharmacists and Dentistry Union. (2013). Health devolution In
Kenya. Nairobi.
Kenya National Bureau of standards . (2008/2009). Kenya Demographic Health
Survey. Nairobi: Kenya National Bureau of standards .
Kerlinger, F. (1973). Foundation of Behavioral Research (2nd edition) . New York:
Halt Rein Hart and Winston Inc.

58
Kimenya, M. (2002). The Nature, Distribution and Evolution of Poverty and
Inequality in Uganda. Journal of Finance, 50-55.
Kimenyi, M. S. (2013, October 22). Devolution and resource sharing in Kenya.
Nairobi, Kenya.
Kinyanjui, B. (2011). The Impact of Mobile Communication Technologies in
Medium and Small Enterprises: Case Study of Nairobi City. MSc. Thesis
submitted at the University of Nairobi, School of computing and Informatics.
Kinyua, J. (2009, January 27). Ministry of Finance audit findings on M-PESA money
transfer services. Retrieved from Kenya Political Blog post:
http://kenyapolitical.blogspot.com/2009
Kiragu, P. (2012, July 6). Agency banking flourishing, says CBK. The Nairobi Star.
Kirigia, J. M. (2009). Economics Evaluation of Public Health Problems in Sub-
Sahara Africa. Nairobi.
Kirira, N. (2012). Public Finance under Kenya’s new Constitution: Constitution
Working Paper No. 5. Nairobi: Society for International Development (SID).
Kithuka, B. (2012). Factors Influencing Growth of Agency Banking in Kenya: the
Case of Equity Bank,Kwale county, Kenya. MBA Thesis,University of
Nairobi.
Kothari. (2004). Research Methodology, 2nd Edition. Methods and Techniques.
Nairobi: Acts Press.
Kotler. (2003). Marketing Management. Tehran: Atropop Publication.
Kotler, P., & Keller, K. L. (2006). Marketing Management. (12, Ed.). New Jersey:
Pearson Prentice Hall.
Kulwaum, G. (2009). Problems of Devolution of Papua New Guinea Education.
Retrieved 2014, from
http://www.pngbuai.com/300socialsciences/education/policy/development/kul
-devolution-chap1.html/

59
Kumar, A., Nair, A., Parsons, A., & Urdapilleta, E. (2006). Expanding Bank Outreach
through Retail Partnerships: Correspondent Banking in Brazil. Washington
DC: The World Bank:World Bank Working Paper No 85.
Lafond, A., & Field, R. (2003). The Prism. Introducing an Analytical Framework for
Understanding Performance of Routine Health Information System (draft).
RHINO Second International Workshop. (p. 19). Eastern Cape, South Africa,:
USAID, JSI, the Equity Project.
Lauer, K., Dias, D., & Tarazi, M. (2011). Bank Agents: Risk Management,Mitigation,
and Supervision. CGAP.
Lee, K. (2009). Globalisation and Health. London: Palgrave Macmillan.
Lovell, K., & Lawson, K. (1971). Understanding Research in Education. London:
University Of London Press.
Luna-Arocas, R., & Camps, J. (2008). A Model of High Performance Work Pratices
and Turover Intentions. Personnel Review,37(1), 26-46.
Mahmoodi, M., Forozandeh, L., & Ahmadi, M. (2009). Models of Internet Banking
Adoption by Customers, Excavations . Journal of Business Management, pp.
10-20.
Malhotra, N. K., Ulgado, F. M., Agarwal, J., Shainesh, G., & Wu, L. (2005).
Dimensions of Service Quality in Developed and Developing Economies:
Multi-Country Cross-Cultural Comparisons. International Marketing Review,
22(3), 256-278.
Mas, I., & Siedek, H. (2008). Banking through networks of retail agents. CGAP Focus
Notes No 47, May.
McKay, C. (2011). Ghana: Aiming for interoperability in branchless banking.
Consultative Group to Assist the Poor. Journal of Economic Literature, Vol.
35, 34-44.
Mckinney, P. (2015, 5 2). What Is Customer Service? - Definition, Types & Role in
Marketing. Retrieved from http://study.com/academy/lesson/what-is-
customer-servicedefinition-types-role-in-marketing.html

60
Merson, M. H., Black, R. E., & Mills, A. J. (2006). International Public Health.
United States of America: Jones & Barntlett Learning.
Michaud, C., & Murray, C. (2007). External Assistance to the Health sector in
developing Countries. Bulleting of the World health organisation.
Mills, A. (2008). Decentralization and Acountability in the Health Sector from an
International Perspective. Public Administration and Development, 789-804.
Mills, A. (2011). The Challenge of Health Sector Reforms: What Must Goverments
Do? London: Plagrave MacMillan.
Ministry of Devolution and Planning. (2013). Nakuru County Development Profile:
Kenya Vision 2030. Towards a Globally Competitive and Prosperous Nation.
Nairobi: The Goverment Printers.
Ministry of Health. (2013). Kenya Health Sector Strategic Plan Investment Plan
(KHSSPI) July 2013- June 2017. Nairobi: Republic of Kenya.
Ministry of medical Services & Ministry of Public health & Sanitation. (2012). The
draft Kenya Health Sector Strategic & Investment Plan (KHSSP) July 2012 –
June 2018. Nairobi: Ministry of medical Services & Ministry of Public health
& Sanitation.
Ministry of Medical services & Ministry of Public Health and Sanitation. (2012).
Kenya Health Policy 2012-2030. Nairobi: Goverment Printers.
Ministry of Medical Services and Ministry of Public Health and Sanitation. (2012-
2017). Kenya Health Policy. Nairobi: Goverment Press.
Morgan, R., & Hunt, S. (1994). The Commitment Trust Theory of Relationship
Marketing. Journal of Marketing, 58 (July), pp.20-38.
Mshelia, C., Huss, R., Mirzoev, T., Elsey, H., Baine, S. O., Aikins, M., . . . Martineau,
T. (2013). Can Action Research Strengthen District Health Management and
Improve Health Workforce Performance? A Research Protocol. British
Medical Journal, 2013-003625.

61
Mugenda, O. (2003). Research Methods: Quantitative and qualitative approaches.
Nairobi: Acts Press.
Mugenda, O., & Mugenda, A. (1999). Research methods: Quantitative and
Qualitative Approaches. Nairobi: Acts Press Publishing.
Muia, D. M. (2008). Devolution of Governance to Districts in Kenya: New
Approches. Nairobi: University of Nairobi Press.
Mursaleena Islam. (2007). Health Sytems Approch Manual . USAID.
Musgrave, R. (1959). The Theory of Public Finance: A Study in Public Economy.
New York: McGraw-Hill.
Mwamuye, M. K., & Nyamu, H. M. (2014). Devolution of Healthcare System in
Kenya: A strategic approach and its implementation in Mombasa County,
Kenya. INTERNATIONAL JOURNALOF ADVANCED RESEARCH, Volume
2, Issue 4, 263-268.
Mwamuye, M., & Nyamu, H. (2014). Devolution of Healthcare Systems in Kenya.
International Journal of Advanced Research, Vol 2, Issue 4, 263-268.
Mwangi, R. (2011). An Evaluation of The Role Of Agency Banking In The
Performance of Commercial Banks In Kenya. MBA Thesis, Kenyatta
University, 45-48.
Nabi, N. (2012). Customer Expectations of Service Quality: A Study on Private
Banks of Bangladesh. World Review of Business Research, Vol. 2. No. 4. July
2012. Pp. 172 –186.
Nassiuma, D. (2000). Survey Sampling: Theory and Methods. Nairobi: University of
Nairobi Press.
Nassiuma, D. K. (2000). Survey Sampling: Theory and Practice. Nairobi, Kenya:
Nairobi University Press.
National Coordination Agency for Population and Development . (2010). Kenya
Service Provision Assessment Survey. Nairobi: Ministry of Medical Services
and Ministry of Public Health and Sanitation.

62
National Council for Law Reporting. (2010). Constitution of Kenya. Nairobi: National
Council for Law Reporting with the Authority of the Attorney General.
National Demogarphic Health Survey. (2009). Nairobi: Goverment Printer.
National Health Accounts. (2012). Health Financing. Nairobi: Goverment Press.
Ndubisi, N. O., & Wah, C. K. (2005). Factorial and Discriminant Analyses of the
Underpinnings of Relationship Marketing and Customer Satisfaction.
International Journal of Bank Marketing, 23(7), 542-557.
Ngigi, G. (2015, April 7). Agency banking transactions hit Sh320bn mark. Retrieved
from Business Daily: http://www.businessdailyafrica.com/Agency-banking-
transactions-hit-Sh320bn-mark/-/539552/2620776/-/item/1/-/fl4q86z/-
/index.html
Nick, W. (2004). How to Recover Lost Customers. Markerting Mangaement, 49-50.
Nyeck, S., Morales, M., Ladhari, R., & Pons, F. (2002). 10 years of Service Quality
Measurement: Reviewing the Use of the SERVQUAL Instrument. Cuadernos
de Difusion, pp. 101-107.
Oates, W. E. (1972). Fiscal Federalism. New York: Harcourt Brace Jovanovich.
Oates, W. E. (1999). An Essay on Fiscal Federalism. Journal of Economic Litrature,
Vol 337: 677-686.
Office of the Deputy Prime Minister and Ministry of Local Government. (2012). A
Report on the Implementation of Devolved Government in Kenya. Nairobi:
Goverment of Kenya.
Oliva, T. A., Oliver, R. L., & MacMillan, I. C. (1992). A Catastrophe Model for
Developing Service Satisfaction Strategies. The Journal of Marketing, 56(3),
83-95.
Oliver, R. L. (1999). Whence Consumer Loyalty. Journal of Marketing, 63.
Oloo, A. (2006). Devolution and Democratic Governance: Options for Kenya .
Nairobi: IPAR.

63
Omolo, A., Kantai, W., & Wachira, K. (2010). Devolution In Kenya: Prospect,
Challenges and the Future. Nairobi: Institute Of Economic Affairs.
Onesimus, K. (2012). Devolution and the Health System in Kenya. Nairobi: Law &
Consultant Strategic Thinkers and Actors Consultants Ltd.
Onyango, J. A., Cheluget, J. K., Akello, G. M., & Okari, H. (2012). Factors to be
Considered in Revenue Allocation to Devolved Government in Kenya. Prime
Journals, Vol 355: pp 704-708.
Orodho, A. (2009). Essentials of education and social sciences research methods.
Nairobi: Masode Publishers.
Orodho, J. (2003). Access and Participation in Secondary School. Emerging Issues
and Policy. Nairobi: Bureau of Education Research, Kenyatta University.
Osur, D. J. (2013). Effects of Devolution on Health Care . Nairobi: Daily Nation .
Owens, J. (2006). RBAP Text-A-Payment And G-Cash Cash-In/Cash-Out Services
Innovative Banking Services At Your Fingertips. Journal of Finance, 12-15.
Parasuraman, A., Zeithaml, V. A., & Berry, L. L. (1988). SERVQUAL. Journal of
Retailing, 64(1), 12-40.
Parasuraman, A., Zeithaml, V., & Berry, L. (1985). A Conceptual Model of Service
Quality and its Implications for Future Research. Journal of Marketing, 49,
pp. 41-50.
Patterson, P., & Smith, T. (2000). Modeling Relationship Strength Across Service
Types in An Eastern Culture. International Journal of Service Industry
Management, 12(2),pp. 90-113.
Patterson, P., Johnson, L., & Spreng, R. (1997). Modeling the Determinants of
Customer Satisfaction for Business-to-Business Professional Services. Journal
of Academy of Marketing Science, 25(1), pp. 4-17.
Potter, J. G. (2001). Devolution and Globalisation: Implications for Local decision
Makers . Paris: Organisation for Economic Cooperartion and development.
64
Qasim, M., & Asadullah, M. (2012). The Role of Customer Support Service in
Relationship Strengthening: Acase of Swedish Broadband Internet Service
Providers. Karlstad Business School.
Ranaweera, C., & Neely, A. (2003). Some Moderating Effects on the Service Quality-
Customer Retention Link. International Journal of Operations & Production
management, 23(2), pp. 230-248.
Ranaweera, C., & Prabhu, J. (2003). The Influence of Satisfaction, Trust and
Switching Barriers on Customer Retention in a Continuous Purchasing
Setting. International Journal of Service Industry Management , 14(4), 374-
395.
Reichheld, F. (1996). Learning from Customers' Defections. Harvard Business
Review, pp. 56-69.
Reichheld, F., & Kenny, D. (1990). The Hidden Advantages of Customer Retention.
Journal of Retail Banking, Vol. 7, No. 4. – pp. 19-23.
Richards, T. (1996). Using the Conversion Model to Optimize Customer Retention.
Managing Service Quality, 6(4), pp. 48-52.
Rondinelli, D. (2010). Goverment Decentralization in Comparative
Perspective:Theory and Practices in developing Countries. Journal of
International Review of Administrative Science, 89: 267-319.
Rosenberg, J. (2010, March 8). Regulation of Agents Can Make or Break Mobile
Banking for the Poor. Retrieved from CGAP:
http://www.cgap.org/news/regulation-agents-can-make-or-break-mobile-
banking-poor
Sandiford, P. (1999). Devolution in Latin America has had poor effects on health
care. British Medical Journal , Vol 319: PP 7201.
Sanford, C. (2014). Do agents improve financial inclusion?Evidence from a national
survey in Brazil. Rio de Janeiro: Bankable Frontier Associates.
Sekaran, U. (2003). Research methods for business: A skill buildings approach. 4th
Ed. New York: John & Willey.

65
Sharma, N., & Patterson, P. (1999). A Model of Relationship Commitment Among
Professional Services . Journal of Services Marketing, 151-170.
Sharma, N., & Patterson, P. (2000). Switching Costs, Alternative Attractiveness and
Experience as Moderators of Relationship Commitment in Professional,
Consumer Services. International Journal of Service Industry Management,
11(5), pp. 470 – 490.
Shaughnessy, J. Z. (2000). Research Methods in Psycholog. New York: McGraw-
Hill.
Shi, L., & Singh, D. A. (2011). Delivering Health care; A systems Approach. . USA:
Aspen Publishers.
Shikdar A., Al-Hadhrami M.,( 2007 ). “Smart workstation design: an ergonomics and
methods engineering approach.” International Journal of Industrial and
Systems Engineering. 2(4), 363-374.
Smith, B. (1997). Decentralization of Healthcare in Developing Countries:
Organisational Options. Journal of Public Administration and Development
17, 399-412.
Spreng, R. A. (1996). An Empirical Examination of a Model of Perceived Service
Quality and Satisfaction. Journal of Retailing, 72(2), 201-214.
Standage, T. (2009). Eureka Moments - Telecoms in Emerging Markets. The
Economist.
Standard Investment Bank. (2013). Kenya Insurance Sector. Business Review, 18-23.
State Bank of Pakistan. (2011). Branchless Banking Regulations: For Financial
Institutions Desirous To Undertake Branchless Banking. Banking Policy &
Regulations Department.
Stephens, N., & Kevin, P. (1998). Why Don‟t Some People Complain? A Cognitive
Emotive Process Model of Consumer Complaint Behavior. Academy of
Marketing Science Journal, 26(3):172–89.

66
Sureshchandar, G. S., Rajendran, C., & Anantharaman, R. N. (2002). Determinants of
Customer-Perceived Service Quality: A Confirmatory Factor Analysis
Approach. Journal of Services Marketing, 16(1), 9-34.
Sureshchandar, G. S., Rajendran, C., & Anantharaman, R. N. (2003).
Customerperceptions of service quality in the banking sector of a developing
economy: a critical analysis. International Journal of Bank Marketing, 21(5),
233-242.
The Constitution of Kenya . (2010). The Constitution of Kenya. Nairobi: The
Goverment Printers.
The Kenyan Section of the International Commission of Jurists. (2013). Handbook on
Devolution. Nairobi.
Theo, L., Sauerborn, R., & Bodart, C. (2000). Design and Implementation of Health.
Geneva: WHO.
Tomaškova, H. (2010). M-Commerce And M-Banking Focused On Czech Republic.
Communication And Management In Technological Innovation And Academic
Globalization, 30-35.
Transparency International. (2011). The Kenya Health Sector Integrity Study Report.
Nairobi.
Turin, D. R. (2010). Health Care Utilization in the Kenyan Health System: Challenges
and Opportunities. Nairobi, Kenya.
United Nations Development Programme. (2010). Human Development Reports.
Nairobi: United Nations.
Venkata, N., & Priyank, M. (2013). Success Factors of Equity Bank‟s Agency
Banking. MicroSave Briefing Note #140, 1-2.
Waithaka, W. (2013). Health Devolution in Kenya. Nairobi: Kenya Medical Dentistry
and Practitioners Board.
Waithaka, W. (2013). Health Devolution in Kenya. Nairobi.

67
Wamai, R. G. (2013). Reforming Health Systems: Role of NGOs in Decentralization.
Lesson from Kenya and Ethiopia. Boston: Havard School Of public Health.
Wamai, R. G. (2013). Reforming health systems: the role of NGOs in
Decentralization. Lessons from Kenya and Ethiopia. Boston: Harvard School
of Public Health.
Wangondu, G. N. ( 2008). Effect of Customer Relationship Management Systems on
Customer Rentention in Life Insurance Companies in Kenya ( A Case Study
of British American Insurance Company (K) LTD). Kenyatta University,
Nairobi. A Masters Thesis.
WHO. (2000). WHO REPORT. Geneva: World Health organisation (accessed on 20th
Feb 2012).
WHO. (2000). World Health Organisation.
WHO. (2000). World Health Report. Health Systems:. Geneva: World Health
Organistaion.
WHO. (2006). Human Resource for Health. Geneva: World health organistaion.
Williamson, O. (1981). The Economics of Organization: The Transaction Cost
Approach. The American Journal of Sociology , 87 (3): 548–577.
World Bank. (2012). Devolution Without Disruption: Pathway to a successful Kenya .
Nairobi: World Bank .
World Bank. (2012). Devolution Without Disruption: Pathways to a Successful
Kenya. Nairobi: The World Bank.
World Bank. (2012). Health Expenditure. Nairobi: Wolrdbank.
World Health Organisation. (2001). Report of the Scientific Peer Group on Health
Systems Performance Assessment. Geneva: World Health Organisation.
World Health Organisation. (2010). Global Atlas of Health Workers. WHO.
World Health Organisation. (2012). Country Health Profile. Kenya.

68
Yaghoobi, N., & Shakeri, R. (2008). Comparative Analysis of Technology
Acceptance Model with Emphasis on the Adoption of Internet Banking.
Journal of Management, pp. 28.
Yamane, T. (1967). Statistics: An Introductory Analysis, 2nd Ed. New York: Harper
and Row.
Zairi, M. (2000). Managing Customer Dissatisfaction Through Effective Complaint
Management Systems. The TQM Magazine, 12 (5), 331-335.
Zeithalm, V. (1988). Some Moderating Effects on the Service Quality-Customer
Retention Link. International Journal of Operations & Production
Management, 23(2), pp.230-248.
Zeithalm, V., & Bitner, M. (1996). Services marketing, first edition. USA: McGraw-
Hill.
Zineldin, M. (2005). Quality and Customer Relationship Management (CRM) as
Competitive Strategy in the Swedish Banking Industry. The TQM Magazine,
17(4), 329-344.

69
APPENDICES
APPENDIX I: LETTER OF INTRODUCTION
Adikha Lidauli Paul,
Kabarak University,
P.O Box Private Bag,
Kabarak.
Dear sir /madam,
Re: RESEARCH ON EFFECT OF CUSTOMER SERVICE STRATEGIES ON
CUSTOMER LOYALTY
I am a postgraduate student at Kabarak University, Pursuing a Master Degree in
Business Administration (MBA).I am undertaking the above mentioned research
proposal .I would be very grateful if you could answer the questions in the interview
guide as honestly as possible. The findings of the study will be availed to you upon
request on completion of this research. Thank you for your co-operation.
Yours faithfully,
Adikha Lidauli Paul.

70
APPENDIX II: QUESTIONNAIRE
SECTION A: SOCIO-DEMOGRAPHIC DATA OF THE RESPONDENT
1. Gender
[ ] Male
[ ] Female
2. Age in years…………………………..
3. Marital Status
[ ] Single
[ ] Married
[ ] Separated
[ ] Divorced
[ ] Widowed
[ ] Widow
4. Level of education
[ ] High school
[ ] College
[ ] University graduate
[ ] Master‟s graduate
[ ] Doctoral degree
5. How long have you been insured with the company?
[ ] less than 5 years
[ ] 5-10 years
[ ] 11-15 years
[ ] 16-20 years
[ ] Over 20 years

71
SECTION B: QUESTIONS ON CUSTOMER SERVICE STRATEGIES
Kindly rate your levels of agreement or disagreement with the statements in the tables
below using the scale given:
SA=Strongly Agree (1)
A=Agree (2)
N=Not Sure (3)
D=Disagree (4)
SD=Strongly Disagree (5)
Kindly place a tick (√) against the suggested opinion to show your level of agreement
or disagreement with it in the that appropriate box in the table
PART A: QUALITY SERVICE STRATEGY
Item Quality Service Strategy SA A N D SD
i. The insurance firm provides promised services in an
accurately and dependent manner
ii. The staff attend/address to my requests promptly.
iii. Every employee possess trustworthy behavior that
reflect genuine commitments in providing services
iv. The staff listen to the my problems carefully providing
individualized attention to my needs
v. The office opening and closing hours are ideal for me
vi. The firm staff are always available on call and at the
customer service desk
vii. Parking facilities and accessibility are top notch

72
PART B: SERVICE BAY AMBIENCE STRATEGY
Item Service Bay Ambience Strategy SA A N D SD
i. The photocopier machines are readily available and
sufficient for customer use
ii. The chairs provided are comfortable for me
iii. The office notice board, brochures are clear and easy
to understand
iv. The staff are inviting and well groomed
v. The service bay is silent enough and devoid of
unnecessary noise
vi. There is sufficient lighting in the service bay (well
illuminated) to carry on transactions
vii. The working space area is sufficient with proper
sitting arrangement
viii. The temperature setting in the office suit me
ix. The service bay is tidy, clean and well decorated

73
PART C: TECHNOLOGY SUPPORT STRATEGY
Item Technology Support Strategy SA A N D SD
i. My organization, has a comprehensive database of
customers‟ information
ii. The staff gives prompt services to customers
irrespective of their status using online media.
iii. My organization, informs me of any transaction on my
account within five minutes using text messages.
iv. The company disseminates information to me
(customer) through e-mail and other electronic
platforms hence reducing on waiting time.
v. The technology support system is user friendly and I
seldom experience system breakdown when carrying
out transactions electronically.
vi. For customer convenience major transactions can be
effected online without physical contact with the staff
e.g., policy change, premium payment, etc
vii. The organization pays much attention to the
customers‟ needs using hi-tech facilities to improve
customer satisfaction.

74
PART D: CUSTOMER LOYALTY
Item Customer Loyalty SA A N D SD
i. I will always recommend this insurance firm to every
person seeking insurance services
ii. I seldom consider switching away from this insurance
firm
iii. I will always use this insurance firm to insure myself
against any given risk.
iv. This insurance firm is exactly what I need
v. I will Say positive things about the insurance firm to
other people
vi. This insurance firm gives breadth and depth Customer
service
vii. I will never change this insurance firm even if I found
another firm which offers similar services
viii. I consider switching to another brand to be very costly
and unsecure
ix. Premium charges in this firm are fair and reflect the
real scenario in the market