the effect of customer relationship management systems on...
TRANSCRIPT

The Effect of Customer Relationship Management Systems on Firm Performance
Jacob Z. Haislip
Binghamton University
Vernon J. Richardson
University of Arkansas
September 2015
Keywords: Customer Relationship Management (CRM), performance, information technology
Data Availability: The data used are publicly available from the sources cited in the text.
We thank Linda Myers, Jaclyn Prentice, and workshop participants at the 2015 Arkansas
Research Conference for helpful comments.

The Effect of Customer Relationship Management Systems on Firm Performance
Abstract Customer Relationship Management (CRM) systems are a popular tool implemented
by managers to improve the relationships between their firms and customers. These CRM
systems boast numerous benefits to firms and customers that can improve customer satisfaction
(Mithas et al. 2005). However, there is little research regarding the tangible benefits firms
actually experience following CRM system implementation (Hendricks et al. 2007). In this
study, we examine the operational benefits of CRM system implementations to firm
performance. Specifically, we follow the framework established by Dehning and Richardson
(2002) and examine the direct and indirect effects of CRM system implementation. Using a
sample of firms that implement CRM systems that have audited financial data, we find that CRM
system implementation improves performance both directly and indirectly. Specifically, we find
that firms perform better and more efficiently following CRM system implementation.
Additionally, we find that firms are better at collecting accounts receivables. Finally, we find
that for those CRM firms that forecast earnings, the firms that implement CRM systems issue
more accurate earnings forecasts. This study contributes to the literature by showing evidence of
the tangible benefits of CRM systems.

2
I. INTRODUCTION
Worldwide spending on enterprise systems (ES) exceeded $250 billion in 2011, with
expected growth of approximately 10% each year (Gartner 2011). This news is not surprising
given the numerous benefits of Enterprise Resource Planning (ERP) and Supply Chain
Management (SCM) systems documented by both practitioners and academics (Hitt et al. 2002;
Nicolaou 2004; Dehning et al. 2007; Hendricks et al. 2007; Brazel and Dang 2008; Dorantes et
al. 2013). These benefits include improved operational performance and efficiency, as well as
the ability to forecast earnings with greater accuracy. Based on the benefits provided by these
two ES applications, it is not surprising that firms spend significant amounts to implement them.
However, the extant literature does not thoroughly investigate the benefits of a highly
touted third ES application, Customer Relationship Management (CRM) systems. Thus far the
research finds that CRM systems do improve customer satisfaction (Mithas et al. 2005), but
implementing CRM systems does not improve stock returns or profitability (Hendricks et al.
2007). This raises the question: If there are no measurable benefits achieved while
implementing CRM systems, then why do companies to continue to invest heavily in them? The
purpose of CRM systems is to improve the relationship between firms and their customers,
potentially reducing costs of working with them as well as the ability to better retain current
customers and attract additional customers. Therefore, we investigate whether companies that
implement CRM systems improve operational performance.
CRM is a strategic approach to marketing that focuses on developing and maintaining
appropriate relationships with customers often with the aid of information technology (IT), or
CRM systems (Payne and Frow 2005). In their attempts to define what CRM is, Payne and Frow
(2005) state that, “CRM provides enhanced opportunities to use data and information to both
understand customers and cocreate value with them. This requires a cross-functional integration

3
of processes, people, operations, and marketing capabilities that is enabled through information,
technology, and applications.” Simply put, the purpose of CRM and the related systems is to
develop and maintain relationships with customers.
Early IT literature documents a Productivity Paradox in which researchers are unable to
find a positive relation between IT spending and productivity or profitability measures (Weill
1992; Landauer 1995). These studies brought in to question why firms would invest in IT
because the firms would experience no operational benefits. However, more recent papers find
that contingent on certain factors there are positive payoffs from investments in IT (Brynjolfsson
and Hitt 1995, 1996; Hitt and Brynjolfsson 1996; Dewan and Min 1997; Stratopoulos and
Dehning 2000). Thus future research turned to examining when and how IT investments are
successful.
Vendors that sell CRM systems boast of the numerous benefits that these systems provide
such as improving profitability, customer satisfaction, sales productivity, and sales predictability
(Taber 2013). Given these benefits, it is not surprising that companies are forecasted to spend
$23.9 billion on CRM systems in 2014 (Gartner 2014). However, it is surprising that the
academic literature identifies few tangible benefits of CRM systems given the capabilities of the
systems and the amount of money companies spend on them. It is possible that for many
companies that companies either overestimated the benefits of CRM systems, underutilized
them, had inadequately trained staff, or had CRM systems that simply provided too much
information (Taber 2014). Any of these situations could lead to a less than optimal CRM system
implementation.
Perhaps in line with the Productivity Paradox, the academic literature identifies few
benefits following CRM system implementations. For example, Mithas et al. (2005) find that

4
customer knowledge increases following CRM system implementation. Similarly, other studies
find that following CRM system implementation, customer satisfaction and retention improves
(Sutton and Klein 2003; Boulding et al. 2005). Conversely, other studies argue that not all
customers value a relationship with firms and therefore improving customer satisfaction does not
necessarily lead to better firm performance (Dowling 2002; Danaher et al. 2008). This notion is
supported by Hendricks et al. (2007) who find no association between CRM system
implementation and stock returns or firm profitability. However, given the numerous features of
CRM systems and the benefits for customers, we predict that there must be some measurable
benefits for the firms that choose to implement them.
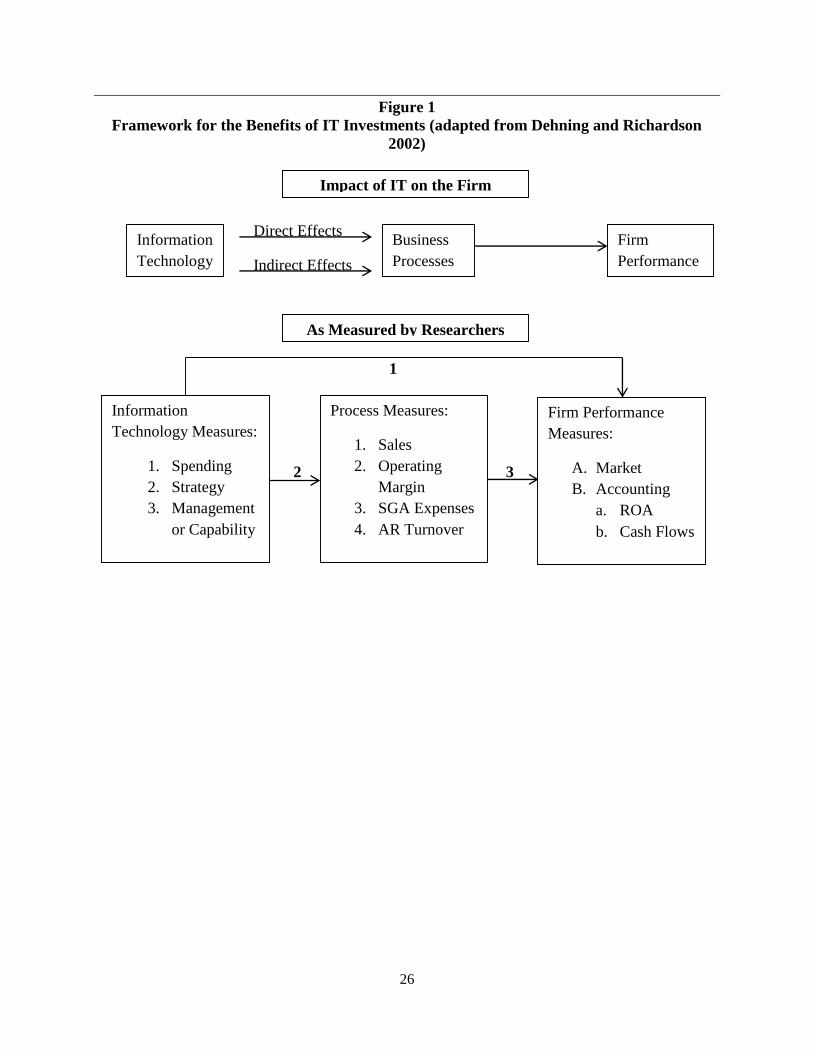
In examining the potential advantages of CRM system implementation we utilize Figure
1, adapted from Dehning and Richardson (2002). Prior literature focuses on path number 1, or
the direct effect that IT has on firm performance measures. While we agree that CRM system
implementation should improve firm performance, we argue that it is more important to first
examine whether CRM systems improve business process measures (path number 2 in Figure 1).
We also argue that a focus on direct performance measure improvement may be the reason why
prior literature finds mixed results regarding the benefits of CRM system implementations
(Hendricks et al. 2007)
Based on the benefits mentioned by Taber (2013), we first examine whether CRM system
implementation improves sales, sales efficiency (operating margin and selling, general, and
administrative (SGA) expenses), and the ability to collect accounts receivable. Given that a
primary objective of CRM system implementation is to gain new customers (Payne and Frow
2005), CRM system implementers should experience an increase in sales. In addition to
operational performance, we focus on sales efficiency and examine how CRM system
5
implementations affect selling, general, and administrative (SGA) expenses. Due to the
improvements in customer relationships, firms should be spending less for each sale made.
Extant literature does find a positive relationship between CRM system implementation and
customer satisfaction (Sutton and Klein 2003; Boulding et al. 2005). We test this from a
different perspective by examining the effect of CRM system implementation on accounts
receivable. If customers are happier with the firm, and if communication is improved between
the firm and customers due to better tracked information regarding outstanding bills, then the
firms implementing CRM should be better at collecting accounts receivable. Therefore, we
expect that accounts receivable collectability will improve following CRM system
implementation.
We next examine whether CRM system implementation improves firm performance
measures, specifically return on assets (ROA) and cash flows from operations. Arguably CRM
systems help facilitate forecasting future sales and by extension, the forecasting of earnings. As
our final test, we examine whether the accuracy of management earnings forecasts improves
following CRM system implementation.
We identify a sample of 95 CRM system implementations using press releases from both
the CRM system vendors and the firms implementing the systems. We identify CRM system
implementations that occurred between 2001 and 2011. Compared to a control sample,
identified using a similar method to Hendricks et al. (2007), we find that firms that implement
CRM systems experience significant improvements in all of the areas suggested by Taber (2013).
First, we find that CRM system implementation improves business processes. Compared
to the control group, firms that implement CRM systems experience greater improvements in
sales. This finding is consistent with the expectation that CRM systems assist in both developing

6
and maintaining relationships with customers (Payne and Frow 2005). Next, we find that firms
that implement CRM systems improve their sales efficency. We specifically find that firms that
implement CRM systems improve their operating margins. We also find that these firms reduce
SGA expenses as a percentage of both sales and assets. Therefore it appears that firms that
implement CRM systems, spend less on each sale that is made, thus improving operating
efficiency. Finally, we find that receivables collectability improves following CRM system
implementation. We find that following CRM system implementation firms report a reduction in
the allowance for doubtful accounts. This may be a less direct measure of customer satisfaction
than the measures used in the extant literature (Mithas et al. 2005), but it does provide evidence
of another operational component that CRM systems improve. This finding suggests that CRM
systems either improve customer satisfaction sufficiently enough that customers are more likely
to pay on their accounts or improve the firm’s ability to collect receivables. Overall, we find
evidence to support path 2 in Figure 1.
We next examine whether CRM system implementations firm performance measures.1
Similar to our findings related to sales we find that following CRM system implementations
firms report better operational performance, measured by ROA and cash flows from operations.
Finally, we find evidence that following CRM system implementation, firms issue more accurate
earnings forecasts. This result suggests the CRM systems improve sales predictability.
This paper contributes to the ongoing stream of research examining the benefits of ERP
systems. For example, the extant literature shows that managers believe that ERP systems aid in
decision making, performance, and timeliness of information (Klaus et al. 2000; Shang and
Seddon 2002; Spathis 2006). Additionally, Dorantes et al. (2013), find that managers are able to
1 For the tests of firm performance measures, we do not differentiate if the improvements are a result of path 1 or
path 3 in figure 1.

7
more accurately forecast earnings following ERP system implementation. Complementing that
study, Brazel and Dang (2008) find that firms are able to reduce the time between their fiscal
year end and their earnings announcement date after they implement ERP systems. Finally,
while the prior evidence is mixed, the general consensus is that ERP systems improve
operational performance and are viewed positively by the stock market (Hitt et al. 2002;
Hendricks et al. 2007). Additionally, some research finds that implementing SCM systems, a
specific application of ES, improves the financial performance of the firms implementing them
(Dehning et al. 2007). We contribute to this literature by examining the operational benefits that
firms receive when they implement CRM systems, another critical application of ES.
Therefore, we also specifically contribute to the literature that investigates the benefits of
CRM. Thus far, the extant literature finds that firms that implement CRM systems experience
improved customer satisfaction and retention (Sutton and Klein 2003; Boulding et al. 2005).
Additionally, Mithas et al. (2005) find that CRM systems can improve customer knowledge. We
contribute to this stream of literature, because thus far there is no empirical evidence supporting
the notion that CRM systems actually improve operational performance.
This study should be of particular interest to firms interested in implementing CRM
systems and the vendors that sell them. As far as we are aware, this study is the first to
document empirical evidence of the operational benefits firms enjoy following the
implementation of CRM systems. We document the specific areas where firms see improvement
following implementation of CRM systems. This study should assist firms in deciding whether a
CRM system will be a good fit for their needs. We also provide support for the various features
that CRM system vendors tout about their products, suggesting that these claims may be
accurate.

8
We organize the remainder of the paper as follows. First, we develop our hypothesis,
which includes a review of relevant literature. Second, we describe our sample and research
design. Finally, we discuss the results and provide a conclusion to the study.
II. BACKGROUND AND HYPOTHESIS DEVELOPMENT
Despite the fact that firms spend billions of dollars on IT each year (Gartner 2011), some
argue that IT is a commodity that no longer offers a strategic advantage (Carr 2003). These
authors argue that most executives view IT as a resource that is necessary to remain competitive,
but is not used as a strategy to gain an advantage. Essentially IT is characterized as being
“essential to competition but inconsequential to strategy” (Carr 2003). In fact, this author goes
on to point out that often there is not a correlation between money spent on IT and positive
financial results. As the prior literature suggests, when IT is treated like a commodity and is not
used strategically, then IT is not likely to lead to success (Rai et al. 2002; Koch 2007).
Their anecdotal evidence showing that failure to support new IT can be disastrous for a
firm. Large companies such as Nike and Hewlett-Packard (HP) lost millions of dollars following
failed IT implementations (Koch 2004; Koch 2007). While not every failure is so disastrous,
firms often do not experience the returns they expect after implementing new IT (Devaraj and
Kohli 2003; Venkatesh and Bala 2008). Given that IT is seen as a commodity and the risk of
failure is sufficiently high, one may see it as peculiar that firms continue to invest increasing
sums of money each year.
One possible explanation is that despite the potential risks, the extant literature does find
benefits for specific IT investments. First, a number of papers document a correlation between
IT investments and positive financial performance (Dehning and Richardson 2002; Dehning et
al. 2007; Kobelsky et al. 2008). As another example, Masli et al. (2010) show that firms are able

9
to reduce the likelihood of material weaknesses in internal controls when they implement IT
specifically aimed at monitoring the effectiveness of internal controls. There is also a stream of
literature that examines the benefits of ERP systems and other components of ES. First, Brazel
and Dang (2008) show that ERP systems reduce the financial reporting lag. They specifically
find that following ERP system implementation, the time between a firm’s fiscal year end and
the earnings announcement reduces. In another paper, Dorantes et al. (2013) find that ERP
systems improve the internal information environment. Specifically, they find that the quality of
management forecasts improves following ERP system implementation. Finally, a number of
papers conclude that ERP systems improve financial operating performance (Hitt et al. 2002;
Hendricks et al. 2007). However, despite the documented evidence of the benefits of ERP
systems, thus far there is no empirical evidence supporting the touted benefits of CRM systems.
Therefore, given the risks associated with IT implementations, it is peculiar that firms continue
to invest in CRM systems.
Payne and Frow (2005, p. 168) define CRM as follows:
“CRM is a strategic approach that is concerned with creating improved
shareholder value through the development of appropriate relationships with key
customers and customer segments. CRM unites the potential of relationship
marketing strategies and IT to create profitable, long-term relationships with
customers and other key stakeholders. CRM provides enhanced opportunities to
use data and information to both understand customers and cocreate value with
them. This requires a cross-functional integration of processes, people,
operations, and marketing capabilities that is enabled through information,
technology, and applications.”
CRM itself is a strategy firms use to develop and improve relationships with customers. This
strategy is most often associated with the implementation of a CRM system. Overall, customers
and managers appear to be happy with CRM systems, as the extant literature, using information
gathered from surveys, documents that CRM systems improve customer knowledge, satisfaction,

10
and retention (Sutton and Klein 2003; Boulding et al. 2005; Mithas et al. 2005). However, other
papers argue that, these improvements may not lead to benefits for a firm because customers do
not necessarily desire or value strong relationships (Dowling 2002; Danaher et al. 2008).
Therefore, it is not that surprising that the extant literature fails to empirically document any
operational benefits of CRM system implementation (Hendricks et al. 2007). However, we
predict that there are specific business process areas that are positively impacted by CRM system
implementation.
The primary focus of most of the ES literature is on how IT can improve profitability
(Dehning and Richardson 2002; Hitt et al. 2002; Hendricks et al. 2007). If CRM systems aid
firms in developing and maintaining relationships with customers then these firms should
experience increases in profitability. It is unclear, however, if the increase in profitability should
be due to an increase in revenue (from making cross sales to current customers or finding new
customers), a reduction of expenses, or a combination of both. In behavioral studies, researchers
find that CRM systems improve customer happiness, leading to greater customer knowledge,
satisfaction, and retention (Sutton and Klein 2003; Boulding et al. 2005; Mithas et al. 2005). We
predict that it requires less effort to make sales to a customer who is already happy with your
firm. We also predict that happy customers will also be more likely to pay their accounts in a
timely manner. In their definition of CRM, Payne and Frow (2005, p. 168) state that “CRM
provides enhanced opportunities to use data and information to both understand customers and
cocreate value with them.” The improvements to information flows regarding customer should
also assist in the accounts receivables collections process. Overall, we predict that CRM systems
make collecting on accounts receivable easier. We therefore first focus on the potential of CRM
systems to directly improve business process measures (path 2 in Figure 1). Therefore, we

11
predict that CRM system implementation will directly improve sales, sales efficiency, and
accounts receivable collectability. Specifically, our first hypothesis is as follows:
Hypothesis 1: Firms that implement CRM systems improve their business process
measures to a greater degree than firms that do not implement CRM systems.
We next examine whether CRM system implementations improve operational
performance measures, either directly or indirectly. Vendors of CRM systems specifically list
increasing profitability as a primary benefit of implementing CRM systems (Taber 2013);
however, thus far the extant literature fails to document any empirical evidence supporting this
claim (Hendricks et al. 2007). We argue that regardless of which business processes are
improved by CRM system implementation (increases in sales or decreases in SGA expenses for
example), there should be some improvement in operational performance. Specifically, our
second hypothesis is as follows:
Hypothesis 2: Firms that implement CRM systems improve operational performance to
a greater degree than firms that do not implement CRM systems.
The final potential benefit that Taber (2013) identifies regarding CRM system
implementation is sales predictability. As mentioned earlier, CRM systems provide better
information for management regarding their customers. CRM systems allow management to
better track sales. Similar to the evidence that enterprise systems provide critical information to
assist managers in forecasting earnings (Dorantes et al. 2013), we predict that firms are able to
better predict future sales following CRM implementation, as evidenced by their earnings
forecasts. Specifically, our third hypothesis is as follows:
Hypothesis 3: Firms that implement CRM systems improve their sales predictability (as
evidenced by management earnings forecasts) to a greater degree than firms that do not
implement CRM systems.
III. RESEARCH DESIGN

12
To collect our sample we use Lexis-Nexis to search for press releases announcing the
implementation of CRM systems. These announcements are usually either made by the CRM
system vendor or the firm implementing the system. To identify the CRM systems
implementations, we search for the terms “CRM” or “Customer Relationship Management” and
then read through each press release individually to ensure that it does indeed represent a new
CRM system implementation. We then identify the firm that is implementing the CRM system.
Through this process we are able to identify 138 public firms that adopt a CRM system sometime
during the years of 2001-2011. We then eliminate 51 of these observations because they either
do not have the necessary data available to compute our financial variables in Compustat, or
because we are unable to find an appropriate matching control firm. Therefore, we end with 87
CRM system implementers with the appropriate data available.
We follow Hendricks et al. (2007) in identifying our control sample. For each treatment
firm we identify all firms that are within the same industry using the two-digit SIC code. We
then identify all potential control firms with ROA within 90-110% the treatment firm in the year
of the CRM system implementation announcement.2 We develop these guidelines following
Hendricks et al. (2007) and Barber and Lyon (1996). The authors of these papers document the
importance of using a portfolio of firms for the comparison group, and that utilizing this method
allows for well-specified and powerful test statistics. Using this method, we have a final sample
of 1,256 observations, 87 treatment observations and 1,169 control observations.3 Panel A of
Table 1 provides the distribution of the sample across time. It appears that CRM system
2 We verify that ROA is not statistically significantly different between our treatment and control firms in year t-1,
or the year prior to CRM system implementation for our treatment firms. 3 Due to data restrictions, our sample is reduced to 342 for our tests of management earnings forecasts.
13
implementations were more frequent in the early 2000s and then taper off over time.4 Panel B of
Table 1 provides an industry distribution of our sample. It appears that firms in service
industries are the most common adopter of CRM systems, but the sample appears to be
somewhat evenly distributed among all industries. Table 2 provides definitions for the variables
used throughout the paper. Finally, Table 3 provides descriptive statistics for all of the
observations in the pre-implementation period.
We use a difference-in-differences approach to examine changes in performance
measures over a four year period. We essentially examine the change in our measures from year
t-1 (the year before the implementation announcement) to year t+2 (the second year following
the implementation announcement. We choose this time frame because prior literature suggests
that CRM systems take approximately one year to fully implement (Hendricks et al. 2007).
Therefore, year t-1 is the last year before CRM system implementation begins, and year t+2 is
the first full year of operations with the CRM system implemented. This allows us to examine
actual performance without the effects of any costs directly related to the CRM system
implementation. Since our sample includes two years for each firm (the pre and post years), our
final sample consists of 2,512 observations, 174 treatment observations and 2,338 control
observations.
To examine how CRM systems potentially benefit firms, we investigate whether CRM
system implementations affect a selection of performance variables. We therefore use the
following OLS regression model to test our Hypotheses 1 and 2 (see Table 2 for variable
definitions):
4 Our number of control firms does not matchup 1 to 1 with our treatment firms, because as discussed we retain all
possible control observations that meet the matching criteria.

14
[Performance Measures]i,t = λ0 + λ1CRMi,t + λ2Afteri,t + λ3CRM*Afteri,t + λ4Sizei,t +
λ5MTBi,t + λ6RDi,t-1 + λ7ADVi,t-1 + λ8ROAi,t-1 + λ8CapInti,t-1 + зi,t (1).
For all of the models, we include year and industry fixed effects, and estimate robust standard
errors clustered by firm following Petersen (2009).
Our variable of interest is the interaction of CRM and After. This coefficient (λ3) should
measure the effect of CRM system implementations during the post implementation year. We
run the model numerous times using different Performance Measures as the dependent variable.
For our first hypothesis, we are interested in direct measures of business process improvementy.
Therefore, we use Sales, Sales Scaled, Oper Margin, SGA, SGA Scaled, ARTurn, Doubtful, and
Doubtful Scaled as our dependent variables for testing Hypothesis 1. We expect λ3 to be positive
and significant for Sales, Sales Scaled, Oper Margin, and ARTurn. We expect λ3 to be positively
related to Oper Margin because a larger operating margin indicates better operational efficiency.
Essentially, the operating margin is a measure of what percentage of each dollar of sales
becomes profit. We expect λ3 to be positively associated with ARTurn because we expect firms
to be able to more effectively and efficiently collect on their accounts receivables. We expect λ3
to be negative and significant for SGA, SGA Scaled, Doubtful, and Doubtful Scaled. 5 We predict
that CRM systems reduce the amount the companies will need to spend on SGA expenses to
make sales. We expect λ3 to be negatively associated with both of our allowance for doubtful
accounts variables. These results would suggest that CRM systems positively impact our
business process measures of sales, sales efficiency, and accounts receivable collectability.
5 In our tests of SGA and SGA Scaled we do not include RD, ADV, or CAPINT in the model due to the mechanical
relationship of those variables.

15
For our second hypothesis, we are interested in measuring the effect of CRM systems on
operational performance. We use ROA, CFO, and CFO Scaled as our dependent variables to test
Hypothesis 2. We expect λ3 to be positively associated with all of these dependent variables,
indicating that CRM system implementations positively improve operational performance, either
directly or indirectly (paths 1 and 3 in Figure 1).
We include control variables based on prior literature that investigates firm performance
(Hendricks et al. 2007; Campbell 2014). We control for size (Size) and growth (MTB) factors
that prior literature finds is associated with performance. Additionally, prior literature finds that
prior performance is one of the best determinants of future performance, and therefore we
include lagged values of RD, ADV, ROA, and CapInt. Finally, as suggested by Hendricks et al.
(2007), we include a control for industry and time effects by including year and industry fixed
effects.
For our third hypothesis, we are interested in the effect that CRM systems have on
earnings predictability, and therefore consider management earnings forecasts. We use the
following OLS regression model to test Hypothesis 3 (see Table 2 for variable definitions):
Abs_Errori,t = β0 + β1CRMi,t + β2Afteri,t + β3CRM*Afteri,t +β4Sizei,t + β5ROAi,t + β6Lossi,t
+ β7Leveragei,t + β8EarnVoli,t + β9CFOVoli,t + β10Growthi,t + β11IndConi,t + β12Big4i,t +
β13LnAnalystsi,t + β14Std_AFi,t + β15Surprisei,t + β16Horizonj,i,t + β17Litigationi,t + β18High
Techi,t + β19Weaki,t + εi,t (2).
For this model we include year fixed effects and estimate robust standard errors clustered by
firm. Abs_Error is the absolute value of management forecast error, measured as realized
earnings less the management forecast, scaled by the closing stock price on the last day of the
previous fiscal year. Therefore, a larger number is an indicator of greater error and less accurate

16
forecasts. Our variable of interest is again the interaction of CRM and After. We predict that
CRM systems make it easier for firms to predict earnings. Following CRM system
implementation management earnings forecasts should be more accurate. Therefore, we predict
β3 to be negative, indicating more accurate forecasts.
We include additional independent variables to control for other factors that can possibly
affect management forecast quality based on prior literatures. Because larger firms tend to have
more experienced and knowledgeable staff, we expect firm size (Size) to be positively associated
with management forecast accuracy (Kasznik and Lev 1995). Prior literature also finds that
more profitable firms tend to make more accurate forecasts and therefore we include ROA (Baik
et al. 2011). Based on Hayn’s (1995) findings that earnings of loss firms are less informative
than profitable firms, other papers find a negative relationship between Loss and the accuracy of
earnings forecasts. Feng et al. (2009), similarly find financially challenged firm issue less
accurate forecasts, which is why we include both Loss and Leverage. We include EarnVol and
CFOVol because other papers find that firms with highly volatile earnings face greater difficulty
in issuing accurate forecasts (Feng et al. 2009; Dorantes et al. 2013). Feng et al. (2009) also find
that firms with greater sales Growth tend to issue less accurate forecasts. Bamber and Cheon
(1998), find that industry competitive pressures can influence disclosures, and we thus include
IndCon. The extant literature shows that clients of Big4 auditors tend to issue more accurate
earnings forecasts (Lang and Lundholm 1993; Ajinkya et al. 2005; Feng et al. 2009). The prior
literature also finds relationships between analyst behavior and management forecast accuracy.
Specifically, this research finds that greater analyst following creates pressure for higher quality
disclosure, while more analyst dispersion signifies greater forecasting difficulty, and therefore
we include both LnAnalysts and Std_AF (Ajinkya and Gift 1984; Swaminathan 1991; Lang and

17
Lundholm 1996; Ajinkya et al. 2005). The management forecast literature shows that it is more
difficult to forecasts earnings further from the period end, which we control for using Horizon
(Baginski and Hassell 1997; Ajinkya et al. 2005). We include Litigation and High Tech, to
control for the fact that firms that operate in more litigious and high tech industries face different
disclosure pressures (Francis et al. 1994). Finally, recent literature finds that firms with poor
internal controls release earnings forecasts that are less accurate, which we control for by
including Weak (Feng et al. 2009; Li et al. 2012).
IV. RESULTS
Table 4 presents univariate results of comparisons between CRM implementation firms
and our control firms. We compare CRM firms to control firms both before and after the CRM
implementation. In addition, we compare CRM to themselves from before the implementation to
after the CRM system implementation. It is not surprising that due to our matching criteria, in
the before implementation period, the treatment and control firms are quite similar to each other.
The only significant differences are in Sales (unscaled), CFO (unscaled), Doubtful, Abs_Error,
and Size. We next compare CRM implementation firms to themselves from before
implementation to after. With the exception of ROA and Abs_Error, none of these differences
are statistically different. However, most of the variables change in the direction that we expect.
For example, in the after implementation period, our treatment firms appear to report higher
ROA, Sales, and Cash Flows from operations. They also report lower SGA expense, greater
ARTURN, and a lower balance in the allowance for doubtful accounts. While most of these
differences are not statistically significant it does suggest that when we control for market
changes utilizing our difference in differences multivariate approach we may see significant
results. Finally, we compare our treatment and control firms in the period after implementation.

18
The only significant differences are the same as the pre-implementation period, but the
difference is in the opposite direction for Abs_Error suggesting CRM system implementers
improve their management earnings forecast accuracy.
Tables 5, 6, and 7 present the regression results for our tests of Hypothesis 1, regarding
the direct effects of CRM system implementations on business process measures. In Table 5, we
specifically examine the effect of CRM systems implementations on sales. The coefficient on
the interaction of CRM and After represents how the CRM implementers improved their
performance over the four-year period from one year before CRM implementation to two years
after implementation compared to control observations over the same four-year period. The
positive and significant coefficient in both Columns 1 and 2 suggests that CRM systems allow
companies to improve their sales as raw sales and total sales scaled by total assets increased at a
greater rate than for control firms. This suggests the firms that implement CRM systems are able
to improve their sales business process allowing them to attract new customers, and make more
sales to existing customers. Overall, the evidence supports our first hypothesis suggesting that
CRM systems do positively affect business processes.
Table 6 presents the regression results for our tests of sales efficiency. For all three
columns, our coefficient of interest is in the predicted direction and is significant (p<0.10). The
positive and significant coefficient in Column 1 suggests that CRM systems improve the
operating margin for firms that choose to implement them. This suggests that firms are making
more profit off of each dollar of sales following CRM system implementation. The negative and
significant coefficients in both Columns 2 and 3 suggest that these firms are spending less than
control firms on SGA expenses as scaled by both sales and total assets. Essentially, firms are
spending less than control firms on SGA expenses following CRM implementation without
19
sacrificing sales. These results further support our first hypothesis, because they show that CRM
systems improve business processes that affect sales efficiency. This is important for firms
because it allows them to do more with less money.
Table 7 presents the regression results for our tests of effect of CRM systems
implementations on firms’ ability to collect accounts receivable. Our coefficient of interest is in
the predicted direction for all three columns, but it is only statistically significant (p<0.10) in
Columns 2 and 3. The positive coefficient in Column 1 suggests improvements to the accounts
receivable turnover ratio; however, the result is not statistically significant so we do not draw any
conclusions from this result. The negative and significant coefficients in Columns 2 and 3 show
that firms that implement CRM systems reduce their allowance for doubtful accounts to a greater
degree than control firms. This suggests that firms are more confident in their ability to collect
accounts receivable following CRM system implementation, further supporting our first
hypothesis.
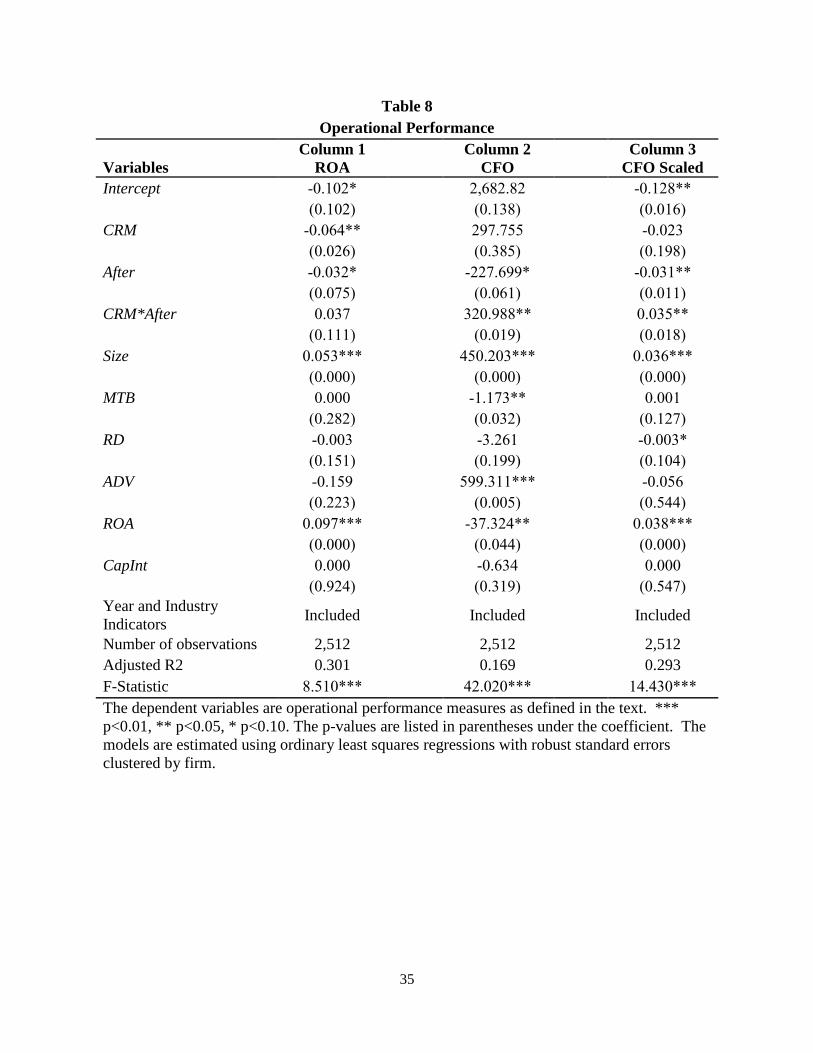
Table 8 presents the results of testing our second hypothesis regarding CRM systems and
operation performance. We predict that firms that implement CRM systems should experience
improved operational performance, either directly through the CRM implementation or indirectly
due to the business process improvements examined in Hypothesis 1. In Column 1, we find that
our coefficient of interest is approaching significance (p=0.111). This indicates that while it
appears that CRM systems may positively impact ROA, signifying an increase in profitability,
the results are not quite statistically different from zero. However, the coefficient is positive and
significant in both of the remaining columns (p<0.10). The positive and significant coefficient in
both Columns 2 and 3 show that CRM system firms experienced a greater increase in operational

20
cash flows than control firms. Overall, we find marginal evidence supporting our second
hypothesis.
Finally, Table 9 presents the results of the test of our third hypothesis regarding CRM
systems and earnings predictability. In this test we examine whether the implementation of
CRM systems affect management earnings forecasts. Our coefficient of interest is negative and
significant (p=0.012), indicating a lower forecast error and more accurate management earnings
forecasts. As we predicted, firms that implement CRM systems are able to forecast future
earnings more accurately than control firms following the implementation of the system. This
supports our fourth hypothesis because this suggests that CRM systems are associated with
earnings predictability.
V. CONCLUSION
The extant literature documents numerous benefits firms received from implementing
new IT, especially ERP systems. However, despite vendor claims of how CRM systems can
improve numerous facets of companies that adopt them, thus far the extant literature fails to
empirically document any operational benefits of CRM systems. Using a sample of firms that
implement CRM systems, we examine a collection of possible benefits for firms that choose to
adopt these systems.
Our analysis provides evidence of numerous operational benefits these systems provide
for firms. Specifically, we find that following CRM system implementation firms show
improvements in operational performance, operational efficiency, accounts receivable
collectability, and earnings predictability. These results are evidenced through increases in sales
and operational cash flows, a reduction to the operating margin, a reduction of the allowance for

21
doubtful accounts, more accurate management earnings forecasts, and improvements to other
similar performance measures.
We extend the literature that examines the benefits of ES, by examining a specific type of
system that has thus far not been fully investigated. Our study should be of interest to vendors of
CRM systems and firms interested in implementing them as we show numerous benefits these
firms can receive if they choose to do so. Overall, we find support for the positive implications
of CRM system implementation.

22
REFERENCES
Ajinkya, B., S. Bhojraj, and P. Sengupta. 2005. The association between outside directors,
institutional investors and the properties of management forecasts. Journal of Accounting
Research 43 (3): 343-76.
———, and M. Gift. 1984. Corporate managers’ earnings forecasts and symmetrical
adjustments of market expectations. Journal of Accounting Research 22: 425-444.
Baginski, S. P., and J.M. Hassell———. 1997. Determinants of management forecast
precision. The Accounting Review 72: 303-12.
Baik, B., D. Farber, and S. Lee. 2011. CEO ability and management forecasts. Contemporary
Accounting Research 28 (5): 1645-68.
Barber, B. M., and J. D. Lyon. 1996. Detecting abnormal operating performance: The empirical
power and specification of test statistics. Journal of Financial Economics 41: 359–399.
Boulding, W., R. Staelin, M. Ehret, and W. Johnston. 2005. A customer relationship
management roadmap: What is known, potential pitfalls, and where to go. Journal of
Marketing 69 (4): 155–166.
Brazel, J. F., and L. Dang. 2008. The effect of ERP system implementations on the management
of earnings and earnings release dates. Journal of Information Systems 22 (2): 1-21.
Brynjolfsson, E., and L. M. Hitt. 1995. Computers as a factor of production: The role of
differences among firms. Journal of Economic Innovation and New Technologies 3
(May): 183-199.
———, and ———. 1996. Paradox lost? Firm-level evidence on the returns to information
systems spending. Management Science 42 (4): 541-560.
Campbel, J. L. 2014. The fair value of cash flow hedges, future profitability, and stock returns.
Contemporary Accounting Research Forthcoming.
Carr, N. G. 2003. IT doesn’t matter. Harvard Business Review May: 5-12.
Danaher, P. J., D. M. Conroy, and J. R. McColl-Kennedy. 2008. Who wants a relationship
anyway?: Conditions when consumers expect a relationship with their service
provider. Journal of Service Research 11 (1): 43–52.
Dehning, B., and V. J. Richardson. 2002. Returns on investments in information technology: A
research synthesis. Journal of Information Systems 16 (1): 7-30.

23
———, ———, and R. W. Zmud. 2007 The financial performance effects of IT-based supply
chain management systems in manufacturing firms. Journal of Operations Management
25: 806-824.
Devaraj, S., and R. Kohli. 2003. Performance impacts of information technology: Is actual usage
the missing link? Management Science 49: 273–289.
Dewan, S. and C. Min. 1997. The substitution of information technology for other factors of
production: A firm level analysis. Management Science 43 (12): 1660-1675.
Dorantes, C, C. Li, G. Peters, and V. Richardson. 2013. The effect of enterprise systems
implementation on the firm information environment. Contemporary Accounting
Research Forthcoming.
Dowling, G. R. 2002. Customer relationship management: In B2C markets, often less is
more, California Management Review 44 (3): 87–103.
Feng, M., C. Li, and S. McVay. 2009. Internal control and management guidance. Journal of
Accounting and Economics 48 (2-3): 190-209.
Francis, J., D. Philbrick, and K. Schipper. 1994. Shareholder litigation and corporate
disclosures. Journal of Accounting Research 32: 137-64.
———, and Schipper, K. (1999). Have financial statements lost their relevance? Journal of
Accounting Research 37 (2:, 319-352.
Gartner, Inc. 2011. Gartner. http://www.gartner.com/it/page.jsp?id=1728615, retrieved
September 30, 2014.
Gartner, Inc. 2014. Garrner. http://www.gartner.com/newsroom/id/2665215, retrieved
September 30, 2014.
Hayn, C. 1995. The information-content of losses. Journal of Accounting & Economics 20:
125-53.
Hendricks, K. B., V. R. Singhal, and J. K. Stratman. 2007. The impact of enterprise systems on
corporate performance: A study of ERP, SCM, and CRM system implementations.
Journal of Operations Management 25: 65-82.
Hitt, L., and E. Brynjolfsson. 1996. Productivity, profit and consumer welfare: Three different
measures of information technology. MIS Quarterly 20 (2): 121-142.
———, D. J. Wu, and X. Zhou. 2002. Investment in enterprise resource planning: Business
impact and productivity measures. Journal of Management Information Systems 19 (1):
71-98.

24
Kasznik, R., and B. Lev. 1995. To warn or not to warn: Management disclosures in the face of
an earnings surprise. The Accounting Review 70 (1): 113-134.
Klaus, H., M. Rosemann, and G. G. Gable. 2000. What is ERP? Information Systems Frontiers 2
(2): 141.
Kobelsky, K., V. J. Richardson, R. E. Smith, and R. W. Zmud. 2008. Determinants and
consequences of firm information technology budgets. The Accounting Review 83 (4):
957-995.
Koch, C. 2004. When bad things happen to good projects. CIO Magazine, December 1.
Koch, C. 2007. Nike rebounds: How (and why) Nike recovered from its supply chain disaster.
CIO Magazine, June 15.
Landauer, T. K. 1995. The Trouble with Computers. Cambridge, MA: MIT Press.
Lang, M., and R. Lundholm. 1996. Corporate disclosure policy and analyst behavior. The
Accounting Review 71 (4): 467-92.
Li, C., G. F. Peters, V. J. Richardson, and M. W. Watson. 2012. The consequences of
information technology control weaknesses on management information systems: The
case of Sarbanes-Oxley internal control reports. MIS Quarterly 36 (1): 179-204.
Mithas, S., M. S. Krishnan, and C. Fornell. 2005. Why do customer relationship management
applications affect customer satisfaction? Journal of Marketing 69 (4): 201-209.
Nicolaou, A. I. 2004. Firm performance effects in relation to the implementation and use of
enterprise resource planning systems. Journal of Information Systems 18 (2): 79-105.
Payne, A., and P. Frow. 2005. A strategic framework for customer relationship management.
Journal of Marketing 69 (4): 167-176.
Petersen, M. 2009. Estimating standard errors in finance panel data sets: Comparing approaches.
Review of Financial Studies 22 (1): 435-480.
Rai, A., S. Lang, and R. Welker. 2002. Assessing the validity of IS success models: An
empirical test and theoretical analysis. Information Systems Research 13: 50-69.
Shang, S., and P. B. Seddon. 2002. Assessing and managing the benefits of enterprise systems:
The business manager’s perspective. Information Systems Journal 12 (2): 271-299.
Spathis, C. 2006. Enterprise systems implementations and accounting benefits. Journal of
Enterprise Information Management 19 (1/2): 67-82.
25
Stratopoulos, T., and B. Dehning. 2000. Does successful investment in information technology
solve the productivity paradox? Information and Management 38 (2): 103-117.
Sutton, D., and T. Klein. 2003. Enterprise Marketing Management, New Jersey: John Wiley &
Sons, Inc.
Swaminathan, S. 1991. The impact of SEC mandated segment data on price variability and
divergence of beliefs. The Accounting Review 66: 23-41.
Taber, D. 2013. 3 ways CRM improves your business processes. CIO.
http://www.cio.com/article/2381249/customer-relationship-management/3-ways-crm-
improves-your-business-processes.html, retrieved September 30, 2014.
Taber, D. 2014. With CRM data, more isn’t always merrier. CIO.
http://www.cio.com/article/2377570/customer-relationship-management/with-crm-data--
more-isn-t-always-merrier.html, retrieved September 30, 2014.
Venkatesh, V., and H. Bala. 2008. Technology acceptance model 3 and a research agenda on
interventions. Decision Sciences 39 (2): 273-315.
Weil, P. 1992. The relationship between investment in information technology and firm
performance: A study of the valve manufacturing sector. Information Systems Research
3 (4): 307-333.
26
Figure 1
Framework for the Benefits of IT Investments (adapted from Dehning and Richardson
2002)
Direct Effects
Indirect Effects
1
2 3
Information
Technology
Impact of IT on the Firm
Business
Processes
Firm
Performance
As Measured by Researchers
Information
Technology Measures:
1. Spending
2. Strategy
3. Management
or Capability
Process Measures:
1. Sales
2. Operating
Margin
3. SGA Expenses
4. AR Turnover
Firm Performance
Measures:
A. Market
B. Accounting
a. ROA
b. Cash Flows

27
Table 1
Sample Statistics
Panel A: Year Distributions
Year
CRM
Implementations
Control
Firms All Firms
2001 13 108 121
2002 22 304 326
2003 11 152 163
2004 13 288 301
2005 10 174 184
2006 11 89 100
2007 3 12 15
2008 1 13 14
2009 2 15 17
2010 0 0 0
2011 1 14 15
Total 87 1,169 1,256
Panel B: Industry Distributions
Industry 2-Digit
SIC Code
CRM
Implementations
Control
Firms
All Firms
Chemicals 28-29 6 101 107
Electrical 36, 38 13 178 191
Equipment 35 5 39 44
Retail Sales 50-59 9 37 46
Services 70-79 16 375 391
All Others All Others 38 439 477
Total 87 1,169 1,256

28
Table 2. Variable Definitions
Panel A: Dependent Variable Definitions
Variable Definition
ROA the return on assets calculated as net income before extraordinary items
divided by total assets in year t.
Sales the raw amount of sales in year t.
Sales Scaled sales scaled by total assets in year t.
CFO total cash flows from operations in year t.
CFO Scaled total cash flows from operations scaled by total assets in year t.
Oper Margin the operating margin calculated as total operating income divided by sales
in year t.
SGA total selling, general, and administrative expenses scaled by total sales in
year t.
SGA Scaled total selling, general, and administrative expenses scaled by total assets in
year t.
ARTurn accounts receivable turnover calculated as net sales divided by average
accounts receivable in year t.
Doubful the allowance for doubtful accounts in year t.
Doubtful Scaled the allowance for doubtful accounts scaled by sales in year t.
Abs_Error the absolute value of the management forecast error (realized earnings less
the management forecast) / lagged stock price.

29
Table 2. Variable Definitions
Panel B: Independent Variable Definitions
Variable Definition
CRM an indicator variable coded as one if the firm is a CRM implementer and
zero otherwise.
After an indicator variable coded as one for observations that occur after the
CRM implementation or the control year match and zero otherwise.
Size the natural log of total assets in year t.
MTB the market to book ratio calculated as the market value of equity divided by
the book value in year t.
RD total research and development expenses scaled by sales in year t.
ADV total advertising expenses scaled by sales in year t.
CapInt capital intensity calculated as total assets divided by total sales in year t.
Loss an indicator variable coded one if the firm reports a net loss in year t, and
zero otherwise.
Leverage total liabilities divided by total assets in year t.
EarnVol the standard deviation of ROA over the prior 10 years.
CFOVol the standard deviation of operating cash flows over the prior 10 years.
Growth percentage of sales growth from year t-1 to year t.
IndCon the Herfindahl index in year t, measured as the sum of the squares of the
market shares of all firms within the same three-digit SIC industry.
Big4 an indicator variable coded one if the firm engages a Big 4 auditor in year
t, and zero otherwise.
LnAnalysts the natural log of the number of analysts following the firm at the end of
year t.
Std_AF the standard deviation of the individual analyst forecasts for year t,
immediately prior to the management forecast for year t.
News the management forecast value less the pre-existing median analyst
forecast scaled by lagged stock price.
Horizon the number of days between the date of issuance for the management
forecast and the fiscal year end date.
Litigation an indicator variable coded one if the firm operates in an industry that is
associated with increased litigation (SIC codes 2833-2836, 3570-3577,
7370-7374, and 3600-3674 following Francis et al. 1994) and zero
otherwise.
High Tech an indicator variable coded one if the firm operates in a high tech industry
(as identified by Francis and Schipper 1999), and zero otherwise.
Weak an indicator variable coded one if the firm reports any material weaknesses
in internal controls in year t, and zero otherwise.

30
Table 3
Descriptive Statistics
Standard
Deviation
25th Percentile
Median
75th Percentile
Variable Mean
ROA -0.090 0.491 -0.025 0.012 0.056
Sales 2396.339 9105.019 36.813 118.381 785.727
CFO 463.985 2014.793 -0.351 12.713 110.919
Oper Margin -0.538 8.368 0.039 0.166 0.325
SGA 0.510 1.666 0.193 0.298 0.450
ARTurn 13.575 41.193 4.631 6.052 8.272
Doubtful 28.904 134.079 0.284 1.339 6.986
Abs_Error 0.010 0.010 0.003 0.007 0.016
CRM 0.070 0.255 0.000 0.000 0.000
Size 6.056 2.378 4.453 6.090 7.492
MTB 1.986 44.105 1.353 2.009 3.489
RD 0.455 6.373 0.000 0.000 0.110
ADV 0.017 0.081 0.000 0.000 0.125
CapInt 8.743 73.545 0.919 1.681 12.006

31
Table 4
Univariate Analysis
CRM-
Before
Control-
Before
CRM &
Control
Before
CRM-
After
CRM
Before
and After
Control-
After
CRM &
Control
After
N=87 N=1169 Difference P-Value N=87 Difference P-Value N=1169 Difference P-Value
Abs_Error 0.021 0.009 -0.012 <0.001*** 0.006 -0.015 <0.001*** 0.014 0.008 0.002***
ADV 0.016 0.017 0.000 0.995 0.015 -0.001 0.765 0.013 -0.002 0.502
ARTurn 11.428 13.791 2.363 0.623 15.995 4.567 0.386 11.195 -4.799 0.196
CapInt 2.781 9.191 6.411 0.439 4.628 1.848 0.472 6.224 1.596 0.294
CFO 1565.625 358.033 -1207.592 <0.001*** 1985.184 419.559 0.503 469.150 -1516.034 <0.001***
Doubtful 129.121 19.013 -110.107 <0.001*** 83.18 -45.941 0.255 25.833 -57.347 0.002***
MTB 3.393 1.880 -1.512 0.761 1.910 -1.483 0.292 1.072 -0.838 0.776
Oper Margin -0.084 -0.572 -0.488 0.604 -1.224 -1.140 0.431 -0.380 0.844 0.309
RD 0.221 0.473 0.252 0.753 1.198 0.977 0.412 0.248 -0.950 0.017**
ROA -0.310 -0.940 -0.630 0.254 0.020 0.331 0.075* -0.057 -0.077 0.135
Sales 10492.81 1787.851 -8704.959 <0.001*** 12494.68 2001.87 0.610 2433.191 -10061.489 <0.001***
SGA 0.319 0.524 0.205 0.275 0.294 -0.025 0.595 0.757 0.463 0.531
Size 7.693 5.933 -1.760 <0.001*** 7.896 0.203 0.567 6.226 -1.67 0.002***
All p-values are two-tailed. *, **, and *** represent significance levels of 0.10, 0.05, and 0.01 respectively.

32
Table 5
Business Process Improvements -- Sales
Column 1 Column 2
Variables Sales Sales Scaled
Intercept -9,471.530** 0.867***
(0.037) (0.000)
CRM 2,808.67 0.138**
(0.128) (0.041)
After -992.544** 0.100***
(0.019) (0.005)
CRM*After 2,103.457*** 0.062*
(0.008) (0.078)
Size 2,335.784*** -0.070***
(0.000) (0.000)
MTB -6.688*** 0.000
(0.003) (0.126)
RD -25.273** -0.001
(0.015) (0.774)
ADV 2,716.150*** -0.243**
(0.005) (0.017)
ROA -227.034** 0.013***
(0.018) (0.001)
CapInt -1.122 -0.002**
(0.678) (0.034)
Year and Industry Indicators Included Included
Number of observations 2,512 2,512
Adjusted R2 0.338 0.357
F-Statistic 24.130*** 140.590***
The dependent variables are business process measures as defined in the text. *** p<0.01, **
p<0.05, * p<0.10. The p-values are listed in parentheses under the coefficient. The models
are estimated using ordinary least squares regressions with robust standard errors clustered by
firm.

33
Table 6
Business Process Improvements – Sales Efficiency
Column 1 Column 2 Column 3
Variables Oper Margin SGA SGA Scaled
Intercept -2.602*** 2.723** 0.336***
(0.007) (0.023) (0.000)
CRM -0.378** 0.199 0.108***
(0.039) (0.140) (0.000)
After 0.209 0.012 0.063***
(0.414) (0.879) (0.001)
CRM*After 0.443** -0.273* -0.025*
(0.049) (0.069) (0.090)
Size 0.232*** -0.197** -0.070***
(0.000) (0.027) (0.000)
MTB 0.009 -0.008 -0.000
(0.337) (0.387) (0.133)
RD -0.411***
(0.000)
ADV -1.458
(0.231)
ROA 0.294*** -0.366*** -0.066***
(0.000) (0.000) (0.000)
CapInt -0.107***
(0.000)
Year and Industry
Indicators Included Included
Included
Number of observations 2,512 2,512 2,512
Adjusted R2 0.647 0.040 0.419
F-Statistic 25.360*** 20.460*** 80.550***
The dependent variables are business process measures as defined in the text. *** p<0.01, **
p<0.05, * p<0.10. The p-values are listed in parentheses under the coefficient. The models are
estimated using ordinary least squares regressions with robust standard errors clustered by firm.

34
Table 7
Business Process Improvements -- Receivables Collectability
Column 1 Column 2 Column 3
Variables ARTurn Doubtful Doubtful
Scaled
Intercept 20.110*** -121.082** 0.003
(0.003) (0.041) (0.655)
CRM -2.176 66.951*** 0.010*
(0.372) (0.000) (0.067)
After -4.718* 0.357 0.006**
(0.098) (0.969) (0.035)
CRM*After 0.971 -50.857*** -0.010**
(0.279) (0.010) (0.041)
Size -1.217*** 19.636*** -0.003***
(0.003) (0.000) (0.002)
MTB 0.005 -0.052 -0.000
(0.654) (0.469) (0.266)
RD 1.544*** 0.057 -0.003***
(0.000) (0.917) (0.004)
ADV 16.364 35.218 0.056
(0.220) (0.352) (0.322)
ROA 0.502*** -1.651 -0.000
(0.000) (0.215) (0.274)
CapInt 0.019 -0.047 0.001***
(0.788) (0.719) (0.004)
Year and Industry
Indicators Included Included
Included
Number of observations 1,558 1,558 1,558
Adjusted R2 0.121 0.202 0.176
F-Statistic 3.690*** 15.070*** 5.560***
The dependent variables are business process measures as defined in the text. *** p<0.01, **
p<0.05, * p<0.10. The p-values are listed in parentheses under the coefficient. The models are
estimated using ordinary least squares regressions with robust standard errors clustered by firm.
35
Table 8
Operational Performance
Column 1 Column 2 Column 3
Variables ROA CFO CFO Scaled
Intercept -0.102* 2,682.82 -0.128**
(0.102) (0.138) (0.016)
CRM -0.064** 297.755 -0.023
(0.026) (0.385) (0.198)
After -0.032* -227.699* -0.031**
(0.075) (0.061) (0.011)
CRM*After 0.037 320.988** 0.035**
(0.111) (0.019) (0.018)
Size 0.053*** 450.203*** 0.036***
(0.000) (0.000) (0.000)
MTB 0.000 -1.173** 0.001
(0.282) (0.032) (0.127)
RD -0.003 -3.261 -0.003*
(0.151) (0.199) (0.104)
ADV -0.159 599.311*** -0.056
(0.223) (0.005) (0.544)
ROA 0.097*** -37.324** 0.038***
(0.000) (0.044) (0.000)
CapInt 0.000 -0.634 0.000
(0.924) (0.319) (0.547)
Year and Industry
Indicators Included Included Included
Number of observations 2,512 2,512 2,512
Adjusted R2 0.301 0.169 0.293
F-Statistic 8.510*** 42.020*** 14.430***
The dependent variables are operational performance measures as defined in the text. ***
p<0.01, ** p<0.05, * p<0.10. The p-values are listed in parentheses under the coefficient. The
models are estimated using ordinary least squares regressions with robust standard errors
clustered by firm.

36
Table 9
Management Earnings Forecast Error
Column 1
Variables Absolute Forecast Error
Intercept 0.030***
(0.000)
CRM 0.005
(0.243)
After -0.004
(0.136)
CRM*After -0.008**
(0.012)
Size -0.000
(0.865)
ROA -0.136***
(0.000)
Loss 0.034***
(0.000)
Leverage -0.002
(0.678)
EarnVol -0.098
(0.103)
CFOVol 0.052
(0.150)
Growth -0.011
(0.111)
Big4 0.002
(0.575)
LnAnalysts -0.003
(0.191)
Std_AF 0.014
(0.250)
News 0.296**
(0.027)
Horizon 0.000***
(0.000)
Weak -0.004
(0.176)
Year Indicators Included
Industry Controls Included
Number of
observations 342
Adjusted R2 0.560
F-Statistic 14.330***
The dependent variable is forecast error measured as the absolute value of management
forecast error, (realized earnings less the management forecast amount)/lagged stock
price. *** p<0.01, ** p<0.05, * p<0.10. The p-values are listed in parentheses under the
coefficient. The models are estimated using ordinary least squares regressions with
robust standard errors clustered by firm.