the effect of consumption taxes on poverty and income...
TRANSCRIPT

International Journal of Accounting and Taxation December 2017, Vol. 5, No. 2, pp. 56-82
ISSN: 2372-4978 (Print), 2372-4986 (Online) Copyright © The Author(s). All Rights Reserved.
Published by American Research Institute for Policy Development DOI: 10.15640/ijat.v5n2a5
URL: https://doi.org/10.15640/ijat.v5n2a5
The Effect of Consumption Taxes on Poverty and Income Inequality in Kenya
Anne Wanyagathi Maina1
Abstract
Kenya faces high poverty level with the 47 per cent of the population living below the poverty line. The Gini coefficient was 0.445 in 2013, an indication of high inequality in welfare of the people (KNBS and SID, 2013). Consumption tax contributes significantly to total collections and was about 39 per cent of total tax revenues in 2015 (KNBS, 2016). There have been continuous reforms in the administration of consumption taxes. With the global agenda giving high priority to poverty eradication and enhancing equity, a study focusing on how consumption taxes influences income distribution is crucial. This paper investigates how consumption taxes can be used to reduce poverty and promote income equality in Kenya. Two OLS models are estimated; one to show the effect of consumption on income inequality and the other to show how consumption taxes influence welfare through its effect on GDP per capita. The findings confirm that consumption taxes are regressive. Consumption tax is positively related to GDP per capita. The research recommends restricted use of differentiated rates. The differentiated rate should be well targeted to the poor; lower rates are to be applied on basic goods which the poor spend more of their income on compared to the rich. Taxes collected can be utilized to provide essential facilities targeting the poor. It is necessary for the government to ensure the tax system is efficient and at the same time it redistributes wealth
1.0 Introduction
1.1 Background
The ultimate purpose of a tax system of any government is to raise sufficient revenue to finance its expenditure. A tax system constitutes of a legal structure that govern the implementation of the various tax types such as income tax, consumption tax, trade tax and social contributions. Countries determine the composition of their taxes and the tax rate. The theory of optimal taxation looks at the tax design that seeks to maximize social welfare. The design of the tax system determines its redistribution ability (Diamond and Mirrlees, 1971; Atkinson and Stiglitz, 1976; Saez, 2002). The trend of taxes has been changing over time in terms of the rates and the revenue share. According to Bahl and Bird (2008), developing countries have been leaning more towards indirect taxes than direct taxes; Indirect taxes are easier to administer. VAT has replaced trade taxes (Bahl and Bird, 2008). In contrast, developed countries have been relying more on direct taxes; the developed countries have more formalized structures in place that facilitate administration of direct taxes. The OECD has moved towards lower income tax rates and higher VAT rates; the share of corporation income tax and VAT has increased while that of personal income tax and excise duty has fallen. The changes in the tax system are effected through modification of the tax legislation. Kenyan government in a bid to raise more revenue makes amendments to the tax legislation from time to time. The Finance Act (2014) reintroduced capital gains tax, which was seen as a way of expanding revenue base without imposing a burden on the low income earners. In 2013, the old VAT Act was repealed and replaced with a new one.
1 Kenya Revenue Authority (KRA),Deutsche Gesellschaft für Internatioanale Zusammenarbeit (GIZ) GmbH, Berlin School of Economics and Law (BSEL),
Anne Wanyagathi Maina 57
VAT was introduced to goods that were previously exempt or zero-rated to raise more revenue and also simplify the tax system (GoK, 2013). The VAT rate of 12 per cent on fuel, oils and electrical energy was increased to the standard rate of 16 per cent. The range of excisable products has been widened. The Finance Act (2012) introduced excise duty on service fees charged by financial institutions and mobile money transfer services. The introduction of indirect taxes on previously exempt goods aggrieved the public, but raised significant revenue. Some of the items affected were processed foods, books, computers, mobile phones, machinery and agricultural implements. Most of these goods and services are consumed by lower income earners hence the justification of exemption in the first place. The reason for exemptions and zero-rating is to enhance equity by making the necessities affordable to low income earners. The removal of such exemptions is therefore likely to affect the income distribution and the poverty levels. Too many exemptions however make the tax system more complicated and may create loopholes in the system. The UN estimates that one out of five people in developing countries live in poverty. The poverty level in Kenya is high, poverty ratio was 46.7 per cent in 2005 (World Bank, 2006). The inequality is also high, the Gini was estimated to be about 0.57 for 2005 (World Bank, 2006). One of the country’s long-term goals in its Vision 2030 is to enhance equity and eradicate poverty. This is in line with the global agenda to end extreme poverty and enhance equitable resource distribution. Inequality around the world has been rising, with the richer becoming richer and the poor poorer (Milanovic, 2011). It is a universal problem around the world. In Kenya, there is a wide income gap between the rich and poor, and also between the rural and urban populations. 45 per cent of the population live below the poverty line, and the Gini coefficient is estimated at 0.445 (KNBS and SID, 2013). The consumption expenditure of the top 10 per cent is 121 times that of the bottom 10 per cent (KNBS and SID, 2013). Kenyan government has made efforts to reduce the income gap through projects like Kazi kwa Vijana, Constituency Development Fund (CDF), Local Authority Transfer Fund (LATF), Youth Development Fund, and Uwezo Fund (GoK, 2005). These projects provide funds to finance economic activities that generate income for the poor. Despite these efforts, there are still many people living in poverty in the country and inequity in resource distribution.
Further, increase in the income gap between the poor and the rich has detrimental effect on the economic welfare of the people. Inequality in income distribution affects the economic growth of a country negatively (Alesina and Rodrik, 1994). Great inequality is normally associated with social problems such as high crime rate, civil wars and political instability, and destroys democracy: Most studies support the negative relationship between income inequality and economic growth (Alesina and Rodrik, 1994; Perotti, 1996; Cingano, 2014). Income inequality can also be good for growth enabling more savings and hence capital accumulation (Kaldor, 1955). Taxes affect distribution of income (Martinez-Vazquez, et al., 2012; Saez, 2010; Karingi and Wanjala, 2005).Poverty and income inequality are both aspects of income distribution. Their high levels necessitate the need for understanding how taxes can be used to alleviate these social problems. Research has investigated the distribution efficiency of different taxes both across countries and at a country level (Chu et al., 2000; Martinez-Vazquez, et al., 2012; IMF, 2014). However, no study has been conducted on the distributional effect of consumption taxes in Kenya.
1.2 Statement of Research Problem
Governments aim to improve and increase the welfare of all their citizens. The average economic growth rate is about 5 per cent for the last 3 years (KNBS, 2016). However, this growth has not benefited the poor (Kabubo-Mariara et al., 2013). Kenya aims to be a middle income country with a high sustainable growth rate of 10 per cent (Vision 2030). All citizens should benefit from this economic growth. However, this will not be possible when poverty and inequality persists. High inequality reduces the efficiency of economic growth in fighting poverty (KNBS and SID, 2013). It is therefore important to fight poverty and promote equity in distribution of income and wealth, for the good of the country. Various fiscal measures on social spending such as loans to the youth and Constituency Development Fund have been unable to achieve the desired level of income redistribution. Taxes can be used to redistribute income, the extent to which is debatable (Rosen and Gayer, 2014). Taxes can directly influence the income distribution depending on the impact of tax, or indirectly depending on how tax revenue is spent. Governments need to strike a balance between efficiency and income redistribution when designing a tax system (IMF 2014; Diamond and Mirrlees, 1971).
58 International Journal of Accounting and Taxation, Vol. 5(2), December 2017
A number of studies have been done on fiscal policy and income distribution, taxes (both direct and indirect
tax) and distributive efficiency, but none has focused on taxes and income distribution in Kenya. Literature has not availed information on how the gradual changes in the Kenyan tax system have affected income distribution in the country.
Policy making on the matter is challenging task due to lack of sufficient and current information and data,
and the measurement indices used may not cover all aspects of poverty and inequality. This paper sheds more light on the issue by conducting an empirical analysis to determine how changes in various taxes have affected poverty and income distribution, putting an emphasis on the consumption taxes.
1.3 Research objectives
The main objective of the research is to investigate how taxes affect poverty and income distribution in Kenya.
The specific objectives are:
• Show the trend of consumption taxes in Kenya • examine how the trend affects poverty level in Kenya • Investigate the effect of consumption taxes on income redistribution in Kenya • Make policy recommendations
1.4 Research questions
This paper aims to answer questions normally asked by policy makers who aim at improving welfare of the population. The two main questions are:
1. Can we use consumption taxes as a tool to redistribute income? 2. Can we use consumption taxes to reduce the level of poverty?
1.5 Scope and organization of the paper
The research utilizes secondary data from KNBS, KRA and World Development Indicators from World Bank. It covers a period of 44 years commencing 1970 to 2014. Section two shows the current situation in Kenya by analyzing the trend of taxes and income distribution in the country. Section three is a synthesis of literature followed by section four on methodology, and five on findings and discussions. The final section gives recommendations from findings and concludes.
2.0 Trend of Taxes, Income Inequality and Poverty in Kenya
This section describes the economic status of the country and gives a brief history of taxes, inequality and poverty in Kenya. A number of tax reforms are also discussed. It creates a better understanding of the context of the research.
2.1 Economy characteristics
Kenya is a vibrant lower middle-income country. It has a population of 44 million people (KNBS, 2016). The economic growth rate averages to about 5 per cent; it was 5.3, 5.6 and 5.8 per cent for the years 2014, 2015 and 2016 respectively (KNBS, 2016). The World Bank projects a growth of 5.5 per cent for the year 2017. Despite the positive growth projections, studies have shown that economic growth does not trickle down to the poor households due to high inequalities(Kabubo-Mariara et al., 2013; KNBS and SID, 2013; Gakuru and Mathenge, 2012). The economy is agriculture-dominated; agriculture contributed 30 per cent of GDP in 2014, while contribution of manufacturing was 10.3 per cent (KNBS, 2016). The rate of unemployment is high, more so among the youth, estimated at 17 per cent for 2014 (WDI, 2015).It is a consumer society with low savings rate of about 11 per cent in 2014 compared to its East Africa counterparts Uganda and Tanzania whose savings rate were 22 and 15 percent respectively for the same period (WDI, 2015). The country has a stable economy and maintains a low inflation rate, which averaged to 6.9 and 6.6 per cent in 2014 and 2015 respectively (KNBS, 2015). Kenya is among the fastest growing economies in East Africa. The GDP per capita was 1,358.3 US dollars in 2014, compared to that of Tanzania 998.1, South Africa 6,477.9 and Mauritius 10,005.6US dollars (WB, 2015). It is the fifth largest economies in Sub-Saharan Africa after Nigeria, South Africa, Ethiopia and Sudan (WB, 2015).

Anne Wanyagathi Maina 59
2.2 Taxation in Kenya
The government through the National Treasury sets the budget and oversees revenue generation for the country. Tax is the main source of government revenue, and finances a large part of the budget. In the financial year 2014/2015, taxes finance 68.4 per cent of the budget while in the year 2016/2017 they financed 66.2 per cent (KNBS, 2016). The current tax to GDP ratio is 20.3 per cent. AEO (2014) estimated Kenya’s tax to GDP ratio for financial year 2013/2014 at 20.1 per cent compared to 18 and 13 per cent in Tanzania and Uganda respectively for the same period. There have been many tax reforms. Major reforms started in the 1980s when the Tax Modernization Program (TMP) was implemented. These major reforms were initiated to increase revenue collections (Moyi and Ronge, 2006). The TMP initiated the process that saw the establishment of the Kenya Revenue Authority (KRA) in 1995. This was a major reform in tax administration. KRA is responsible for assessing, collection, administration and enforcement of tax laws. The main taxes administered are income tax on individuals (pay as you earn, PAYE) and companies (corporation tax), value added tax (VAT), custom duties on imports and exports, excise duty, stamp duties and capital gains tax among others.
2.2.1 Trend of Taxes
Tax collections have increased significantly since the establishment of KRA. The tax collections increased from 122 billion Kenya shillings (Kshs) in the financial year 1995/1996 to Kshs.1.07 trillion in the financial year 2014/2015 (KRA, 1995-2015), as shown in figure 1. This can be attributed to hiring of qualified staff and continued reform and Modernization programs aimed at increasing efficiency in the tax administration. Some of the noticeable reforms are the move towards being more customer oriented and automation of most of the tax procedures.
Figure 1: Tax Revenue Collections
Source: Kenya Revenue Authority (various years).
Kenya has both direct and indirect taxes. Direct taxes are those whose impact and incidence lie on the same person. They are charged on personal income, profits and capital gains. They include PAYE, corporation tax, capital gains tax, advance tax and withholding tax. Indirect taxes are those whose impact and incidence lie on different people. They are mainly charged on consumption of goods and services, and include sales tax or VAT, custom duty and excise duty. The focus of this research is on the VAT and excise duty which are consumption taxes. The share of various taxes is shown in figure 2:
0
200000
400000
600000
800000
1000000
1200000
Rev
enu
e K
enya
sh
illin
gs 'm
illio
ns'
Year
Total tax revenue

60 International Journal of Accounting and Taxation, Vol. 5(2), December 2017
Figure 2: Various taxes as a percentage of total tax collections
Source: Kenya Revenue Authority (various years).
VAT and excise duty are charged on goods and services produced domestically or imported. VAT is charged whenever value is added at each stage of production and at the final stage of sale. It is accounted for at every stage of production; a trader is required by law to file monthly return showing the net VAT payable or refundable after comparing the VAT on inputs and outputs. There are three rates of VAT; the standard rate (16 per cent), zero rate and exempt as stipulated in The VAT Act, Section 476, Laws of Kenya. VAT accounts for about 25 per cent of total tax collections as shown in figure 2. This share of total revenue has remained constant over the years. Trade liberalization has led to a reduction of the share of trade taxes to total taxes. VAT can be used to compensate for revenue loss from trade taxes. Keen (2008) recommends use of VAT to replace revenue lost from trade liberalization. This explains the more reliance on the VAT in recent years. VAT is also preferred to direct taxes as a means of raising more revenue to finance the budget since it is easy to administer and causes least distortions in terms of savings and investment (Świstak et al., 2015; Rosen and Gayer, 2014).
Excise duty is charged on goods and services specified in the Customs and Excise Act, Section 472, Laws of Kenya; these include alcohol, cigarettes, cars, petroleum products, soft drinks, airtime and financial services. Traders dealing with excisable products are also required by law to file monthly returns and make a payment or claim a refund. Excise duty earns revenue for the government and is also used to deter consumption of some harmful goods such as tobacco and alcohol. It is charged on goods which produce externalities in their production or consumption. It is also charged on non-essential products such as cosmetics and luxury cars to promote vertical equity (Karingi et al., 2004). Excise duty accounted for an average of 15 per cent of total collections for the period 1997/1998 to 2013/2014, as shown in figure 2. This forms a significant share of total collections, despite the fact that its share has been declining overtime. For the year 2013/2014, it was 11 per cent compared to 18 per cent in the year 1997/1998 (KNBS, 1998 and 2014). The share of income taxes has gained prominence over the other taxes. This can be attributed to the fact that they are easier to administer and capture ability to pay. The share of personal income tax in total, which mainly constitutes of PAYE has been increasing and currently stand at 27 per cent as shown in figure 2. PAYE is deducted at source and then remitted to the government by the employer, hence easy to administer. Corporation tax share has remained almost steady in recent years; it was 14 per cent for the year 2013/2014.
-
0.05
0.10
0.15
0.20
0.25
0.30
Per
cen
tage
of
tota
l tax
rev
enu
e
Year
Tax Ratios
Excise duty
VAT
Personal Income Tax
Corporation Tax
Anne Wanyagathi Maina 61
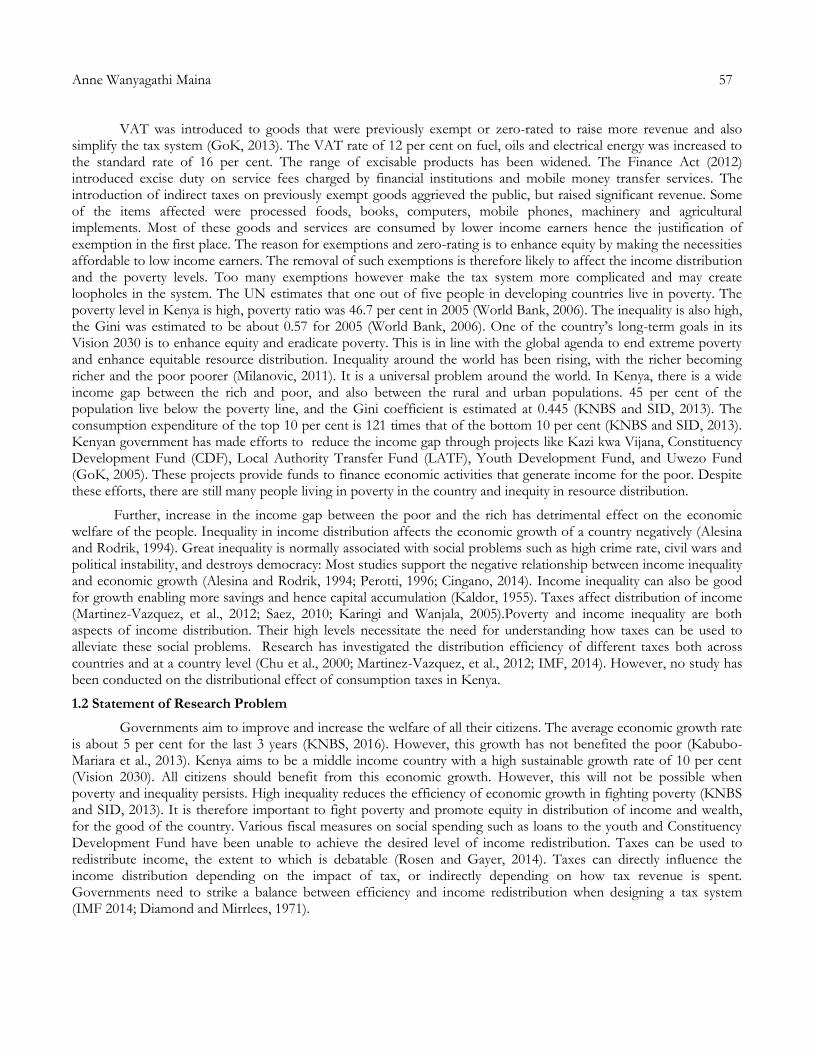
The revenue from major taxes has grown over time as illustrated in figure 3 that follows: Figure 3: Tax Revenue Collections per tax head
Source: Kenya Revenue Authority (various years).
Overall, the different tax types have an increasing trend, with the highest contributors being VAT and personal income tax, and least contributor being the corporation tax. The increasing trend could be explained by the expansion of the economy. The total national income as represented by GDP has continued to increase over the years, for instance it increased from Kshs.11.4 billion in 1970 to Kshs.5.3 trillion in 2014 in nominal terms (WDI, 2014).
2.2.2 Evolution of Consumption taxes
After independence in 1963, Kenya inherited the tax system from the British rule. The budget was financed by a tax system that constituted of a few uncoordinated set of taxes, combined with foreign aid; total tax to GDP ratio in the 1960’s averaged to about 10 per cent (Eissa and Jack, 2009). Import duty was more popular at the time, followed by income tax and excise duty. The fiscal crisis of 1970s due to oil crisis brought more focus to the fiscal policy, and this saw a few reforms in the tax system. Sales tax was introduced in the fiscal year 1972/1973 to raise additional revenue and to support the import substitution strategy, and later the export led growth strategy. The income taxes at the time played more of a redistribution role (Eissa and Jack, 2009). Tax reforms in the country have been undertaken to increase equality and to generate revenue for sustainable development (Moyi and Ronge, 2006).Tax Modernization Program (TMP) was introduced in the country in 1986 to achieve this (GoK, 1986). It saw implementation of various tax reforms the major one being implementation of KRA. The revenue authority has implemented various reforms to increase efficiency in collection and maximize revenue.
2.2.3 Value Added Tax (VAT)
VAT was introduced in the Fiscal year 1989/1990 to replace the sales tax, to increase revenue potential. There were 15 different rates with a standard rate of 17 per cent. With time, the rates were lowered to reduce tax evasion and increase competitiveness of the country’s products. The VAT rates were rationalized to four rates by the year 1994/1995. This was to minimize the requests for exemptions, simplify the tax system and reduce loopholes in the system. The VAT rates were minimized from a maximum of 150 percent in the 1990 to 16 per cent today (Eissa and Jack, 2009). Currently there are three rates of VAT; the standard rate of 16 per cent, zero rate and exempt.
0
50000
100000
150000
200000
250000
300000
Rev
enu
e (K
enya
sh
illin
gs '0
00
')
Year
Tax Revenue
Excise duty
VAT
Personal Income Tax
Corporation Tax

62 International Journal of Accounting and Taxation, Vol. 5(2), December 2017
Administration of VAT faced major challenges mainly due to refunds system (Muriithi and Moyi, 2003).
There was a backlog in processing refund claims and even fraudulent claims due to weak controls. This affected revenue collections. Compliance level of taxpayers was also affected since they had to wait for a long time before their refunds were processed. VAT withholding tax which had been introduced in October 2003 was abolished in 2011 (KRA, 2011), to reduce the refund claims. Appointed VAT tax agents such as government ministries and parastatals could withhold VAT from suppliers and remit it to KRA. The supplier would then reduce VAT payable by the amount already withheld. Withholding VAT was meant to enhance compliance of suppliers and collect taxes from informal sector. In the long-run VAT withholding proved inefficient due to many refund claims and backlog in processing them (AfDB, 2010; Muriithi and Moyi, 2003). Stronger control measures have been put in place such that all refund claims are properly verified before the payment is done. The backlog has also been cleared. This paved way for the reintroduction of withholding VAT in Finance bill 2014 at a lower rate of 6 per cent, effected January 2015.
The VAT Act was revised in 2013 (GoK, 2013). VAT was introduced on formerly exempted goods and services. These included processed foods, books, computers, tourism services, kerosene and LPG, animal feeds, sanitary towels, baby nappies, insecticides, bicycles, agriculture and farm implements. Most of these goods were previously exempted for redistribution purposes. Textbooks, animal feeds, kerosene are consumed mostly by the low income earners. As a result, civil societies highly protested this move. The pressure from civil society groups led to exemption of a few goods such as milk and bread. Charging VAT on the goods could be regressive. This paper investigates how regressive the tax is and whether it has an effect on poverty and income distribution.
2.2.4 Excise Tax
Excise tax is charged on “harmful” or luxury goods and services which have low price elasticity of demand. This makes excise tax the usual target to raise revenue to finance budget deficits (Karingi et al., 2004). They are easy to administer and easy to collect. Almost every year the excise tax on cigarettes and alcohol is raised when the budget is read; it is considered as readily collectable (AfDB, 2010). The main aim of increasing the taxes is not to discourage vices in the society but rather to generate revenue (Moyi and Ronge, 2006). Excise tax changed from being specific to ad valorem in the financial year 1991/1992, then back to specific in 2003/2004 for certain products. Specific tax is a fixed amount of tax per unit of goods while ad valorem is fixed percentage on the value of goods. The shift from specific to ad valorem was to factor in effects of inflation. The shift back to ad valorem taxes for tobacco and alcohol products was meant to reduce smuggling, tax evasion and avoid under declaration of taxable value (Muriithi and Moyi, 2003). Currently, there is a mix of specific and ad valorem taxes for different products to maximize revenue yield. The Finance Bill 2012 expanded the scope of excise tax and introduced a tax of 10 per cent on money transfer services through mobile phone service providers, banks, money transfer agencies and other financial service providers. Fees charged by financial institutions for financial service, except interest were also subjected to an excise duty of 10 per cent, effected in 2013. Such fees include withdrawal charges, loan processing fee and other forms of bank charges. Excise duty on mobile money transfer services was protested by the public, but it still remains in force. It is seen as regressive since the low income earners rely on it to receive or send money, and even to make savings instead of doing it through banks.
2.3 Poverty and inequality in Kenya
Poverty and inequality is a sensitive issue that is on the global agenda. The Millennium Development Goals (MDGs) by the UN sought to address extreme poverty levels, reduce inequality and increase access to basic services by the year 2015. They have transitioned to Sustainable Development Goals (SDGs). SDGs build up on the MDGs and also seek to eradicate poverty and reduce inequality among other goals. The SDGs were adopted in September 2015 by world leaders at the UN Sustainable Development Summit for the 2030 agenda for sustainable development. The World Bank has established two main goals that are aligned with the SDGs to end extreme poverty by the year 2030 and promote shared prosperity (Ferreira et al., 2015). Development strategies for any country should focus on eradication of absolute poverty, which requires both economic growth and policies to redistribute income generated (Bourguignon, 2004). Kenya adopted both the MDGs and SDGs. The MDGs were incorporated into Kenya’s long-term plan, Vision 2030 (GoK, 2007). Kenya also had the National Poverty Eradication Plan for the period 1999 to 2015. All these long-term plans aim at addressing the poverty problem.

Anne Wanyagathi Maina 63
Some progress has been made in some areas such as provision of free primary education. However, not much progress has been made on the poverty and inequality front. Poverty and inequality remains a challenge for the country, despite efforts to address them. The new constitution implemented in 2010 led to fiscal decentralization. Funds are devolved to county governments across the country to promote development. The funds if well managed could address problems facing the grassroots and reduce poverty and inequality. However, cases of mismanagement are rampant hence the funds may not be as effective as intended (ICPAK, 2015).
Almost half of the population lives below the poverty line. 47 per cent of the population was not able to meet the daily recommended nutritional requirement in the year 2005/2006 (WB, 2008). The top 10 and 20 per cent held 38 and 53 per cent of national income respectively while the bottom 10 and 20 percent held 2 and 5 per cent income share respectively in 2005(WDI, 2015). Poverty is more prevalent in the rural areas. The expenditure on consumption for rural area was estimated as Kshs.1,846, while that in urban areas was estimated to be Kshs.4,425 (GoK, 2000).Poverty level varies within districts, with the poorest being the North Eastern region and Nairobi being the better off; access to basic services in different regions is highly unequal (WB, 2008).This fact is attributed to different factors such as climatic and ecological differences and different rates of return of resources (WB, 2008).According to The World Bank (2008) high inequalities reduces prospects for sustainable growth.
A recent study by KNBS and SID (2013) presents various indicators of poverty and inequality across the country. The indicators show high variations across regions, with the urban areas doing slightly better than rural areas. Life style in different regions differs greatly. The access to services is also different for different regions. The indicators used are access to education, electricity, decent housing, water, sanitation, cooking and lighting fuel. The study shows that electricity coverage was 51 per cent in urban areas and only 5 per cent in rural areas, despite having the Rural Electrification Fund (REF). The employment pay in urban areas is twice that in rural areas for individuals with secondary education. Household expenditure per month amounts to Kshs.6,010 in urban areas and Kshs.2,270 in rural areas, and a national average of Kshs.3,440. The overall findings indicate huge disparities across regions in terms of both poverty and inequality. Kenya is a low human development country. The Human Development Index (HDI) ranks the country at position 147 out of 187 countries in the year 2013. HDI is a United Nations Development Program (UNDP) measure of poverty based on the literacy level, life expectancy and standards of living. The 2014 Human Development Report (HDR) by UNDP indicates that HDI for the country has improved from 0.446 in 1980 to 0.535 in 2013. The increasing trend is shown in figure 4 below.
Figure 4: Human Development Index (HDI) for Kenya
Source: UNDP (2014)
0.4
0.42
0.44
0.46
0.48
0.5
0.52
0.54
0.56
1980 1985 1990 1995 2000 2005 2010 2011 2012 2013
HD
I
Year
HDI
64 International Journal of Accounting and Taxation, Vol. 5(2), December 2017
The level of poverty and inequality remains high despite efforts by the government to reduce it. After
independence in 1963, the country’s economic policy was articulated in Session paper no. 10 of 1965 titled “African socialism and its application in planning in Kenya.”
It promoted rapid economic growth through public investment, encouragement of smallholder agricultural production, and incentives for private industrial investment. The benefits of growth were supposed to trickle down to every member of the population to improve living standards. But this failed, as seen from the high poverty levels and inequality today. The number of people living below the poverty line increased from 27 per cent in 1970 to 47 per cent in 2008 (UNDP, 2015). The Gini index for Kenya was estimated to be 0.445 in 2013 (KNBS and SID, 2013). The Gini shows inequality level, with zero representing absolute equity and one absolute inequality. The score indicates high income inequality.
The key drivers of inequality in the country are seen as access to essential services such as fuel, water and education (Kabubo-Mariara, 2013). Continued lack of access to basic services results in more poverty and an increase in vulnerability (KNBS and SID, 2013). Various development funds and policies have been set up to reduce poverty levels and inequality such as, Constituency Development Fund (CDF), Local Authority Transfer Fund (LATF), Youth Development Fund, school bursaries and free primary education. Other efforts to address poverty and inequality made through taxation include exemption of basic food items and agricultural implements from VAT to make them affordable to all. Their effectiveness in addressing the issue remains unclear.
To sum up, Kenya is a middle-income country with a vibrant economy. It is still agriculture based and relies mainly on taxes to finance its expenditure. VAT accounts for almost a quarter of the taxes collected, while excise tax account for about 15 per cent (KNBS, 2014). Almost half of the population lives below the poverty line (KNBS and SID, 2013). Income is unevenly distributed as indicated by the Gini coefficient of 0.445 in 2013 (KNBS and SID, 2013). As consumption taxes make a significant contribution to the economy, it is crucial to understand how they are likely to influence income distribution and poverty in the country.
3.0 Literature Review
This section presents an analysis of theoretical and empirical literature on the subject. It gives the definitions and methods of measurement of both poverty and inequality as described in literature, then highlights how taxes, inequality and poverty interact, and finally gives an overview of the section.
3.1 Poverty
They are many definitions of poverty by different scholars. Poverty can be described in absolute or relative terms (Bourguignon, 2004). Absolute poverty is defined in reference to a poverty line. Relative poverty is defined as a fixed proportion of the average income of the population. It classifies the poor as the individuals in the bottom income group; for example, an individual is relatively poor if they belong to the poorest 10 per cent or 5 per cent. Alternatively, an individual is poor in absolute terms, if they are unable to attain a given minimum level income required to meet the basic needs, defined by the poverty line. Poverty line needs to be first established for a region, a country or for a given study. An issue crops up in having a universal definition of poverty line across regions or countries (Laderchi et al., 2003). Different countries or jurisdiction have defined the poverty line differently in their policy making processes.
The poverty line for Kenya is based on the amount of money required to purchase a food basket to meet the minimum nutritional requirements and basic non-food needs (the minimum nutritional requirement is set at 2,250 calories for an adult per day), (GoK, 2000). The poverty line was estimated to be about Kshs.1,239 and Kshs.2,648 for rural and urban areas respectively (GoK, 2005). World Bank defines the poverty line as people living below a dollar a day. This has been re-estimated so that the new poverty line is people living below 1.9 US dollars a day, to match the updated purchasing power parity prices for 2011(Ferreira et al., 2015). The new world poverty line will help in monitoring the progress in achieving the 2030 poverty eradication goal. It tries to capture a common threshold to help compare standards of living among different people over time and across countries. Amartya Sen (1981) defines poverty as deprivation of capability. Factors that determine capability include gender, age, and locality among others. Some indicators of capability deprivation are undernourishment and high mortality rates. The capabilities are reflected by things like human rights, literacy level and health facilities. For development to take place, Sen (1999) recommends enhancing freedom by removal of factors that take away freedom, such as poverty, and inadequate and neglected public health facilities.

Anne Wanyagathi Maina 65
Poverty robs off people freedom of satisfying hunger, assessing essential services, and meeting other basic needs. Deprivation of access to essential services increases poverty and deteriorates the wellbeing of the people (KNBS and SID, 2013). One of the priorities of UNDP is to eradicate poverty (UNDP, 1997). The UN defines poverty as lack of opportunity; it means not having access to basic needs such as enough food, clothing, schools and health care, necessary to lead a tolerable life. It can mean denial of choices and opportunities necessary for human development, so as to lead a long healthy life, enjoy good living standards, freedom, dignity, and respect for self and others, as defined in the human development report (HDR) of 1997. This view of poverty overlaps to a certain degree with that of Sen’s (1999) deprivation of capability and freedom. The underlying line is that poverty manifests itself when people lack access to necessities. Both views reflect poverty as not only having an income dimension but also a non-income side, which could be a social or a psychological dimension.
3.1.1 Measurement of poverty
The definition and measurement of poverty has different implications on policy-making (Laderchi et al., 2003). There are various approaches to defining and measuring poverty. The most common is the monetary approach, which can use the consumption (expenditure) level or income to show extent of poverty. Others include capability approach, used by Sen (1982); social exclusion approach used to show extent of deprivation or marginalization; and participatory approach, where peoples give their own views on what poverty and magnitude of poverty means to them. World Bank gives some monetary measures of poverty; head count ratio, poverty gap index (Haughton and Khandker, 2009). Head count ratio is a ratio of the number of people living below the poverty line divided by the total population. It is widely used since it is easy to construct and interpret. Nevertheless, the measure has been criticized for the fact that it does not capture the intensity of poverty of the people living below the poverty line. Poverty gap index is another measure of poverty that expresses the average poverty gap as a percentage of poverty line. Poverty gap shows the extent to which individuals fall below the poverty line that is the depth of poverty; the gap represents the minimum amount of transfers necessary to eliminate poverty or to lift the poor up to the poverty line. If income is transferred from one poor person to another, poverty gap index would not reflect this. The index does not capture changes in income inequality among the poor population (Haughton and Khandker, 2009).
Another poverty measure is the Foster-Greer-Thorbecke (FGT) poverty measures. The FGT measure allows decomposition of poverty to show the contribution of different population subgroups to national poverty. The poverty severity index, which is the squared poverty gap index belong to the FGT measures. It is the weighted sum of the poverty gaps. The weight is based on the poverty line. It allows varying of weights of the income level of the poorest society member. It captures the distribution of standards of living among the poor. The measure is difficult to explain hence not widely used (Haughton and Khandker, 2009). Sen (1976) proposed a poverty index that takes the income distribution of the poor into consideration. The index quantifies the variations in levels of deprivation among the poor. It combines the poverty gap, head count ratio and Gini coefficient of the poor. Other measures of poverty include the Sen-Shorrocks-Thon Index and Watts index. Multidimensional approach to measurement of poverty combines other indicators of poverty, apart from the income and consumption levels. The Human Development Index (HDI), used by United Nations Development Programme (UNDP), considers life expectancy, literacy level and GDP per capita. Physical Quality of Life Index (PQLI) considers the life expectancy, education level and infant mortality rate (Morris, 1979).
3.2 Income inequality
Inequality refers to the degree in which distribution of economic welfare generated in an economy differs from that of equal shares among its inhabitants (KNBS and SID, 2013).Inequality can be reflected in terms of access to basic services, opportunities, income among others. Income is generated from the factors of production: labour, capital, land and entrepreneurship. Depending on who owns the factors of production, a pattern of income distribution emerges over time and space (Kakwani, 1980). Income inequality occurs when the national wealth is unevenly distributed among the population. Due to high inequality around the world, many governments have made redistribution of income a major goal (Kakwani, 1990). Piketty (2014) gives a new approach of looking at inequality by examining historical evidence to explain patterns in the evolution of wealth and income distribution. He highlights that economists have not paid attention to process of income distribution and its consequences but rather have paid

66 International Journal of Accounting and Taxation, Vol. 5(2), December 2017
attention to the overall wealth; not much attention has been paid to the richest one per cent. The rate of return on capital (r) and the growth rate of an economy (g) account for wealth inequality.
When growth rate of return on capital exceeds economic growth (r > g), it generates inequalities in income and wealth. Income will be concentrated on a few rich individuals. Slow growth leads to high capital to income ratio, which increases inequality by redistributing income from labor suppliers to holders of capital. Wealth is moving to a few family dynasties due to accumulation of capital on a few hands and inheritance of wealth. Unequal assets ownership has contributed to inequalities. Falling tax rates for the rich is also a contributing factor. Progressive taxes can reduce the inequality.
According to Krugman, (2014) unequal compensation and high incomes has led to accumulation of wealth on a few rich individuals, rather than high capital to income as proposed by Piketty (2014). A wages income at the top is rising at a high rate (Krugman, 2014). The wages of the top executives is increasing at a much higher rate than that of the other workers, which creates huge disparities between the two groups; this has lead to accumulation of capital on a few hands (Krugman, 2014). The high wages of the earning elites and executives is driven mainly by technology. Social and political forces also contribute to the high wage difference (Piketty, 2014). Globalization, technological change, falling tax rates for the rich, changes in demography and disparities in distribution of wages and salaries are seen as the major cause of inequality (OECD 2008; Krugman, 2007; Kayizzi-Mugerwa, 2001).Globalization influences income distribution through international trade and foreign direct investment (FDI). It offers a chance to reduce poverty but has implications on global equity. Kayizzi-Mugerwa (2001) finds other factors such as social and economic problems lead to high inequality in Africa. Conflicts and weak institutions worsen inequality. He observes the existence of high rural urban gap in African countries and attributes this to colonization. He further points out that recent economic growth has not improved poverty and inequality. Stieglitz (2012) finds unemployment to be another cause of inequality.
Income distribution and poverty in Kenya is dependent on a number of factors; factor endowment, changes in prices of goods and services, and technical progress (Bigsten et al., 2014). The structure of the economy has been changing, with share of agriculture in total falling from about 75 per cent in the 1960s to about 27 per cent in 2014; higher growth in the agriculture sector will lead to a more equitable income distribution (KNBS, 2015). The demography also shapes income distribution; it depends on the dependency ratios and proportion of different age groups. The information and technology is also transforming the economy. These changes have shaped the income patterns in the country. Bigsten et al. (2014) proposes improvements in productivity for growth and poverty reduction. Inequality slows down economic growth (Bourguignon, 2004; Kayizzi-Mugerwa, 2001; Perotti, 1996; Alesina and Rodrik, 1994). High inequality is associated with unequal access to basic facilities and opportunities, political instability and social problems such as high crime rate and use of illegal drugs, and further worsens social inequalities more so among the children (Wilkinson and Pickett, 2010; Alesina and Rodrik, 1994).Conflicts may emerge due to social problems leading to instability; violence that is politically motivated is more likely to happen in highly unequal societies (Ortiz and Cummins, 2011).
3.2.2 Measurement of income inequality
Gini coefficient is a popular measure of inequality in income distribution. It is based on the Lorenz curve. Lorenz curve represents the income and wealth distribution in a graphical form. It was developed by Lorenz (1905) to analyze wealth inequalities of a country in different periods, or for different countries. It shows the percentage of income and wealth held by a certain proportion of the population. The curve displays the deviation from the line of perfect equality. The further away the curve is from the line of perfect equality, the more unequal is the income distribution. It can be used to rank income distributions. However, the ranking is not clear if two Lorenz curves intersect. Sen (1976) criticizes ranking of inequalities due to the different faucets of the inequality concept. Gini coefficient is calculated from the Lorenz curve, represented by the area that lies between a country’s Lorenz curve and the line of perfect equality. Gini coefficient ranges from zero to one, where zero represent perfect equality and one perfect inequality. Developing countries tend to have higher Gini index than the developed countries, which means they have greater inequality than the latter (Kakwani, 1980). Ortiz and Cummins (2011) found the Gini for Sub-Saharan Africa to average to 0.442 in 2008. This can be compared to 0.483 for Latin America, 0.354 for Eastern Europe and Central Asia, and 0.309 for High-income countries for the same period. Ratios such as decile ratio or quintile ratio are also measures of income distribution.
Anne Wanyagathi Maina 67
The ratios show how much income or wealth that is controlled by a certain percentage of the population. The top quintile in the world controls 83 per cent of global income, while the bottom quintile controls about one per cent of global income (Ortiz and Cummins, 2011). This shows the high inequality in world income, which makes it a global issue. One of the objectives of the 2030 agenda for sustainable development (SDGs) is to have sustainable and equitable growth and development, with poverty eradication and more equality in distribution of resources. Other measures of inequality include the Atkinson Index, Robin Hood Index and Theil Index. Kawachi and Kennedy (1997) found the indicators of income inequality are correlated hence the choice of indicator in a study does not influence the results. Therefore, the choice of measure for income distribution in a study does not matter, since we expect similar results from either of the chosen indicator.
3.3 Taxes, inequality and poverty
Fiscal policy shapes the distribution of income and poverty level for a country (IMF, 2014; OECD, 2008; Defina and Thanawala, 2004). Social public expenditure for provision of essential goods and services to members of the lower income groups redistributes income. In the light of rising inequality around the world, the role of government in income redistribution comes in handy (Ortiz and Cummins, 2011; Rosen and Gayer, 2014). It is also one of the global agendas to end extreme poverty and enhance equity (SDGs, Ferreira et al., 2015).Taxation is an important policy tool that will aid in this. Its potential in influencing poverty reduction and income distribution has been widely investigated. It is widely debated whether taxes affect income distribution and poverty or not, and whether it has a positive or a negative effect. Taxes affect the output of an economy and income distribution through its effect on factor prices and commodity prices; tax burden can be defined as its effect on the distribution of income (Okner, I975). Taxes determine the disposable income available for consumption to the households and thus influence income distribution. However, the disposable income does not take into account the indirect taxes such as the consumption tax (Karanfil and Ozkaya, 2013). This creates a limitation when only disposable income is considered in measuring the tax burden and income distribution.
The effectiveness of taxes in redistribution has been debated over the years. Some studies show that the effect of taxes on inequality and poverty is small and/ or weak, more so in the developing countries (Chu et al., 2000; Bird and Zolt, 2005). Comparison is made between taxes and transfers to find out which is the better redistributive tool. Engel et al, (1999) finds that taxes are not very effective in income redistribution in Chile. The study advocates for expenditure targeting the interest groups, who are the poor in this case. The study used household data to estimate distributional effects of changes in the tax structure. The findings suggest that progressivity of taxes is limited. An increase in VAT rate did not significantly affect income distribution. A proportional tax can yield more revenue and then the government can transfer this revenue to the poor for redistribution. Therefore, tax design should lean more towards efficiency rather than redistribution effects. In a similar study, Okner (1975) investigates the effect of direct taxes and transfers on income distribution. The study pointed out that progressive taxes redistribute income but government transfers play a more important role in redistributing income. The author also supports the important role played by transfer of income to the poor.
The VAT and corporation income tax share in OECD countries has increased while that of personal income tax and excise duty has fallen (Bahl and Bird, 2008). In developing countries, indirect taxes more so VAT has been playing an increasing role (Bahl and Bird, 2008; Casale. 2012). Casale (2012) attributes this to the wider tax base for consumption taxes compared to that of personal income tax (PIT) and corporation tax, and the increase in tax competition across countries. Consumption tax is borne by all consumers both in the formal and informal sector, while PIT and corporation tax is usually paid by the firms in the formal sector; the informal sector escapes paying income taxes. Indirect taxes are considered to be regressive since all individuals are subject to the same tax rate irrespective of their level of income. This tends to increase inequality as some studies have shown (Obadić et al., 2014; Barnard, 2010).Direct taxes are progressive and thus more preferred to redistribute income. They lead to more equitable income distribution (Martinez-Vazquez, et al., 2012; Saez, 2010; Barnard 2010; Weller, 2007).Direct taxes may discourage entrepreneurial activity in the economy (Djankov et al. (2010). A study by IFS (2010) shows that the benefits of a single VAT rate outweighs that of differentiated rate and instead recommends use of targeted transfer programs for the poor. The revenue lost from zero-rating and exemptions is much higher than the equity gains by the poor, since the rich also benefit from such exemption.

68 International Journal of Accounting and Taxation, Vol. 5(2), December 2017
Therefore, differentiated commodity tax may be inadequate, complicated, ineffective and sub-optimal in
redistributing income and enhancing equity (Obadić et al., 2014; Saez, 2010; IFS, 2010). This is not rule out indirect taxes as redistributive instruments. Low tax rates and exemptions on basic commodities and high tax rate on luxury goods can make the consumption taxes progressive. According to Saez (2010), commodity taxes can be used to complement direct taxes to redistribute income in the short run. Well targeted zero-rating of a few specific basic items usually consumed by poor households such as paraffin and basic food items is redistributive and benefits the poor (Casale, 2012). Excise tax charged on luxury goods or non-essential goods has an effect of increasing vertical equity (Karingi, et al., 2004). The people with higher income are the ones who consume the luxury goods; therefore, they end up paying the taxes. The taxes can be utilized to provide public utilities to the poor. For the tax to be effective in enhancing vertical equity, the goods on which the excise tax is imposed should have inelastic demand and the consumption of such goods should constitute a large share of expenditure for high income groups. Consumption taxes have an insignificant negative effect on inequality while labor taxes have a significant negative effect on inequality measured by the Gini coefficient, in a study by Obadić et al. (2014) which investigates the effect of taxes and social contribution on income inequality in the EU. According to the study, tax policies reduce inequality more so the labor taxes. Martinez-Vazquez, et al. (2012) conducted a panel study for 150 countries around the world to investigate the effect of taxes and public spending on income distribution. Their findings reveal that consumption taxes have a negative effect on the income distribution. A study conducted to investigate how VAT reforms in Poland affected equity supports the regressive nature of VAT (Świstak et al., 2015). To deal with the financial crisis, in 2011 the Polish government increased the standard VAT rate by one per cent and introduced reduced rates for equity reasons. The reforms improved progressivity only slightly. The study suggests that improving progressivity through reduced rates is ineffective; the gains are outweighed by the cost of implementing such a measure according to the study. The author recommends a broad based single VAT rate and a progressive income tax for redistribution.
The efficiency of consumption taxes and its role in enhancing equity was examined by Corriea (2007) in a qualitative study. The author finds that consumption taxes play a part in enhancing equity. A uniform and a constant rate of tax on consumption will improve equity, even without transfers to the poor. The more the consumption taxes contribute to the government revenue, the stronger are the effects on efficiency and welfare of the low-income earners. This view of consumption tax contrasts the common view of consumption taxes as regressive. Karanfil and Ozkaya (2013) regresses indirect taxes on poverty ratio for Turkey. The findings indicate that indirect taxes have a positive long-run impact on the poverty ratio. They are regressive; higher indirect taxes increase poverty. Governments tend to rely on the indirect taxes to raise more revenue since they are easier to collect with less political cost. Hussain, et al., (2010) find FDI and balance of trade have a positive impact on Human Development Index (HDI). Defina and Thanawala, (2004) investigate the effect of taxes and transfer on poverty ratio in a study across 17 developed countries. The authors estimate the head count ratio before and after policy change and conclude that tax policy and government transfers can reduce poverty level.
There are a few country specific studies on effect of taxes on poverty and income distribution. A study by Bhasin and Annim (2005) to examine effect of trade taxes on poverty and income distribution in Ghana uses the computable general equilibrium (CGE) framework. They find that replacing import taxes with VAT reduces incidence of poverty and improves income distribution, while replacing export taxes with VAT increases poverty and adversely affects income distribution. Ilaboya and Ohonba (2013) find tax burden to have a significant negative effect on income inequality in Nigeria. Taxes can be used to reduce income inequality. Casale (2012) examines the effect of indirect taxes on gender equity for South Africa. The study uses household survey data to understand the incidence of indirect taxes on male and female headed households. The study reveals that male-headed households bear a heavier burden of indirect tax than female-headed households do. This is attributed to spending patterns. There are high taxes on items like fuel, alcohol and tobacco which are mostly consumed by male dominated households and zero rating of basic food items usually consumed by female households. A similar study in Kenya by Wanjala et al. (2006) reveals that as much as VAT exemptions increase progressivity, it is still gender biased. Female-headed household bear a heavier tax burden of VAT as compared to male-headed households in spite of tax exemptions in place. The results for Kenya contradict those in South Africa (Casale, 2012). This could be due to differences in tax structures.
The studies for Kenya and South Africa support the fact that the structure of indirect taxes can be used as an instrument to reduce gender inequalities. Gakuru and Mathenge (2012) use a social accounting matrix (SAM) to model how poverty, growth and inequality interact in Kenya. The sectors included in the matrix are agriculture, manufacturing, trade and hospitality, as they are deemed vital sectors of the economy.
Anne Wanyagathi Maina 69
The result indicates that growth in the agriculture and manufacturing sector mainly benefits the rich urban households who control factors of production. This is due to high inequality that exists in ownership of productive resources. Kabubo-Mariara et al. (2013) investigate whether economic growth benefits the poor, and how it affects inequality and institutions. Their findings reveal that growth is a necessary condition for reduction of poverty but it does not guarantee poverty reduction. Increase in access to basic services reduces inequality. These basic services include education, health, sanitation and clean water. Big disparities in accessing these services by different groups make it difficult to reduce poverty with economic growth (KNBS and SID, 2013). AfDB (2010) conducted a quantitative case study for Kenya to show how to improve domestic revenue mobilization to fight poverty. It draws lesson from Kenya and supports that taxes collected can to reduce poverty, and further points out that exemptions and incentives in taxation create distortions, undermine equity of tax system and reduce revenue potential. Incentives are not effective in attracting FDI. Corruption also limits effective of taxes in achieving efficiency in the country (AfDB, 2010, Chu et al., 2000). Studies done for Kenya have not extensively investigated redistribution effects of taxes. Studies have focused on domestic resource mobilization for poverty reduction, poverty and income distribution (Kabubo-Mariara et al., 2013; Gakuru and Mathenge, 2012; AfDB, 2010; GoK, 2005).
3.4 Overview of Literature
Poverty refers to lack of opportunity and deprivation of capability that allows access to basic needs (UNDP, 1997; Sen, 1981). Income inequality refers to uneven distribution of income across the population (Kakwani, 1980). Both poverty and inequality refer to level of income at the disposal of every household. Poverty is more inclined as to whether the income meets the basic needs, while income inequality is concerned with the amount each household has compared to other households. Income inequality compares the income share of different households across the whole population in a region, country or countries. Poverty results from lack of access to basic services, and inequality makes it difficult to reduce poverty levels (KNBS and SID, 2013; Kabubo-Mariara et al., 2013; UNDP, 1997). The increase in income inequality around the globe has been attributed to globalization, technology, social and economic problems and unemployment (Stiglitz, 2012; OECD 2008; Kayizzi-Mugerwa, 2001).According to Piketty (2014), wealth accumulates on a few hands when the rate of return on capital increases at a higher rate than economic growth (r > g), and when tax rates on the rich are low. Krugman (2007) explains income and wealth inequality as being a result of huge disparities in wages.
Literature supports that tax policy influences the income distribution. Income inequality occurs when the income is unevenly distributed among households. Households are considered poor if they live below a predetermined income threshold that is required to meet the minimum basic requirements. Many studies that have investigated how taxation influences poverty and inequality have not reached a consensus on the nature of the relationship. Most studies are done on a cross-country level, and support that direct taxes are progressive hence they are better instruments to redistribute income than indirect taxes (Obadić et al., 2014; Martinez-Vazquez, et al., 2012; Saez, 2010; Barnard 2010; Weller, 2007). Consumption taxes negatively affect income distribution (Martinez-Vazquez, et al., 2012). An increase in consumption taxes increases poverty ratio and worsens income distribution (Karanfil and Ozkaya, 2013).For efficiency purposes a single rate is preferred to increase the revenue yield, combined with a well targeted transfer program (IFS, 2010; Engel et al, 1999; Okner, 1975).Consumption taxes are regressive. The regressivity can be mitigated by having differentiated rate; lower rates for basic goods and higher rate for luxury goods, though this complicates the tax system and is sub-optimal (Saez, 2010).If a tax regime has to exempt some items from tax, the items should be few and should be largely consumed by the poor; otherwise, it will not be redistributive and will result in huge welfare losses (Casale, 2010). Studies done on Kenya show high inequality in the country make economic growth to be pro-poor despite the need to reduce poverty (KNBS and SID, 2013; Kabubo-Mariara et al., 2013). Major causes of poverty and inequality are lack of access to basic facilities such as education, health care, clean water and sanitation (KNBS and SID, 2013; Kabubo-Mariara et al., 2013). AfDB (2010) advocates for removal of tax exemptions and incentives in the Kenya tax system as they undermine tax equity and lead to revenue loss. Research on income distribution in Kenya has not focused much on the redistributive effect of tax policy. Tax policy shapes income distribution, and thus it is important to understand how any changes will influence the rest of the economy.
70 International Journal of Accounting and Taxation, Vol. 5(2), December 2017
VAT is a consumption tax that contributes about 25 per cent of total tax revenue (KNBS, 2014). This
necessitates the need for more research to be conducted to help in understanding how the taxes influence income distribution and their effectiveness in reducing poverty, which is a big issue in the country. This paper focuses on consumption taxes in an attempt to fill the gap.
4.0 Methodology
This section gives the methodology applied to meet the research objectives, and justifies the methods used. It gives the specification of the regression models that are estimated for inequality and also poverty. The measurement of variables, the expected results and tools of data analysis are also discussed.
4.1 Model specification
4.1.1 Income inequality and consumption taxes
Regression analysis was conducted to investigate how consumption taxes influence poverty and income distribution. Obadić et al. (2014) in an effort to measure the effect of tax policy and labor market on income distribution in the EU countries, regressed Gini coefficient on tax burden. Tax burden was determined by social contributions, labor taxes, and consumption taxes, all as a percentage of GDP. The variables for control were tertiary education, debt to GDP ratio and corruption perception index. Martinez-Vazquez, et al. (2012) in their study of effect of taxes on income distribution used a panel data for 150 countries. In their model Gini coefficient was determined by its own lag, taxes and public expenditure. The control variables included were education, GDP per capita growth, population growth, unemployment, size of government and corruption index. Chu et al. (2000) used a similar model in their study on taxes and redistribution in developing countries. This study used a modification of the two models to suit the research objecives. The model is given as:
Gini=β0+βi (CT,IT,TT)+Z Z=(EDU,HLTH,PPG)
Gini is the Gini coefficient measuring income inequality. CT is consumption tax which comprises of VAT and excise tax. IT is income tax, and TT is trade taxes. Z is a control vector, which consists of education expenditure (EDU), health expenditure (HLTH) and Population growth rate (PPG). The taxes were expected to have a negative relationship with the Gini coefficient due to their redistributive effects (Obadić et al., 2014). It should be noted that the tax burden of a commodity tax can be shifted depending on the elasticities of supply and demand of a commodity (Rosen and Gayer, 2014). This effect cannot be ignored, thus the effect is ambiguous. However, as indicated in many studies, consumption taxes are regressive, and a tax increase might worsen the income inequality (Karanfil and Ozkaya, 2013; Martinez-Vazquez, et al., 2012; Barnard, 2010; Saez, 2010). Therefore, for this study, the expected sign for consumption tax was negative due to its regressivity. Public expenditure affects economic growth which in turn influences income distribution (Martinez-Vazquez et al., 2012). Education and health are public services that are powerful in reducing inequality (OECD, 2008; Bourguignon, 2004). A negative relationship was expected for education and health expenditures as they also reduce inequality; more expenditure on education and health will improve income distribution; their incidence is progressive (IMF, 2014; Chu et al., 2000). The population growth affects the functional distribution of income. The process may be complex since it depends on how population growth affects rate of growth of capital and labor, final demand and market mechanisms (Boulier, 1975). A high population growth is likely to result in higher return on capital in form of rent and profits. This income will not be evenly distributed among the population resulting to a less equal income distribution over time. Thus a positive sign was expected for population growth (Boulier, 1975).
4.1.2 Poverty and consumption taxes
A second model was estimated to show effect of consumption tax on poverty. Hussain, et al. (2010) used a similar model to investigate whether globalization is a good tool for development. Poverty ratio is a common measure of poverty. Karanfil and Ozkaya (2013) estimate a model with poverty ratio as the dependent variable and indirect taxes the independent variable, to investigate effect of indirect taxes on poverty. The sparse data on HDI and poverty ratio for the study period presented a challenge. A close measure of living standards is used.

Anne Wanyagathi Maina 71
This study used GDP per capita growth rate (GDPPC), a widely used measure which shows the average personal consumption (Milanovic, 2011). Increasing GDP per capita is good for poverty reduction but a high GDP per capita does not mean every household is better off (Kabubo-Mariara et al., 2013). GDP per capita will be poverty reducing if the economic growth is pro-poor (Kabubo-Mariara et al., 2013; UNDP, 1997). To investigate how GDPPC varies with taxes, it was regressed against the consumption taxes, income tax and trade tax, and control variables, just like in the first model. GDPPC=β0+βi (CT,IT,TT)+Z Z=(EDU,HLTH,PPG)
Whether taxes impact positively or negatively on development has been a question of debate. It all depends on who bears the burden of tax and on how the tax revenue collected is utilized. It was interesting to find out from the study how the various taxes affected standards of living and whether their effect was significant. The expenditure on education and health reduces poverty hence a positive sign was expected (Kabubo-Mariara et al., 2013). Education is an important determinant of human development; Attainment of higher education enhances participation in the economy, increases growth and leads to good social and economic outcomes in the long term (KNBS and SID, 2013).A higher GDP per capita means improved welfare that might reduce poverty.
4.2 Variables and data
For the main variables: The Gini coefficient is a measure of income distribution, whose value ranges from zero to one. GDP per capita was used as a measure of poverty. Consumption tax is a tax on goods and services. It comprises of VAT and Excise duty. The VAT includes not only taxes on locally produced goods and services, but also on the imported goods and services. Income tax comprises of personal income tax, which includes PAYE, and the corporation tax. Trade taxes are taxes on international trade and are composed of import and export duty. All taxes are measured as a percentage of GDP. For the control variables: Expenditure on education and health are the amounts spent by the government as either current or recurrent expenditure in provision of education or health services to the people. They were expressed as percentages of total GDP. Population growth rate is a percentage showing how population increases annually. Data on the Gini, poverty ratio, population growth and GDP per capita in local currency was obtained from World Development Indicators, while the data on the rest of the variable was obtained from the Kenya National Bureau of Statistics (KNBS). The period of study ran from 1970 to 2014.
4.3 Data analysis
The study assumed a linear relationship among the variables. Ordinary Least Squares (OLS) method was used for estimation. Data was analyzed using statistical packages to predict the relationship between dependent and independent variables. A set of two null hypotheses were tested;
H0: consumption tax does not affect poverty level HA: consumption tax affects poverty level
H0: consumption tax does not affect income distribution. HA: consumption tax affects income distribution.
The linear regression equations were estimated to conduct the hypothesis tests.
4.4 Statistical tests
The study was based on time series data. A number of tests were conducted to ensure the estimated model was reliable and consistent. The calculation of p-values for hypothesis testing has the normality assumption. It was therefore necessary to test if the population was normally distributed. A number of normality tests were performed, that is Jarque-Bera test that shows the skewness and kurtosis of the data. The data was tested for autocorrelation using correlograms and partial correlograms. Autocorrelation function (ACF) was plotted for main variables to test for autocorrelation. A correlogram plots autocorrelation against the time lags. Presence of autocorrelation means that a variable is related to its past and future values; a variable is related to its own lags. It is a preliminary analysis that could indicate presence of a trend. It is necessary to conduct further tests to check for stationarity or presence of unit root if the series appears to have autocorrelation. Non-stationary series will have autocorrelation. They need to be made stationary to run a regression. Durbin-Watson (DW) statistic was calculated to test for serial correlation.
72 International Journal of Accounting and Taxation, Vol. 5(2), December 2017
Serial correlation shows that lags of two different series are related. Augmented Dickey Fuller (ADF) test is a
test for stationarity. It tests for the presence of unit root. We test the null hypothesis that unit root is present against the alternative that there is no unit root. If we do not reject null hypothesis, unit root is present. Presence of a unit root indicates non-stationarity of the series. A series needs to be differenced to make it stationary. Once it is stationary, OLS is used for estimation. Johansen Co-integration test was also conducted to check if there is a long-run relationship among the variables. It uses two test statistics: maximum eigen value and trace tests. The null hypothesis for both is no co-integration against alternative hypothesis of co-integration. The tests Johansen test provides estimates of all co-integrating vectors. Two non-stationary series integrated of the same order, are said to be co-integrated if a linear combination of the two forms a stationary series.
Co-integration avoids spurious or inconsistent regression in non-stationary series. When two series are co-integrated, estimation is done in a Vector Error Correction Model (VECM). VECM shows the long-run trend and the short-term dynamics.
4.5 Challenges and Limitations of the study
Data on income inequality is scarce and not available for the current years. There was missing data on the Gini coefficient and Poverty ratio. Extrapolation was done to fill in the gaps. Inconsistent data from the various sources of data posed a challenge. To resolve this issue data on a specific variable was obtained from a single data source. For example, the data on all the taxes was obtained solely from the statistical abstracts by KNBS. Getting a poverty measure that fairy represents the extent of poverty was a challenge. This has been also a challenge in other poverty studies since human poverty is a complex issue with many dimensions that cannot be captured in one single number (UNDP, 1997). Poverty ratio appeared to be more appealing due to its simplicity, clarity in understanding and wide usage, but a lot of data on the variable was missing for the study period. The study therefore resulted to GDP per capita to reflect standards of living, despite its many criticisms. It is therefore the closest measure that the author could find for the study.
4.6 Areas for future research
More surveys are to be conducted to provide more and current data on poverty and inequality. Different measures of poverty and inequality can be used to investigate whether the results change. More research can be carried out on the interactions between consumption taxes, poverty and inequality. A different methodology can be used to investigate this such as the social accounting Matrix (SAM), instrumental variables among others. Finding the tax incidence of the commodity taxes could give the research a new dimension. There is a lot that can be done on this line of study.
5.0 Findings and Discussion
This section gives a description of the variables, presents and discusses the regression results. Some results of the major statistical tests are also discussed. The regression results obtained are compared with the expected and probable explanations given for the outcomes.
5.1 Descriptive statistics
The variables can be described as follows:
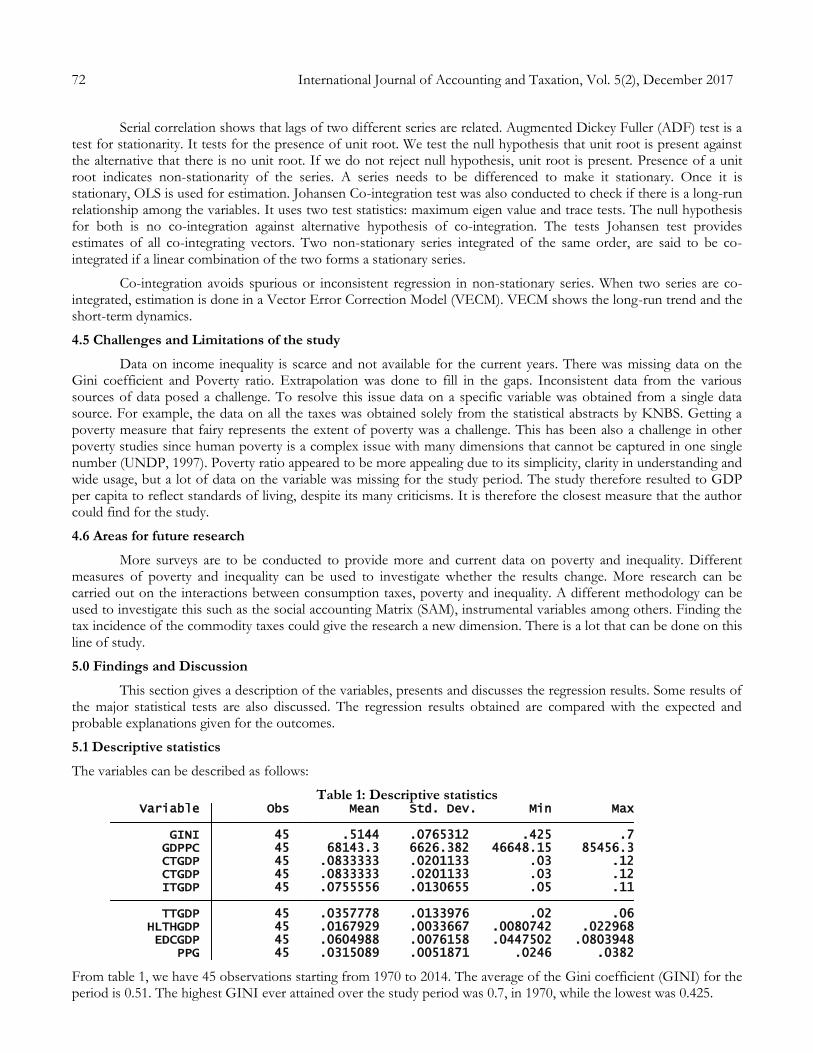
Table 1: Descriptive statistics
From table 1, we have 45 observations starting from 1970 to 2014. The average of the Gini coefficient (GINI) for the period is 0.51. The highest GINI ever attained over the study period was 0.7, in 1970, while the lowest was 0.425.
PPG 45 .0315089 .0051871 .0246 .0382 EDCGDP 45 .0604988 .0076158 .0447502 .0803948 HLTHGDP 45 .0167929 .0033667 .0080742 .022968 TTGDP 45 .0357778 .0133976 .02 .06 ITGDP 45 .0755556 .0130655 .05 .11 CTGDP 45 .0833333 .0201133 .03 .12 CTGDP 45 .0833333 .0201133 .03 .12 GDPPC 45 68143.3 6626.382 46648.15 85456.3 GINI 45 .5144 .0765312 .425 .7 Variable Obs Mean Std. Dev. Min Max
Anne Wanyagathi Maina 73
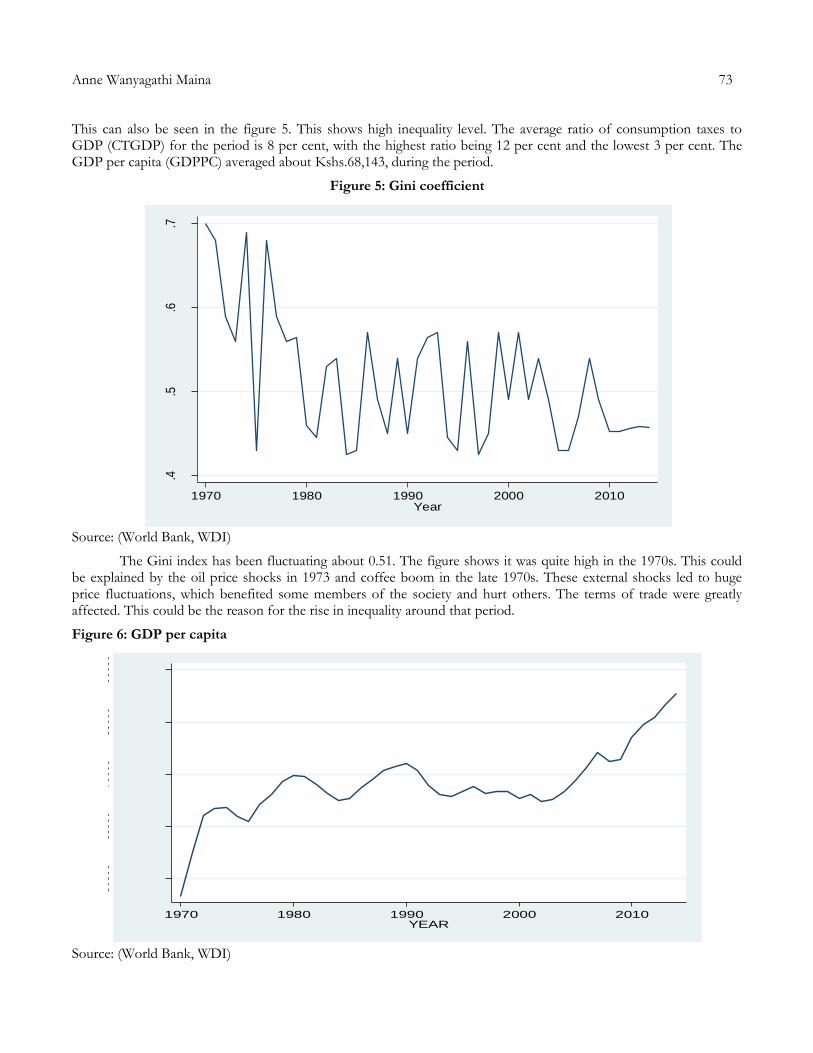
This can also be seen in the figure 5. This shows high inequality level. The average ratio of consumption taxes to GDP (CTGDP) for the period is 8 per cent, with the highest ratio being 12 per cent and the lowest 3 per cent. The GDP per capita (GDPPC) averaged about Kshs.68,143, during the period.
Figure 5: Gini coefficient
Source: (World Bank, WDI)
The Gini index has been fluctuating about 0.51. The figure shows it was quite high in the 1970s. This could be explained by the oil price shocks in 1973 and coffee boom in the late 1970s. These external shocks led to huge price fluctuations, which benefited some members of the society and hurt others. The terms of trade were greatly affected. This could be the reason for the rise in inequality around that period.
Figure 6: GDP per capita
Source: (World Bank, WDI)
.4.5
.6.7
GIN
I
1970 1980 1990 2000 2010Year
5000
060
000
7000
080
000
9000
0G
DPP
C
1970 1980 1990 2000 2010YEAR
74 International Journal of Accounting and Taxation, Vol. 5(2), December 2017
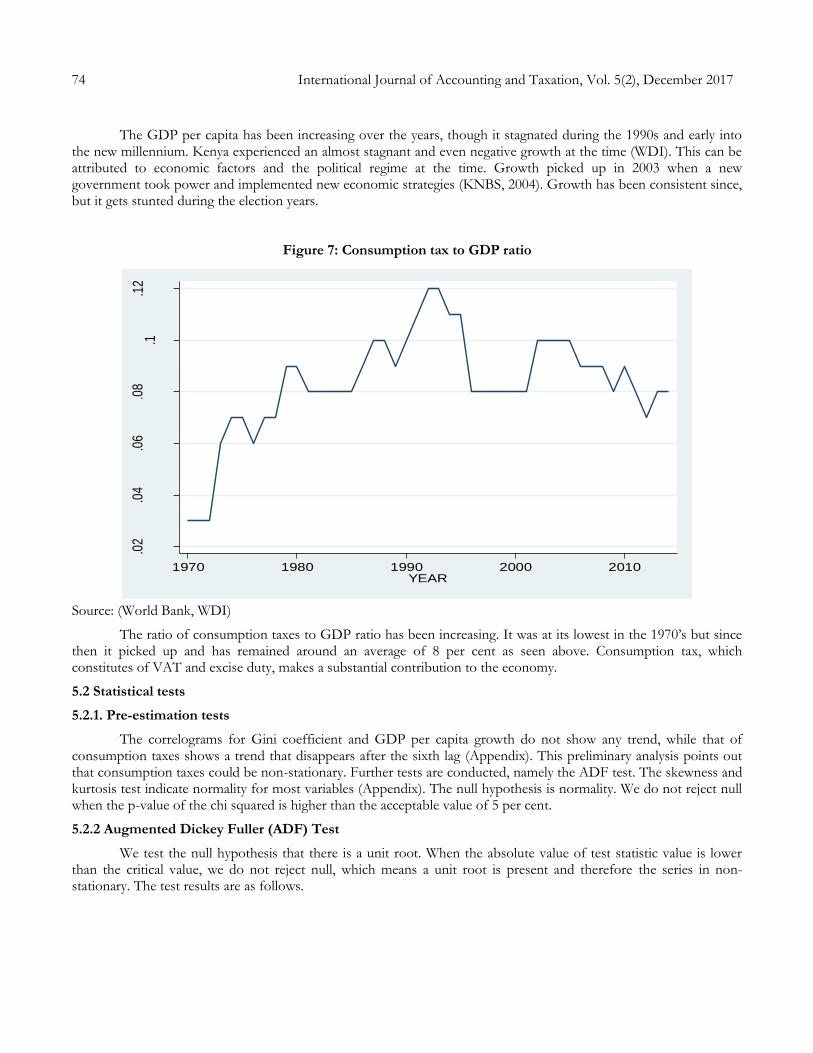
The GDP per capita has been increasing over the years, though it stagnated during the 1990s and early into the new millennium. Kenya experienced an almost stagnant and even negative growth at the time (WDI). This can be attributed to economic factors and the political regime at the time. Growth picked up in 2003 when a new government took power and implemented new economic strategies (KNBS, 2004). Growth has been consistent since, but it gets stunted during the election years.
Figure 7: Consumption tax to GDP ratio
Source: (World Bank, WDI)
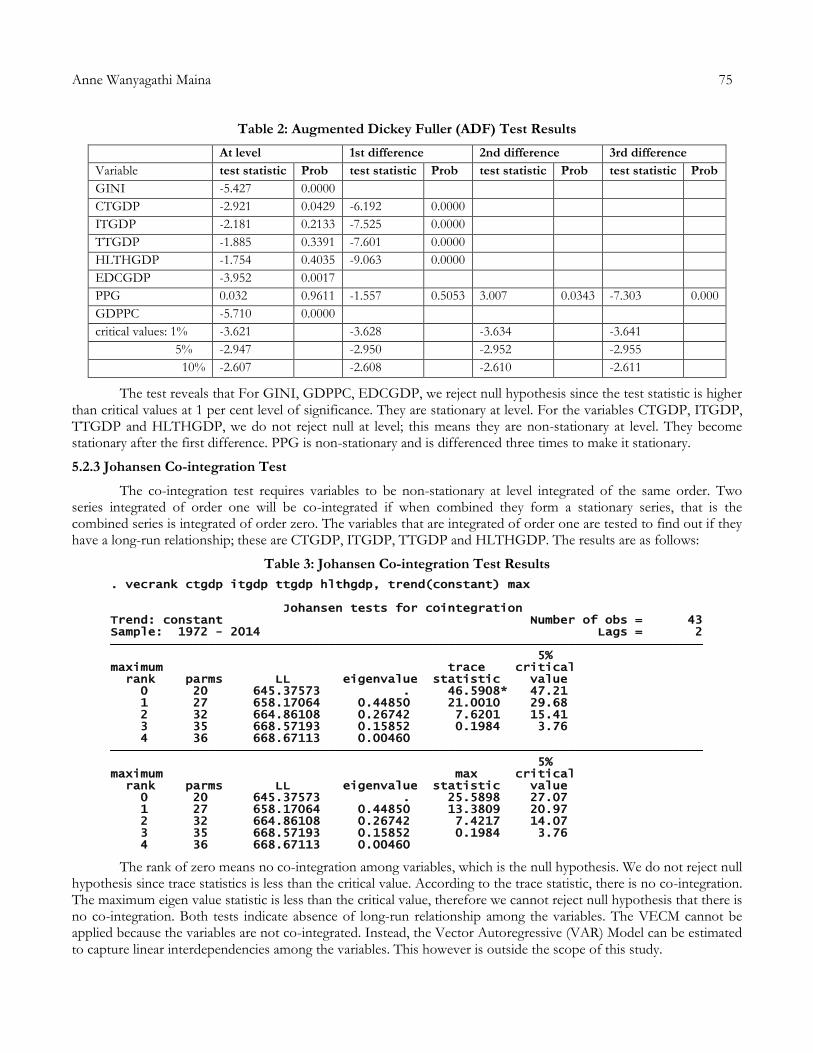
The ratio of consumption taxes to GDP ratio has been increasing. It was at its lowest in the 1970’s but since then it picked up and has remained around an average of 8 per cent as seen above. Consumption tax, which constitutes of VAT and excise duty, makes a substantial contribution to the economy.
5.2 Statistical tests
5.2.1. Pre-estimation tests
The correlograms for Gini coefficient and GDP per capita growth do not show any trend, while that of consumption taxes shows a trend that disappears after the sixth lag (Appendix). This preliminary analysis points out that consumption taxes could be non-stationary. Further tests are conducted, namely the ADF test. The skewness and kurtosis test indicate normality for most variables (Appendix). The null hypothesis is normality. We do not reject null when the p-value of the chi squared is higher than the acceptable value of 5 per cent.
5.2.2 Augmented Dickey Fuller (ADF) Test
We test the null hypothesis that there is a unit root. When the absolute value of test statistic value is lower than the critical value, we do not reject null, which means a unit root is present and therefore the series in non-stationary. The test results are as follows.
.02
.04
.06
.08
.1.1
2
CT
/GD
P
1970 1980 1990 2000 2010YEAR
Anne Wanyagathi Maina 75
Table 2: Augmented Dickey Fuller (ADF) Test Results
At level 1st difference 2nd difference 3rd difference
Variable test statistic Prob test statistic Prob test statistic Prob test statistic Prob
GINI -5.427 0.0000
CTGDP -2.921 0.0429 -6.192 0.0000
ITGDP -2.181 0.2133 -7.525 0.0000
TTGDP -1.885 0.3391 -7.601 0.0000
HLTHGDP -1.754 0.4035 -9.063 0.0000
EDCGDP -3.952 0.0017
PPG 0.032 0.9611 -1.557 0.5053 3.007 0.0343 -7.303 0.000
GDPPC -5.710 0.0000
critical values: 1% -3.621 -3.628 -3.634 -3.641
5% -2.947 -2.950 -2.952 -2.955
10% -2.607 -2.608 -2.610 -2.611
The test reveals that For GINI, GDPPC, EDCGDP, we reject null hypothesis since the test statistic is higher than critical values at 1 per cent level of significance. They are stationary at level. For the variables CTGDP, ITGDP, TTGDP and HLTHGDP, we do not reject null at level; this means they are non-stationary at level. They become stationary after the first difference. PPG is non-stationary and is differenced three times to make it stationary.
5.2.3 Johansen Co-integration Test
The co-integration test requires variables to be non-stationary at level integrated of the same order. Two series integrated of order one will be co-integrated if when combined they form a stationary series, that is the combined series is integrated of order zero. The variables that are integrated of order one are tested to find out if they have a long-run relationship; these are CTGDP, ITGDP, TTGDP and HLTHGDP. The results are as follows:
Table 3: Johansen Co-integration Test Results
The rank of zero means no co-integration among variables, which is the null hypothesis. We do not reject null hypothesis since trace statistics is less than the critical value. According to the trace statistic, there is no co-integration. The maximum eigen value statistic is less than the critical value, therefore we cannot reject null hypothesis that there is no co-integration. Both tests indicate absence of long-run relationship among the variables. The VECM cannot be applied because the variables are not co-integrated. Instead, the Vector Autoregressive (VAR) Model can be estimated to capture linear interdependencies among the variables. This however is outside the scope of this study.
4 36 668.67113 0.00460 3 35 668.57193 0.15852 0.1984 3.76 2 32 664.86108 0.26742 7.4217 14.07 1 27 658.17064 0.44850 13.3809 20.97 0 20 645.37573 . 25.5898 27.07 rank parms LL eigenvalue statistic valuemaximum max critical 5% 4 36 668.67113 0.00460 3 35 668.57193 0.15852 0.1984 3.76 2 32 664.86108 0.26742 7.6201 15.41 1 27 658.17064 0.44850 21.0010 29.68 0 20 645.37573 . 46.5908* 47.21 rank parms LL eigenvalue statistic valuemaximum trace critical 5% Sample: 1972 - 2014 Lags = 2Trend: constant Number of obs = 43 Johansen tests for cointegration
. vecrank ctgdp itgdp ttgdp hlthgdp, trend(constant) max

76 International Journal of Accounting and Taxation, Vol. 5(2), December 2017
5.3 OLS Estimation and findings
Model 1
The results for income inequality are as follows:
Table 4: Estimated regression model for Gini coefficient
Model 1: OLS, using observations 1973-2014 (T = 42) Dependent variable: GINI HAC standard errors, bandwidth 2 (Bartlett kernel)
Coefficient Std. Error t-ratio p-value
const 1.12453 0.244994 4.5900 <0.0001 ***
d_CTGDP 1.63684 0.770884 2.1233 0.0413 **
d_ITGDP −0.502759 1.26796 −0.3965 0.6943
d_TTGDP −0.617481 1.19357 −0.5173 0.6084
d_d_d_PPG −21.5005 37.8705 −0.5677 0.5741
GDPPC −5.47383e-06 1.86938e-06 −2.9282 0.0061 ***
EDCGDP −2.57904 1.1655 −2.2128 0.0339 **
d_HLTHGDP 3.10358 3.39097 0.9152 0.3667
GINI_1 −0.168013 0.157417 −1.0673 0.2936
Mean dependent var 0.504238 S.D. dependent var 0.067315
Sum squared resid 0.135485 S.E. of regression 0.064075
R-squared 0.270745 Adjusted R-squared 0.093956
F(8, 33) 2.530573 P-value(F) 0.028767
Log-likelihood 60.87236 Akaike criterion −103.7447
Schwarz criterion −88.10569 Hannan-Quinn −98.01239
Rho −0.117682 Durbin-Watson 2.224384
Gini coefficient is regressed against its own lag (GINI_1), GDP per capita (GDPPC), education to GDP ratio (EDCGDP), the first differences of the variables consumption tax to GDP ratio (d_CTGDP), income tax to GDP ratio (d_ITGDP), trade tax to GDP ratio (d_TTGDP), health to GDP ratio (d_HLTHGDP). Population growth is differenced three times to make it stationary (d_d_d_PPG). Differencing the variables is done to ensure we do not get spurious regression. The estimated model explains 28 per cent of variation in the Gini coefficient. The F-statistic shows that the independent variables explain the dependent variable. The Durbin-Watson (DW) statistic is almost equal to 2, which indicates absence of serial correlation. From the results, consumption tax affects the Gini coefficient positively at a 5 per cent level of significance. This is consistent with literature that suggests consumption taxes are regressive in nature (Obadić et al., 2014; Martinez-Vazquez, et al., 2012). A one per cent increase in consumption taxes to GDP ratio is likely to increase the GINI coefficient by 1.6368 per cent. An increase in VAT or excise tax will increase income inequality while a decrease will reduce income inequality. For re-distribution purposes, VAT rate and Excise duty should not be increased as this will worsen inequality.
The income tax and trade taxes have a negative effect on the Gini, but they are not significant determinants of income inequality. This supports the view of income taxes as being progressive (Martinez-Vazquez, et al., 2012; Saez, 2010; Barnard 2010). However, the effect is not significant in influencing income distribution; this is in line with studies by Chu et al. (2000) and Bird and Zolt (2005) who find taxes policy to be weak determinants of income inequality. GDP per capita is a strong determinant of the Gini coefficient. It has negative relationship. This means that the higher the GDP per person the lower the income inequality. Raising GDP per capital will reduce inequality. Obadić et al. (2014) find GDP per capital to positively influence the Gini coefficient, though the effect is not statistically significant in their study. Education expenditure is another significant determinant of income inequality. As expected, more expenditure on education reduces inequality (IMF, 2014; Martinez-Vazquez et al., 2012). The results further indicate that health expenditure is not a significant determinant of income inequality. This could be due to poor targeting of health expenditure. It may mean that the poor do not benefit much from health expenditure.
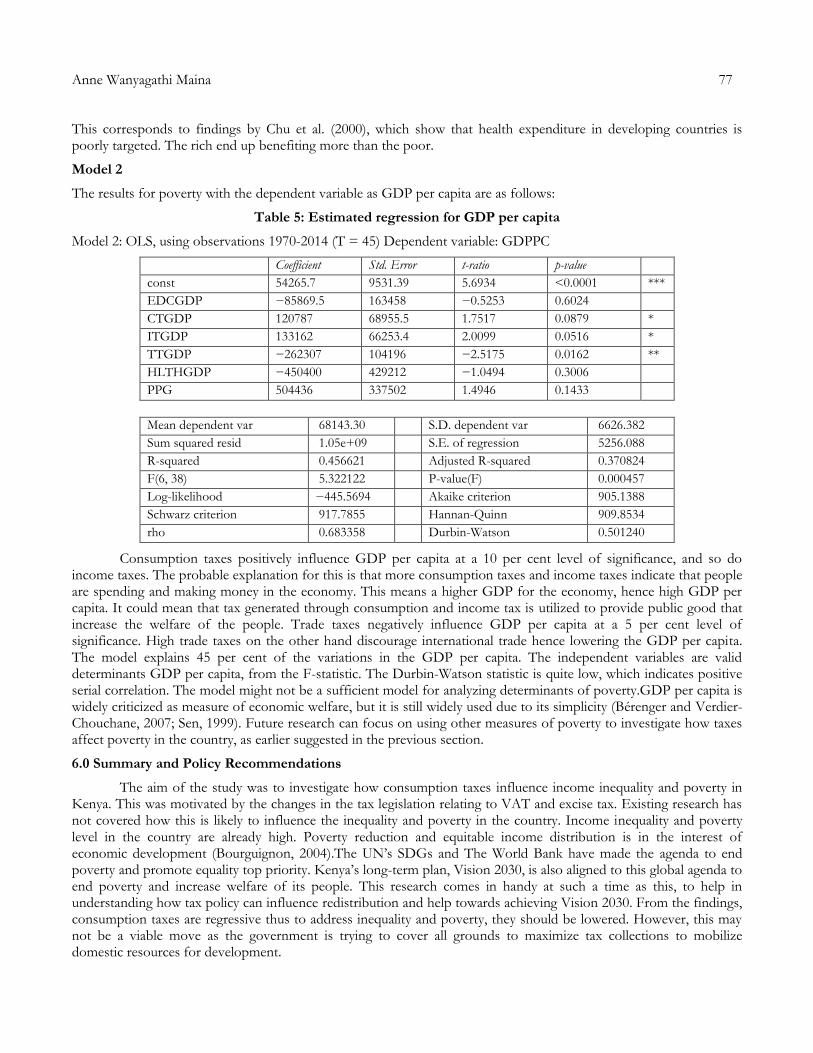
Anne Wanyagathi Maina 77
This corresponds to findings by Chu et al. (2000), which show that health expenditure in developing countries is poorly targeted. The rich end up benefiting more than the poor.
Model 2
The results for poverty with the dependent variable as GDP per capita are as follows:
Table 5: Estimated regression for GDP per capita
Model 2: OLS, using observations 1970-2014 (T = 45) Dependent variable: GDPPC
Coefficient Std. Error t-ratio p-value
const 54265.7 9531.39 5.6934 <0.0001 ***
EDCGDP −85869.5 163458 −0.5253 0.6024
CTGDP 120787 68955.5 1.7517 0.0879 *
ITGDP 133162 66253.4 2.0099 0.0516 *
TTGDP −262307 104196 −2.5175 0.0162 **
HLTHGDP −450400 429212 −1.0494 0.3006
PPG 504436 337502 1.4946 0.1433
Mean dependent var 68143.30 S.D. dependent var 6626.382
Sum squared resid 1.05e+09 S.E. of regression 5256.088
R-squared 0.456621 Adjusted R-squared 0.370824
F(6, 38) 5.322122 P-value(F) 0.000457
Log-likelihood −445.5694 Akaike criterion 905.1388
Schwarz criterion 917.7855 Hannan-Quinn 909.8534
rho 0.683358 Durbin-Watson 0.501240
Consumption taxes positively influence GDP per capita at a 10 per cent level of significance, and so do income taxes. The probable explanation for this is that more consumption taxes and income taxes indicate that people are spending and making money in the economy. This means a higher GDP for the economy, hence high GDP per capita. It could mean that tax generated through consumption and income tax is utilized to provide public good that increase the welfare of the people. Trade taxes negatively influence GDP per capita at a 5 per cent level of significance. High trade taxes on the other hand discourage international trade hence lowering the GDP per capita. The model explains 45 per cent of the variations in the GDP per capita. The independent variables are valid determinants GDP per capita, from the F-statistic. The Durbin-Watson statistic is quite low, which indicates positive serial correlation. The model might not be a sufficient model for analyzing determinants of poverty.GDP per capita is widely criticized as measure of economic welfare, but it is still widely used due to its simplicity (Bérenger and Verdier-Chouchane, 2007; Sen, 1999). Future research can focus on using other measures of poverty to investigate how taxes affect poverty in the country, as earlier suggested in the previous section.
6.0 Summary and Policy Recommendations
The aim of the study was to investigate how consumption taxes influence income inequality and poverty in Kenya. This was motivated by the changes in the tax legislation relating to VAT and excise tax. Existing research has not covered how this is likely to influence the inequality and poverty in the country. Income inequality and poverty level in the country are already high. Poverty reduction and equitable income distribution is in the interest of economic development (Bourguignon, 2004).The UN’s SDGs and The World Bank have made the agenda to end poverty and promote equality top priority. Kenya’s long-term plan, Vision 2030, is also aligned to this global agenda to end poverty and increase welfare of its people. This research comes in handy at such a time as this, to help in understanding how tax policy can influence redistribution and help towards achieving Vision 2030. From the findings, consumption taxes are regressive thus to address inequality and poverty, they should be lowered. However, this may not be a viable move as the government is trying to cover all grounds to maximize tax collections to mobilize domestic resources for development.
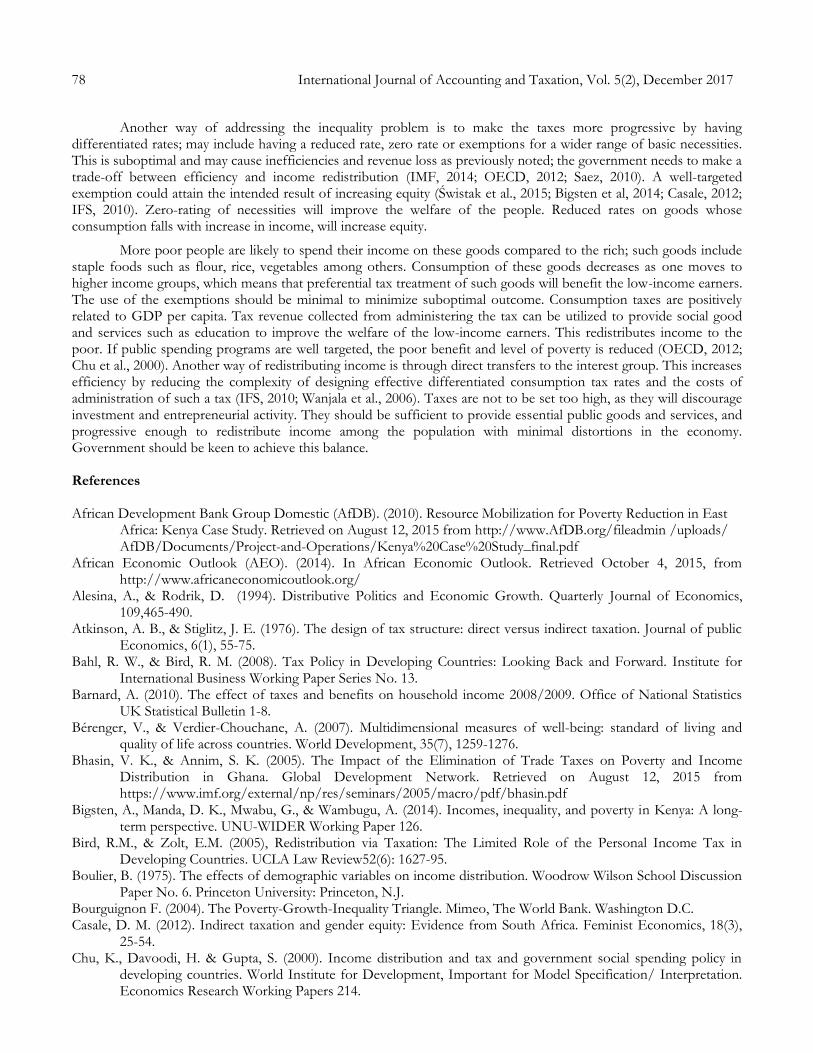
78 International Journal of Accounting and Taxation, Vol. 5(2), December 2017
Another way of addressing the inequality problem is to make the taxes more progressive by having
differentiated rates; may include having a reduced rate, zero rate or exemptions for a wider range of basic necessities. This is suboptimal and may cause inefficiencies and revenue loss as previously noted; the government needs to make a trade-off between efficiency and income redistribution (IMF, 2014; OECD, 2012; Saez, 2010). A well-targeted exemption could attain the intended result of increasing equity (Świstak et al., 2015; Bigsten et al, 2014; Casale, 2012; IFS, 2010). Zero-rating of necessities will improve the welfare of the people. Reduced rates on goods whose consumption falls with increase in income, will increase equity.
More poor people are likely to spend their income on these goods compared to the rich; such goods include staple foods such as flour, rice, vegetables among others. Consumption of these goods decreases as one moves to higher income groups, which means that preferential tax treatment of such goods will benefit the low-income earners. The use of the exemptions should be minimal to minimize suboptimal outcome. Consumption taxes are positively related to GDP per capita. Tax revenue collected from administering the tax can be utilized to provide social good and services such as education to improve the welfare of the low-income earners. This redistributes income to the poor. If public spending programs are well targeted, the poor benefit and level of poverty is reduced (OECD, 2012; Chu et al., 2000). Another way of redistributing income is through direct transfers to the interest group. This increases efficiency by reducing the complexity of designing effective differentiated consumption tax rates and the costs of administration of such a tax (IFS, 2010; Wanjala et al., 2006). Taxes are not to be set too high, as they will discourage investment and entrepreneurial activity. They should be sufficient to provide essential public goods and services, and progressive enough to redistribute income among the population with minimal distortions in the economy. Government should be keen to achieve this balance. References African Development Bank Group Domestic (AfDB). (2010). Resource Mobilization for Poverty Reduction in East
Africa: Kenya Case Study. Retrieved on August 12, 2015 from http://www.AfDB.org/fileadmin /uploads/ AfDB/Documents/Project-and-Operations/Kenya%20Case%20Study_final.pdf
African Economic Outlook (AEO). (2014). In African Economic Outlook. Retrieved October 4, 2015, from http://www.africaneconomicoutlook.org/
Alesina, A., & Rodrik, D. (1994). Distributive Politics and Economic Growth. Quarterly Journal of Economics, 109,465-490.
Atkinson, A. B., & Stiglitz, J. E. (1976). The design of tax structure: direct versus indirect taxation. Journal of public Economics, 6(1), 55-75.
Bahl, R. W., & Bird, R. M. (2008). Tax Policy in Developing Countries: Looking Back and Forward. Institute for International Business Working Paper Series No. 13.
Barnard, A. (2010). The effect of taxes and benefits on household income 2008/2009. Office of National Statistics UK Statistical Bulletin 1-8.
Bérenger, V., & Verdier-Chouchane, A. (2007). Multidimensional measures of well-being: standard of living and quality of life across countries. World Development, 35(7), 1259-1276.
Bhasin, V. K., & Annim, S. K. (2005). The Impact of the Elimination of Trade Taxes on Poverty and Income Distribution in Ghana. Global Development Network. Retrieved on August 12, 2015 from https://www.imf.org/external/np/res/seminars/2005/macro/pdf/bhasin.pdf
Bigsten, A., Manda, D. K., Mwabu, G., & Wambugu, A. (2014). Incomes, inequality, and poverty in Kenya: A long-term perspective. UNU-WIDER Working Paper 126.
Bird, R.M., & Zolt, E.M. (2005), Redistribution via Taxation: The Limited Role of the Personal Income Tax in Developing Countries. UCLA Law Review52(6): 1627-95.
Boulier, B. (1975). The effects of demographic variables on income distribution. Woodrow Wilson School Discussion Paper No. 6. Princeton University: Princeton, N.J.
Bourguignon F. (2004). The Poverty-Growth-Inequality Triangle. Mimeo, The World Bank. Washington D.C. Casale, D. M. (2012). Indirect taxation and gender equity: Evidence from South Africa. Feminist Economics, 18(3),
25-54. Chu, K., Davoodi, H. & Gupta, S. (2000). Income distribution and tax and government social spending policy in
developing countries. World Institute for Development, Important for Model Specification/ Interpretation. Economics Research Working Papers 214.

Anne Wanyagathi Maina 79
Cingano, F. (2014), “Trends in Income Inequality and its Impact on Economic Growth”, OECD Social, Employment and Migration Working Papers, No. 163, OECD Publishing. Retrieved on May 5, 2015 from http://dx.doi.org/10.1787/5jxrjncwxv6j-en
Correia, I. (2007). The Effects on Equity of an Increase in the Value-Added Tax. Retrieved on from September 8, 2015 from http://www.bportugal.pt/en-US/EstudosEconomicos/Publicacoes /BoletimEconomico /BE Anteriores/Documents/bol_primavera07_e.pdf#page=83
Defina, R. H., & Thanawala, K. (2004). International evidence on the impact of transfers and taxes on alternative poverty indexes. Social Science Research, 33(2):322-338.
Diamond, P. A., & Mirrlees, J. A. (1971). Optimal taxation and public production I: Production efficiency. The American Economic Review, 61(1), 8-27.
Djankov, S., Ganser, T., McLiesh, C., Ramalho, R. & Shleifer, A. (2010). The Effect of Corporate Taxes on Investment and Entrepreneurship. American Economic Journal: Macroeconomics, 2(3), 31-64.
Eissa, N. O., & Jack, W. (2009). Tax Reform in Kenya: Policy and Administrative Issues. Initiative for Policy Dialogue Working Paper Series.
Engel, E. M., Galetovic, A., & Raddatz, C. E. (1999). Taxes and income distribution in Chile: some unpleasant redistributive arithmetic. Journal of Development Economics, 59(1), 155-192.
Ferreira, F. H. G., ChenS., Dabalen A., D. Jolliffe D., Narayan A., Prydz E. B., Revenga A., Sangraula P., & Yoshida N. (2015). A Global Count of the Extreme Poor in 2012: Data Issues,Methodology and Initial Results. Manuscript. Washington, DC: The World Bank.
Gakuru, R., & Mathenge, N. (2012). Poverty, Growth, and Income Distribution in Kenya. The African Growth and Development Policy Modeling Consortium (AGRODEP) Working Paper, No, 0001.
Government of Kenya (GoK). (2000). Second report on poverty in Kenya: Incidence and Depth of Poverty. Ministry of Finance and Planning. Nairobi, Kenya.
Government of Kenya (GoK). (2005). Geographic dimensions of well-being in Kenya: Who and where are the poor? Central Bureau of Statistics, Ministry of Planning and National Development, Nairobi, Kenya.
Government of Kenya (GoK). (2007). Kenya Vision 2030. Nairobi: Government Printers. Government of Kenya (GoK). (2013). Value Added Tax (VAT) Act. Section 476 of the Laws of Kenya. Nairobi:
Government Printers. Haughton, J. H., & Khandker, S. R. (2009). Handbook on poverty and inequality. World Bank Publications. Hussain, A., Majeed, S., Muhammad, S. D., & Lal, I. (2010). Impact of Globalization on HDI (Human Development
Index): Case Study of Pakistan. European Journal of Social Sciences, 13(1), 46. Ilaboya, O. J., & Ohonba, N. (2013). Direct versus Indirect Taxation and Income Inequality. European Journal of
Accounting Auditing and Finance Research 1, 1:15. Institute for Fiscal Studies (IFS). (2010). Tax by Design.The Mirrlees Review. London: Institute for Fiscal Studies.
Retrieved on October 2, 2015 from: http://www.ifs.org.uk/mirrleesreview/design/taxbydesign.pdf Institute of Certified Public Accountants of Kenya (ICPAK). (2015). ICPAKdecries the misuse of public resources by
the County Governments. Press Statement. Retrieved on October 3, 2015 from: http://www.icpak. com/attachments/article/719/Press%20release-Management%20Accounting%20Conference.pdf
International Monetary Fund (IMF). (2014). FiscalPolicy and Income Inequality. IMF Policy Paper Retrieved on May 5, 2015 fromhttps://www.imf.org/external/np/pp/eng/2014/012314.pdf
Kabubo-Mariara, J., Mwabu, D., & Ndeng’e, G. (2013). Pro-poor Growth, Inequality and Institutions in Kenya. Paper presented at the Global Development Network (GDN) 14th Annual conference on Inequality, Social Protection and Inclusive Growth. Manila, Phillipines.
Kakwani, N. (1980). Income inequality and poverty: Methods of Estimation and Policy Applications. A World Bank Research Publication. Oxford University Press. Retrieved on October 2, 2015, from http://www-wds.worldbank.org/external/default/WDSContentServer/IW3P/IB/2000/01/20/000178830_98101911003475/Rendered/PDF/multi_page.pdf
Kaldor, N. (1955). Alternative Theories of Distribution. Review of Economic Studies 23, 83–100. Karanfil, F., & Özkaya, A. (2013). Indirect Taxes, Social Expenditures and Poverty: What Linkage? Dolayli Vergiler,
Sosyal Harcamalar ve Fakirlik: Nasil Bir Iliski Olabilir?. Ege Akademik Bakis, 13(3), 337.

80 International Journal of Accounting and Taxation, Vol. 5(2), December 2017
Karingi, S., Wanjala, A., Kamau, A., Nyakang’o, E., Mwangi, A., Muhoro, M., & Nyamunga, J. (2004). Fiscal
Architecture and Revenue Capacity in Kenya. KIPPRA Discussion Paper DP/45/2004. Nairobi, Kenya Kawachi, I. & Kennedy, B. P. (1997). The relationship of income inequality to mortality: Does the choice of indicator
matter?Social Science and Medicine, 45(7): 1121–1127. Kayizzi-Mugerwa, S. (2001). Globalisation, Growth and Income Inequality: The African Experience. OECD
Development Centre. WP 186. Keen, M. (2008). VAT, tariffs, and withholding: Border taxes and informality in developing countries. Journal of
Public Economics, 92(10), 1892-1906. Kenya National Bureau of Statistics (KNBS) and Society for International Development (SID). (2013). Exploring
Kenya’s Inequality: Pulling Apart or Pooling Together? Retrieved on August 10, 2015, from: http://inequalities.sidint.net/kenya/wp-ontent/uploads/sites/3/2013/10/SID%20Abridged%20Small% 20Version%20Final%20Download%20Report.pdf
Kenya National Bureau of Statistics (KNBS). (1960-2016). Statistical Abstract. Nairobi: Government Printers. Kenya Revenue Authority (KRA). (1995/1996 – 2013/2014). Statistical Bulletin. Nairobi, Kenya: KRA Krugman, P. (2014, May 8). Why we’re in a New Gilded Age. The New York Review of Books. Retrieved on
September 8, 2015, from: http://www.nybooks.com/articles/archives/2014/may/08/thomas-piketty-new-gilded-age/
Laderchi, C. R., Saith, R., & Stewart, F. (2003). Does it matter that we do not agree on the definition of poverty? A comparison of four approaches. Oxford development studies, 31(3), 243-274.
Lorenz, M. 0. (1905). Methods of Measuring the Concentration of Wealth. Journal of the American Statistical Association, 9:209-19.
Martinez-Vazquez, J., Vulovic, V. & Moreno-Dodson, B. (2012). The impact of tax and expenditure policies on income distribution: Evidence from large panel of countries. Hacienda pública española, (200), 95-130.
Milanovic, B. (2011). Worlds apart: measuring international and global inequality. Princeton University Press. Morris, M. D. (1979). Measuring the Condition of the World's Poor: The Physical Quality of Life Index. Pergamon
Press, New York. Moyi, E. & Ronge, E. (2006). Taxation and Tax Modernization in Kenya: A diagnosis of performance and option for
further reforms. Nairobi, Kenya: Institution of Economic Affairs. Muriithi, M. K., & Moyi, E. (2003). Tax reforms and revenue mobilization in Kenya. African Economic Research
Consortium (AERC), Research paper 131 Obadic, A., Šimurina, N., & Sonora, R. J. (2014). The effects of tax policy and labour market institutions on income
inequality. In Proceedings of Rijeka Faculty of Economics, Journal of Economics and Business (Vol. 32, No. 1, pp. 121-140). Retrieved on October 4, 2015 from https://www.efri.uniri.hr/sites/efri.uniri.hr/files/cr-collections/2/03-obadic-simurina-sonora-2014-1.pdf
Okner, B. A. (1975). Individual Taxes and the Distribution of Income, In The Personal Distribution of Income and Wealth. (pp. 45-74). National Bureau of Economic Research (NBER).
Organization for Economic Co-operation and Development (OECD), (2012). Income inequality and growth: The role of taxes and transfers.OECD Economics Department Policy Notes, No. 9.
Organization for Economic Co-operation and Development (OECD), (2008).Growing Unequal? Income Distribution and Poverty in OECD Countries (Paris).
Ortiz, I., & Cummins, M. (2011). Global Inequality: Beyond the bottom billion–A rapid review of income distribution in 141 countries. UNICEF Social and Economic Policy Working Paper. Retrieved on October 10, 2015 from http://www.networkideas.org/networkideas/pdfs/global_inequality_ortiz_cummins.pdf
Perotti, R. (1996) Growth, Income Distribution, and Democracy: What the Data Say. Journal of Economic Growth,1(2):149-187.
Piketty, T. (2014). Capital in the twenty-first century. Cambridge, MA, London. Rosen, H. S., & Gayer, T. (2014). Public Finance, 10th ed. Mc Graw Hill Education, UK. Saez, E. (2010). Direct or indirect tax instrument, for redistribution: Short run versus long run. Journal of Public
Economics, 88(3-4):503-518. Sen, A. (1976). Poverty: An Ordinal Approach to Measurement. Econometrica, 44(2): 219-231. Sen, A. (1981). Poverty and famines: an essay on entitlement and deprivation. Oxford university press. Sen, A. (1999). Development as freedom. Oxford: Oxford University Press
Anne Wanyagathi Maina 81
Świstak, A., Wawrzak, S., & Alińska, A. (2015). In pursuit of tax equity: lessons from VAT rate structure adjustment in Poland. Financial Theory and Practice, 39(2), 115-137.
UNDP (1997). Human Development Report (HDR). Oxford University Press. New York UNDP (2014). Human Development Report (HDR). Oxford University Press. New York Wanjala, B., Kiringai, J., & Mathenge, N. (2006). Gender and Taxation in Kenya. Institute of Economic Affairs (IEA).
Nairobi: Kenya. Weller, C.E. (2007). The Benefits of Progressive Taxation in Economic Development. Review of Radical Political
Economics, 39(3):368-376. Wilkinson, R., & Pickett, K. (2010). The Spirit Level: Why Equality Is Better for Everyone. London: Penguin Group. World Bank (WB). (2015). World Development Indicators (WDI). Retrieved November 3, 2015, from
http://databank.worldbank.org/data/. Appendix
Correlograms and Skewness-Kurtosis Test
Table 6: Correlogram for Gini coefficient
Table 7: Correlogram for GDP per Capita growth rate

82 International Journal of Accounting and Taxation, Vol. 5(2), December 2017
Table 8: Correlogram for consumption tax/GDP
Table 9: Normality test
gdppc 45 0.0029 0.0012 14.98 0.0006 edcgdp 45 0.5018 0.7821 0.54 0.7625 hlthgdp 45 0.1149 0.6781 2.83 0.2433 ttgdp 45 0.5892 0.0001 11.93 0.0026 itgdp 45 0.0069 0.1523 8.12 0.0173 ctgdp 45 0.0167 0.0546 8.17 0.0168 gini 45 0.0220 0.7420 5.20 0.0742 Variable Obs Pr(Skewness) Pr(Kurtosis) adj chi2(2) Prob>chi2 joint Skewness/Kurtosis tests for Normality
. sktest gini ctgdp itgdp ttgdp hlthgdp edcgdp gdppc