the effect of competition specific auditory …
TRANSCRIPT

0
THE EFFECT OF COMPETITION SPECIFIC AUDITORY STIMULUS DIVE TRAINING ON SWIMMING
START REACTION TIME: A RANDOMISED CONTROLLED TRIAL
A thesis submitted in fulfilment of the requirements for the degree of Master of Applied Science
(Research) in the Faculty of Health Sciences, Discipline of Exercise and Sports Science, at
The University of Sydney
Christopher R. Papic
September, 2016
SID# 309215463
Supervisors: Professor Ross H. Sanders, Associate Professor Peter Sinclair and Dr Ché Fornusek
Faculty of Health Sciences, The University of Sydney
1
ACKNOWLEDGEMENTS
My supervisors, Ross Sanders, Peter Sinclair and Ché Fornusek, for their expertise, commitment and
continual support and encouragement throughout my research masters.
Ray Patton, for the development of a unique force measurement device.
Leanne Thompson and Scott Talbot, for allowing their swimmers to participate and for their
assistance during the dive training period.
The swimmers, for their involvement and effort throughout the study.
Sydney University Sport and Fitness, for the use of the aquatic centre.
My parents, Tony and Marina, and my partner, Danielle, for their love and support.

2
ABSTRACT
A competitive swimming start shares similar auditory starting stimuli with that of an athletics track
start, yet despite there being some research on reaction time (RT) training in athletics sprinting,
there is a paucity of knowledge regarding RT training for swimming starts. The purpose of this study
was to examine the effect of competition specific auditory stimuli, compared to dive training
without auditory stimuli, on the RTs of male sub-elite adolescent swimmers. It was hypothesised
that auditory stimulus dive training can significantly improve swimming start RT and potentially
bridge the previously found performance gap in RTs between sub-elite and elite level swimmers. Ten
NSW state level swimmers (14.0 ± 1.4years) were randomly allocated into two four week dive
training programs; dive training without auditory stimulus (Cohort 1: C1, n=5) or competition specific
auditory stimulus dive training (C2, n=5). Swimmers’ RT (≥ 0.100s), block time (BT) and ‘time to 15m’
were measured pre- and post-intervention using an instrumented starting block, with a custom
made force measurement device (1000Hz), and a high speed camera (96Hz). Pre- and post-
intervention results from all three parameters were compared to those of a group of six male elite
level (Australian open national level) swimmers (C3) (19.8 ± 1.0years). A significant Time by Group
interaction (p = .005) indicated that competition specific auditory stimulus dive training resulted in
faster participant RTs in response to the auditory ‘go’ signal when compared with regular dive
training. C2 had significantly faster post- than pre-intervention RT results (p = .028), whereby the
cohort mean RT reduced by 0.012s and the mean cohort effect size was of ‘large’ (d ≥ ± 0.8)
magnitude (d = -.99). C1 had a slower mean cohort RT from pre- to post-intervention, which
approached statistical significance (p = .098) and a ‘large’ mean cohort effect size (d = .74). There
were no significant differences in C3’s pre-intervention RTs and C2’s pre-intervention (p = .377) or
post-intervention RTs (p = .766). However, C3 had significantly faster BTs than C1 (p = .016) and C2
(p = .048) pre-intervention. Neither of the two dive training interventions revealed statistically
significant changes to BT or ‘time to 15m’ post-intervention. The present study demonstrates that

3
auditory stimulus training can improve the RT of swimmers to the starting signal. However, this
contribution to performance is small relative to the other components of ‘time to 15m’; BT, flight
time and underwater time. Further research is required to investigate the effect of auditory stimulus
training with elite level swimmers, especially those competing in short distance events, and other
sports such as athletics.
Keywords: reaction time, auditory stimulus, motor control and learning, swimming
4
Table of Contents
PRELIMINARY MATERIALS ....................................................................................................................... 6
TABLES LIST ......................................................................................................................................... 6
Literature Review ....................................................................................................................... 6
Methodology .............................................................................................................................. 6
Results ........................................................................................................................................ 6
FIGURES LIST ....................................................................................................................................... 7
Literature Review ....................................................................................................................... 7
Methodology .............................................................................................................................. 7
RESEARCH ............................................................................................................................................... 8
CHAPTER 1: INTRODUCTION ............................................................................................................... 8
CHAPTER 2: LITERATURE REVIEW ..................................................................................................... 10
2.1 Auditory stimuli and reaction time .................................................................................... 10
2.1.1 Simple auditory reaction time in sport .............................................................. 10
2.1.2 Reaction time: Sensorimotor neural pathways ................................................. 12
2.1.3 Auditory stimuli and reaction time summary .................................................... 13
2.2 Sub-elite versus elite level athletes ................................................................................... 13
2.3 Swimming start performance ............................................................................................ 14
2.3.1 Swimming start phases ...................................................................................... 15
2.3.2 Swimming start training interventions .............................................................. 17
2.3.3 Swimming warm-up interventions .................................................................... 22
2.4 Methodology in swimming start research ......................................................................... 23
2.4.1 Sample and participants .................................................................................... 23
2.4.2 Research design ................................................................................................. 24
2.4.3 Data collection methodology: Analysis of reaction time and block time .......... 26
2.4.4 Data collection methodology: Force measurement device ............................... 28
2.4.5 Data collection methodology: Questionnaire instrument ................................. 29
2.4.6 Methodology in swimming start research summary ........................................ 30
2.5 Literature review summary ................................................................................................ 30
CHAPTER 3: METHODOLOGY ............................................................................................................ 31
3.1 Participants ........................................................................................................................ 31
3.2 Research design ................................................................................................................. 32
3.3 Testing procedures ............................................................................................................ 33
3.4 Swimming start variables ................................................................................................... 35

5
3.5 Data collection .................................................................................................................. 35
3.5.1 Instrument: Force measurement device .......................................................... 36
3.5.2 Instrument: High speed camera ....................................................................... 40
3.5.3 Instrument: Questionnaire ............................................................................... 41
3.6 Data analysis ..................................................................................................................... 43
3.6.1 Data analysis: Force measurement device ....................................................... 43
3.6.2 Data analysis: High speed camera .................................................................... 47
3.6.3 Data analysis: Questionnaire ............................................................................ 48
3.7 Statistical analysis .............................................................................................................. 48
CHAPTER 4: RESULTS ......................................................................................................................... 49
4.1 Participant compliance ...................................................................................................... 49
4.2 Swimming start data: Inclusion and exclusion .................................................................. 50
4.3 Swimming start interventions: Summary of results ......................................................... 50
4.4 The effect of competition specific auditory stimulus training on swimming start reaction
time ......................................................................................................................................... 52
4.5 The effect of regular dive training and regular dive training with competition specific
auditory stimulus on swimming start performance ................................................................ 53
4.5.1 Block time analysis ............................................................................................. 53
4.5.2 ‘Time to 15m’ analysis ....................................................................................... 53
4.6 Reaction times and block times of sub-elite and elite level swimmers ............................. 54
4.7 Participant perceptions of swimming start training interventions .................................... 54
CHAPTER 5: DISCUSSION ................................................................................................................... 56
CHAPTER 6: CONCLUSIONS AND IMPLICATIONS .............................................................................. 64
6.1 Conclusions ........................................................................................................................ 64
6.2 Limitations and future directions....................................................................................... 65
REFERENCES ...................................................................................................................................... 68
APPENDICES ...................................................................................................................................... 77
Appendix 1: Participant information sheets and consent forms ............................................. 77
Appendix 2: Ethics approval letter ........................................................................................... 91
Appendix 3: Swimming start data collection ........................................................................... 93

6
PRELIMINARY MATERIALS
TABLES LIST
Literature review
Table 1: Participant samples evident in swimming start intervention research (previously cited in
‘swimming start training interventions’ 2.3.2)
Table 2: Swimming start data collection methodology, assessing BT and/or RT (previously cited in
‘Swimming start performance’ 2.3)
Methodology
Table 3. Outline of implemented dive training interventions across two cohorts of sub-elite
adolescent swimmers
Table 4: Questionnaire (cohort 2): Perceptions of competition specific auditory stimulus dive training
Table 5: Determining the time point of muscular activation during a swimming start
Table 6: Summary of the analysis criteria for each significant time point during the ‘on-block’ phase
Results
Table 7: Participant attendance and number of dives completed
Table 8: Summary of the effect of swimming start interventions on RT, BT and ‘time to 15m’
Table 9: Questionnaire results: Participant perceptions of swimming start training interventions

7
FIGURES LIST
Literature review
Figure 1: On-block phase (Squire, 2012)
Figure 2: In-flight phase (Squire, 2012)
Figure 3: Underwater phase (Macnicol, 2012)
Figure 4: Free swimming phase (Bello, 2012)
Methodology
Figure 5: Piezo cable image (Measurement Specialities, 2015)
Figure 6: Internal structure of a piezo cable (Images, 2015)
Figure 7: Omega OSB-11 starting block (Swiss Timing, 2009)
Figure 8: Omega OSB-11 starting block with force measurement device attached
Figure 9: Data collection setup
Figure 10: Speaker, electronic horn and wireless microphone
Figure 11: Diagram of swimming start testing data collection setup
Figure 12: Change in force production during a swimming start
Figure 13: Change in audio data in response to the auditory ‘go’ signal

8
THE EFFECT OF COMPETITION SPECIFIC AUDITORY STIMULUS DIVE TRAINING ON SWIMMING
START REACTION TIME: A RANDOMISED CONTROLLED TRIAL
CHAPTER 1: INTRODUCTION
Swimming at a competitive international level was first introduced to the Olympic Games in 1896,
with the 1956 Olympic Games being the first year that all four swimming strokes were represented.
While there has been a growing volume of research related to improving swimming performance,
research aimed at developing training methods to improve swimming start performance remains
sparse. Research has focussed mainly on elite level athletes, with less attention given to
investigating performance improvement in competitive adolescent swimmers. Competitive
adolescent swimmers are the next generation of elite level swimmers and therefore would benefit
from tailored, evidence-based training interventions aimed at improving swimming start and overall
race performance.
Start times to 15m have been found to vary from 0.8% to 26.1% of the overall race time, depending
on the event (Cossor & Mason, 2001) with the percentage contribution decreasing with increasing
race distance (Hay, 1986). While it is known that improvements in swimming start technique can
reduce total time of an event by at least 0.1s (Maglischo, 1999 cited in Ruschel, Araujo, Pereira, &
Roesler, 2007) there is a scarcity of research assessing the effect of dive training interventions on the
reaction time (RT) of competitive swimmers. Scrutiny of daily swimming programs reveals that the
majority of current competitive swimmers do not complete habitual dive training with the same
auditory stimuli used to commence a swimming race. Task specific training has been shown to
improve participant RTs when re-exposed to the same stimulus (Nuri, Shadmehr, Ghotbi, &
Attarbashi Moghadam, 2013; Gavkare, Nanaware, & Surdi, 2013; De Souza, Yehia, Sato, & Callan,
2013; Tong, Melara, & Rao, 2009). While RT training interventions have been used effectively in non-
sporting literature (Madanmohan et al., 1992), there is a paucity of research investigating the effect
9
of using task specific training, with the aim of improving athletes’ RTs, in sporting codes involving
auditory stimuli.
Reaction time is a small component of the total time spent during the on-block phase of a swimming
start. It may be hypothesized that RT improvements would result in an earlier application of force by
the swimmers and reduce BT. Since the introduction of the Omega OSB-11 starting blocks (Swiss
Timing, 2009) into international competitive swimming, swimmers have been able to produce faster
BTs without the trade-off of reduced horizontal take-off velocity (Honda, Sinclair, Mason, & Pease,
2010; Slawson, Conway, Cosser, Chakravorti, & West, 2013). Therefore, improvements in participant
BTs have the potential to improve overall swimming start performance (‘time to 15m’).
Experienced competitive swimmers spend less time between the start signal and applying force to
the block than less experienced swimmers (Vantorre, Chollet, & Seifert, 2014). However, there exists
a gap in the research surrounding the development of effective swimming start training methods for
swimmers who have the potential to progress to a higher level of competitive swimming. The
purpose of this study was to examine the effect of competition specific auditory stimuli, compared
to dive training without auditory stimuli, on the RTs of male sub-elite (state level) adolescent
swimmers. It was hypothesised that auditory stimulus dive training can significantly improve
swimming start RTs and potentially bridge the previously found performance gap in RTs between
sub-elite and elite level swimmers.

10
CHAPTER 2: LITERATURE REVIEW
2.1 Auditory stimuli and reaction time
Tripp (1965) stated that practice of a skill reduces decision time (recognition of an auditory ‘go’
stimulus) and thus enables the correct decision to be made more efficiently. Furthermore, if an act is
practised enough a conditioned reflex may develop, such as an athletics track sprinter becoming
conditioned to the starting auditory stimulus. Competitive swimming and track running involve a
speaker and an auditory ‘go’ signal to commence a race. Reaction time is considered to be the time
between the stimulus being presented and the initiation of muscular activation (Johnson & Nelson,
1988). It is evident through research that RTs during sport are faster among elite level athletes than
sub-elite trained athletes (Vantorre et al., 2014; Slawinski et al., 2010). Also, task specific training has
been shown to improve RT in various sports and training tasks (refer to 2.1.1). Furthermore, training
for specific frequencies of sound with an associated behavioural task has shown neurological
changes to sensorimotor neurological pathways associated with simple auditory RT within subjects,
when they are re-exposed to the same stimulus (refer to 2.1.2).
2.1.1 Simple auditory reaction time in sport
Simple auditory RT in swimming is dependent on several factors; auditory stimulus (‘go’ signal)
reaching the sensory organ (ear), conversion of the stimulus to a neural signal, neural transmissions
and processing and then muscular activation (Pain & Hibbs, 2007). The associated processing time
for each of these components contributes to the overall RT during a swimming start. The simple
auditory RT is thought to be rarely less than 100ms and is known to be one of the fastest forms of RT
(Thompson et al., 1992). It is for this reason that the International Association of Athletics
Federations (IAAF) has a false start criterion during athletics of 100ms, working under the

11
assumption that athletes who have reacted in under 100ms have anticipated the starting signal
(IAAF, 2016, “100 Metres”, para. 1).
In athletics the fastest likely pre-motor (prior to muscular activation) time, based on the involuntary
startle reflex response and inclusive of the time for the start signal to travel to the athlete, is 63ms
(Pain & Hibbs, 2007). This value (63ms) is derived from the processing times associated with the
signal reaching the brainstem from the ear (10ms) and then from the brain stem to the spinal cord
and subsequent innervation of muscles (50ms) (Kemp, Coppeé, & Robinson, 1937). While 63ms is
theoretically the lowest likely pre-motor time for the involuntary startle reflex, RT is a voluntary
response to the auditory stimulus, requiring further neural processing and resulting in longer RTs.
analysis of 100m track sprinters at the Athens Olympic Games (2004) revealed an average RT of male
(n=76) and female sprinters (n=50) of 0.164s and 0.184s respectively (Delalija & Babić, 2008). Prior
to the introduction of the OSB-11 starting blocks, swimmers using the track start technique have
been found to exhibit RTs of 0.23s (Blanksby, Nicholson, & Elliott, 2002) and as low as 0.17s
(Benjanuvatra, Lyttle, Blanksby, & Larkin, 2004).
Sensory-cognitive skills of athletes have been found to be greater in their specific sport domain.
Auditory RT and anticipatory skill were tested in a group of athletes consisting of eleven track
sprinters and eleven volleyball players (Nuri et al., 2013). Sprinters were found to have faster
auditory RTs whilst volleyball players showed superior anticipatory skill. This was further supported
by Gavkare, Nanaware and Surdi (2013) who concluded that auditory, visual, and whole body RTs
were significantly less in athletes (n=50) than healthy participants of the same age (n=50). Findings
from the literature reveal that elite athletes across different sporting codes exhibit faster RTs in their
specific sport when compared with other tasks. Therefore, it would be expected that task specific
training, such as simulated competition swimming starts, could improve RT in the given task. It has
12
been suggested that improvements in task specific RTs can be attributable to changes in
sensorimotor neural pathways associated with a simple auditory RT.
2.1.2 Reaction time: Sensorimotor neural pathways
Neuronal functional specificity refers to favourable alterations to the previously discussed factors of
simple auditory RT, resulting in faster processing times to a specific stimulus when the subject is re-
exposed to it (De Souza et al., 2013). Neuronal functional specificity to sensory stimulation has been
shown to be alterable and specific to experience. De Souza et al. (2013) examined auditory
frequency discrimination, using functional magnetic resonance imaging (fMRI) and
electroencephalography (EEG), in eleven subjects (ten males) with a mean age of 24 years.
Functional magnetic resonance imaging measures brain activity by detecting changes in blood flow
to specific regions of the brain, whilst EEG devices record electrical activity in the brain through the
use of surface electrodes. Improvements in task performance by the participants were associated
with plastic changes in the sensory cortex and superior areas that are gated by selective attention. In
another neuroscience study, auditory tone discrimination and an associated behavioural response
was analysed by a device that measured the magnitude of auditory event-related potentials (Tong et
al., 2009). This refers to electrical impulses within the brain in response to the stimulus. The
researchers used a specific waveform component (‘P2’) of electrical impulses within the brain as an
outcome measure for the study. Participants performed both passive (listening) and active
(detecting) ‘oddball’ tasks in pre-training and post-training tests. ‘Oddball’ tasks have been used
throughout neuroscience research and involve presenting participants with sequences of repetitive
auditory/visual stimuli which are then interrupted by a deviant stimulus. The participants are
required to respond to the target stimulus which occurs rarely amongst a series of more common
stimuli. Tong and colleagues (2009) found that the ‘oddball’ training tasks improved both perceptual

13
sensitivity and RTs, which correlated with enhancement of the measured waveform component.
Thus, repeated auditory stimuli discrimination training was associated with faster participant RTs.
2.1.3 Auditory stimuli and reaction time summary
Task specific training has been shown to improve participant RTs when they are re-exposed to the
same stimulus (Nuri et al., 2013; Gavkare et al., 2013; De Souza et al., 2013; Tong et al., 2009). This
improvement in RT can be attributed to neuronal functional specificity which involves faster
processing times in the sensorimotor pathways associated with a simple auditory RT (De Souza et al.,
2013). Sub-elite (competitive adolescent) swimmers have been shown to have slower swimming
start RTs than elite level swimmers (Vantorre et al., 2014). Consequently, the concept of neuronal
functional specificity, to an auditory ‘go’ signal, has implications in competitive swimming through
the use of auditory RT training. Re-exposing sub-elite swimmers who are on the cusp of progressing
into elite level swimming to competition specific auditory stimuli during regular dive training, has the
potential to reduce RT and translate to improvements in overall swimming start performance.
2.2 Sub-elite versus elite level athletes
Sub-elite adolescent swimmers are deemed as ‘sub-elite’ as they have slower race times than elite
level swimmers across the same event. Noticeably, this performance gap also holds for swimming
start performance variables such as RT and the time spent on the diving block (‘block time’: BT). A
systematic review conducted by Vantorre, Chollet and Seifert (2014) revealed that experienced
competitive swimmers spent less time between the start signal and applying force to the block than
less experienced swimmers. Experienced swimmers have a greater accumulation of time spent at a
competitive level, which is thought to produce faster RTs through more directed concentration on

14
the starting auditory stimulus and less nervous system processing whilst on the block (Maglischo,
1982).
Given that track starts in athletics are similar to swimming track starts with regard to body
positioning, kinematics and competition auditory stimuli, research in athletics may also provide
insight to competitive swimming starts. In a study comparing kinematic, kinetic and dynamic
parameters of six elite and six well-trained runners during a block start, the rate of force
development and impulse were significantly greater in elite sprinters than sub-elite sprinters
(Slawinski et al., 2010). The studies by Vantorre et al. (2014) and Slawinski et al. (2010) highlighted
that elite athletes are highly trained and are more efficient in their specific starting technique,
resulting in faster BTs and greater performance outcomes than sub-elite athletes. The performance
gap in BT could also be attributed to faster athlete RTs, as RT is a small component of the overall
time spent on a starting block in both swimming and athletics. Consequently, it is worth exploring
whether competition specific auditory stimulus dive training can be used to effectively improve RTs
of sub-elite adolescent swimmers towards that of elite level swimmers.
2.3 Swimming start performance
In line with the underwater phase limit implemented by the world swimming governing body, FINA,
the ‘swimming start’ is considered to be the first 15m of a race, where the swimmer must break the
surface of the water before 15m and commence swimming (Cossor & Mason, 2001). Of the ‘time to
15m’, the swimming start is comprised of three overall components; BT, flight time and water time
(Blanksby et al., 2002; Guimaraes & Hay, 1985; Maglischo, 2003; Schnabel & Kuchler, 1998). Within
these components of the swimming start, researchers have aimed to identify the key characteristics
of dive technique that have a direct relationship with overall swimming start performance (refer to
2.3.1). These studies primarily involve the outcome measure BT as part of their analysis (refer to
15
2.3.1), while there is a paucity of studies addressing swimming start performance through the
analysis of RT. The evidence suggests that with practice, swimmers learn an effective combination of
minimising time spent on the block and maximising take-off velocity (Guimaraes & Hay, 1985;
Vantorre, Seifert, Fernandes, Boas, & Chollet, 2010). Additionally, as improvements in swimming
start technique can reduce the event’s total time by at least 0.1s (Maglischo, 1999 cited in Ruschel et
al., 2007), researchers have assessed the effectiveness of training (refer to 2.3.2) and warm-up (refer
to 2.3.3) interventions on swimming start performance.
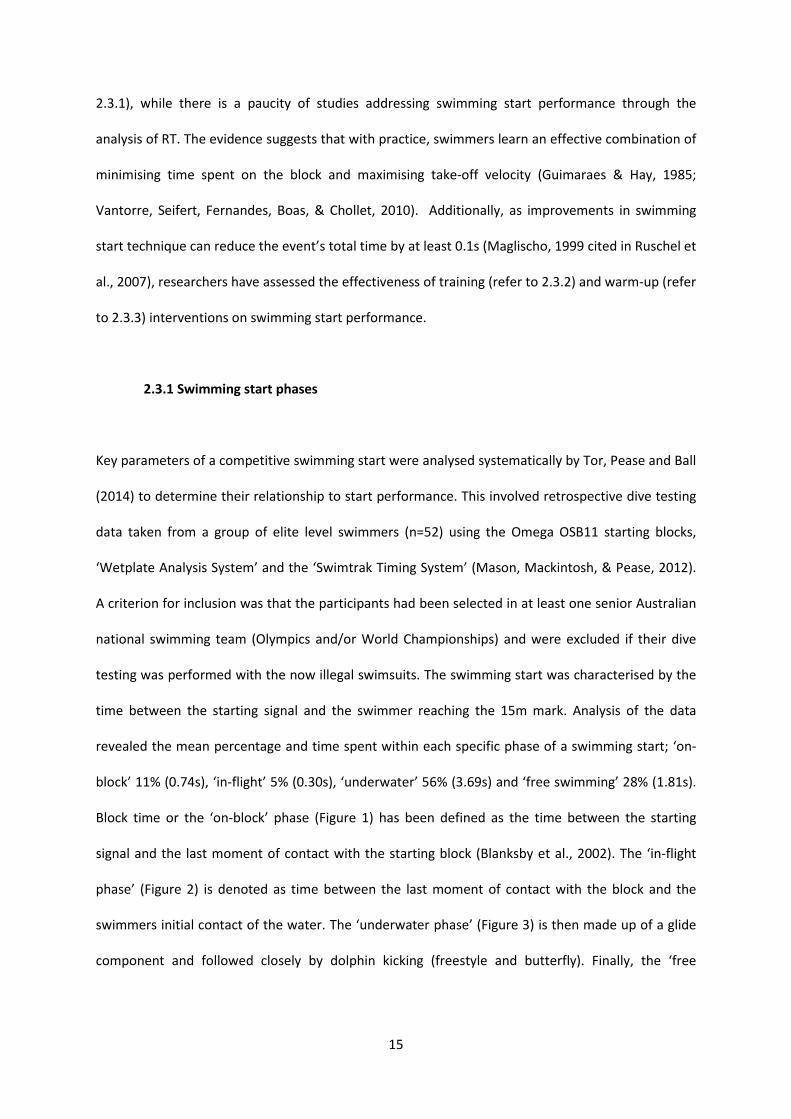
2.3.1 Swimming start phases
Key parameters of a competitive swimming start were analysed systematically by Tor, Pease and Ball
(2014) to determine their relationship to start performance. This involved retrospective dive testing
data taken from a group of elite level swimmers (n=52) using the Omega OSB11 starting blocks,
‘Wetplate Analysis System’ and the ‘Swimtrak Timing System’ (Mason, Mackintosh, & Pease, 2012).
A criterion for inclusion was that the participants had been selected in at least one senior Australian
national swimming team (Olympics and/or World Championships) and were excluded if their dive
testing was performed with the now illegal swimsuits. The swimming start was characterised by the
time between the starting signal and the swimmer reaching the 15m mark. Analysis of the data
revealed the mean percentage and time spent within each specific phase of a swimming start; ‘on-
block’ 11% (0.74s), ‘in-flight’ 5% (0.30s), ‘underwater’ 56% (3.69s) and ‘free swimming’ 28% (1.81s).
Block time or the ‘on-block’ phase (Figure 1) has been defined as the time between the starting
signal and the last moment of contact with the starting block (Blanksby et al., 2002). The ‘in-flight
phase’ (Figure 2) is denoted as time between the last moment of contact with the block and the
swimmers initial contact of the water. The ‘underwater phase’ (Figure 3) is then made up of a glide
component and followed closely by dolphin kicking (freestyle and butterfly). Finally, the ‘free

16
swimming’ phase (Figure 4) is considered as the time between the swimmer breaking the surface of
the water and their head reaching the 15m mark.
Figure 1: On-block phase (Squire, 2012) Figure 2: In-flight phase (Squire, 2012)
Figure 3: Underwater phase (Macnicol, 2012) Figure 4: Free swimming phase (Bello, 2012)
Block time quantifies the combined reaction and movement times of swimmers during a swimming
start. A number of studies have quantified average BTs amongst participant groups consisting of sub-
elite (‘state level’) and elite (‘national’ and ‘international level’) level swimmers. The study by Tor,
Pease and Ball (2014) found elite level male swimmers had an average BT of 0.72s and females,
0.77s. Ruschel, Araujo, Pereira and Roesler (2007) found an average BT of 0.85s within a group of
four state and national level Brazilian swimmers. Benjanuvatra, Lyttle, Blanksby and Larkin (2004)
found an average BT during grab and track starts of 0.94s and 0.89s respectively of nine male and
seven female national and international level swimmers. Similarly, research carried out in Spain
using a group of elite level swimmers (n=17) reported a subject average BT of 0.850s (Arellano,
17
Pardillo, De La Fuente, & Garcia, 2002). Finally, at the Sydney Olympic Games (2000), Cossor and
Mason (2001) of the Australian Institute of Sport analysed swimming start performances of semi-
finalists and finalists. Analysis of the 100m butterfly event revealed that swimmers who were slower
to leave the blocks recorded slower 15m start times.
It is evident that average BTs in both sub-elite and elite level swimmers approaches one second
(Ruschel et al., 2007; Benjanuvatra et al., 2004; Arellano et al., 2002), which amounts to a significant
percentage of overall race time in sprint races. Furthermore, research has shown that reductions in
BT translate to improvements in overall start performance, regardless of the event (Garcia-Hermoso
et al., 2013; Vantorre et al., 2010). Consequently, the integration of auditory RT training methods,
coupled with regular dive training, may have the potential to improve BT and overall swimming start
performance.
2.3.2 Swimming start training interventions
Research has revealed that elite level swimmers exhibit an effective combination of minimizing time
spent on the block and maximising their take-off velocity during a swimming start (Guimaraes & Hay,
1985; Vantorre et al., 2010). As a result, swimming training interventions have been implemented to
assess their effect on BT and swimming start performance, with the goal of informing training
techniques. Types of swimming start training interventions include; jump training (‘plyometrics’),
resistance training and regular dive training.
Plyometric training focuses on moving from muscle extension to contraction in a rapid manner (Chu,
1998) and is seen as an effective form of exercise to induce functional muscular changes (Masamoto,
Larson, & Gates, 2003). Improvements in swimming start performance through the use of plyometric
training have been brought about by increased take-off velocity, resulting in faster 15m start times.

18
Improvements in take-off velocity are attributable to changes in torque of the lower limbs and
greater horizontal force being applied through the block during a swimming start. Investigation of
changes in torque of the lower limb joints as a result of plyometric training and its translation to the
kinetics and kinematics of a swimming start was conducted on a group of ten experienced swimmers
(seven male: 22 ± 1.4years, three female: 21.3 ± 7.6years) (Rebutini, Pereira, Bohrer, Ugrinowitsch,
& Rodacki, 2014). The nine week plyometric training program significantly increased hip and knee
torque as well as horizontal force, impulse and horizontal take-off velocity. Bishop, Smith, Smith and
Rigby (2009) examined the effect of a plyometric training intervention on swimming starts, using a
performance based outcome measure of ‘time to 5.5m’. The study involved a group of adolescent
swimmers (n=11, 13.1 ± 1.4years) who performed two weekly one hour plyometric specific sessions,
over eight weeks. The intervention group showed significantly greater improvement in start
performance than the control group (n=11, 12.6 ± 1.9years), reducing time to 5.5m by 0.59s in the
intervention group, compared with a reduction of 0.21s in the control (p < .01). Furthermore, a four
week combined training program involving plyometric, swimming start and visual and auditory
components was implemented on a treatment group of eight male national level sprint swimmers
(17.5 ± 0.9years) (Lepretre, Kazarine, Puel, Chollet, & Fernandes, 2014). This cohort study resulted in
improved 15m start times of the participants by approximately 1.0%.
The effect of land plyometric training versus aquatic plyometric training on swimming start
performance was investigated by Hassannezhad, Bahadoran, Ramezanpour and Attarzade (2012).
The study involved a six week training period (three sessions per week) using lifesavers who were
randomly allocated into three cohorts; land training (n=7), aquatic training (n=7) and control (n=7).
Training sessions were 45 to 60min in length and consisted of depth, star, rocket and squat jumps,
either on land or in an aquatic setting. The results revealed insignificant changes in BT from pre- to
post-intervention for both land and aquatic plyometric training when compared with the habitual
training group. Furthermore, no significant differences in start performance were found when

19
comparing land plyometric training and aquatic plyometric training. The ineffectiveness of these
interventions on start performance may have been attributable to the fact that the lifesavers were
not skilled in the technique of competitive swimming dives prior to the intervention period.
Throughout the literature it has been shown that plyometric land training with competitive
swimmers improves start performance through the increase in take-off velocity (Rebutini et al.,
2014), and the subsequent translation to improvements in 5.5m (Bishop et al., 2009) and 15m
(Lepretre et al., 2014) start times. These improvements may also be due to plyometric training
mimicking a swimming start with an explosive push off and the demonstration of similar kinematic
properties. However, plyometric training literature does not account for changes in RT and BT when
considering improved swimming start times. Therefore, it is worth exploring how changes in RT and
BT in response to training interventions correlate to overall swimming start performance.
Lower limb resistance training programs are also evident throughout the literature and have shown
to improve swimming start performance outcomes. Similar to plyometric training, physiological
changes in swimmers as a result of resistance training interventions have also improved take-off
velocity and resulted in faster performance outcomes. These improvements are evident in a study
involving German international swimmers (n=7) which comprised of a four week lower limb strength
training program consisting of three weekly training sessions (Hohmann, Fehr, Reuss, Straub, &
Kieser, 2010). Swimming start performance was measured pre-intervention, post-intervention, and
four weeks post-intervention (retention time point). Maximum and explosive strength parameters
(countermovement jump and squat jump) of the lower limb improved, as well as time to 7.5m (Pre-
intervention = 2.70 ± 0.28s vs Retention time point = 2.63 ± 0.28s). In addition to this, Breed and
Young (2002) randomly allocated a cohort of non-competitive (athletes from different sport codes
other than swimming) female swimmers into a resistance training group (n=12) and a control group
(n=11). The resistance training group undertook three training sessions a week for nine weeks. Dive
20
start testing was performed by both groups, pre-intervention and post-intervention, by performing
three diving techniques (grab, track and swing). Analysis of the results revealed significant changes
in take-off velocity, take-off angle and horizontal impulse in the track start technique only, when
comparing the resistance group with the control group. However, while results revealed that
resistance training improved jumping ability and increased vertical force components across all three
starting techniques, Breed and Young (2002) suggested the need to practise swimming dives to
translate improvements in neuromuscular properties to performance gains. The suggestion supports
the need to practice the diving technique during a resistance training regime to augment the skill
and control mechanisms of the neuromuscular system (Bobbert & Van Soest, 1994). This concept
informs the use of auditory RT training during regular diving practice to translate potential
neuromuscular changes to improvements in swimming start performance.
While resistance and plyometric training interventions have improved swimming start performance,
regular dive training and changes in diving technique have also been implemented successfully.
Regular dive training has been shown to result in faster times across all phases of a swimming start.
Blanksby et al. (2002) investigated the effect of dive start practice in grab, track and handle
swimming starts, on swimming start performance. Twelve elite level swimmers completed fifteen
starts (five grab and ten track starts) between two and four sessions per week until they
accumulated 14 +/- 2 practice sessions. Participants improved 10m, reaction, movement, block and
flight times irrespective of the start technique. Mean RT improved from 0.22s to 0.19s irrespective of
the starting technique when analysed pre and post-intervention and was suggested to have occurred
as a result of swimmers having improved concentration and reduced levels of anxiety whilst on the
block. Block time results also improved pre- to post-intervention from 0.86s to 0.80s, inferring that
regular dive training may induce similar physiological changes to that of plyometric training due to
the act of repeated explosive swimming dives.
21
Alterations in diving technique through the application of muscular pre-tension (static muscular
contraction) whilst performing a swimming start has shown to result in faster BTs. Lee, Huang, Lin
and Lee (2002) investigated muscular pre-tension in a group of eight well trained swimmers (20.0 ±
2.5years) to analyse its effect on swimming start performance. This involved the analysis and
comparison of three protocols; stretch-shortening cycle, purely concentric with no pre-tension and
purely concentric with pre-tension. The stretch-shortening cycle involved a countermovement
where the swimmer would squat after the starting signal and then project themselves forwards. The
protocol involving no muscular pre-tension had participants responding to the starting signal and
diving with concentric contraction of their lower limb. In contrast, muscular pre-tension was
achieved in the third protocol by instructing participants to apply force on the block with their legs
prior to the starting signal. There were significant differences between the three protocols with
regard to BT, in which pre-tension recorded the fastest mean time, followed by no pre-tension and
the stretch-shortening cycle (pre-tension = 0.77 ± 0.07s, no pre-tension = 0.82 ± 006s and stretch-
shortening cycle = 0.91 ± 0.07s).
Based on the literature discussed, training interventions can improve overall swimming start
performance (15m start times) by increasing torque of the lower limbs and horizontal force,
resulting in increased take-off velocity and reductions in BT. These improvements have been
achieved through land plyometric training (Rebutini et al., 2014; Bishop et al., 2009; Lepretre, 2014),
resistance training (Hohmann et al., 2010; Breed & Young, 2002) and dive training (Blanksby et al.,
2002; Lee et al., 2002). Start times to 15m have been found to vary from 0.8% to 26.1% of the overall
race time, depending on the event (Cossor & Mason, 2001) with the percentage contribution
decreasing with increasing race distance (Hay, 1986). Improvements in swimming start performance
by training interventions could translate to substantial improvements in race times, especially during
sprint races.

22
The study conducted by Lepretre et al. (2014) included auditory components within the plyometric
and swimming start training program, but the cohort study design made it difficult to conclude the
extent of the effect of auditory components on swimming start RT. Thus, a randomised controlled
trial intervention study analysing RT, similar to the study carried out by Blanksby et al. (2002), with
competition specific auditory stimulus dive training, would assist in filling the gap in the literature
regarding swimming start RT training techniques.
2.3.3 Swimming warm-up interventions
Competitive swimmers undertake a specifically designed warm-up program prior to competition. A
swimming warm-up involves physical activity before the main event with the intention of improving
swimming performance (Bobo, 1999). As previously mentioned, changes in torque of the lower limb
joints and BT has the potential to affect swimming start performance. Cuenca-Fernández, López-
Contreras and Arellano (2015) investigated the effect of warm-up techniques on BT and angular
velocity of knee extension during a swimming start. The study involved trained swimmers (n=14) and
used a previously trialed standardised warm-up with the addition of two protocols of post-activation
potentiation. The first protocol involved three lunges at 85% of one repetition maximum and the
second involved four repetitions on the flywheel device ‘YoYo’ squat. The mean values obtained for
BT and angular velocity of knee extension were both better after the ‘YoYo’ squat protocol
compared to the other two protocols (lunge protocol and control).
Balilionis et al. (2012) trialled three types of warm-ups on a group of sixteen competitive swimmers
(eight male: 19.9 ± 0.6years, eight female: 19.8 ± 0.7years) to assess their effect on swimming start
performance and RT. A regular warm-up, resulted in better 50yard freestyle times than a shortened
warm-up (50yard freestyle at 40% maximal effort and 50yard at 90%) and no warm-up. However, no
significant differences in RT were recorded across the three groups. Consequently, altering warm-

23
ups of swimmers prior to competition has the potential to alter BT and swimming start performance.
Therefore, a controlled standardised warm-up must be considered when assessing the effectiveness
of training interventions on swimming start performance to limit any confounding factors.
2.4 Methodology in swimming start research
Investigations into the effect of training interventions on swimming start performance are important
in informing the development of research based training programs that can be integrated as part of
competitive swimmers’ habitual training. There is a paucity of studies involving controlled study
design swimming start training interventions. Swimming start training intervention research includes
a variety of analysis techniques that have been used to obtain quantitative data such as BT, while
research analysing RTs of competitive swimmers remains sparse.
2.4.1 Sample and participants
A variety of participant groups are evident in swimming start intervention studies. However, the
main cohorts have been elite level swimmers, as summarised in ‘Table 1’. In these studies (Hohmann
et al., 2010; Lepretre, 2014; Rebutini et al., 2014) national level was usually a minimum required skill
level and swimmers had a mean age over 20years (Table 1). Excluding the study by Bishop et al.
(2009), studies of competitive swimming used small sample groups ranging from seven to twelve
participants. Bishop et al. (2009) focussed purely on sub-elite adolescent swimmers, with a mean
age of 12.9years. The remaining two studies (Breed & Young, 2002; Hassannezhad et al., 2012)
involved participants who were not well trained in the skill of diving and thus the findings did not
relate to improving start performance among competitive swimmers. Three of the studies (Blanksby
et al., 2002; Hohmann et al., 2010; Rebutini et al., 2014) listed in ‘Table 1’ analysed the effect of
swimming start interventions with a sample group consisting of both males and females, resulting in

24
potential confounding of their final results due to differences in gender. The swimming start
performance gap between sub-elite and elite level athletes (Vantorre et al., 2014; Slawinski et al.,
2010) and the scarcity of research related to improving sub-elite adolescent swimmers’
performances, highlights the need for further research involving adolescent swimmers. While
training interventions can improve start performance in elite level swimmers, the extent of
performance improvement among sub-elite adolescent swimmers is an important focus area for the
development of the new wave of elite level swimmers.
Table 1. Participant samples evident in swimming start intervention research (previously cited in
‘Swimming start training interventions’ 2.3.2)
*Minimum of 8 hours of aquatic training per week
**Not recorded
***Athletes from a range of sporting disciplines other than swimming
2.4.2 Research design
When considering the research design of the training intervention studies in ‘Table 1’, participant
groups were obtained through a convenience sample approach. Once participants have volunteered
and consent has been gained, these studies exhibit two distinct forms of study design. Under these
two designs, the intervention period in each study varies in length and frequency of training
sessions. The first study design comprises an intervention period in the absence of a control group,
with a pre- and post-intervention testing protocol. Hohmann et al. (2010) adopted this approach,
Primary Author, Year Participants (n) Male (n):Female (n) Mean age (years) Skill level
Bishop, 2009 22 NR 12.85 Sub-elite*
Blanksby, 2002 12 5:7 17.70 NR**
Breed, 2002 23 0:23 19.90 Un-trained***
Hassannezhad, 2012 21 21:0 24.40 Un-trained
Hohmann, 2010 7 5:2 22.14 National
Lepretre, 2014 8 8:0 17.50 National
Rebutini, 2014 10 7:3 21.65 National

25
implementing a strength training intervention program three days a week, for four weeks. Similarly,
Lepretre et al. (2014) carried out a four week cohort study on a treatment group, who underwent
plyometric and swimming start training coupled with visual and auditory components. Rebutini et al.
(2014) opted for a longer training period of nine weeks and also performed ‘before and after’
swimming start performance tests. It is important to note that while performance improvements
were shown across all three training interventions, the true correlation between the intervention
and swimming start performance is difficult to determine due to the unknown effect of habitual
training during the intervention period. Habitual training may have contributed to a proportion of
the participants’ final improvement. Consequently, studies involving a ‘randomised controlled trial’
(RCT) study design have the advantage of showing a clearer causality between an intervention and
performance outcomes.
The RCT approach involves taking the participants and randomly allocating them to intervention
group(s) and a control group. A pre- and post-intervention test is then performed in all groups to
analyse and compare any potential effect of the intervention. Bishop et al. (2009) randomly
allocated participants to a habitual training group and a plyometric training group. The plyometric
training group participated in two one hour sessions a week, for eight weeks, in addition to their
habitual training (which was continued by the control group). Blanksby et al. (2002) randomly
allocated participants to one of two treatment groups (track or handle swimming starts) or a control
group (grab start). All three groups performed two to four sessions per week until 12-16 sessions
were accumulated. In the remaining two studies (Breed & Young, 2002; Hassannezhad et al., 2012) a
RCT approach was adopted. However, as previously mentioned, these participants were not
competitive swimmers. Based on the RCT study conducted by Blanksby et al. (2002) a swimming
start training intervention study consisting of three sessions per week for four weeks would be a
viable study design to assess changes in swimming start RT from pre- to post-intervention.
26
2.4.3 Data collection methodology: Analysis of reaction time and block time
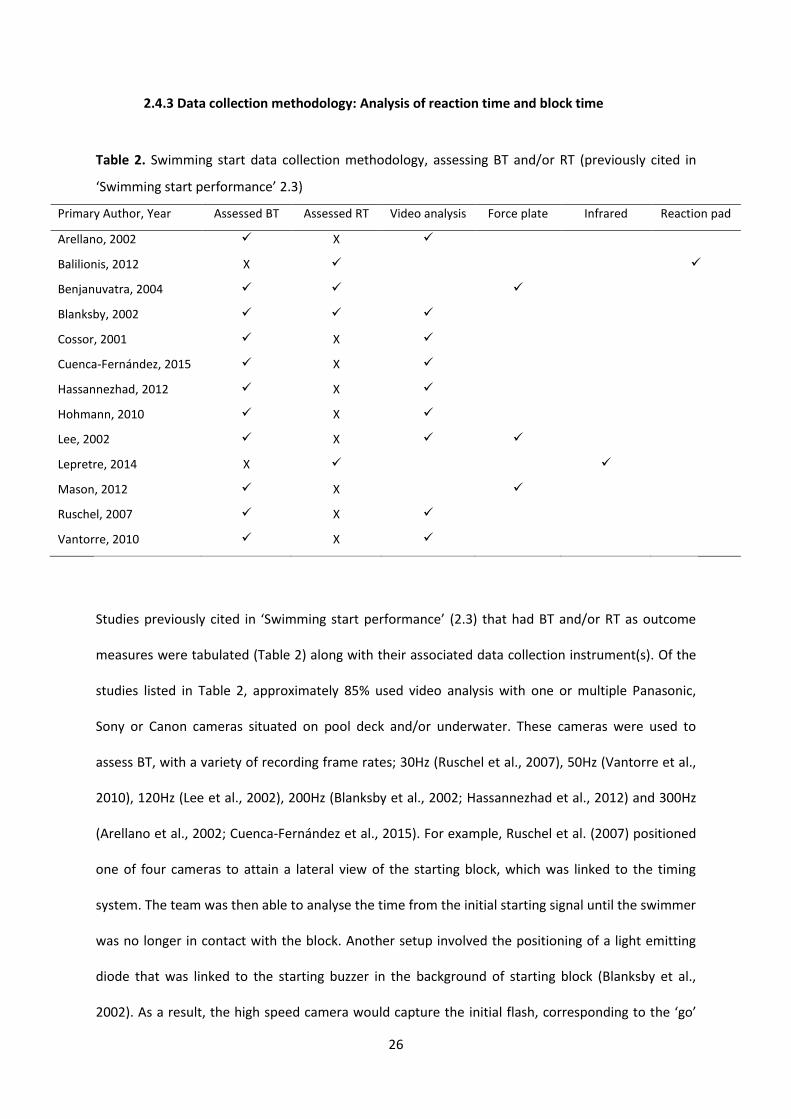
Table 2. Swimming start data collection methodology, assessing BT and/or RT (previously cited in
‘Swimming start performance’ 2.3)
Primary Author, Year Assessed BT Assessed RT Video analysis Force plate Infrared Reaction pad
Arellano, 2002 X
Balilionis, 2012 X
Benjanuvatra, 2004
Blanksby, 2002
Cossor, 2001 X
Cuenca-Fernández, 2015 X
Hassannezhad, 2012 X
Hohmann, 2010 X
Lee, 2002 X
Lepretre, 2014 X
Mason, 2012 X
Ruschel, 2007 X
Vantorre, 2010 X
Studies previously cited in ‘Swimming start performance’ (2.3) that had BT and/or RT as outcome
measures were tabulated (Table 2) along with their associated data collection instrument(s). Of the
studies listed in Table 2, approximately 85% used video analysis with one or multiple Panasonic,
Sony or Canon cameras situated on pool deck and/or underwater. These cameras were used to
assess BT, with a variety of recording frame rates; 30Hz (Ruschel et al., 2007), 50Hz (Vantorre et al.,
2010), 120Hz (Lee et al., 2002), 200Hz (Blanksby et al., 2002; Hassannezhad et al., 2012) and 300Hz
(Arellano et al., 2002; Cuenca-Fernández et al., 2015). For example, Ruschel et al. (2007) positioned
one of four cameras to attain a lateral view of the starting block, which was linked to the timing
system. The team was then able to analyse the time from the initial starting signal until the swimmer
was no longer in contact with the block. Another setup involved the positioning of a light emitting
diode that was linked to the starting buzzer in the background of starting block (Blanksby et al.,
2002). As a result, the high speed camera would capture the initial flash, corresponding to the ‘go’

27
signal, and the swimmer leaving the block. Post-test analysis involved superimposing time codes
over the video to calculate the time spent on the block by the participants. The use of cameras with
slower recording frame rates (e.g. 30Hz and 50Hz) reduce the precision of the recorded BT as the
true moment of last contact with the block may reside between two frames. As a result, there may
be a discrepancy up to 0.02s, when using a framing rate of 50Hz. Studies listed in Table 2 that involve
the use of video analysis to determine BT, measured and reported BT to a hundredth of a second.
Therefore, the use of video analysis for determining BT is limited by the frame rate capabilities of the
camera and highlights the need for a more precise instrument to effectively analyse BT.
Furthermore, video analysis techniques are unable to precisely measure RT, as change in force
application through the block by the swimmer can occur prior to visible movement of the lower
limbs occurring.
Other than video analysis, force measurement devices were also used as a data collection technique
to analyse outcome measures such as peak horizontal force, BT and RT. One setup involved
mounting a ‘Kistler’ (https://www.kistler.com/au/en/) force plate on the starting block, which was
linked to the timing system (Lee et al., 2002). In contrast to this setup, custom built instrumented
starting blocks that adhere to the block specifications set out by the world swimming governing body
(FINA), were also used. Benjanuvatra et al. (2004) developed an instrumented starting block that
consisted of two force plates mounted side by side to assess both lower limbs separately. The
instrumented starting block provided temporal and kinetic measures including peak force, average
force, impulse (vertical and horizontal), RT, movement time, BT and velocity. Similarly, the Australian
Institute of Sport (Canberra, ACT) uses an instrumented block and ‘Wetplate’ analysis system to
obtain similar measures (Mason et al., 2012). An additional data collection technique involved the
use of a reaction pad (Daktronics, Brookings, SD, USA), which was attached to the block and
synchronised to the timing system to give RT values to the nearest one hundredth of a second
(Balilionis et al. 2012). Reaction time has also been assessed through the use of infrared optical

28
measurement technology, ‘Micrograte Optojump’, which determined the first instance of movement
in response to the visual and/or auditory stimuli (Lepretre et al., 2014). While high speed cameras
can operate with framing rates such as 300Hz (Arellano et al., 2002; Cuenca-Fernández et al., 2015)
force data can be collected using force plates operating at 500Hz (Benjanuvatra et al., 2004) and
600Hz (Lee et al., 2002). Force measurement instruments are advantageous as they operate at high
recording rates and are in direct contact with the swimmer. The maximum error of identifying an
event in milliseconds using a sampling rate of 500Hz would be one millisecond. Therefore, force
measurement instruments are the optimal form of data collection when analysing RT.
2.4.4 Data collection methodology: Force measurement device
‘Piezoelectric’ is a term that describes the production of electricity in dielectric crystals in response
to mechanical stress (Holler, Skoog, & Crouch, 2007, p. 9). Piezoelectric sensors
measure pressure, acceleration, temperature, strain or force, by producing an electrical charge
proportional to changes in these variables. In RT sporting literature piezoelectric sensors are
primarily seen through the use of force plates with integrated piezoelectric transducers. Willwacher,
Herrmann, Heinrich and Brüggemann (2013) analysed the force production and RT of track sprinters
(n=99) to deduce optimal kinetics of a track start. The setup involved custom built force platforms
with ‘piezo type’ force transducers attached to the starting block. The output from the force
platforms was then synced to the starting signal to quantify RT. A similar setup also assessing force
production and RT in track sprinters was constructed by Pain and Hibbs (2007). The researchers
integrated piezoelectric force transducers into the footplates of the starting block. Comparable RT
starting setups using Kistler force plates (Kistler Group, Switzerland) are also seen in swimming
literature (Lee et al., 2002; Mason et al., 2012). Kistler force plates have integrated piezoelectric
transducers and can measure the precise onset of force production by a swimmer during a

29
swimming start. Consequently, piezoelectric instruments are the optimal device for the precise
measurement of pre-motor time due to their high recording rates e.g. 2000 Hz (Pain & Hibbs, 2007).
2.4.5 Data collection methodology: Questionnaire instrument
Sheard and Golby (2006) quantified perceptions of swimming performance during training and
competition, through the use of a questionnaire. The research involved the implementation of a
seven-week psychological skills training program on a group of sub-elite adolescent swimmers
(n=36). The training program consisted of goal setting, visualisation, relaxation, concentration and
though stopping. Quantitative data were then collected by having participants complete seven
‘inventories’ that measured performance (swimming times collected at official swimming meets) and
psychological attributes associated with improved performance: mental toughness, hardiness, self-
esteem, self-efficacy, optimism and positive affectivity (Sheard & Golby, 2006). Perceptions of
success were quantified through the use of the ‘Self-Perception of Quality of Performance
Questionnaire’ (SPQPQ). The SPQPQ was originally developed by Ebbeck and Weiss (1988), who used
the seven item survey to assess the ‘arousal-performance’ relationship in high school track and field
athletes (n=51). The questionnaire utilises a ‘Likert’ scale (Likert, 1932) to quantify perceptions,
which is an ordinal psychometric measurement of attitudes, beliefs and opinions. Sheard and Golby
(2006) found that the psychological skills training program revealed significant performance
improvement in three swimming strokes over 200m and an improvement in participants’
psychological profile. It can be inferred that positive attitudes and perceptions of a training program
will have the potential to improve performance benefits. Consequently, a swimming training
intervention that is beneficial to performance can be implemented successfully into habitual training
if swimmers have a positive attitude towards it. Attitudes towards a swimming training program
could then be assessed through the development of a modified SPQPQ to determine if it can be
successfully integrated into habitual training.

30
2.4.6 Methodology in swimming start research summary
Analysis of training interventions on swimming start performance primarily focus on elite swimmers,
with a paucity of studies that aim to improve performance in sub-elite adolescent swimmers (Table
1). Swimming start RT has been analysed through the use of video analysis (Blanksby et al., 2002),
force plates (Benjanuvatra et al., 2004), a reaction pad (Balilionis et al. 2012) and infrared optical
measurement technology (Lepretre et al., 2014). Of the thirteen studies listed in ‘Table 2’ only these
four analyse RT, with the study carried out by Blanksby (2002) being the only study that involves a
RCT study design. Analysis of potential changes to RT in response to a training intervention is vital to
understanding the effect of RT training on swimming start performance. It is for this reason that
development of a force measurement instrument operating at a sampling rate of 1000Hz, that
measures the onset of force change being applied through the block, would be beneficial in the
analysis of RT to the nearest millisecond.
2.5 Literature review summary
This chapter has provided a summary of the literature surrounding auditory RT, neuronal functional
specificity to auditory stimuli, the ‘on-block’ phase of the swimming start and swimming start
performance. Furthermore, this chapter has discussed training interventions that have been
implemented with the goal of improving BT and take-off velocity, and their translatability to overall
swimming start performance gains. Subsequently, previous training intervention studies and existing
gaps in the literature have informed the focus and design of the study outlined in the following
chapter (Chapter 3).

31
CHAPTER 3: METHODOLOGY
3.1 Participants
Sixteen male swimmers participated in this study. The cohort was limited to males to eliminate the
possibility of results being confounded by gender differences. Prior to the testing period, ten sub-
elite adolescent swimmers (14.0 ± 1.4 years) attended a minimum of four aquatic training sessions
per week, for a minimum of one hour per session. Each of these participants had previously qualified
for at least one event, of any stroke, at either age long course or age short course New South Wales
state championships. An additional six national level swimmers (19.8 ± 1.0years) from the same
swimming club participated in the study. These elite level swimmers attended a minimum of six
aquatic training sessions per week, for a minimum of one hour per session. They had previously
qualified for at least one event, of any stroke, at age or open national championships.
The swimming club to which all participants belonged consisted of multiple squads training in an
indoor 50m pool. The swimming centre had pre-existing OSB-11 competition diving blocks fixed on
pool deck, on which the swimmers regularly practiced. All swimmers were given a verbal explanation
of the study protocol and then given copies of the age specific information sheets and consent forms
(Appendix 1). Those swimmers who consented to the study and had no current injuries or conditions
that would be aggravated by regular dive practice were recruited in the study. The experimental
procedure was approved by the University of Sydney’s Human Research Ethics Committee (HREC)
(project number: 2015/518, Appendix 2).

32
3.2 Research design
A convenience sample approach was conducted after contact with the Sydney based swimming club.
Eligible sub-elite adolescent swimmers who consented to the study were then randomly allocated,
by a simple randomisation procedure (computerised random numbers), to either a control group
(Cohort one: ‘C1’) (n=5, 13.4 ± 1.7years) or intervention group (‘C2’) (n=5, 14.6 ± 0.9years).
Randomised controlled trial study designs are evident in swimming start performance literature
(Bishop et al., 2009) as they show a stronger causality between an intervention and a performance
result. Cohort one and C2 underwent a four week training intervention, where C1 completed a
regular dive training program and C2 underwent a competition specific auditory stimulus dive
training program. These training interventions were integrated into their habitual training regime by
the swimmers’ regular coach who were briefed by the researcher on the training techniques prior to
the commencement of the study. The researcher acted as a participant observer during the training
period to limit any change to the swimmers’ habitual training.
Cohort three (‘C3’) consisted of the elite level swimmers within the same swimming club and were
also recruited through a convenience sample approach. These swimmers continued their habitual
training schedule with no change to their regular dive training. Swimming research has shown that
elite level swimmers exhibit faster RTs in response to the starting auditory stimulus when compared
with sub-elite swimmers (Vantorre et al., 2014). Therefore, C3 was included in the study to gain a
baseline measure for RT and BT in elite level swimmers and to also compare against both cohorts of
adolescent swimmers before and after the training intervention period.

33
3.3 Testing procedures
The study involved a four week training period for the sub-elite adolescent swimmers. Four weeks
has been shown previously to be an adequate length of time to induce swimming start performance
benefits (Hohmann et al., 2010). A summary of the two dive training interventions are outlined in
Table 3. Swimming start testing occurred at the training site prior to the commencement of the
training period for all cohorts and then again after the training period for C1 and C2. Study designs
involving dive testing before and after a training intervention is consistent throughout swimming
literature (e.g. Rebutini et al., 2014) as it shows, by comparison, possible changes in performance
variables in response to the training intervention.
Table 3. Outline of implemented dive training interventions across two cohorts of sub-elite
adolescent swimmers
Control (C1)
Habitual dive training
Intervention (C2)
Competition specific auditory stimulus training
- Six dives per session, three sessions per week
(Blanksby et al., 2002)
- Dive and sprint start to 15m (butterfly,
breaststroke or front crawl)
- Participants were instructed to perform starts at
their own discretion without an auditory stimulus
- No technical feedback provided to the
participants
- Six dives per session, three sessions per week
- Dive and sprint start to 15m (butterfly,
breaststroke or front crawl)
- Commencement of swimming start with starting
auditory stimuli “take your marks” and a ‘go’
signal (handheld electric horn)
- No technical feedback provided to the
participants
To limit exposure of the starting auditory stimuli to C1, whilst swimmers in C2 were undertaking the
training intervention, C1 was given a regular aquatic training set (at the coach’s discretion) in
adjacent lanes.
34
Whitten (1997) found that butterfly swimmers would perform deeper dives during the underwater
phase of a swimming start than freestyle swimmers. To limit any potential effect this may have on
front crawl swimming start performance (‘time to 15m’) during the pre- and post-intervention
testing sessions, participants were instructed to complete a minimum of three front crawl swimming
starts during each of the training sessions. However, it should be noted that while differences exist
during the underwater phases of different strokes, the above water parameters remain similar
(Miller, Hay, & Wilson, 1984). Consequently, the RT and BT of the participants during the dive
training sessions should not have been confounded by the stroke being performed after entering the
water.
Dive testing sessions involved instructing each participant to perform three ‘race pace’ front crawl
starts (diving from the instrumented OSB-11 block and sprinting to 15m), with normal competition
auditory stimuli (speaker and electric horn). The distance between the auditory stimuli setup
(speaker and electric horn) and the participant was controlled throughout each of the data collection
points, to limit any possible startle response and alterations to the RT of the swimmers (Brown,
Kenwell, Maraj, & Collins, 2008). During dive testing, swimming starts were carried out following a
regular competition warm up, as this has been shown to achieve faster average 50yd freestyle times
compared with shortened or no warm up (Balilionis et al., 2012). Following this, C1 and C2 were
asked to complete a five minute written questionnaire (Table 5) to obtain general thoughts and
attitudes associated with their dive training intervention, as well as a subjective look at potential
performance gains.

35
3.4 Swimming start variables
The swimming start is considered as the first 15m of a race (Cossor, & Mason, 2001) and comprises
four main phases; on-block 11% (0.74s), in-flight 5% (0.30s), underwater 56% (3.69s) and free
swimming 28% (1.81s) (Mason et al., 2012). These phases informed the selection of the following
quantitative measures of swimming start performance analysed in the current study:
1) Reaction time (RT) (s, to a thousandth of a second) - Time between the stimulus being
presented and the change in ground reaction force (GRF) in response to muscular action
(Johnson & Nelson, 1988).
2) Block time (BT) (s, to a thousandth of a second) - Time between the starting signal and the last
moment of contact of the swimmer with the starting block (Blanksby et al., 2002).
3) Time to 15m (s, to a hundredth of a second) – Time between the starting signal and the vertex
of swimmer’s head (Blanksby et al., 2002) reaching the 15m mark.
Each performance variable was reported as a single value derived from the mean of the three dives
performed by each participant during the data collection sessions.
3.5 Data collection
The study assessed swimming start performance by analysing quantitative swimming start variables
through the use of two different data collection instruments. Reaction time and BT were measured
through an instrumented starting block with a custom built force measurement device (refer to
3.5.1). The swimmers’ ‘time to 15m’ were measured using a high speed camera (refer to 3.5.2). In
addition to this, a written questionnaire using a five point Likert scale was administered post
intervention (refer to 3.5.3).

36
3.5.1 Instrument: Force measurement device
A force measurement device was developed and constructed to register the onset of changes in
GRF, reflecting the onset of movement of the participants during a swimming start. Development of
the device was informed by previous swimming and athletics studies that have used force
measurement devices such as Kistler force plates (Kistler Group, Switzerland) to accurately analyse
RT, rather than measuring absolute force production (Willwacher et al., 2013; Pain & Hibbs, 2007;
Lee et al., 2002; Mason et al., 2012). The force measurement device was constructed using piezo
cabling (Figure 5). The cable is multi layered (Figure 6), with the piezo polymer layer acting as an
electrical insulator (‘dielectric’). When the cable is stretched or compressed, polarisation of the piezo
polymer occurs, producing a charge that is proportional to the stress (changes in force application by
the swimmer) on the cable.
Figure 5: Piezo cable image (Measurement Specialities, 2015)
Figure 6: Internal structure of a piezo cable (Images Co, 2015)
37
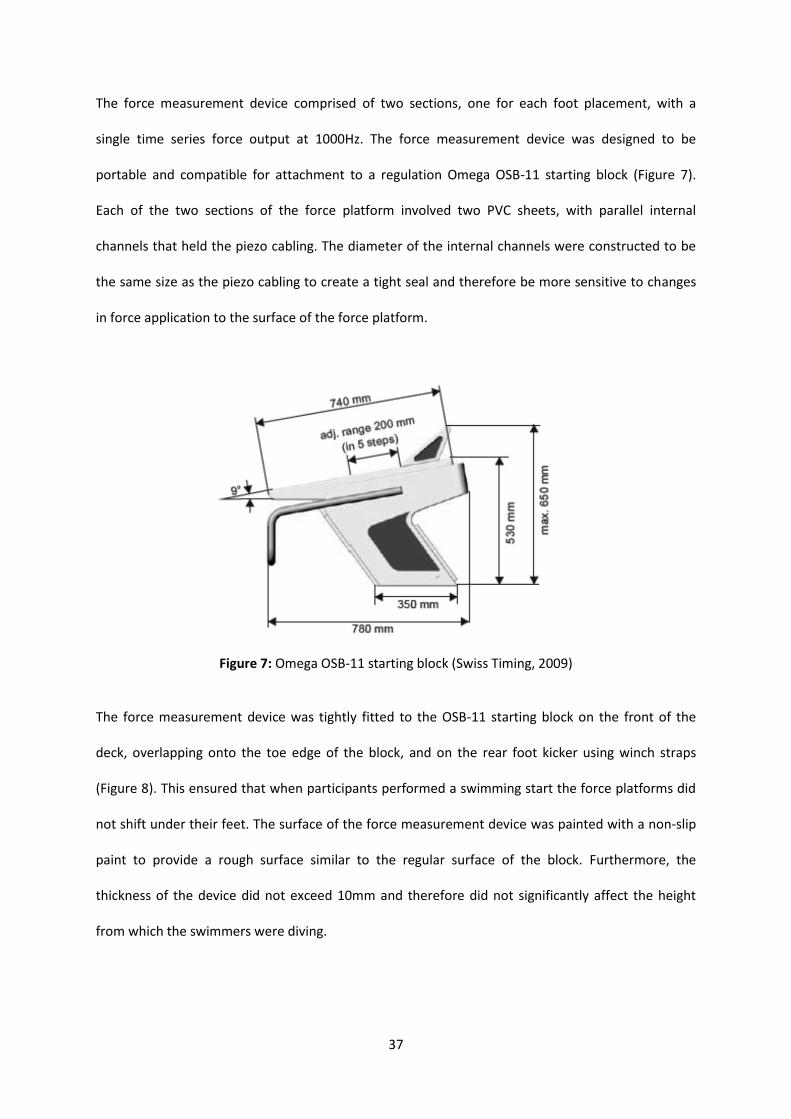
The force measurement device comprised of two sections, one for each foot placement, with a
single time series force output at 1000Hz. The force measurement device was designed to be
portable and compatible for attachment to a regulation Omega OSB-11 starting block (Figure 7).
Each of the two sections of the force platform involved two PVC sheets, with parallel internal
channels that held the piezo cabling. The diameter of the internal channels were constructed to be
the same size as the piezo cabling to create a tight seal and therefore be more sensitive to changes
in force application to the surface of the force platform.
Figure 7: Omega OSB-11 starting block (Swiss Timing, 2009)
The force measurement device was tightly fitted to the OSB-11 starting block on the front of the
deck, overlapping onto the toe edge of the block, and on the rear foot kicker using winch straps
(Figure 8). This ensured that when participants performed a swimming start the force platforms did
not shift under their feet. The surface of the force measurement device was painted with a non-slip
paint to provide a rough surface similar to the regular surface of the block. Furthermore, the
thickness of the device did not exceed 10mm and therefore did not significantly affect the height
from which the swimmers were diving.
38
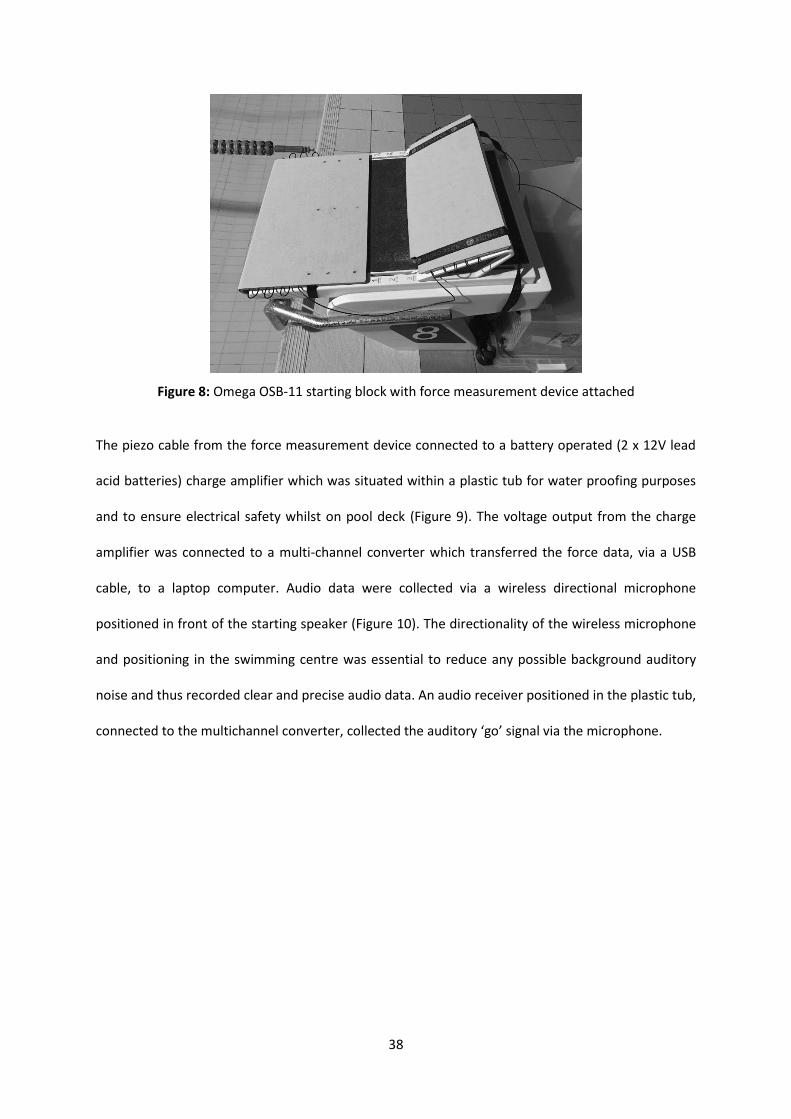
Figure 8: Omega OSB-11 starting block with force measurement device attached
The piezo cable from the force measurement device connected to a battery operated (2 x 12V lead
acid batteries) charge amplifier which was situated within a plastic tub for water proofing purposes
and to ensure electrical safety whilst on pool deck (Figure 9). The voltage output from the charge
amplifier was connected to a multi-channel converter which transferred the force data, via a USB
cable, to a laptop computer. Audio data were collected via a wireless directional microphone
positioned in front of the starting speaker (Figure 10). The directionality of the wireless microphone
and positioning in the swimming centre was essential to reduce any possible background auditory
noise and thus recorded clear and precise audio data. An audio receiver positioned in the plastic tub,
connected to the multichannel converter, collected the auditory ‘go’ signal via the microphone.

39
Figure 9: Data collection setup
Figure 10: Speaker, electronic horn and wireless microphone
Data from the force measurement device and the microphone were collected onto a laptop
computer using National Instruments LabVIEW software (http://www.ni.com/labview) and included
a timecode (in milliseconds) for post-performance analysis of RT and BT (3.6.1).
40
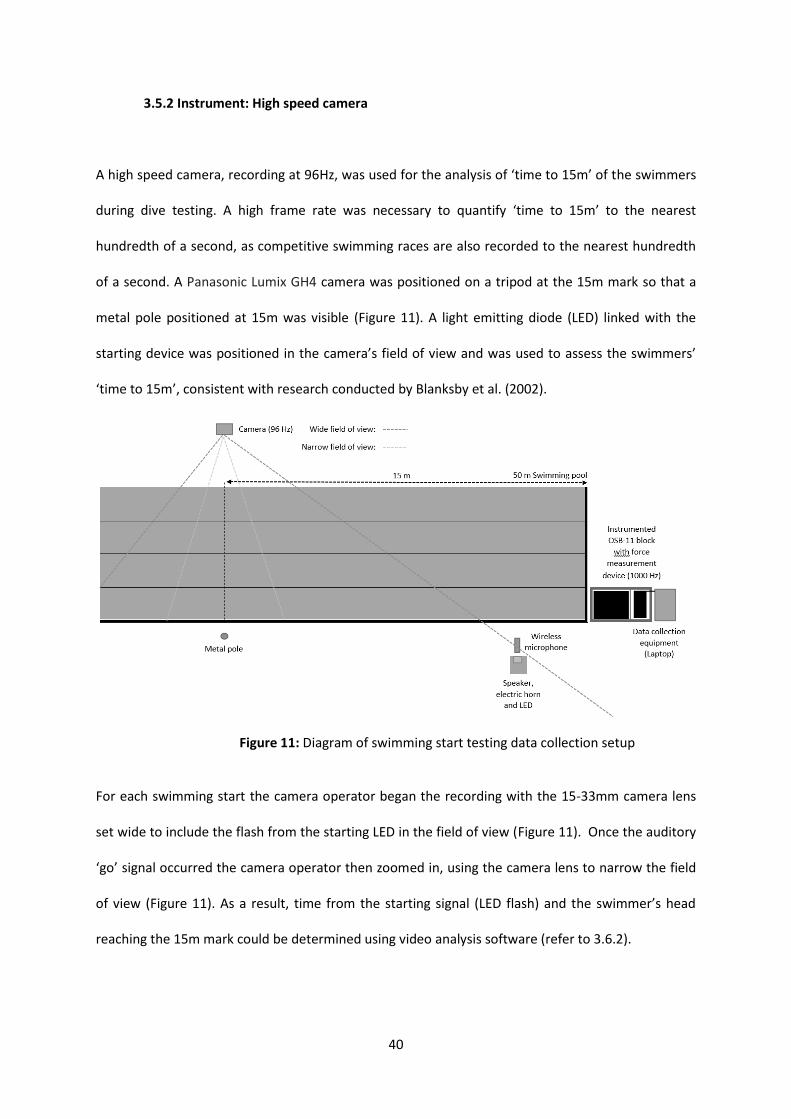
3.5.2 Instrument: High speed camera
A high speed camera, recording at 96Hz, was used for the analysis of ‘time to 15m’ of the swimmers
during dive testing. A high frame rate was necessary to quantify ‘time to 15m’ to the nearest
hundredth of a second, as competitive swimming races are also recorded to the nearest hundredth
of a second. A Panasonic Lumix GH4 camera was positioned on a tripod at the 15m mark so that a
metal pole positioned at 15m was visible (Figure 11). A light emitting diode (LED) linked with the
starting device was positioned in the camera’s field of view and was used to assess the swimmers’
‘time to 15m’, consistent with research conducted by Blanksby et al. (2002).
Figure 11: Diagram of swimming start testing data collection setup
For each swimming start the camera operator began the recording with the 15-33mm camera lens
set wide to include the flash from the starting LED in the field of view (Figure 11). Once the auditory
‘go’ signal occurred the camera operator then zoomed in, using the camera lens to narrow the field
of view (Figure 11). As a result, time from the starting signal (LED flash) and the swimmer’s head
reaching the 15m mark could be determined using video analysis software (refer to 3.6.2).
41
3.5.3 Instrument: Questionnaire
The written questionnaire (Table 4) completed by all swimmers in C2 was adapted from the ‘Self-
Perception of Quality of Performance Questionnaire’ (SPQPQ), which was developed to determine
swimmers’ perceptions of performance during training and competition (Ebbeck & Weiss, 1988). An
identical questionnaire was also completed by C1, with the only change being the name “regular
dive training” written in the title. The adapted questionnaire was designed to be in paper form so
that it could be immediately given to participants upon completion of the training intervention. This
ensured that perceptions of the training were ‘fresh in their minds’ when completing the
questionnaire and also increased response rates when compared to an online questionnaire.
However, it should be noted that no pressure was placed upon the participants to complete the
questionnaire. The questionnaire was anonymous and consisted of nine questions with a five point
‘Likert’ scale (Likert, 1932). A Likert scale is an ordinal psychometric measurement of attitudes,
beliefs and opinions and has been incorporated previously into a performance questionnaire in
swimming by Ebbeck and Weiss (1988).

42
Table 4. Questionnaire (cohort 2): Perceptions of competition specific auditory stimulus dive training
Instructions: Answer each of the questions by circling one of the five responses for each question. This
survey must be completed following your final dive testing session. Do not write your name on this sheet
as your responses will remain anonymous.
1. Did you feel physically fatigued after each of the dive training sessions (i.e. after completing six dives)?
1
Not at all
2
A little bit
3
Somewhat
4
Quite a bit
5
Very much
2. On average, how would you describe the amount of effort you gave during the dive training program?
1
Hardly any
2
A little bit
3
Some
4
Quite a bit
5
Everything I had
3. How would you describe your mental attitude in relation to the four week training program?
1
Very dissatisfied
2
Dissatisfied
3
Neutral
4
Satisfied
5
Very satisfied
4. On average, how would you describe the amount of concentration you gave during the dive training
program?
1
Hardly any
2
A little bit
3
Some
4
Quite a bit
5
Everything I had
5. Did you feel confident prior to the final testing session?
1
Not at all
2
A little bit
3
Somewhat
4
Quite a bit
5
Very much
6. How would you describe your swimming start performance during the final testing session?
1
One of the worst
2
Below average
3
Average
4
Above average
5
One of the best
7. How did your performance in the testing session compare to the way you expected to perform?
1
Much worse than
expected
2
Worse than
expected
3
As expected
4
Better than
expected
5
Much better than
expected
8. Did you expect your reaction time to improve as a consequence of the training program?
1
Not at all
2
Not really
3
Undecided
4
Somewhat
5
Very much so
9. Did you expect your time to 15 metres to improve as a consequence of the training program?
1
Not at all
2
Not really
3
Undecided
4
Somewhat
5
Very much so

43
3.6 Data analysis
Data collected using the force measurement device and the high speed camera were analysed using
computer software (‘Microsoft Excel’ and ‘Quicktime 7 Player’) to obtain a mean value of RT, BT and
time to 15m for each participant pre- and post-intervention. It must be noted that any swimming
starts with a RT < 0.1s (IAAF, 2016, “100 Metres”, para. 1; Pain & Hibbs, 2007) were deemed as the
participant anticipating the starting signal and were not included in their mean RT, BT or ‘time to
15m’.
3.6.1 Data analysis: Force measurement device
Change in GRF allowed the researcher to identify the onset of muscular action by the swimmer and
thus obtain RT in response to the starting signal to the nearest millisecond. Muscular action by the
swimmer in response to the starting signal could result in an increase or a decrease in GRF. An
increase in the charge output by the force instrument was indicative of a positive force application
through the starting block by the lower limb muscles, whilst a decrease was the result of an
unweighting response by the swimmer. Prior to the auditory ‘go’ signal occurring competitive
swimming rules instruct the swimmer to remain stationary, resulting in the charge output from the
force measurement instrument reaching a steady state. A positive or negative change in GRF
produced by the swimmer from the established steady state indicated the point of reaction to the
starting signal. Raw force and audio data for a dive were input into Microsoft Excel. The raw force
data were then ‘smoothed’ using a single pass non-recursive moving average of seven data points.
This was found to be more precise and reliable for the purpose of identifying the instant of
exceeding the threshold than other digital filters with a longer span. The audio data and ‘smoothed’
force data were then graphed against ‘time’ to a thousandth of a second. Figure 12 represents an
example of the change in force production during a swimming start in response to the auditory ‘go’
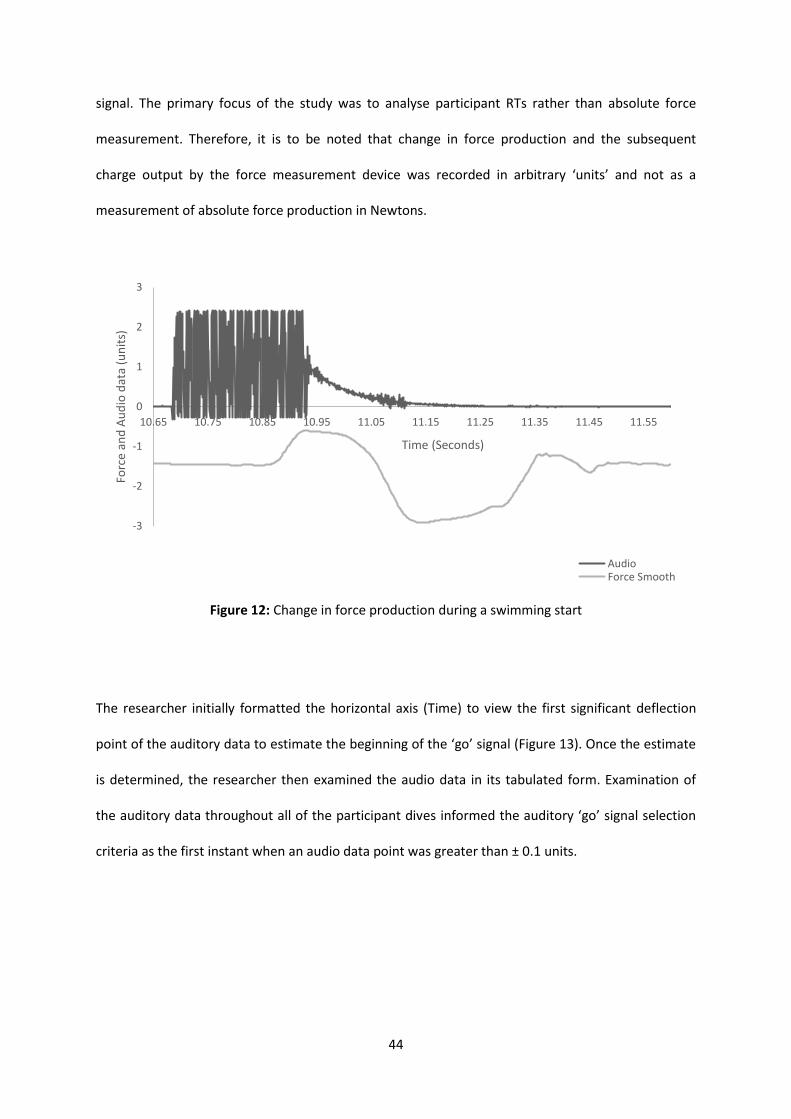
44
signal. The primary focus of the study was to analyse participant RTs rather than absolute force
measurement. Therefore, it is to be noted that change in force production and the subsequent
charge output by the force measurement device was recorded in arbitrary ‘units’ and not as a
measurement of absolute force production in Newtons.
Figure 12: Change in force production during a swimming start
The researcher initially formatted the horizontal axis (Time) to view the first significant deflection
point of the auditory data to estimate the beginning of the ‘go’ signal (Figure 13). Once the estimate
is determined, the researcher then examined the audio data in its tabulated form. Examination of
the auditory data throughout all of the participant dives informed the auditory ‘go’ signal selection
criteria as the first instant when an audio data point was greater than ± 0.1 units.
-3
-2
-1
0
1
2
3
10.65 10.75 10.85 10.95 11.05 11.15 11.25 11.35 11.45 11.55
Forc
e an
d A
ud
io d
ata
(un
its)
Time (Seconds)
AudioForce Smooth
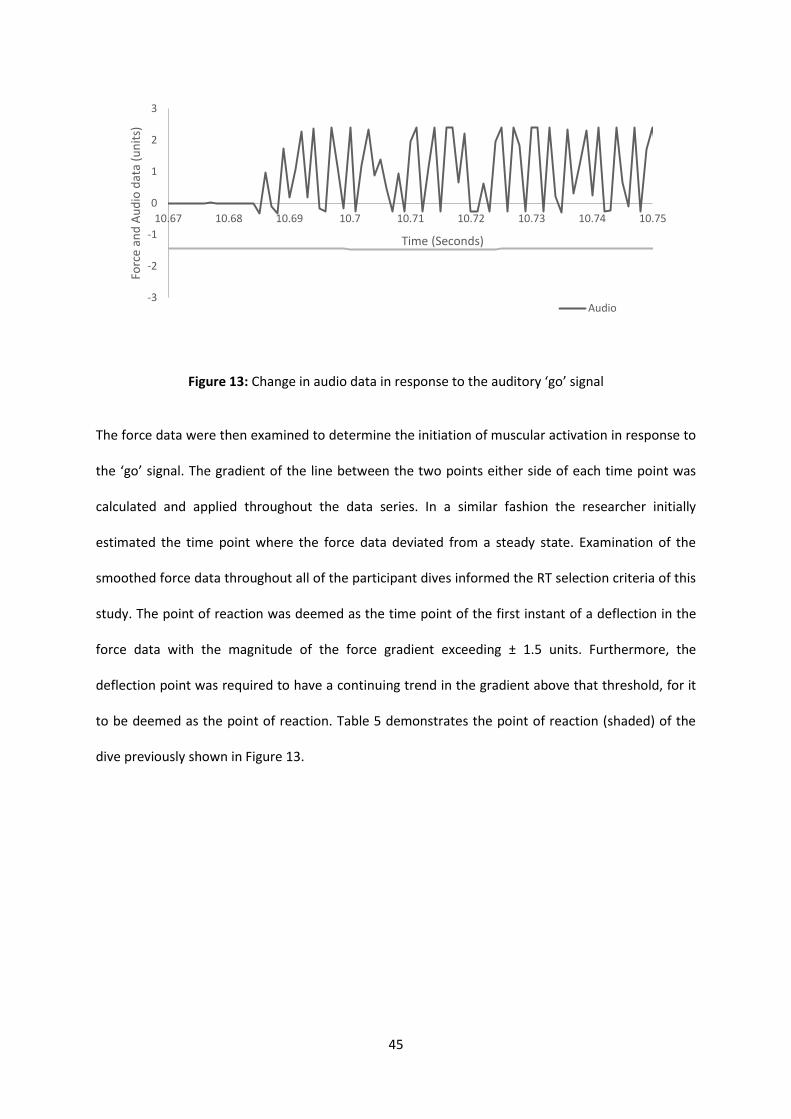
45
Figure 13: Change in audio data in response to the auditory ‘go’ signal
The force data were then examined to determine the initiation of muscular activation in response to
the ‘go’ signal. The gradient of the line between the two points either side of each time point was
calculated and applied throughout the data series. In a similar fashion the researcher initially
estimated the time point where the force data deviated from a steady state. Examination of the
smoothed force data throughout all of the participant dives informed the RT selection criteria of this
study. The point of reaction was deemed as the time point of the first instant of a deflection in the
force data with the magnitude of the force gradient exceeding ± 1.5 units. Furthermore, the
deflection point was required to have a continuing trend in the gradient above that threshold, for it
to be deemed as the point of reaction. Table 5 demonstrates the point of reaction (shaded) of the
dive previously shown in Figure 13.
-3
-2
-1
0
1
2
3
10.67 10.68 10.69 10.7 10.71 10.72 10.73 10.74 10.75
Forc
e an
d A
ud
io d
ata
(un
its)
Time (Seconds)
Audio

46
Table 5. Determining the time point of muscular activation during a swimming start
Time (Seconds) Force data gradient (Units)
10.839 -0.911285714 10.84 -0.637928571
10.841 -0.364571429 10.842 -0.273428571 10.843 -0.546785714 10.844 -0.455714286 10.845 -0.273428571 10.846 0 10.847 -0.091071429 10.848 0.091214286 10.849 0.182285714 10.85 0.820142857
10.851 1.002428571 10.852 1.184642857 10.853 1.8225 10.854 1.8225 10.855 1.822428571 10.856 1.731357143 10.857 1.549142857 10.858 1.640214286 10.859 1.822428571 10.86 1.822428571
10.861 2.278071429 10.862 2.095857143 10.863 2.369214286 10.864 2.551428571 10.865 2.733642857 10.866 2.915857143 10.867 3.3715 10.868 4.556071429 10.869 6.014 10.87 6.743
10.871 7.1075 10.872 8.018785714 10.873 8.930071429 10.874 9.2945 10.875 9.2945
The last moment of contact of the swimmer with the block was deemed to be the instant at which
the gradient was between -1.5 and 1.5 units and was followed by a plateau in the force data. The
time points of the ‘go’ signal, point of reaction and the last moment of contact were then used to
determine the RT and BT of the swimmer. Table 6 provides a summary of the selection criteria for
each of the three time points.
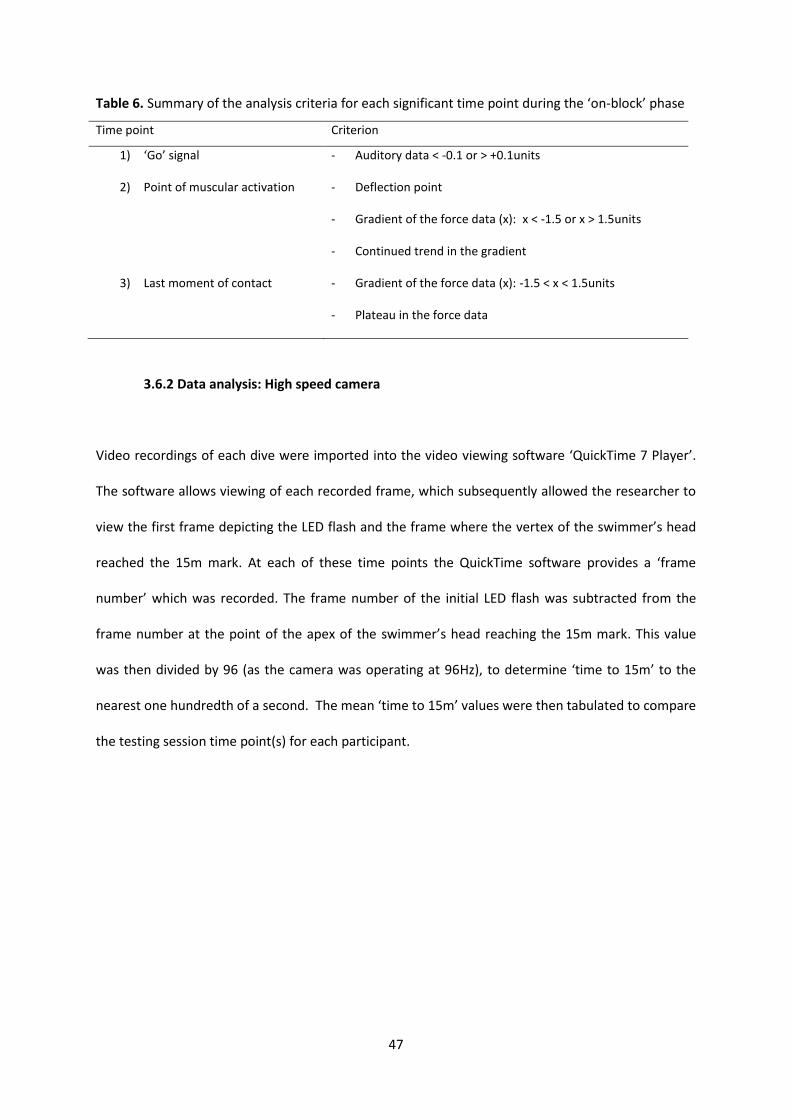
47
Table 6. Summary of the analysis criteria for each significant time point during the ‘on-block’ phase
Time point Criterion
1) ‘Go’ signal - Auditory data < -0.1 or > +0.1units
2) Point of muscular activation - Deflection point
- Gradient of the force data (x): x < -1.5 or x > 1.5units
- Continued trend in the gradient
3) Last moment of contact - Gradient of the force data (x): -1.5 < x < 1.5units
- Plateau in the force data
3.6.2 Data analysis: High speed camera
Video recordings of each dive were imported into the video viewing software ‘QuickTime 7 Player’.
The software allows viewing of each recorded frame, which subsequently allowed the researcher to
view the first frame depicting the LED flash and the frame where the vertex of the swimmer’s head
reached the 15m mark. At each of these time points the QuickTime software provides a ‘frame
number’ which was recorded. The frame number of the initial LED flash was subtracted from the
frame number at the point of the apex of the swimmer’s head reaching the 15m mark. This value
was then divided by 96 (as the camera was operating at 96Hz), to determine ‘time to 15m’ to the
nearest one hundredth of a second. The mean ‘time to 15m’ values were then tabulated to compare
the testing session time point(s) for each participant.
48
3.6.3 Data analysis: Questionnaire
Questionnaire responses were tallied and presented as the number of participant responses across
the five point Likert scale for each of the nine questions. The number of responses was separated by
cohort to compare differences in the perceptions of the two dive training interventions. The
questionnaire results are discussed in Chapter 5 (Discussion) and Chapter 6 (Conclusions and
Implications) as percentages of responses in conjunction with the quantitative swimming start
variables.
3.7 Statistical analysis
The effect of the two dive training interventions on RT, BT and ‘time to 15m’ were statistically
analysed separately for each of the quantitative variables. For each variable the main Time by Cohort
interaction between C1 and C2 was analysed using a two factor mixed design ANOVA with two levels
of within group factor (pre- and post-intervention). The effect of the dive training interventions on
each cohort were further explored with contrasts comparing the swimming start variable means at
each of the two time points using post-hoc paired sample T-tests. The magnitude of change from
pre- to post-intervention was determined using ‘Cohen’s d’ index of effect size. The individual and
cohort effect sizes were calculated using the pooled standard deviation of the within-subject
variability (each participant had three trials enabling a pooled within subject variability to be
determined). The effect size data supplemented the paired T-tests to look at the within individual
and within cohort changes across pre and post-tests taking into account the within participant
variability. This was useful in view of the small number of participants in each group and the strong
chance of Type 1 and Type 2 errors when relying on T-tests in isolation. Additionally, independent
samples T-Tests were then used to compare pre- and post-intervention sub-elite adolescent
swimmers’ results with those from C3.

49
CHAPTER 4: RESULTS
4.1 Participant compliance
Swimmers in C1 completed an average of 44.2 ± 15.6 total dives over 8.0 ± 2.6 dive training sessions
during the four week training period. Swimmers in C2 completed an average of 60.6 ± 15.0 total
dives over 10.6 ± 2.1 dive training sessions. There is no significant difference between the total
number of dives completed by participants in C1 versus C2 (t = -1.698, p = .128). Participant
attendance during the training period and the number of dives completed by each individual
swimmer in C1 and C2 are outlined in Table 7.
Table 7. Participant attendance and number of dives completed
Participant (Cohort (C) #
Participant (P) #)
No. of dive training sessions
attended
Total dives completed
C1P1 10 60
C1P2 11 61
C1P3 6 33
C1P4 8 40
C1P5 5 27
C2P1 11 66
C2P2 7 34
C2P3 12 67
C2P4 12 70
C2P5 11 66

50
4.2 Swimming start data: Inclusion and exclusion
Dives with a calculated RT <0.1s (IAAF, 2016, “100 Metres”, para. 1) were considered to be an
anticipation of the starting signal by the athlete and were therefore excluded from analysis of pre-
and post-intervention changes in RT, BT and ‘time to 15m’, but are reported in Appendix 3.
Consequently, throughout Chapter 4 mean values expressing RT, BT and ‘time to 15m’ do not
include dives with an initial RT <0.1s, unless otherwise specified. Of the 78 total dives tested, 14
were removed due to anticipation of the starting signal (mean RT <0.1s: 0.076 ± 0.024). A further
two dives were excluded due to human error, where the experimenter pressed an incorrect button
for the force plate data collection. Furthermore, ‘time to 15m’ results from participant C3P1 were
removed from the study as the swimmer had an upper limb injury and was unable to perform the
‘underwater’ and ‘free swimming’ phases of the swimming start at race pace.
4.3 Swimming start interventions: Summary of results
Table 8 summaries collected and analysed swimming start data for the each of the three variables
for all participants at the pre- (week 0) and post-intervention (week 4) time points. Each value
expressed in Table 8 is representative of a subject mean of the dives performed at a single dive
testing session. Furthermore, Table 8 reports the magnitude of change as effect sizes, from pre- to
post-intervention of the participants’ swimming start variables. It is to be noted that negative effect
sizes are indicative of a faster post- than pre-intervention time.

51
Table 8. Summary of the effect of swimming start interventions on RT, BT and ‘time to 15m’
*Mean value was representative of a single dive due to anticipation of the starting signal exclusions
Participant
RT week 0 mean (s) ± SD
RT week 4 mean (s) ± SD
Participant RT effect
size
Cohort RT effect size
(d)
BT week 0 mean (s) ±
SD
BT week 4 mean (s) ±
SD
Participant BT effect
size
Cohort BT effect size
(d)
‘Time to 15m’ week 0
mean(s) ± SD
‘Time to 15m’ week 4 mean(s) ± SD
Participant ‘time to
15m’ effect size
Cohort ‘time to
15m’ effect size (d)
C1P1 0.146 ± 0.009 0.165 ± 0.008 1.57
0.74
0.790 ± 0.022 0.809 ± 0.029 0.18
-0.06
9.58 ± 0.370 9.09 ± 0.061 -2.71
0.72
C1P2 0.130 ± 0.016 0.128 ± * -0.16 0.759 ± 0.018 0.706 ± * -0.49 7.96 ± 0.007 8.50 ± * 2.99
C1P3 0.148 ± * 0.165 ± 0.005 1.40 0.750 ± * 0.754 ± 0.010 0.04 7.85 ± * 8.08 ± 0.117 1.27
C1P4 0.131 ± 0.012 0.144 ± 0.016 1.07 0.844 ± 0.071 0.893 ± 0.022 0.45 7.94 ± 0.189 8.08 ± 0.021 0.77
C1P5 0.145 ± 0.004 0.145 ± 0.011 0.00 0.727 ± 0.028 0.676 ± 0.005 -0.47 8.34 ± 0.156 8.57 ± 0.189 1.27
Cohort Mean
0.140 ± 0.009 0.149 ± 0.016 0.774 ± 0.045 0.767 ± 0.086 8.33 ± 0.72 8.46 ± 0.42
C2P1 0.132 ± 0.009 0.110 ± 0.008 -1.81
-0.99
0.729 ± 0.001 0.736 ± 0.010 0.06
-0.11
7.20 ± 0.021 6.97 ± * -1.27
0.33
C2P2 0.153 ± 0.016 0.137 ± 0.022 -1.32 0.784 ± 0.014 0.799 ± 0.030 0.14 7.92 ± 0.119 7.86 ± 0.145 -0.33
C2P3 0.130 ± 0.017 0.121 ± 0.011 -0.74 0.727 ± 0.003 0.689 ± 0.012 -0.35 7.30 ± 0.208 7.39 ± 0.050 0.50
C2P4 0.115 ± 0.010 0.115 ± 0.011 0.00 0.726 ± 0.015 0.736 ± 0.012 0.09 7.29 ± 0.021 7.41 ± 0.085 0.66
C2P5 0.127 ± 0.003 0.110 ± 0.009 -1.40 0.843 ± 0.033 0.789 ± 0.019 -0.50 8.11 ± * 8.46 ± 0.295 1.94
Cohort Mean
0.131 ± 0.014 0.119 ± 0.011 0.762 ± 0.052 0.750 ± 0.045 7.56 ± 0.42 7.62 ± 0.57
C3P1 0.114 ± 0.019 - -
-
0.727 ± 0.018 - -
-
- - -
-
C3P2 0.100 ± * - - 0.734 ± * - - 6.46 ± * - -
C3P3 0.110 ± * - - 0.737 ± * - - 6.43 ± * - -
C3P4 0.122 ± 0.014 - - 0.664 ± 0.019 - - 6.33 ± 0.056 - -
C3P5 0.127 ± 0.012 - - 0.655 ± 0.014 - - 6.33 ± 0.017 - -
C3P6 0.157 ± 0.012 - - 0.689 ± 0.007 - - 6.56 ± 0.070 - -
Cohort Mean
0.122 ± 0.020 - 0.701 ± 0.037 - 6.42 ± 0.10 -

52
4.4 The effect of competition specific auditory stimulus training on swimming start reaction time
The two factor mixed design ANOVA analysis revealed a significant Time by Cohort interaction (F =
14.668, p = .005, observed power = .917). The effect of the dive training interventions on each
cohort was explored with contrasts comparing the RT means at each of the two time points.
Reaction time results in C2 post-intervention were significantly faster than those pre-intervention at
the 5% (0.05) significance level (t = 3.357, p = .028). The effect size of competition specific auditory
stimuli training on C2’s RT was determined to be ‘large’ in magnitude (Sullivan & Feinn, 2012) (d = -
.99). The cohort mean RT result in C1 post-intervention was slower than pre-intervention and
approached statistical significance at the 5% (0.05) significance level (t = -2.153, p = .098). The
magnitude of the change in RT in C1 approached a ‘large’ effect size (Sullivan & Feinn, 2012) (d =
0.74). Additionally, no significant differences in RT existed between C3 at Week 0 and C2 post-
intervention (t = -.307, p = .766).

53
4.5 The effect of regular dive training and regular dive training with competition specific auditory
stimulus on swimming start performance
The effect of regular dive training (C1) and competition specific auditory stimulus dive training (C2)
on swimming start performance variables, BT and ‘time to 15m’, is summarised previously as cohort
mean values in Table 8 and further analysed in 4.5.1 and 4.5.2.
4.5.1 Block time analysis
The two factor mixed design ANOVA analysis on participant BT data revealed that the Time by
Cohort interaction was not significant (F = .052, p = .825, observed power = .055). The effect of
Cohort was explored with contrasts comparing the BT means at each of the two time points. The
analysis revealed that C1 and C2 BTs were not significantly different pre-intervention (t = .398, p =
.701). Similarly, at the post-intervention time point C1 and C2 BTs were not significantly different (t =
.409, p = .693). There were no significant differences in BT pre- to post-intervention in C1 (t = .320, p
= .765) and C2 (t = .847, p = .445). Furthermore, there was no significant magnitude of effect of the
training interventions on BT in either C1 (d = -.06) or C2 (d = -.011).
4.5.2 ‘Time to 15m’ analysis
The two factor mixed design ANOVA analysis on participant ‘time to 15m’ data revealed that the
Time by Cohort interaction was not significant (F = .152, p = .707, observed power = .064). The effect
of Cohort was explored with contrasts comparing the ‘time to 15m’ means at each of the two time
points. The difference between C1 and C2’s ‘time to 15m’ results pre-intervention approached
significance (t = 2.064, p = .073). At the post-intervention time point ‘time to 15m’ for C2 was
significantly less than C1 (t = 2.687, p = .028). There were no significant differences in ‘time to 15m’

54
results pre- to post-intervention in C1 (t = -.768, p = .485) and C2 ( t = -.559, p = .606). The magnitude
of effect of the training interventions on ‘time to 15m’ approached a ‘large’ effect size (Sullivan, &
Feinn, 2012) in C1 (d = .72) and was between ‘small’ and ‘medium’ effect size (Sullivan & Feinn,
2012) in C2 (d = .33).
4.6 Reaction times and block times of sub-elite and elite level swimmers
Reaction times and BTs of sub-elite adolescent swimmers (C1, n=5 and C2, n=5) were compared at
the pre-intervention time point against results obtained from the elite level swimmers (C3, n=6). The
difference in RTs between C1 and C3 approached statistical significance (t = 1.916, p = .088) at the p
= 0.05 significance level, whilst RTs of C2 were not significantly different from C3 (t = .928, p = .377).
BTs of C3 were significantly less than BTs of both C1 (t = 2.967, p = .016) and C2 (t = 2.287, p = .048).
4.7 Participant perceptions of swimming start training interventions
Table 9 summarises the post-intervention questionnaire results of the ten swimmers’ (C1: n=5, C2:
n=5) perceptions towards each of the two swimming start training interventions. The results are
presented as the number of responses across the five Likert scale response options for each
question and is specific to each cohort. Differences existed in the participants’ mental attitude
towards the two training interventions with all participants in C2 stating that they were ‘very
satisfied’ with the program, whilst three participants in C1 revealed that were ‘satisfied’ and two
stated they were ‘neutral’. 90% of all participants in C1 and C2 revealed they were confident prior to
the final testing session and 90% of all participants believed that their RT results would improve as a
result of their training intervention.

55
Table 9. Questionnaire results: Participant perceptions of swimming start training interventions
Cohort Questions and number of participant responses per cohort
1. Did you feel physically fatigued after each of the dive training sessions (i.e. after completing six dives)?
1-Not at all 2-A little bit 3-Somewhat 4-Quite a bit 5-Very much
C1 0 2 3 0 0 C2 1 1 3 0 0
2. On average, how would you describe the amount of effort you gave during the dive training program? 1-Hardly any 2-A little bit 3-Some 4-Quite a bit 5-Everything I had
C1 0 0 1 2 2
C2 0 0 0 4 1
3. How would you describe your mental attitude in relation to the four week training program? 1-Very dissatisfied 2-Dissatisfied 3-Neutral 4-Satisfied 5-Very satisfied
C1 0 0 2 3 0 C2 0 0 0 0 5
4. On average, how would you describe the amount of concentration you gave during the dive training program? 1-Hardly any 2-A little bit 3-Some 4-Quite a bit 5-Everything I had
C1 0 0 1 3 1 C2 0 0 1 2 2
5. Did you feel confident prior to the final testing session? 1-Not at all 2-A little bit 3-Somewhat 4-Quite a bit 5-Very much
C1 0 0 1 3 1 C2 0 0 0 4 1
6. How would you describe your swimming start performance during the final testing session? 1-One of the worst 2-Below average 3-Average 4-Above average 5-One of the best
C1 0 0 3 2 0 C2 0 0 0 3 2
7. How did your performance in the testing session compare to the way you expected to perform? 1-Much worse than expected 2-Worse than expected 3-As expected 4-Better than expected 5 -Much better than expected
C1 0 1 2 2 0 C2 0 0 1 3 1
8. Did you expect your reaction time to improve as a consequence of the training program? 1-Not at all 2-Not really 3-Undecided 4-Somewhat 5-Very much so
C1 0 0 0 4 1 C2 0 0 1 3 1
9. Did you expect your time to 15 metres to improve as a consequence of the training program? 1-Not at all 2-Not really 3-Undecided 4-Somewhat 5-Very much so
C1 0 0 0 4 1 C2 0 0 2 2 1
56
CHAPTER 5: DISCUSSION
Despite task specific training being shown to improve participant RTs when they are re-exposed to
the same stimulus (Nuri et al., 2013; Gavkare et al., 2013; De Souza et al., 2013; Tong et al., 2009),
the majority of current competitive swimmers do not conduct dive training with task specific
auditory stimuli on a regular basis. Furthermore, current swimming literature is focussed on
improving performance outcomes of elite athletes, with less attention being given to sub-elite
adolescent swimmers who are the next generation of elite level swimmers. In this study it was
hypothesised that the use of competition specific auditory stimuli during dive training could induce
significant improvements in participant RTs, theoretically translating to improvements in participant
BTs and overall swimming start performance.
Competition specific auditory stimulus dive training (C2) did result in improved participant RTs in
response to the auditory ‘go’ signal when compared with regular dive training (C1). Whilst
competition specific auditory stimulus training resulted in a statistically significant magnitude of RT
change in C2, the effectiveness of this type of RT training can be explored through contrasts with
other literature. Of the swimming start intervention studies previously discussed in Chapter 2,
changes in RT before and after the implementation of a dive training intervention were analysed in
only one (Blanksby et al., 2002). That study showed a cohort mean reduction in RT of 0.03s, after a
regular dive training program, compared with the C2 cohort mean reduction of 0.012s in this study.
Although the magnitude of change in RT was greater, Blanksby et al. assessment of RT was limited by
the experimental design which involved the use of a high speed camera to determine the point of
reaction. Reaction time was deemed to be the time between the start signal and the first instant of
observable movement by the swimmer (Blanksby et al., 2002), rather than the time point of initial
muscular activation (Johnson & Nelson, 1988). The current study determined RT through the use of a

57
force measurement instrument, which ensured that the initial point of muscular activation was
being assessed.
Whilst only a single swimming start intervention study assessed changes in RT prior to the current
study, other sporting and non-sporting literature can provide insight into RT training techniques. A
competitive swimming start shares similar auditory starting stimuli characteristics with that of an
athletics track start. Extensive research has been conducted in athletics involving analysis of
sprinters’ RTs during a sprint start (Nuri et al., 2013; Willwacher et al., 2013; Pain & Hibbs, 2007;
Delalija & Babić, 2008). In these studies, associations between specific physiological characteristics
of sprinters and RT, as well as the effect of faster RTs on sprint performance, were assessed.
However, the effect of training interventions on RT was not assessed in these studies and is an area
of research that remains sparse. On the other hand, RT training interventions have been evident in
non-sporting literature. A twelve week yoga training intervention was implemented in a group of
male medical students (n=27), to assess its effect on auditory RTs (Madanmohan et al., 1992). The
yoga training resulted in significantly faster auditory RTs by the students, with a mean reduction of
0.037s from pre- to post-intervention. This improvement was suggested to be due to improved
concentration and ability to filter out extraneous stimuli. A reduction of 0.037s in RT represents a
greater magnitude of RT change than what was found in the current study. It is to be noted
however, that the sub-elite adolescent swimmers in the current study were already trained in the
act of swimming starts prior to the intervention, highlighting that the training intervention in C2
resulted in faster RTs despite the participants’ prior skill level. Consequently, the use of competition
specific auditory stimuli during habitual dive training was an effective method of reducing swimming
start RT by up to 0.022s (C2P1), over a short period of training intervention.

58
While competition specific auditory stimulus dive training resulted in a significant reduction in C2’s
RT results, no statistically significant differences were found between C2 and C3 RT results pre- and
post-intervention. This result did not coincide with our hypothesis which stated that auditory
stimulus dive training would be implemented to bridge the performance gap between sub-elite and
elite level swimmers’ RTs. Analysis of only the sub-elite swimmers’ (n = 10) ‘time to 15m’ and RT
results showed a moderate correlation (r = .513) between these two swimming start variables which
was consistent with previous research (Vantorre et al., 2014). However, a higher competitive
swimming level of the participants in the current study did not necessarily predict significantly faster
RT results.
Regular dive training in C1, with the absence of any auditory stimuli, resulted in an undesirable
effect on participant RTs. The magnitude of change from pre- to post-intervention came close to a
‘large’ effect size in the direction of slower participant RT results, which approached statistical
significance (p = .098). The change in RTs of C1 did not coincide with previous regular dive training
research which revealed, in the absence of an auditory ‘go’ stimulus, that regular dive training can
improve swimming start RT (Blanksby et al., 2002). Although the majority of daily swimming
programs involve habitual dive training without competition specific auditory stimuli, swimmers are
regularly exposed to variations of their coach’s voice as an auditory stimulus. Commonly spoken
phrases used by coaches to commence a swimming start during habitual dive training are “ready” or
“take your marks”, followed by “go”. The pre- to post-intervention RT results of C1 may be explained
by removal of all forms of auditory stimulus when performing dive training. While a coach’s voice
and an electronic horn differ in their audio frequency, the results potentially suggest that dive
training with the coach’s voice is more advantageous than the act of performing dives without any
auditory stimuli.

59
Participant perceptions of a training intervention may affect their mental attitude throughout the
training period, resulting in altered final dive testing RT results. The study carried out by Sheard and
Golby (2006) showed that a psychological skills training program can be used to improve overall
swimming performance (race times). Consequently, it could be anticipated that if participants in C1
and C2 had a positive psychological view of the effect of the training programs on RT, then they
would be more likely to apply maximal effort during the dive training sessions, resulting in improved
swimming start performance. ‘Mental attitude’ towards the dive training program was quantified in
the final testing session written questionnaire and revealed that 100% of C2 were ‘very satisfied’
with the intervention, whilst C1 responded as either ‘neutral’ (n=2) or ‘satisfied’ (n=3). The
difference in ‘mental attitude’ may have been due to participants in C1 perceiving their training
program and the associated cohort as the control group. Despite this, 100% of participants in C1
believed that their RT would improve ‘somewhat’ or ‘very much so’, suggesting that the changes in
RT results in C1 and C2 were less confounded by the participant’s perceptions of the training
programs and rather, were brought about by the dive training programs themselves. Furthermore,
the swimming training carried out by the sub-elite swimmers in C1 and C2 during the four week
intervention may have altered final dive testing results. However, despite any potential effect of the
swimming training, competition specific auditory stimulus dive training had a positive effect on
swimming start RTs of C2.
Although the magnitude of RT change in C2 had a ‘large’ cohort effect size, the relative magnitude of
the benefit of faster RTs to swimming start performance (BT and ‘time to 15m’) needs to be
considered. Competitive swimming start times to 15m have been found to vary from 0.8% to 26.1%
of the overall race time, depending on the event (Cossor & Mason, 2001). Consequently, as BT is
comprised of RT and movement time of the swimmer, faster RTs would theoretically reduce BT and
assist in improving overall race performance, especially in shorter distance events. Interestingly,
despite the training interventions resulting in faster RTs in C2 and slower RTs in C1, no significant

60
changes in BT were evident pre- to post-intervention in either cohort. This result may be due to the
fact that a reduction in C2’s mean cohort RT of 0.012s represents a mere 1.6% of the post-
intervention cohort mean BT. Therefore, minute changes in RT would not yield a statistically
significant change in BT. However, no apparent trend existed between RT effect sizes and BT effect
sizes within participants, inferring that improvements in RT results did not necessarily result in faster
BTs. Previous research has shown that the application of pre-tension of the lower limb muscles
through the starting block prior to the starting signal has significantly reduced BTs compared to no
pre-tension (Lee et al., 2002). Pre-tension of the lower limb muscles, or static muscle contractions,
whilst on the block resulted in reduced time to peak force. As a result, rate of force development
(RFD) through the lower limb muscles during a swimming start may be a superior indicator of faster
BTs than the time point of initial muscular activation.
While the magnitude of change in RT was statistically significant in C2 and the cohort effect sizes of
C1 and C2 were in opposite directions, it is to be noted that RT represents a very small percentage of
the overall ‘time to 15m’. While changes in RT did not yield statistically significant changes in ‘time
to 15m’ results in either C1 or C2, faster RTs in a competitive setting may still have an effect on the
overall race outcome. No significant changes in ‘time to 15m’ results in the current study differed
with previous research, where the integration of dives into regular training, in the absence of any
auditory stimuli, had previously shown improvements in elite level swimmers’ ‘time to 10m’ results
(Blanksby et al., 2002). This difference in research findings may be due to the differing competitive
level of the sample groups.
The study conducted by Mason et al. (2012) found that of the ‘time to 15m’, elite-level swimmers
(n=52) spent 56% in the underwater phase and 28% in the free swimming phase. The sub-elite
adolescent swimmers in the current study were observed by the researcher to spend a greater
percentage of time in the free swimming phase than the elite-level swimmers. ‘Time to 15m’ results

61
were potentially confounded by the swimmers’ regular swimming training during the intervention
period which may have altered free swimming velocity and therefore made it difficult to draw any
causal effect of the dive training interventions on swimmers’ ‘time to 15m’ results.
Elite level swimmers in C3 were not subject to competition specific auditory stimulus during their
dive training. Despite this, their pre-intervention RT results were not significantly different from C2’s
post-intervention results. The RT results in C3 may be attributable to the culmination of total dives
performed during competitions over their swimming career, which would involve reacting to the
competition auditory stimuli. In addition to this, performing a large quantity of dives at a
competitive level may also assist the swimmers in concentrating on the starting auditory stimulus
and filtering out extraneous stimuli. Therefore, elite swimmers may produce faster RTs with a
greater concentration and less nervous system processing whilst on the block than elite sprint
athletes (Maglischo, 1982). The RT results of the elite level swimmers in C3 (0.122 ± 0.020) were also
fast when compared with the mean RT of 0.164 ± 0.024s taken from 76 male 100m athletics
sprinters at the 2004 Olympic Games in Athens (Delalija & Babić, 2008). Unlike competitive
swimming, starting blocks in athletics are fitted with a false start system with force sensors
operating at 1000Hz which are designed to alert the starter when a runner has applied force prior to
0.1s after the starting signal. As a result, athletics sprinters may have a further neural processing
barrier when reacting to the auditory ‘go’ stimulus, to ensure a false start does not occur. The
difference in RTs between the swimmers in C3 and athletics sprinters may also be due to the
swimmers undergoing RT analysis in a training environment, where there is no apprehension or
consequences of a false start. Furthermore, without a force application false start system in place in
competitive swimming, swimmers may not be as hesitant when reacting to the starting signal as that
of athletics sprinters and may be applying pre-tension through the lower limb muscles prior to the
starting signal.

62
The elite level swimmers’ BT results (0.701 ± 0.037s) in this study were consistent with previous
swimming start research which found elite level male swimmers had an average BT of 0.72 ± 0.04s
(Tor et al., 2015). A higher competitive level of swimming appears to be associated with faster BTs
whereby, at the pre-intervention dive testing session C3 had significantly faster BT results than both
C1 (0.774 ± 0.045s) and C2 (0.762 ± 0.052s). A competitive swimming start has an auditory ‘go’ signal
similar to the start protocol in athletics and also shares similar kinematic properties to that of an
athletics block start after the introduction of the OSB-11 rear kick plate. Analysis of the block starts
in athletics have shown that the RFD of the lower-limb muscles was significantly greater in elite
sprinters than sub-elite sprinters and that muscular strength plays a significant role in the efficiency
of a sprint start (Slawinski et al., 2010). Additionally, Sleivert and Taingahue (2004) analysed the
relationship between sprint start variables and strength and power of 30 male athletes, concluding
that concentric force development is essential to sprint start performance. Consequently, the
performance gap in BTs of elite and sub-elite level swimmers may be attributable to a greater
muscular strength and RFD.
Habitual aquatic and resistance training, competitive swimming level and the associated
physiological characteristics of the age gap may all contribute to a greater RFD and maximal strength
in the elite level swimmers in the current study when compared with the sub-elite adolescent
swimmers. Research conducted in the sport of badminton, which also requires maximal and
explosive muscle strength, showed that a group of elite male badminton players (n=35) had a
significantly greater RFD in the muscles flexing and extending the knee joint, than a reference group
of males who conducted a 14 week resistance training program (Andersen, Larsson, Overgaard, &
Aagaard, 2007). The study concluded that this finding might be due to physiological adaptations
brought about by the habitual training undertaken by the badminton players. Training interventions
have also been shown to result in changes to RFD, as seen in a group of 15 male subjects increasing
their contractile RFD after a heavy-resistance strength training program (Aagaard, Simonsen,
63
Andersen, Magnusson, & Dyhre-Poulsen, 2002). Furthermore, habitual aquatic training undertaken
by participants in C1 and C2, coupled with the dive training interventions, may have had little to no
effect on the RFD and maximal strength of the sub-elite adolescent swimmers.
This chapter discussed the effect of competition specific auditory stimulus training on swimming
start RT and overall swimming start performance, to which a number of conclusions and implications
can be made. These conclusions and implications are presented in the following chapter (Chapter 6).

64
CHAPTER 6: CONCLUSIONS AND IMPLICATIONS
6.1 Conclusions
It was concluded, from the findings of the current study, that competition specific auditory stimulus
dive training is an effective training technique to improve swimming start RT. Furthermore, regular
dive training in the absence of an auditory ‘go’ stimulus (coach’s voice or electronic horn) was
detrimental to swimming start RT. The current study found that competitive swimming level was not
a clear predictor of swimming start RT, whereby RTs were subject to participant variability across the
sample group. Additionally, participants across all three cohorts displayed fast RTs when compared
with competition recorded RTs of track sprinters. It was concluded that a further neural processing
‘barrier’ may exist for track sprinters when reacting to the auditory ‘go’ signal in competition. Unlike
athletics, competitive swimming does not have a clear force measurement false start mechanism,
which may have accounted for the swimmers’ RTs in the current study.
While competition specific auditory stimulus dive training was effective in reducing RT, it had no
statistically significant effect on overall swimming start performance in sub-elite adolescent
swimmers. However, an improvement in swimming start RT of 0.012s (C2 pre- to post-intervention
mean reduction) has the potential to effect performance and overall race outcomes at an elite
international level, especially in short distance events. For example, altered RTs during the women’s
100m freestyle final at the Olympic Games in Rio de Janeiro (Brazil, 2016) may have changed the
final race outcome, where Simone Manuel (USA) and Penny Oleksiak (Canada) tied for the gold
medal with a time of 52.70s.

65
Questionnaire findings from the current study revealed that all of the sub-elite participants indicated
that they were only ‘a little bit’ or ‘somewhat’ fatigued after each dive session and 100% of C2
indicated that their mental attitude towards the task specific dive training was ‘very satisfied’. From
a coaching perspective, the questionnaire findings highlighted that this type of dive training is
implementable into habitual aquatic training. The findings of the current study have implications for
coaching staff across all competitive levels of swimming, whereby incorporating competition specific
auditory stimuli during habitual dive training has the potential to develop optimal swimming start
RTs in their athletes.
6.2 Limitations and future directions
The current study aimed to fill the gap in the literature surrounding the use of RT training
interventions in the sport of swimming. The study has provided preliminary findings for the use of
task specific dive training, with auditory components, as an effective form of RT training for
competitive swimmers. The research has significantly contributed to the understanding of swimming
start RT and holds implications for further investigations with the goal of improving swimming
performance at an elite international level.
Given that the current study was limited by a small sample size, further research involving larger
sample sizes and the regimented implementation of the intervention into habitual training, to
increase participant adherence, would be beneficial to investigate the effect of this form of RT
training on overall performance outcomes. Additionally, further research involving a sample of
female participants would be advantageous to assess possible RT gender variations in response to
auditory RT training. Specifically to swimming, the inclusion of ‘time to 5.5m’ (Bishop et al., 2009) as
an additional performance variable would be ideal to limit the ‘underwater’ and ‘free swimming’
phases from confounding any potential effect of RT improvements on overall swimming start

66
performance. Although the time between “take your marks” and the auditory ‘go’ signal is variable,
analysis of starts in a training environment holds no negative consequence to the participant if they
‘false start’ and therefore increases the likelihood of the participant anticipating the starting signal.
This concept was apparent in the current study, whereby a number participant RT results were
removed due to anticipation of the starting signal. Consequently, a future study that involved a
greater number of starts during testing sessions would be beneficial to reduce the effect of data
removal, due to anticipation of the starting signal, on participant mean values.
Significant changes to swimming start performance in competitive adolescent swimmers may have
been limited by their RFD, maximal force production off the starting block and ‘free swimming’
performance. Therefore, the current study holds implications for further research with sub-elite
swimmers and athletics sprinters, involving task specific start training coupled with age specific
resistance training, to improve force capabilities of adolescent athletes. Further research is also
required to investigate whether auditory RT training would be beneficial in elite level swimmers and
athletics sprinters, who already have an optimal RFD and maximal force brought about through their
greater load and volume of habitual training, cross-training (e.g. resistance training) and age specific
physiological development.
The unique force measurement device developed and used in the current study was effective in
analysing swimming start RT, portable and easily operable by the researcher. Additionally, as the
device was battery operated and waterproofed, it adheres to safety procedures associated with
electrical equipment in a pool environment. Consequently, the force measurement device is a
significant contribution to the sport of swimming, not only holding implications for further
swimming start research, but also by providing a more economically viable and precise method of RT
analysis for competitive swimmers and coaching staff. Furthermore, the device has implications for

67
the development of a false start detection system for competitive swimming, similar to that used in
athletics.
Knowledge gained from this study significantly contributes to the understanding of auditory RT
training and the development of optimal swimming start RTs of competitive swimmers.
Furthermore, the current research has implications for the further exploration of auditory RT
training in swimming at an elite level and other sporting codes that involve reacting to an auditory
stimulus.

68
REFERENCES
Aagaard, P., Simonsen, E. B., Andersen, J. L., Magnusson, P., & Dyhre-Poulsen, P. (2002). Increased
rate of force development and neural drive of human skeletal muscle following resistance
training. Journal of Applied Physiology, 93(4), 1318-1326.
Andersen, L., Larsson, B., Overgaard, H., Aagaard, P. (2007). Torque-velocity characteristics and
contractile rate of force development in elite badminton players. European Journal of Sport
Science, 7(3), 127-134.
Arellano, R., Pardillo, S., De La Fuente, B., & Garcia, F. (2002). Improving the swimming start
technique using biomechanics feedback system. In Y. Hong (Ed.), International Research in
Sports Biomechanics (pp. 271-278). New York, USA: Routledge.
Balilionis, G., Nepocatych, S., Ellis, C. M., Richardson, M. T., Neggers, Y. H., & Bishop, P. A. (2012).
Effects of different types of warm-up on swimming performance, reaction time, and dive
distance. Journal of Strength and Conditioning Research, 26(12), 3297-3303.
Bello, A. (2012). 2012 U.S. Olympic Swimming Team Trials – Day 2 [Photo]. Zimbio Entertainment,
San Carlos. Retrieved from
http://www.zimbio.com/pictures/4zwLr5HEoG_/2012+Olympic+Swimming+Team+Trials+Da
y+2/mDOZhYsR7oP/Michael+Phelps
Benjanuvatra, N., Lyttle, A., Blanksby, B., & Larkin, D. (2004). Force development profile of the lower
limbs in the grab and track start in swimming. Proceedings XXIInd International Symposium
on Biomechanics in Sports 2004, 1, 399-402.

69
Bishop, D. C., Smith, R. J., Smith, M. F., & Rigby, H. E. (2009). Effect of Plyometric Training on
Swimming Block Start Performance in Adolescents. Journal of Strength and Conditioning
Research, 23(7), 2137-2143.
Blanksby, B., Nicholson, L., & Elliott, B. (2002). Biomechanical analysis of the grab, track and
swimming starts: an intervention study. Sports Biomechanics, 1(1), 11-24.
Bobbert, M. F., & Van Soest, A. J. (1994). Effects of muscle strengthening on vertical jump height: a
simulation study. Medicine and Science in Sports and Exercise, 26(8), 1012-1020.
Bobo, M. (1999). The effect of selected types of warm-up on swimming performance. International
Sports Journal, 3(2), 37-43.
Breed, R. V. P., & Young, W. B. (2003). The effect of a resistance training programme on the grab,
track and swing starts in swimming. Journal of Sports Sciences, 21(3), 213-220.
Brown, A. M., Kenwell, Z. R., Maraj, B. K., & Collins, D. F. (2008). ”Go” signal intensity influences the
sprint start. Medicine & Science in Sport and Exercise, 40(6), 1142-8.
Chu, D. (1998). Jumping into plyometrics. Champaign, IL: Human Kinetics.
Cossor, J., & Mason, B. (2001). Swim start performances at the Sydney 2000 Olympic Games.
Proceedings of XIX Symposium on Biomechanics in Sports, 1, 25-30.

70
Cuenca-Fernández, F., López-Contreras, G., & Arellano, R. (2015). Effect on swimming start
performance of two types of activation protocols: lunge and YoYo squat. Journal of Strength
and Conditioning Research, 29(3), 647-655.
Delalija, A., & Babić, V. (2008). Reaction time and sprint results in athletics. International Journal of
Performance Analysis in Sport, 8(2), 67-75.
De Souza, A. C., Yehia, H. C., Sato, M. A., & Callan, D. (2013). Brain activity underlying auditory
perceptual learning during short period training: simultaneous fMRI and EEG recording.
Biomedcentral Neuroscience, 14(8), 3204-3215. doi: 10.1186/1471-2202-14-8.
Ebbeck, V., & Weiss M. R. (1988). The Arousal-Performance Relationship: Task Characteristics and
Performance Measures in Track and Field Athletics. The Sport Psychologist, 2(1), 13-27.
Garcia-Hermoso, A., Escalante, Y., Arellano, R., Navarro, F., Dominguez, A. M., & Saavedra, J. M.
(2013). Relationship between final performance and block times with the traditional and
new starting platforms with a back plate in international swimming championship 50m and
100m freestyle events. Journal of Sports Science & Medicine, 12(4), 698.
Gavkare, A. M., Nanaware, N. L., & Surdi, A. D. (2013). Auditory reaction time, visual reaction time
and whole body reaction time in athletes. Indian Medical Gazette, 6, 214-219.
Guimaraes, A. C. S., & Hay, J. G. (1985). A Mechanical Analysis of the Grab Starting Technique in
Swimming. International Journal of Sport Biomechanics, 1(1), 25-35.

71
Hassannezhad, E., Bahadoran, M. R., Ramezanpour, M. R., & Attarzade Hosseini, S. R. (2012).
Comparison of land and aquatic based plyometric training on swimming block start. Annals
of Biological Research, 3(3), 1505-1509.
Hay, J.C. (1986). The biomechanics of sport technique. Englewood Cliffs, NJ: Prentice Hall Inc.
Hohmann, A., Fehr, U., Reuss, A., Straub, S., & Kieser S. (2010). Specific strength training and start
performance in swimming. In P. L. Kjendlie, R. K. Stallman, & J. Cabri (Eds.), XIth International
Symposium for Biomechanics and Medicine in Swimming (pp. 114). Oslo, Norway: Norwegian
School of Sport Science.
Holler, J. F., Skoog, D. A., & Crouch, S. R. (2007). Principles of Instrumental Analysis. California, USA:
Cengage Learning Inc.
Honda, K., Sinclair, P., Mason, B., & Pease, D. (2010). A biomechanical comparison of elite swimmers
start performance using the traditional track start and the new kick start. In P. L. Kjendlie, R.
K. Stallman, & J. Cabri (Eds.), XIth International Symposium for Biomechanics and Medicine in
Swimming (pp. 94-96). Oslo, Norway: Norwegian School of Sport Science.
IAAF, (2016). 100 Metres. Retrieved January 10, 2016, from
https://www.iaaf.org/disciplines/sprints/100-metres
Images Scientific Instruments, (2016). Piezo Coax [Image]. Images Co, USA. Retrieved from
http://www.imagesco.com/catalog/sensors/piezocoax.html
72
Johnson, B. L., & Nelson, J. K. (1988). Practical measurement for evaluation in physical education.
Delhi, India: Surjeet Publication.
Kemp, E. H., Coppeé, G. E. & Robinson, E. H. (1937). Electric response of the brain stem to unilateral
auditory stimulation. American Journal of Physiology, 120, 304.
Lee, C. W., Huang, C., Lin, D. C., & Lee, C. W. (2002). The strategy of muscular pre-tension during
initial block phase in swimming grab start. Proceedings XXth International Symposium on
Biomechanics in Sports 2002, 1, 52-55.
Lepretre, P. M., Kazarine, L., Puel, F., Chollet, D., & Fernandes, R. J. P. (2014). Does four weeks of
simple reaction time training improve start performance in swimming? In B. Mason (Ed.),
XIIth International Symposium for Biomechanics and Medicine in Swimming (pp. 437-441).
Canberra, Australia: Australian Institute of Sport.
Macnicol, I. (2012). Olympics Day 4 – Swimming [Photo]. Sports Jounalists’ Association, South
Croydon. Retrieved from http://www.sportsjournalists.co.uk/photography/picture-perfect-
2012-from-photoy-shortlists/attachment/olympics-day-4-swimming/
Madanmohan, Thombre, D. P., Balakumar, B., Nambinarayanan, T. K., Thakur, S., Krishnamurthy, N.,
& Chandrabose, A. (1992). Effect of yoga training on reaction time, respiratory endurance
and muscle strength. Indian Journal of Physiology and Pharmacology, 36(4), 229-233.
Maglischo, E. W. (1982). Swimming Faster. Toronto, Canada: Mayfield Publishing Company.
Maglischo, E. W. (2003). Swimming Fastest. Champaign, ILL: Human Kinetics.

73
Masamoto, N., Larson, R. & Gates, T. (2003). Acute Effects of Plyometric Exercise on Maximum Squat
Performance in Male Athletes, Journal of Strength and Conditioning Research, 17(1), 68-71.
Mason, B., Mackintosh, C., & Pease, D. (2012). The development of an analysis system to assist in the
correction of inefficiencies in starts and turns for elite competitive swimming. In E.
Bradshaw, A. Burnett, & P. Hume (Eds.), 30th Conference for the International Society of
Biomechanics in Sport (pp. 156-158). Melbourne, Australia.
Measurement Specialities, (2016). RF cable / spiral / rugged [Image]. TE Connectivity, USA. Retrieved
from
http://www.directindustry.com/prod/measurement-specialties/product-9250-410207.html
Miller, J., Hay, J. G., & Wilson, B. (1984). Starting techniques of elite swimmers. Journal of Sport
Sciences, 2(3), 213-223.
Nuri, L., Shadmehr, A., Ghotbi, N., & Attarbashi Moghadam, B. (2013). Reaction time and
anticipatory skill of athletes in open and closed-skill dominated sport. European Journal of
Sport Science, 13(5), 431-436.
Pain, M. T. G, & Hibbs, A. (2007). Sprint starts and the minimum auditory reaction time. Journal of
Sport Sciences, 25(1), 79-86.
Rebutini, V. Z., Pereira, G., Bohrer, R. C., Ugrinowitsch, C., & Rodacki, A. L. (2014). Plyometric long
jump training with progressive loading improves kinetic and kinematic swimming start
parameters, Journal of Strength & Conditioning Research, 30(9), 2392-2398.

74
Ruschel, C., Araujo, L. G., Pereira, S. M., & Roesler, H. (2007). Kinematical analysis of the swimming
start: block, flight and underwater phases. Proceedings of XXV Symposium on Biomechanics
in Sports, 1, 385-388.
Schnabel, U., & Kuchler, J. (1998). Analysis of the starting phase in competitive swimming.
Proceedings of XVI International Symposium of Biomechanics in Sports, 1, 247-250.
Sheard, M, & Golby, J. (2006). Effect of a psychological skills training program on swimming
performance and positive psychological development. International Journal of Sport and
Exercise Psychology, 4(2), 149-169.
Slawinski, J., Bonnefoy, A., Leveque, J. M., Ontanon, G., Riquet, A., Dumas, R., & Cheze, L. (2010).
Kinematic and kinetic comparisons of elite and well-trained sprinters during sprint start.
Journal of Strength and Conditioning Research, 24(4), 896-905.
Slawson, S. E., Conway, P. P., Cosser, J., Chakravorti, N., & West, A. A. (2013). The categorisation of
swimming start performance with reference to force generation on the main block and
footrest components of the Omega OSB11 start blocks. Journal of Sport Sciences, 31(5), 468-
478.
Sleivert, G., & Taingahue, M. (2004). The relationship between maximal jump-squat power and
sprint acceleration in athletes. European Journal of Applied Physiology. 91(1), 46-52.
75
Squire, J. (2012). 2012 U.S. Olympic Swimming Team Trials – Day 6 [Photo]. Zimbio Entertainment,
San Carlos. Retrieved from
http://www.zimbio.com/photos/Nathan+Adrian/Anthony+Ervin/2012+Olympic+Swimming+
Team+Trials+Day+6/bv1bLP4SamC
Sullivan, G. M., & Feinn, R. (2012). Using effect size – or why the P value is not enough. Journal of
Graduate Medical Education, 4(3), 279-282.
Swiss Timing, (2009). OSB-11 Swimming Starting Block [Image]. Retrieved from the Swiss Timing
website:
http://www.swisstiming.com/fileadmin/Resources/Data/Datasheets/DOCM_AQ_OSB11_Sta
rtingBlock_1015_EN.pdf
Thompson, P. D., Colebatch, J. G., Brown, P., Rothwell, J. C., Day, B. L., Obeso, J. A., & Marsden, C. D.
(1992). Voluntary stimulus-sensitive jerks and jumps mimicking myoclonus or pathological
startle syndromes. Movement Disorders, 7(3), 257-262.
Tong, Y., Melara, R. D., & Rao, A. (2009). P2 enhancement from auditory discrimination training is
associated with improved reaction times. Brain Research, 1297, 80-88.
Tor, E., Pease, D., & Ball, K. A. (2014). Characteristics of an elite swimming start. In B. Mason (Ed.),
XIIth International Symposium for Biomechanics and Medicine in Swimming (pp. 257-263).
Canberra, Australia: Australian Institute of Sport.
Tripp, R. S. (1965). How fast can you react? Science Digest, 57(50), 240.

76
Vantorre, J., Chollet, D., & Seifert, L. (2014). Biomechanical analysis of the swim start: a review.
Journal of Sports Science & Medicine, 13(2), 223-31.
Vantorre, J., Seifert, L., Fernandes, R. J., Boas, J. P. V., & Chollet, D. (2010). Kinematical Profiling of
the Front Crawl Start. International Journal of Sports Medicine, 31(1), 16-21.
Whitten, P. (1997). Should we limit the underwater fly? Swimming World and Junior Swimming,
38(11), 34-36.
Willwacher, S., Herrmann, V., Heinrich, K., & Brüggemann, G.P. (2013). Start block kinetics: What the
best do different than the rest. In T. Y. Shiang, W. H. Ho, P. C. Huang, and C. L. Tsai (Eds.),
Proceedings of XXXI International Conference on Biomechanics in Sports, Taipei, Taiwan.

77
APPENDICES
Appendix 1: Participant information sheets and consent forms
Participant information sheet (adolescent swimmer):
The effect of competition specific auditory stimulus training on swimming start reaction
time
PARTICIPANT INFORMATION STATEMENT
(1) What is this study about?
The University of Sydney invites you to take part in a study that will involve the recreation of a
competition specific environment in the regular training setting. Regular dive practice under these
conditions will be performed to investigate whether reaction time can be improved, with the
ultimate goal of improving overall swimming performance. Please note that this information sheet
should also be shown to your parent or guardian.
(2) Who is running the study?
The study is being conducted by Christopher Papic and Professor Ross Sanders at the University of
Sydney.
Discipline of Exercise and Sport Science
Faculty of Health Sciences
ABN 15 211 513 464
Professor Ross Sanders
Room C43K
K Block, Cumberland Campus
The University of Sydney
NSW 2006 AUSTRALIA
Telephone: +61 2 9351 9067
Facsimile: +61 2 9351 9204
Email: [email protected] Web: http://www.sydney.edu.au/
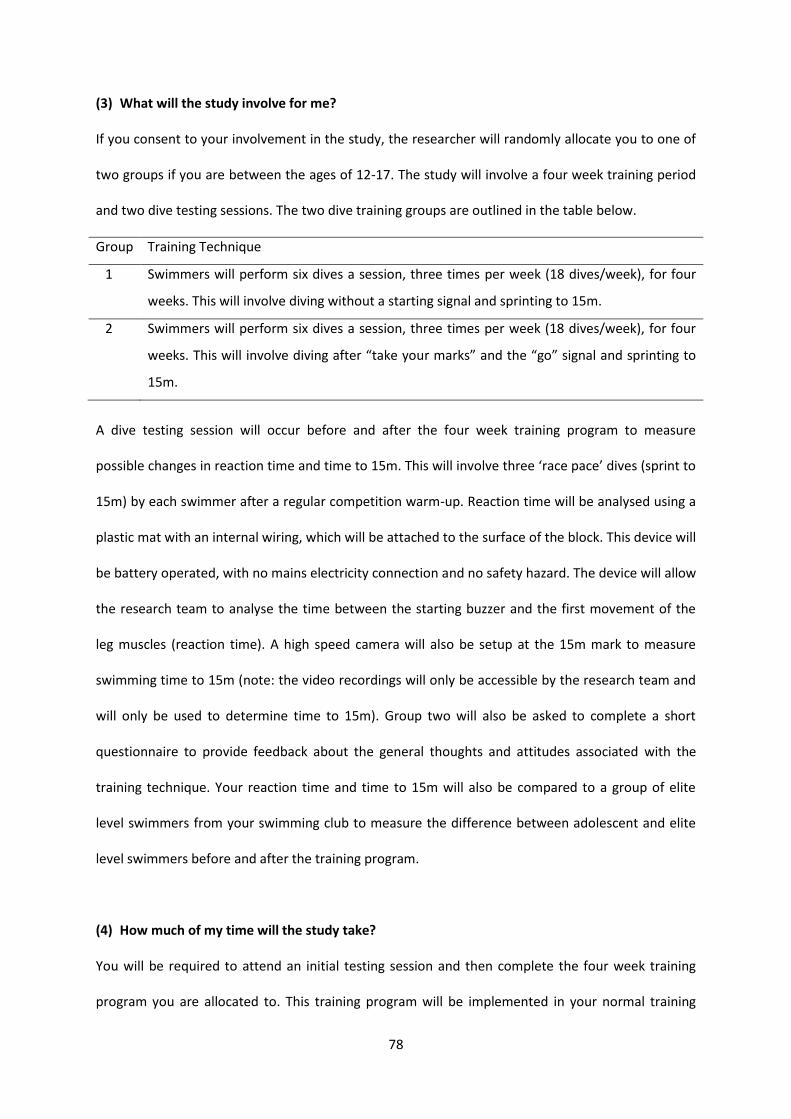
78
(3) What will the study involve for me?
If you consent to your involvement in the study, the researcher will randomly allocate you to one of
two groups if you are between the ages of 12-17. The study will involve a four week training period
and two dive testing sessions. The two dive training groups are outlined in the table below.
Group Training Technique
1 Swimmers will perform six dives a session, three times per week (18 dives/week), for four
weeks. This will involve diving without a starting signal and sprinting to 15m.
2 Swimmers will perform six dives a session, three times per week (18 dives/week), for four
weeks. This will involve diving after “take your marks” and the “go” signal and sprinting to
15m.
A dive testing session will occur before and after the four week training program to measure
possible changes in reaction time and time to 15m. This will involve three ‘race pace’ dives (sprint to
15m) by each swimmer after a regular competition warm-up. Reaction time will be analysed using a
plastic mat with an internal wiring, which will be attached to the surface of the block. This device will
be battery operated, with no mains electricity connection and no safety hazard. The device will allow
the research team to analyse the time between the starting buzzer and the first movement of the
leg muscles (reaction time). A high speed camera will also be setup at the 15m mark to measure
swimming time to 15m (note: the video recordings will only be accessible by the research team and
will only be used to determine time to 15m). Group two will also be asked to complete a short
questionnaire to provide feedback about the general thoughts and attitudes associated with the
training technique. Your reaction time and time to 15m will also be compared to a group of elite
level swimmers from your swimming club to measure the difference between adolescent and elite
level swimmers before and after the training program.
(4) How much of my time will the study take?
You will be required to attend an initial testing session and then complete the four week training
program you are allocated to. This training program will be implemented in your normal training
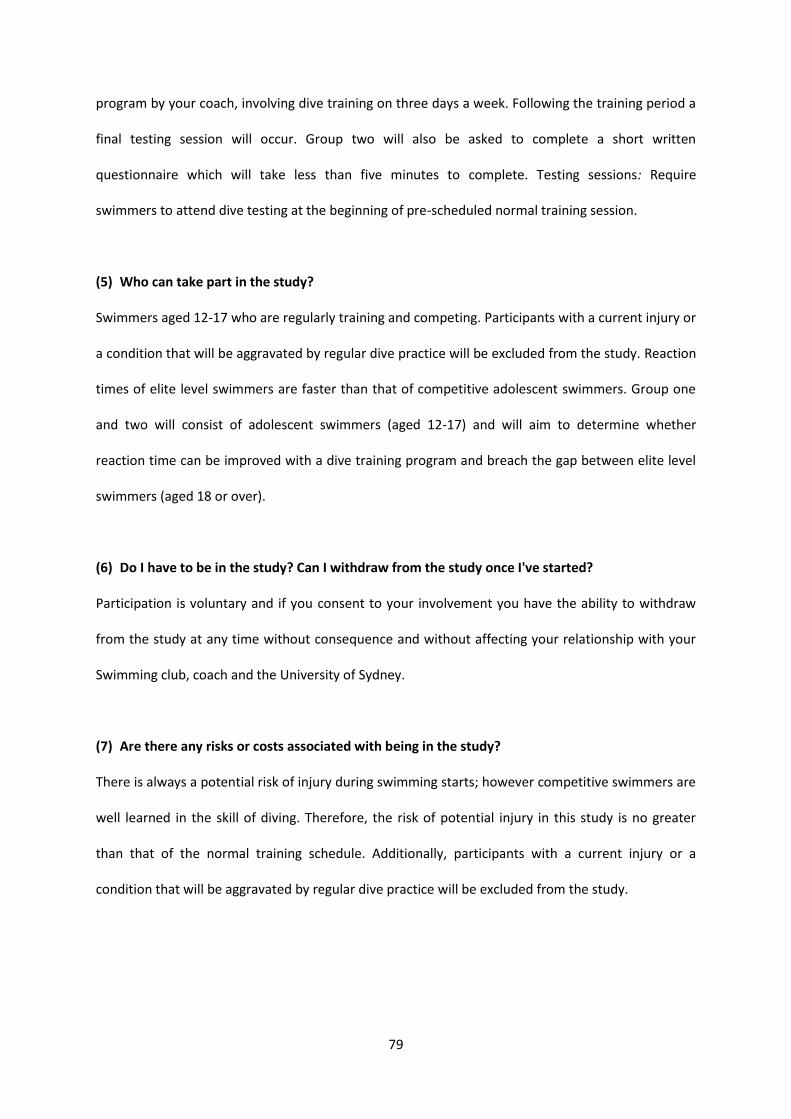
79
program by your coach, involving dive training on three days a week. Following the training period a
final testing session will occur. Group two will also be asked to complete a short written
questionnaire which will take less than five minutes to complete. Testing sessions: Require
swimmers to attend dive testing at the beginning of pre-scheduled normal training session.
(5) Who can take part in the study?
Swimmers aged 12-17 who are regularly training and competing. Participants with a current injury or
a condition that will be aggravated by regular dive practice will be excluded from the study. Reaction
times of elite level swimmers are faster than that of competitive adolescent swimmers. Group one
and two will consist of adolescent swimmers (aged 12-17) and will aim to determine whether
reaction time can be improved with a dive training program and breach the gap between elite level
swimmers (aged 18 or over).
(6) Do I have to be in the study? Can I withdraw from the study once I've started?
Participation is voluntary and if you consent to your involvement you have the ability to withdraw
from the study at any time without consequence and without affecting your relationship with your
Swimming club, coach and the University of Sydney.
(7) Are there any risks or costs associated with being in the study?
There is always a potential risk of injury during swimming starts; however competitive swimmers are
well learned in the skill of diving. Therefore, the risk of potential injury in this study is no greater
than that of the normal training schedule. Additionally, participants with a current injury or a
condition that will be aggravated by regular dive practice will be excluded from the study.

80
(8) Are there any benefits associated with being in the study?
Competition specific dive training and regular dive training may potentially improve reaction time
and time to 15m. This could result in the implementation of a dive training program within your
regular training schedule that will aim to improve swimming performance.
(9) What will happen to information about me that is collected during the study?
By providing your consent, you are agreeing to us collecting personal information about you for the
purposes of this research study. Your information will only be used for the purposes outlined in this
Participant Information Statement, unless you consent otherwise. Information will be stored
securely and your identity/information will be kept strictly confidential, except as required by law.
Study findings may be published, but you will not be individually identifiable in these publications.
We will keep the information we collect for this study, and we may use it in future projects. By
providing your consent you are allowing us to use your information in future projects. We don’t
know at this stage what these other projects will involve. We will seek ethical approval before using
the information in these future projects. With your consent your coach/es will have access to your
personal results (reaction time and time to 15m)
(10) Can I tell other people about the study?
Yes, you are welcome to tell other people about the study.
(11) What if I would like further information about the study?
When you have read this information, Christopher Papic will be available to discuss it with you
further and answer any questions you may have. If you would like to know more at any stage during
the study, please feel free to contact Christopher Papic (T: 0421 519 172, E:
81
(12) Will I be told the results of the study?
You have a right to receive feedback about the overall results of this study. You can tell us that you
wish to receive feedback by ticking the relevant box on the consent form. This feedback will be in
the form of a written summary letter. You will receive this feedback after the study is finished.
(13) What if I have a complaint or any concerns about the study?
Research involving humans in Australia is reviewed by an independent group of people called a
Human Research Ethics Committee (HREC). The ethical aspects of this study have been approved by
the HREC of the University of Sydney [project number: 2015/518]. As part of this process, we have
agreed to carry out the study according to the National Statement on Ethical Conduct in Human
Research (2007). This statement has been developed to protect people who agree to take part in
research studies. If you are concerned about the way this study is being conducted or you wish to
make a complaint to someone independent from the study, please contact the university using the
details outlined below. Please quote the study title and protocol number.
The Manager, Ethics Administration, University of Sydney:
Telephone: +61 2 8627 8176
Email: [email protected]
Fax: +61 2 8627 8177 (Facsimile)
This information sheet should be shown to your parent or guardian and is for you to keep

82
Participant information sheet (elite level swimmer):
The effect of competition specific auditory stimulus training on swimming start reaction time
PARTICIPANT INFORMATION STATEMENT
(1) What is this study about?
The University of Sydney invites you to take part in a study that will involve the recreation of a
competition specific environment in the regular training setting. Regular dive practice under these
conditions will be performed to investigate whether reaction time can be improved, with the
ultimate goal of improving overall swimming performance.
(2) Who is running the study?
The study is being conducted by Christopher Papic and Professor Ross Sanders at the University of
Sydney.
(3) What will the study involve for me?
If you consent to your involvement in the study, you will be placed in group three (elite level). This
will involve a single swimming start testing session, will no change to your normal training regime.
Discipline of Exercise and Sport Science
Faculty of Health Sciences
ABN 15 211 513 464
Professor Ross Sanders
Room C43K
K Block, Cumberland Campus
The University of Sydney
NSW 2006 AUSTRALIA
Telephone: +61 2 9351 9067
Facsimile: +61 2 9351 9204
Email: [email protected] Web: http://www.sydney.edu.au/

83
Three ‘race pace’ dives (sprint to 15m) will be performed by each participant after a regular
competition warm-up. Reaction time will be analysed using a plastic mat with an internal wiring,
which will be attached to the surface of the block. The device will be low-voltage battery operated,
with no mains electricity connection and no safety hazard. This mat will measure force being applied
through the starting block. This device will allow the research team to analyse the time between the
starting buzzer and the first activation of the muscles (reaction time), as well as the total time spent
on the block. These values will then be compared to two groups of adolescent swimmers following
the four week training period they will undertake. Additionally, a high speed camera will also be
setup at the 15m mark to measure swimming time to 15m (note: these recordings will only be
accessible by the research team and will only be used to determine time to 15m).
(4) How much of my time will the study take?
You will be required to attend a single dive testing session at an allocated swimming centre at a pre-
scheduled time (specific to each swimmer).
(5) Who can take part in the study?
Swimmers aged 18 or over at an ‘open national level’. Participants with a current injury or a
condition that will be aggravated by regular dive practice will be excluded from the study. Reaction
times of elite level swimmers are faster than that of competitive adolescent swimmers. Groups one
and two will consist of adolescent swimmers (aged 13-17) and will aim to determine whether
reaction time can be improved with a dive training program and breach the gap between elite level
swimmers (aged 18 or over).
84
(6) Do I have to be in the study? Can I withdraw from the study once I've started?
Participation is voluntary and if you consent to your involvement you have the ability to withdraw
from the study at any time without consequence and without affecting your relationship with your
Swimming club, coach and the University of Sydney.
(7) Are there any risks or costs associated with being in the study?
There is always a potential risk of injury during swimming starts; however competitive swimmers are
well learned in the skill of diving. Therefore, the risk of potential injury in this study is no greater
than that of the normal training schedule. Additionally, participants with a current injury or a
condition that will be aggravated by regular dive practice will be excluded from the study.
(8) Are there any benefits associated with being in the study?
Competition specific dive training and regular dive training may potentially improve reaction time
and time to 15m. This could result in the implementation of a dive training program within your
regular training schedule that will aim to improve swimming performance.
(9) What will happen to information about me that is collected during the study?
By providing your consent, you are agreeing to us collecting personal information about you for the
purposes of this research study. Your information will only be used for the purposes outlined in this
Participant Information Statement, unless you consent otherwise. Information will be stored
securely and your identity/information will be kept strictly confidential, except as required by law.
Study findings may be published, but you will not be individually identifiable in these publications.
We will keep the information we collect for this study, and we may use it in future projects. By
providing your consent you are allowing us to use your information in future projects. We don’t
know at this stage what these other projects will involve. We will seek ethical approval before using
85
the information in these future projects. With your consent your coach/es will have access to your
personal results (reaction time and time to 15m)
(10) Can I tell other people about the study?
Yes, you are welcome to tell other people about the study.
(11) What if I would like further information about the study?
When you have read this information, Christopher Papic will be available to discuss it with you
further and answer any questions you may have. If you would like to know more at any stage during
the study, please feel free to contact Christopher Papic (T: 0421 519 172, E:
(12) Will I be told the results of the study?
You have a right to receive feedback about the overall results of this study. You can tell us that you
wish to receive feedback by ticking the relevant box on the consent form. This feedback will be in
the form of a written summary letter. You will receive this feedback after the study is finished.
(13) What if I have a complaint or any concerns about the study?
Research involving humans in Australia is reviewed by an independent group of people called a
Human Research Ethics Committee (HREC). The ethical aspects of this study have been approved by
the HREC of the University of Sydney [project number: 2015/518]. As part of this process, we have
agreed to carry out the study according to the National Statement on Ethical Conduct in Human
Research (2007). This statement has been developed to protect people who agree to take part in
research studies. If you are concerned about the way this study is being conducted or you wish to
make a complaint to someone independent from the study, please contact the university using the
details outlined below. Please quote the study title and protocol number.

86
The Manager, Ethics Administration, University of Sydney:
Telephone: +61 2 8627 8176
Email: [email protected]
Fax: +61 2 8627 8177 (Facsimile)
This information sheet is for you to keep
87
Consent form (participant):
The effect of competition specific auditory stimulus training on swimming start reaction
time
PARTICIPANT CONSENT FORM
I, ................................................................................... [PRINT NAME], agree to take part in this
research study.
In giving my consent I state that:
I understand the purpose of the study, what I will be asked to do, and any risks/benefits
involved.
I have read the Participant Information Statement and have been able to discuss my
involvement in the study with the researchers if I wished to do so.
The researchers have answered any questions that I had about the study and I am happy
with the answers.
I understand that being in this study is completely voluntary and I do not have to take part.
My decision whether to be in the study will not affect my relationship with the researchers,
anyone else at the University of Sydney or with my swimming club, now or in the future.
I understand that I can withdraw from the study at any time.
Discipline of Exercise and Sport Science
Faculty of Health Sciences
ABN 15 211 513 464
Professor Ross Sanders
Room C43K
K Block, Cumberland Campus
The University of Sydney
NSW 2006 AUSTRALIA
Telephone: +61 2 9351 9067
Facsimile: +61 2 9351 9204
Email: [email protected] Web: http://www.sydney.edu.au/
88
I understand that my questionnaire responses cannot be withdrawn once they are
submitted, as they are anonymous and therefore the researchers will not be able to tell
which one is mine.
I understand that personal information about me that is collected over the course of this
project will be stored securely and will only be used for purposes that I have agreed to. I
understand that information about me will only be told to others with my permission, except
as required by law.
I understand that the results of this study may be published, and that publications will not
contain my name or any identifiable information about me.
I consent to:
Video-recording
YES NO
Being contacted by members of the research team about future studies
YES NO
My coach/es having access to my personal results (reaction time and time to 15m)
YES NO
Would you like to receive feedback about the overall results of this study?
YES NO
If you answered YES, your associated swimming coach will be given copies of the summary
sheets and will give them to you in person.
..............................................................................................................................................
Signature Print name Date
89
Consent form (parent/carer):
The effect of competition specific auditory stimulus training on swimming start reaction
time
PARENT/CARER CONSENT FORM
I, ................................................................................... [PRINT PARENT’S/CARER’S NAME], consent to
my child
................................................................................... [PRINT CHILD’S NAME] participating in this
research study.
In giving my consent I state that:
I understand the purpose of the study, what my child will be asked to do, and any
risks/benefits involved.
I have read the Information Statement and have been able to discuss my child’s involvement
in the study with the researchers if I wished to do so.
The researchers have answered any questions that I had about the study and I am happy
with the answers.
I understand that being in this study is completely voluntary and my child does not have to
take part. My decision whether to let them take part in the study will not affect our
relationship with the researchers or anyone else at the University of Sydney or with my
swimming club, now or in the future.
Discipline of Exercise and Sport Science
Faculty of Health Sciences
ABN 15 211 513 464
Professor Ross Sanders
Room C43K
K Block, Cumberland Campus
The University of Sydney
NSW 2006 AUSTRALIA
Telephone: +61 2 9351 9067
Facsimile: +61 2 9351 9204
Email: [email protected] Web: http://www.sydney.edu.au/
90
I understand that my child can withdraw from the study at any time.
I understand that my child’s questionnaire responses cannot be withdrawn once they are
submitted, as they are anonymous and therefore the researchers will not be able to tell
which one is mine.
I understand that personal information about my child that is collected over the course of
this project will be stored securely and will only be used for purposes that I have agreed to. I
understand that information about my child will only be told to others with my permission,
except as required by law.
I understand that the results of this study may be published, and that publications will not
contain my child’s name or any identifiable information about my child.
I consent to:
Being contacted by members of the research team about future studies involving my
child
YES NO
Video-recording of my child
YES NO
My child’s coach/es having access to their personal results (reaction time and time to
15m)
YES NO
Would you like to receive feedback about the overall results of this study?
YES NO
If you answered YES, your associated swimming coach will be given copies of the summary
sheets and will give them to you in person.
..............................................................................................................................................
Signature Print name Date
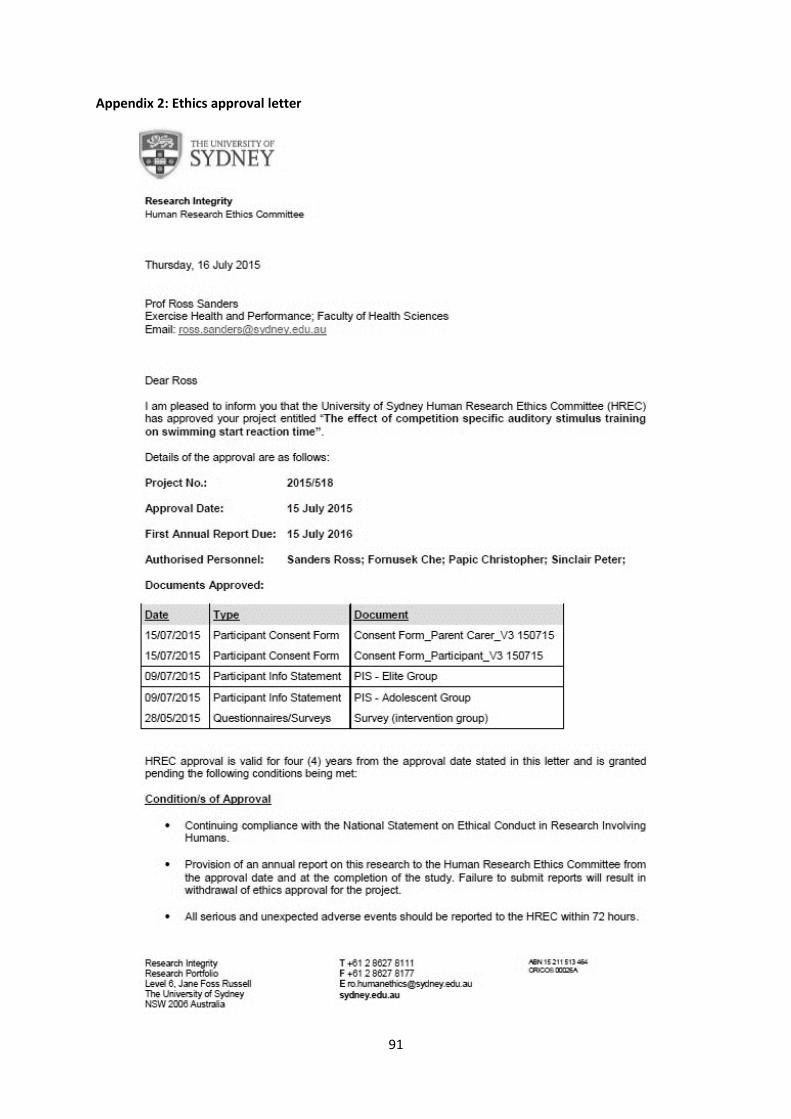
91
Appendix 2: Ethics approval letter

92

93
Appendix 3: Swimming start data collection
Pre- and post-intervention dive testing: Reaction Time results
Participant Pre-intervention Reaction Time (s) Post-intervention Reaction time (s)
Dive 1 Dive 2 Dive 3 Dive 1 Dive 2 Dive 3
C1P1 0.142 0.156 0.139 0.17 0.156 0.17
C1P2 0.141 0.118 0.099* 0.089* 0.027* 0.128
C1P3 0.052* 0.148 0.077* 0.169 0.165 0.160
C1P4 0.120 0.129 0.143 ** 0.155 0.132
C1P5 0.142 0.147 ** 0.157 0.137 0.14
C2P1 0.050* 0.125 0.138 0.099* 0.115 0.104
C2P2 0.155 0.168 0.137 0.145 0.112 0.154
C2P3 0.121 0.119 0.149 0.109 0.129 0.125
C2P4 0.089* 0.122 0.108 0.103 0.121 0.122
C2P5 0.129 0.125 0.099* 0.117 0.100 0.112
C3P1 0.084* 0.100 0.127 - - -
C3P2 0.087* 0.076* 0.100 - - -
C3P3 0.044* 0.110 0.096* - - -
C3P4 0.112 0.138 0.116 - - -
C3P5 0.113 0.135 0.134 - - -
C3P6 0.169 0.145 0.158 - - -
*Dive removed from participant mean result as RT < 0.1 s
**Technical error during data collection

94
Pre- and post-intervention dive testing: Block Time results
Participant Pre-intervention Block Time (s) Post-intervention Block Time (s)
Dive 1 Dive 2 Dive 3 Dive 1 Dive 2 Dive 3
C1P1 0.786 0.771 0.814 0.781 0.807 0.839
C1P2 0.772 0.746 0.706* 0.673* 0.628* 0.706
C1P3 0.624* 0.750 0.715* 0.763 0.743 0.755
C1P4 0.809 0.797 0.926 ** 0.877 0.908
C1P5 0.747 0.707 ** 0.670 0.678 0.680
C2P1 0.742* 0.728 0.729 0.737* 0.743 0.729
C2P2 0.775 0.800 0.776 0.832 0.773 0.792
C2P3 0.726 0.731 0.725 0.695 0.697 0.676
C2P4 0.736* 0.715 0.736 0.723 0.738 0.747
C2P5 0.820 0.866 0.852* 0.776 0.779 0.811
C3P1 0.725* 0.714 0.739 - - -
C3P2 0.736* 0.74* 0.734 - - -
C3P3 0.723* 0.737 0.735* - - -
C3P4 0.643 0.667 0.681 - - -
C3P5 0.670 0.652 0.643 - - -
C3P6 0.686 0.697 0.685 - - -
*Dive removed from participant mean result as RT < 0.1 s
**Technical error during data collection

95
Pre- and post-intervention dive testing: ‘Time to 15m’ results
Participant Pre-intervention ‘Time to 15m’ (s) Post-intervention ‘Time to 15m’ (s)
Dive 1 Dive 2 Dive 3 Dive 1 Dive 2 Dive 3
C1P1 9.15 9.79 9.79 9.14 9.10 9.02
C1P2 7.96 7.95 7.79* 7.70* 8.20* 8.50
C1P3 ** 7.85 7.93* 8.03 8.21 7.99
C1P4 7.81 7.86 8.16 ** 8.09 8.06
C1P5 8.23 8.45 ** 8.36 8.73 8.61
C2P1 7.16* 7.21 7.18 7.19* 6.97 7.08*
C2P2 7.79 7.96 8.02 7.95 7.69 7.93
C2P3 7.06 7.41 7.43 7.44 7.38 7.34
C2P4 7.29* 7.3 7.27 ** 7.47 7.35
C2P5 ** 8.11 8.43* 8.52 8.72 8.14
C3P1 *** - - -
C3P2 ** 6.6* 6.46 - - -
C3P3 6.39* 6.43 6.58* - - -
C3P4 6.27 6.34 6.38 - - -
C3P5 6.35 6.32 6.32 - - -
C3P6 6.49 6.57 6.63 - - -
*Dive removed from participant mean result as RT < 0.1 s
**Technical error during data collection
***Participant had an upper limb injury and was unable to complete the swimming start phases
beyond the ‘on-block’ phase at race pace