the effect of collateral consequence laws on state rates
TRANSCRIPT

The author(s) shown below used Federal funds provided by the U.S. Department of Justice and prepared the following final report: Document Title: The Effect of Collateral Consequence Laws on
State Rates of Returns to Prison Author(s): Tracy Sohoni Document No.: 247569 Date Received: July 2014 Award Number: 2012-IJ-CX-0006 This report has not been published by the U.S. Department of Justice. To provide better customer service, NCJRS has made this Federally-funded grant report available electronically.
Opinions or points of view expressed are those of the author(s) and do not necessarily reflect
the official position or policies of the U.S. Department of Justice.

ABSTRACT
Title of Document: THE EFFECT OF COLLATERAL
CONSEQUENCE LAWS ON STATE RATES
OF RETURNS TO PRISON
Tracy WP Sohoni, Doctor of Philosophy, 2013
Directed By: Professor Raymond Paternoster
Department of Criminology and Criminal Justice
Formal restrictions on a person following arrest or conviction are referred to
as “collateral consequence laws” and exist in all states in the US. In recent years,
scholars, policy makers and advocacy groups have expressed concern that many of
these laws hinder reintegration, increasing the likelihood of future crime. In addition,
these laws may interfere with the ability of former offenders to meet conditions of
release following incarceration, such as maintaining stable employment and housing
or paying child support.
In this dissertation I examine the effect of states’ collateral consequence laws
in the categories of voting, access to public records, employment, public housing,
public assistance, and driver’s licenses. I examine the impact of these laws on state
rates of returns to prison, as measured by percent of prison admissions that were
people on conditional release when they entered prison, the percent of exits from
This document is a research report submitted to the U.S. Department of Justice. This report has not been published by the Department. Opinions or points of view expressed are those of the author(s)
and do not necessarily reflect the official position or policies of the U.S. Department of Justice.

parole that were considered unsuccessful due returning to incarceration; the percent
of exits from parole that were returned to incarceration for a new sentence, and the
percent of exits from parole that were returned to incarceration for a technical
violation. I also run an additional fixed effects analysis on the effect of restrictions on
Temporary Assistance for Needy Children (TANF) over a seven year period.
Ultimately, limitations in the data restrict the conclusions that can be drawn
regarding the impact of these laws. Results from the analysis are mixed, indicating
that these laws may not have a uniform impact. Surprisingly, these analyses give
some indication that collateral consequences may be related to lower rates of returns
to prison for technical violations, however future research is needed to confirm this
relationship. Possible explanations for these relationships are discussed, as are future
research possibilities that would address limitations in the data. Data from the fixed-
effects analysis does indicate preliminary support that states that imposed harsh
restrictions on TANF saw an increase in state rates of returns to prison, however the
analysis will need to be expanded to include state-level controls in order to draw any
firm conclusions.
This document is a research report submitted to the U.S. Department of Justice. This report has not been published by the Department. Opinions or points of view expressed are those of the author(s)
and do not necessarily reflect the official position or policies of the U.S. Department of Justice.

THE EFFECT OF COLLATERAL CONSEQUENCE LAWS ON STATE RATES
OF RETURNS TO PRISON
By
Tracy WP Sohoni
Dissertation submitted to the Faculty of the Graduate School of the
University of Maryland, College Park, in partial fulfillment
of the requirements for the degree of
Doctor of Philosophy
2013
Advisory Committee:
Professor Raymond Paternoster, Chair
Professor Brian Johnson
Professor Melissa Kearney
Professor Sally Simpson
Professor Charles Wellford
This document is a research report submitted to the U.S. Department of Justice. This report has not been published by the Department. Opinions or points of view expressed are those of the author(s)
and do not necessarily reflect the official position or policies of the U.S. Department of Justice.

© Copyright by
Tracy WP Sohoni
2013
This document is a research report submitted to the U.S. Department of Justice. This report has not been published by the Department. Opinions or points of view expressed are those of the author(s)
and do not necessarily reflect the official position or policies of the U.S. Department of Justice.

ii
Acknowledgements
I am grateful for the support I received from the National Institute of Justice
Dissertation Fellowship NIJ_2012-IJ-CX-0006.
When I returned to graduate school, I did not anticipate the magnitude or
significance of the social and academic relationships that I would find there. I am
grateful for the support of the faculty that have assisted me throughout this process,
my fellow graduate students that so greatly influenced my experience, and of course
my family who have always been my greatest support.
I am profoundly grateful to my advisor and chair, Ray Paternoster, who has
had a tremendous impact on my academic development. Ray helped make sure that I
never got lost in the details, and I keep his advice “When in Doubt, Write” in the
forefront of my mind when I am working. It was a great comfort to have access to
Ray’s depth and breadth of knowledge during this process, and his ability to highlight
and challenge the underlying assumptions within the field has made me a better
scholar. From Ray I have gained an appreciation for how a love of puzzles opens up a
perpetual stream of fascinating academic pursuits.
Brian Johnson has been a tremendous help since I first arrived at UM, and I
cannot thank him enough for his support. I admire the clarity with which he
approaches research and teaching. I also thank Jean McGloin, with her blend of
sensible advice and humorous commentaries, Kiminori Nakamura who was so
generous with his knowledge and help, Sally Simpson, with her clear and direct
questions and comments that brought clarity to the issue at hand, Charles Wellford,
with his pragmatic approach and challenging questions, Graham Ousey, who was
This document is a research report submitted to the U.S. Department of Justice. This report has not been published by the Department. Opinions or points of view expressed are those of the author(s)
and do not necessarily reflect the official position or policies of the U.S. Department of Justice.

iii
always willing to find the time to listen to the current challenges and offer advice, and
Brenda Uekert, who has offered support from the beginning. I am also grateful to
John Laub, I remain deeply impressed with the interest and consideration he shows
his students and I appreciate his intellectual perspective. My participation in HALT
was one of the highlights of my experience at UM, and I am grateful for the
intellectual and emotional benefits of this group.
I am so grateful that during my time at UM I was surrounded by talented and
generous graduate students that enriched my academic experience and that became
wonderful friends. While many of my fellow-graduate students have helped and
inspired me along the way, I am particularly indebted to my erudite study mates
Melissa Rorie and Amy Sariti. They made the return to graduate school a far more
enjoyable and meaningful experience than I ever could have expected, and I feel
incredibly grateful that they are part of my life.
I am incredibly fortunate to have had the benefit of a supportive family. I
thank my parents for all they have given me – they provided the foundation of
intellectual curiosity, the confidence to pursue this career, the freedom to choose my
own path, and their continual encouragement and support along the way. I am also
incredibly lucky to have a sister like the incomparable Tara Peters who inspires me
with her outlook on life and whose pragmatism provided a much needed balance in
my life during this process. She has always supported my choices with complete
loyalty and understanding.
I thank my children, Asher and Kiera. They have made the journey
worthwhile, they have given the process meaning, and they have provided much
This document is a research report submitted to the U.S. Department of Justice. This report has not been published by the Department. Opinions or points of view expressed are those of the author(s)
and do not necessarily reflect the official position or policies of the U.S. Department of Justice.
iv
needed joyful distractions from my work. Moreover they provided a strong
motivation to just finish it.
Above all others, I thank my husband for his support, academically,
emotionally, and completely. Without his full, unwavering participation in caring for
our home and children, I could never have completed this process. I feel very
fortunate that I had the added bonus of a husband that could also contribute his own
academic insights. Many of my breakthroughs in this dissertation came from an extra
book he picked up at the library or a source that he suggested. He has been a diligent
reader of drafts, a provider of second opinions, a methodological sounding board, and
has provided validation every step of the way. He has been a constant pillar of
support, and I am eternally grateful.
This document is a research report submitted to the U.S. Department of Justice. This report has not been published by the Department. Opinions or points of view expressed are those of the author(s)
and do not necessarily reflect the official position or policies of the U.S. Department of Justice.

v
Table of Contents
Table of Contents .......................................................................................................... ii
List of Tables .............................................................................................................. vii
Chapter 1: Introduction ................................................................................................. 1 Reentry and the Era of Mass Incarceration ............................................................... 4
A look at the numbers ........................................................................................... 4 Mass Incarceration and Collateral Consequences ................................................. 6 Concentrated Effects of Collateral Consequence Laws ........................................ 8
Goals and Realities of Collateral Consequence Laws ............................................ 11
Goals of Collateral Consequence Laws .............................................................. 11 Explanations for the relationship between collateral consequences and
recidivism ............................................................................................................ 13 Current Study .......................................................................................................... 17
Chapter 2: Collateral Consequence Laws in the United States ................................... 21 Overview of Collateral Consequence Laws ............................................................ 21
Characteristics of Collateral Consequence Laws ................................................ 21 Description of the laws ....................................................................................... 23
Legal Challenges and Concerns of Collateral Consequence Laws ......................... 31 History of Collateral Consequence Laws ........................................................... 31 Legal Challenges to Collateral Consequences .................................................... 32
Effect of Collateral Consequences .......................................................................... 34 Effect of Collateral Consequences on Voting ..................................................... 34 Effect of Collateral Consequences on Employment and Wages ........................ 36 Effect of Collateral Consequences on Other Outcomes ..................................... 38
Collateral Consequences and Recidivism ............................................................... 40 Recidivism .......................................................................................................... 40 Theoretical perspectives of collateral consequences and recidivism .................. 42 Research on collateral consequences and recidivism ......................................... 48
Conclusion .............................................................................................................. 49
Chapter 3: Data and Methods .................................................................................... 52 Data ......................................................................................................................... 53
Independent Variables: State Collateral Consequence Laws and Practices ...... 53
Coding of Collateral Consequence Laws ............................................................ 55 Dependent Variables: Bureau of Justice Statistics Prisoners Data and Parole
Data ..................................................................................................................... 68
Controls ............................................................................................................... 74 Analysis................................................................................................................... 77
This document is a research report submitted to the U.S. Department of Justice. This report has not been published by the Department. Opinions or points of view expressed are those of the author(s)
and do not necessarily reflect the official position or policies of the U.S. Department of Justice.

vi
Chapter 4: Findings ..................................................................................................... 80 Voting ..................................................................................................................... 88 Access to Records ................................................................................................... 90 Employment ............................................................................................................ 97 Public Housing ...................................................................................................... 103 Public Assistance .................................................................................................. 109 Driver’s Licenses .................................................................................................. 111 Cumulative Effect of Collateral Consequence Laws ............................................ 116 Fixed Effects Analysis of TANF Restrictions ...................................................... 118
Data for Fixed Effects Analysis ........................................................................ 119 Findings of Fixed Effects Analysis ................................................................... 121
Discussion of Results ............................................................................................ 122
Chapter 5: Conclusion............................................................................................... 131 Data Limitations.................................................................................................... 134 Conclusions and Future Directions ....................................................................... 138
Appendix ................................................................................................................... 142
Bibliography ............................................................................................................. 158
This document is a research report submitted to the U.S. Department of Justice. This report has not been published by the Department. Opinions or points of view expressed are those of the author(s)
and do not necessarily reflect the official position or policies of the U.S. Department of Justice.

vii
List of Tables
Table 1: Coding Dimensions for Collateral Consequence Laws ............................... 66
Table 2: Summary Statistics of Measures for Rates of Returns to Prison ................. 73
Table 3: Correlations Between Dependent Variables ................................................ 74
Table 4: Summary Statistics for Control Variables ................................................... 75
Table 5: Estimated Effects of Controls on Rates of Returns to Prison using Ordinary
Least Squares .............................................................................................................. 82
Table 6: Estimated Effects of Controls on Rates of Unsuccessful Parole Completions
using Ordinary Least Squares ..................................................................................... 84
Table 7: Estimated Effects of Voting Laws on Rates of Returns to Prison using
Ordinary Least Squares ............................................................................................... 89
Table 8: Estimated Effects of Voting Laws on Rates of Unsuccessful Parole using
Ordinary Least Squares ............................................................................................... 90
Table 9: Estimated Effects of Access to Criminal Records Laws on Rates of Returns
to Prison using Ordinary Least Squares ...................................................................... 93
Table 10: Estimated Effects of Access to Criminal Records Laws on Rates of
Unsuccessful Parole Completions using Ordinary Least Squares .............................. 94
Table 11: Estimated Effects of Employment Laws on Rates of Returns to Prison
using Ordinary Least Squares ..................................................................................... 99
Table 12: Estimated Effects of Employment Laws on Rates of Unsuccessful Parole
Completions using Ordinary Least Squares .............................................................. 100
Table 13: Estimated Effects of Housing Laws on Rates of Returns to Prison using
Ordinary Least Squares ............................................................................................. 105
Table 14: Estimated Effects of Housing Laws on Rates of Unsuccessful Parole
Completions using Ordinary Least Squares .............................................................. 106
Table 15: Estimated Effects of TANF Laws on Rates of Returns to Prison using
Ordinary Least Squares ............................................................................................. 110
Table 16: Estimated Effects of TANF Laws on Rates of Unsuccessful Parole
Completions using Ordinary Least Squares .............................................................. 111
This document is a research report submitted to the U.S. Department of Justice. This report has not been published by the Department. Opinions or points of view expressed are those of the author(s)
and do not necessarily reflect the official position or policies of the U.S. Department of Justice.

viii
Table 17: Estimated Effects of Drivers' License Laws on Rates of Returns to Prison
using Ordinary Least Squares ................................................................................... 112
Table 18: Estimated Effects of Drivers' License Laws on Rates of Unsuccessful
Parole Completions using Ordinary Least Squares .................................................. 113
Table 19: Bivariate Correlation of Collateral Consequence Laws on Rates of
Unsuccessful Parole Completions ............................................................................. 117
Table 20: Estimated Effects of Collateral Consequence Laws on Rates of
Unsuccessful Parole Completions using Ordinary Least Squares ............................ 118
Table 21: Estimated Effects of Collateral Consequence Laws on Rates of
Unsuccessful Parole Completions using Ordinary Least Squares ............................ 118
Table 22: Eligibility of drug offenders to receive public assistance ......................... 120
Table 23: Fixed Effects Regression on TANF Laws ................................................ 122
This document is a research report submitted to the U.S. Department of Justice. This report has not been published by the Department. Opinions or points of view expressed are those of the author(s)
and do not necessarily reflect the official position or policies of the U.S. Department of Justice.

1
Chapter 1: Introduction
In recent years the number of persons released from prisons in the United States
each year has swelled to its current unprecedented number of approximately 700,000
(West et al, 2010). This fact, combined with the fact that roughly two thirds of released
state prisoners are rearrested within three years of release (Langan and Levin, 2002) has
made the reentry of prisoners a matter of national concern and scholarly interest (Lynch
and Sabol, 2001; Petersilia, 2003; Travis, 2005). Returns to prison make up a sizeable
portion of the prison population. The Bureau of Justice Statistics reports that roughly a
third of prison admissions in the US in 2009 were parole violators. As this excludes the
number of offenders returning to prison that were not on, or had successfully completed,
supervised release, the percent of prison admissions that are people returning to prison
after previous periods of incarceration is expected to be significantly higher (West et al,
2010).
Released prisoners face a multitude of barriers to reentry upon release. Despite
having paid for their criminal infractions via completed prison terms, released offenders
face additional hardships including deportation, sex offender registration, civil
commitment of sex offenders, and public access to criminal records as well as restrictions
on gun ownership rights, access to social services, student loans, adoption and foster care
eligibility, employment, voting, driver’s licenses, and public housing. The extent of these
restrictions, known loosely as collateral consequence laws, varies by the state in which
the person resides. The goal of these laws varies, in some cases the law serves as an
additional punishment (e.g. welfare restrictions), in others the law is concerned with
This document is a research report submitted to the U.S. Department of Justice. This report has not been published by the Department. Opinions or points of view expressed are those of the author(s)
and do not necessarily reflect the official position or policies of the U.S. Department of Justice.

2
public safety (e.g. gun restrictions) while for others the goal is mixed, unclear or debated
(e.g. voting restrictions, employment restrictions). The effects of these laws on crime and
recidivism are undetermined; while one effect could be to deter potential offenders, many
researchers and service providers have expressed concern that a potential unintended
consequence of some of these laws is that they can prevent convicted felons from
effectively reintegrating into society, making it more likely that they will return to
criminal activities (Manza and Uggen, 2006; Petersilia, 2003; Thompson, 2008; Travis,
2005). Specifically, laws affecting employment, access to criminal records, public
housing, public assistance, driver’s licenses and voting have come under criticism for
their potential role in serving as a barrier to successful reintegration. These laws may also
interfere with an offender’s ability to meet conditions of release, such as maintaining
stable employment and housing, or paying child support, thus resulting in higher rates of
technical violations of parole. Ultimately, these laws act as a second punishment and may
further embed released offenders in a criminal lifestyle.
Returns to prison, whether for new crimes or for technical violations, are a high
cost to society; for taxpayers who pay to re-imprison offenders, for communities who
lose revenue when potentially contributing members are incarcerated, and to individuals,
families and communities due to the heavy toll of human and social capital. The hardship
these laws place on returning offenders has been well-documented (Petersilia, 2003;
Thompson, 2008; Travis, 2005). Recently, collateral consequence restrictions have come
under increased scrutiny in the government sector. The Smart on Crime Coalition (2011)
recommended “expanding and improving legal mechanisms for individuals to obtain
relief from collateral consequences” as part of their recommendations to the 112th
This document is a research report submitted to the U.S. Department of Justice. This report has not been published by the Department. Opinions or points of view expressed are those of the author(s)
and do not necessarily reflect the official position or policies of the U.S. Department of Justice.

3
Congress; and in June 2010, Marc Mauer of The Sentencing Project provided testimony
to the House Judiciary Subcommittee on Crime, Terrorism and Homeland Security
regarding the need to provide relief in the area of collateral consequences (2010).
While many scholars have suggested that collateral consequences act as a barrier
to effective reintegration, there is also the chance that collateral consequences could have
a deterrent, or a preventive effect. These consequences could serve as a deterrent to
would be first-time offenders by increasing the costs of criminal activity. Some laws
could also reduce recidivism. For instance, restricting drug offenders from public housing
could reduce their access to the criminal networks in those areas giving them less
opportunity to offend. Access to criminal records may allow employers to avoid hiring
persons that might use their job to commit further crimes. While scholars and policy
makers have speculated that certain collateral consequence laws make it more difficult
for former offenders to successfully reintegrate, the empirical evidence is limited. This
research will be the first to address this gap in the knowledge base by a state-by-state
comparison of the effects of these laws on returns to prison. Specifically, I will use two
sources of data regarding rates of return to prison by state to determine whether states
that have harsher collateral consequence laws also experience higher rates of returns to
prison controlling for a myriad of state-level controls. This analysis will also allow me to
look at the impact of particular laws on rates of returns to prison, as these laws may have
varying effects.
This document is a research report submitted to the U.S. Department of Justice. This report has not been published by the Department. Opinions or points of view expressed are those of the author(s)
and do not necessarily reflect the official position or policies of the U.S. Department of Justice.

4
Reentry and the Era of Mass Incarceration
A look at the numbers
The story as to why reentry currently holds a place of prominence in scholarly
literature is entwined with the relatively recent movement towards mass incarceration.
There are currently about 2.3 million individuals incarcerated at the local, state or federal
level (Glaze 2011), and it is expected that more than 95% of these people will be released
at some point (Hughes and Wilson, 2010). The US has surprisingly high rates of
incarceration, both when compared to incarceration rates in the US historically as well as
when compared to other industrialized nations. Incarceration rates in the US were
relatively stable at approximately 100 per 100,000 until the mid-1970’s when
incarceration rates started to climb dramatically (Blumstein and Cohen, 1973). Currently
there are 500 inmates under custody of federal or state prisons for every 100,000 persons
in the US (Guerino et al 2012) although when local jails are included the number rises
even higher to 732 (Glaze 2011). This represents a tremendous increase over levels of
incarceration seen prior to the 1970’s and appears to be largely due to changes in
sentencing policy (Blumstein and Beck, 1999).
The 1980’s witnessed a period of the “tough on crime” movement, including
increased use of determinate sentencing, removal of discretionary parole (16 states
abolished discretionary parole), increased sentence length and increases in time served.
During this time, all states passed some form of mandatory sentences, roughly half
instituted some form of habitual offender or “three strikes” laws, and many passed truth-
in-sentencing laws (motivated in part by the restriction of certain federal funds to states in
which prisoners served a minimum of 85% of their sentence) (Tonry 1996). The
This document is a research report submitted to the U.S. Department of Justice. This report has not been published by the Department. Opinions or points of view expressed are those of the author(s)
and do not necessarily reflect the official position or policies of the U.S. Department of Justice.

5
corresponding War on Drugs also saw an increase in the number and harshness of laws
and punishments targeting drug offenses (Mauer, 2006; Tonry, 1995; Tonry ,1996).
These policies had a strong impact on incarceration. Blumstein and Beck (1999)
argue that almost the entire increase in state incarceration up until 1996 can be attributed
to changes in criminal justice processing. They document that 33% of the increase is due
to drug cases, and point out that the incarceration rate for drug offenders in 1995 was
close to the same level as the incarceration rate for all offenders prior to 1973. Currently,
roughly half of federal prisoners are drug offenders and approximately twenty percent of
state prisoners are drug offenders (West et al, 2010). Blumstein and Beck further argue
that of the increase in incarceration that is not attributable to drug crime, 58% of the
increase is due to increased sentence length and 42% is due to increased commitments
(Blumstein and Beck, 1999).
Incarceration is not the only place in which supervision of offenders has
increased. Probation and parole have also seen large increases in numbers with 800,000
people currently on parole and an additional 4 million individuals on probation (Glaze
2011). This has culminated in a situation in which 1 in 33 Americans is currently under
some form of correctional supervision (Glaze 2011).1 It is no wonder then, that reentry
has become such an important issue. Ninety five percent of people currently serving
prison sentences will eventually be released, and 80 percent will be released to parole
supervision (Hughes and Wilson, 2010). Unfortunately a large proportion of people
leaving prison will eventually return. In their study of recidivism, Langan and Levin
(2002) found that 30% of released prisoners were re-arrested within one year, and two-
1 This number includes state and federal prisons, local jails, probation and parole.
This document is a research report submitted to the U.S. Department of Justice. This report has not been published by the Department. Opinions or points of view expressed are those of the author(s)
and do not necessarily reflect the official position or policies of the U.S. Department of Justice.

6
thirds were re-arrested within three years. Furthermore, one-quarter of all released
prisoners were returned to prison within three years (Langan and Levin, 2002). While
parole violations accounted for 17 % of state prison admissions in 1980 (Travis and
Lawrence, 2002), they now account for 35% of state prison admissions (Guerino et al
2011). Put another way, while in 1980 state prisons admitted approximately 27,000
parole violators (Travis and Lawrence, 2002), in 2010 they admitted over 200,000, more
than a seven-fold increase (Guerino et al 2011), and roughly the same number of total
prison admissions in 1980 (Travis and Lawrence, 2002).
Mass Incarceration and Collateral Consequences
A clear implication of this period of mass incarceration is that a greater number of
people are subject to collateral consequence laws than ever before. In 2001, over 5.6
million people had been incarcerated in state or federal prison (Bonczar, 2003). Based on
these numbers, the Bureau of Justice Statistics (BJS) estimates that 1 in 9 men, and 1 in
56 women, will serve time in federal or state prison in their lifetime (Bonczar, 2003).
However we can anticipate that far more people than this are likely to be affected by
collateral consequence laws. Many collateral consequences do not require that a person
serve time in prison or jail, but can be activated for an arrest (such as restrictions on
public housing) or by a felony conviction that resulted in a probation only sentence (such
as many voting restrictions). Uggen et al (2012) estimate that over 5.85 million people (1
out of 40 adults) were disenfranchised from voting as of 2010.2 Employment restrictions
2 This number takes into account the laws of specific states in regards to voting disenfranchisement. Thus,
this number is much lower than the number of people with a felony conviction as some states allow people
to vote once they have completed all supervision, and others allow voting at various stages of supervision.
These laws will be discussed in greater depth in the next chapter.
This document is a research report submitted to the U.S. Department of Justice. This report has not been published by the Department. Opinions or points of view expressed are those of the author(s)
and do not necessarily reflect the official position or policies of the U.S. Department of Justice.

7
can also rely on arrests without a conviction and several states provide arrest records in
their criminal background records. BJS estimates that roughly 98 million subjects have
records in state criminal history files, and that over 90% of these are accessible through
automated file searches (BJS, 2011). While this is an overestimate of the number of
individuals with criminal records publically accessible as some of these represent
duplicates of people that have records in more than one state, and not all of these records
are available to the public, it gives some indication of the potential reach of these laws.
Furthermore, it indicates the large increase in availability of records compared to 1993
when there were less than 48 million records available, of which less than 80% were
automated.
Not only are more people subject to collateral consequence laws due to higher
rates of involvement with the criminal justice system, but the number of collateral
consequence laws that people are subject to have also increased in the last several
decades. For instance, a slew of federal legislation in the 1990’s restricted federal
funding to states that did not either enact, or formerly opt out of, particular collateral
consequence restrictions. Specifically, a 1992 law reduced certain highway funds to
states that did not restrict driver’s licenses of individuals convicted of drug offenses, a
1996 law passed a lifetime ban on food stamps or cash assistance for anyone convicted of
a drug-related felony, a 1997 law barred people with certain convictions from adopting or
fostering children, and a 1998 law made students with drug convictions ineligible for
grants, loans or work assistance. Finally, a series of laws formed the basis of the “one
strike and you’re out” public housing policy in which drug-related criminal activity can
be a basis for eviction from public housing for the offender along with anyone with
This document is a research report submitted to the U.S. Department of Justice. This report has not been published by the Department. Opinions or points of view expressed are those of the author(s)
and do not necessarily reflect the official position or policies of the U.S. Department of Justice.

8
whom s/he resides. Thus, as a result of the passing of these laws, along with the
aforementioned period during which more people than ever before have come under the
purview of the criminal justice system, we have an unprecedented number of people re-
entering society under the yoke of a high number of restrictions relating to their reentry.
Concentrated Effects of Collateral Consequence Laws
The burden of mass incarceration and subsequent collateral consequence laws has
not been shared equally among all groups of people. Instead, certain groups have been
more vulnerable to being impacted by incarceration policies and by collateral
consequence laws. Specifically, these policies have affected core communities in which
offenders disproportionately live and return, and have also disproportionately affected
members of minority groups. The laws may also have a more pronounced effect on
certain populations. For instance, these laws may have a differential effect on groups
such as women who are more likely to have custody of minor children.
While BJS estimates that 1 in 9 men in the US will serve time under custody in
state or federal prisons, the number is 1 in 3 for black males and only 1 in 17 for white
males (Bonczar, 2003). Similarly, while 1 in 56 women are expected to serve time under
custody in state or federal prison, the number is 1 in 18 for black women, and is only 1 in
117 for white women. In fact, a black male is more likely to have been incarcerated in
prison by age 35 than to have obtained a bachelor’s degree (Pettit and Western, 2004).
This has a significant impact on families as nearly seven percent of black minor children
have a parent in prison compared to barely one percent for white minor children (Glaze
and Maruschak 2008).
This document is a research report submitted to the U.S. Department of Justice. This report has not been published by the Department. Opinions or points of view expressed are those of the author(s)
and do not necessarily reflect the official position or policies of the U.S. Department of Justice.

9
Increasingly, returning prisoners are concentrated in core counties, that is,
counties that contain the central city of a metropolitan area. While in 1984 roughly half
of returning prisoners were concentrated in core counties, by 1996 it had risen to roughly
two-thirds of returning prisoners (Lynch and Sabol, 2001). In addition, the number of
returning prisoners increased from 220,000 to 500,000 during this time (Lynch and
Sabol, 2001). Furthermore, within these counties returning prisoners largely return to a
limited number of communities, and not surprisingly these are communities of
concentrated disadvantage (La Vigne et al 2003a, La Vigne et al 2003b, La Vigne et al
2003c). This concentration of incarcerated individuals and reentering offenders has wide
reaching effects on the families and marriages, voting and political participation,
economic viability, community stigma, perceived legitimacy of the criminal justice
system, social controls, and subsequently, crime of those communities (Travis, 2005).
Recent research indicates that the concentrated return of offenders to core communities is
a disadvantage to both the community that experiences higher rates of subsequent crime
(Hipp and Yates, 2009, Clear et al 2003) as well as to the returning individual, as
neighborhood context, such as socioeconomic status, residential stability, and the
numbers of voluntary organizations have an effect on recidivism and crime rates (Kubrin
and Stewart 2006, Hipp and Yates 2009, Morenoff and Harding 2011). Neighborhoods
with a concentration of returning offenders are neighborhoods that suffer from negative
social capital further reducing the chances of returning offenders being able to
successfully abstain from criminal activity (Wacquant 2000, Hagan and Coleman 2001).
Rose and Clear (1998) have argued that the coercive mobility of removing
individuals from the community through incarceration results in further destabilizing the
This document is a research report submitted to the U.S. Department of Justice. This report has not been published by the Department. Opinions or points of view expressed are those of the author(s)
and do not necessarily reflect the official position or policies of the U.S. Department of Justice.

10
community. Clear et al (2003) find support that as prison admissions increase, they reach
a “tipping point” after which incarceration becomes associated with increases in crime.
Similarly, Fagan et al (2003) find that high incarceration rates beget further higher
incarceration rates using data on New York neighborhood rates of incarceration over a 12
year period. They argue that high incarceration becomes "an enduring internal feature of
the neighborhood fabric.”
Furthermore, minorities and women may be disproportionately impacted by
collateral consequence laws due to their disproportionate imprisonment for drug crimes.
Federal legislation in the 1990’s encouraged states to enact restrictions against drug
offenders, blocking access to public housing, Temporary Assistance for Needy Families
(TANF), Supplemental Nutrition Assistance Program (SNAP), as well as revoking
driver’s licenses following the conviction of a felony drug offense. Of inmates serving a
year or more under state jurisdiction in 2009, 26% of females were serving time for a
drug offense, versus 17% of men (Guerino et al 2012). Similarly, 21% of blacks and
20% of Hispanics were serving time for a drug offense, compared to 14% of whites
(Guerino et al 2012). Thus women and minorities have a higher likelihood of being
affected by collateral consequence laws targeted specifically at drug offenders.
Although women have lower rates of involvement with the criminal justice
system than men, arguably the impact of incarceration and subsequent collateral
consequences may be greater. Women are more likely than men to live in poverty, with
poverty rates the highest among minority women, and as such women are more likely to
depend on government assistance programs such as TANF, SNAP and public housing.
Women who are incarcerated are more likely to have children than incarcerated men
This document is a research report submitted to the U.S. Department of Justice. This report has not been published by the Department. Opinions or points of view expressed are those of the author(s)
and do not necessarily reflect the official position or policies of the U.S. Department of Justice.

11
(62% versus 51% respectively) (Glaze and Maruschak 2008). Incarcerated women are
also more likely to have been living with their children prior to incarceration, and to have
been the primary caregiver for their child (Glaze and Maruschak 2008). Incarcerated
mothers are also more likely than incarcerated fathers to report having received
government assistance, such as welfare, prior to incarceration. Collateral consequences
may have a more serious impact on women because many of the laws, such as restrictions
on the ability to live in public housing, or to be eligible for TANF, restrictions on
employment or on driver’s licenses, may impair a woman’s ability to reunite with or take
care of her children. Ineligibility for public housing may make it more difficult for a
woman to regain custody of her children if she cannot find other housing
accommodations. While restrictions on TANF and SNAP are only applied to the person
with a felony drug conviction, clearly they will affect the whole family as the family’s
benefits will not include the mother. The inability of women to reunite with their children
may have repercussions not only for the mother and children, but at the community level
as well as the community sees a decline in the number of intact families.
Goals and Realities of Collateral Consequence Laws
Goals of Collateral Consequence Laws
The goals of collateral consequences laws vary based upon the different laws, and
are at times unclear. For instance, restrictions on public housing for drug offenders
appears to have been motivated as an attempt to combat the rampant drug markets found
in public housing, and these laws could serve a preventive function by disrupting drug
networks in public housing. Restrictions on TANF assistance appear to have been
This document is a research report submitted to the U.S. Department of Justice. This report has not been published by the Department. Opinions or points of view expressed are those of the author(s)
and do not necessarily reflect the official position or policies of the U.S. Department of Justice.

12
motivated primarily to serve a retributive function of further punishing offenders and of
denouncing them as undeserving of public assistance. The legislator introducing the
amendment to restrict drug offenders from receiving TANF said “if we are serious about
our drug laws, we ought not to give people welfare benefits who are violating the nation’s
drug laws” (Rubinstein and Mukamal, 2002). Restrictions on voting have been justified
as serving a denunciatory role while also preserving the “purity” of the ballot box.
Restrictions on employment could serve to prevent people from being hired for positions
in which they could misuse their position to commit further crimes, and could also serve
as a deterrent to someone considering committing a criminal act. Potentially, these laws
could also increase the cost of crime to potential offenders as they pose an additional
punishment to criminal behavior. However, the ability of these laws to fulfill these goals
remains unsubstantiated. Given that collateral consequences are not broadly publicized,
and are not even explicitly stated as a part of one’s sentence in court, it is unlikely that
they serve a denunciatory effect (Demleitner, 199; Pinard, 2006). The low visibility of
collateral consequences laws also makes it unlikely that they will serve as an effective
deterrent (Demleitner 1999). Furthermore, the indiscriminate imposition of these
restrictions, specifically that many collateral consequence restrictions are imposed on
broad categories of offending (e.g. employment restrictions on all felons) potentially
reduces any preventive role they might achieve, compared to if they were tailored for the
particular offender (Demleitner, 1999; Pinard, 2010).
Not only is there uncertainty surrounding the effectiveness of collateral
consequences in achieving penal goals, or even of what the goals of these laws are, but
there is also a rising concern that collateral consequences may have an unintended effect
This document is a research report submitted to the U.S. Department of Justice. This report has not been published by the Department. Opinions or points of view expressed are those of the author(s)
and do not necessarily reflect the official position or policies of the U.S. Department of Justice.

13
of jeopardizing public safety by making it more difficult for former offenders to “go
straight”.
Explanations for the relationship between collateral consequences and recidivism
There are a number of mechanisms by which we would expect collateral
consequence laws to be related to higher rates of recidivism. Chief among the
explanations by previous scholars are the effects of collateral consequence laws on the
ability of offenders to support themselves financially, the barriers these laws place in the
ability of offenders to form or rekindle pro-social bonds, and finally the effect these laws
may have in fostering feelings of exclusion.
First, given that collateral consequences make it more difficult for offenders to
find steady employment, directly in restricting access to certain occupations and
occupational licenses and informally through stigmatization of the criminal record and
difficulty in accessing transportation due to restrictions on driver’s licenses, ex-offenders
have less to lose if they engage in criminal activity and risk returning to prison. Given
that parolees are documented to cluster in core counties, this can negatively impact local
labor markets in those counties. Collateral consequence laws that restrict employment,
increase access to records, or restrict driver’s licenses which parolees may need in order
to find or maintain employment, may negatively impact the ability of parolees to reenter
the labor market leading to economic impacts for the community in which they live. This
further reduces the employment networks available within the community.
Collateral consequences also appear to hinder relationships between returning ex-
offenders and their family members. Restrictions on access to public housing for many
offenders mean that families may risk losing access to housing if they allow an ex-
This document is a research report submitted to the U.S. Department of Justice. This report has not been published by the Department. Opinions or points of view expressed are those of the author(s)
and do not necessarily reflect the official position or policies of the U.S. Department of Justice.

14
offender to live with them in public housing. Yet living away from family members
removes ex-offenders from families and loved ones that could provide a network of
informal social control, as well as of social support for refraining from criminal or drug-
related activities (Berg and Huebner, 2011).3 There is evidence that men who maintain
strong family ties during imprisonment, and those who assume husband or parenting
roles post-release, are more likely to have positive outcomes post-release (Mears et al
2011, Shapiro 2001). Restrictions to employment can also create strains on family
relationships when the returning offender is unable to provide income to the family, or
meet child support obligations. Without access to public housing, TANF, or SNAP, and
with increased barriers to securing employment, returning parolees may be unable to
secure, or retain, custody of minor children. By preventing parolees from reuniting with
family, or straining relationships with family members, collateral consequence laws may
negatively impact communities’ ability to monitor their members. These laws may make
social reintegration into the community through family ties more difficulty, thus
undermining social cohesion and trust within those communities.
Finally, collateral consequences serve as a formal reminder that having served
one’s time is not enough for full reentry into society, and that having a criminal record
will permanently mark the ex-offender as an outsider. This could cause ex-offenders to
question the legitimacy of a process that hinders them from successfully reintegrating.
Manza and Uggen interviewed ex-offenders regarding their feelings about not being able
3 It could be argued that removing ex-offenders from public housing may also remove them from their
previous networks, particularly the criminal or drug networks, thus making it more likely that the ex-
offender refrains from re-entering criminal behavior. Unfortunately, given the bleak housing prospects
these ex-offenders face, many of them will end up in living circumstances with ample drug and crime
networks.
This document is a research report submitted to the U.S. Department of Justice. This report has not been published by the Department. Opinions or points of view expressed are those of the author(s)
and do not necessarily reflect the official position or policies of the U.S. Department of Justice.

15
to vote, and noted the extent to which ex-offenders spoke about how the inability to vote
contributed to feelings of rejection by the community and resulting feelings that they
don’t “owe” the community anything (including conformity to the law) since they are not
part of the community. They write that “like other citizens, many felons expressed both a
desire for the rights of citizenship and a willingness to involve themselves in civic life.
They clearly felt the sting of disenfranchisement and other collateral consequences of
their convictions, which marked them outsiders” (Manza and Uggen, 2006: p 163).
Manza and Uggen posit that access to voting can serve to foster a sense of civic duty and
membership. They argue that people involved in voting have a sense of membership that
results in a sense of responsibility toward the community. Referencing the works of
Alexis de Tocqueville and John Stuart Mill and pulling from theories of expressive
voting, they argue that civic engagement, such as voting, can actually assist in a person’s
identity transformation and that in this way “democracy fosters citizenship” (p 128).
They argue that “to the extent that felons begin to vote and participate as citizens in their
communities, there is some evidence that they will bring their behavior into line with
their expectations of the citizen role, avoiding further contact with the criminal justice
system” (p 163).
Manza and Uggen are not the first to note the potential for US laws
disenfranchising to hinder the reintegration of former offenders. The President's
Commission on Law Enforcement and the Administration of Justice wrote in their 1967
Task Force Report, “(T)o be deprived of the right to representation in a democratic
society is an important symbol. Moreover, rehabilitation might be furthered by
encouraging convicted persons to participate in society by exercising the vote.” A special
This document is a research report submitted to the U.S. Department of Justice. This report has not been published by the Department. Opinions or points of view expressed are those of the author(s)
and do not necessarily reflect the official position or policies of the U.S. Department of Justice.

16
project report of the Vanderbilt Law Review echoed this sentiment in 1970 by noting that
“the offender’s inability to vote, serve as a juror, or hold public office prevents him from
appreciating the society to which he returns…This feeling of rejection both reinforces the
pessimistic view of societal authority that convicts often form in prison and heightens
their lack of faith in society. This sense of rejection may produce feelings of
estrangement from the institutions that foster the development of law-abiding conduct.”
(Grant et al 1970). A 1973 report by the National Advisory Commission on Criminal
Justice Standards and Goals echoed this sentiment when they stated that “Loss of
citizenship rights—(including) the right to vote . . .inhibits reformative efforts. If
correction is to reintegrate an offender into free society, the offender must retain all
attributes of citizenship. In addition, his respect for law and the legal system may well
depend, in some measure, on his ability to participate in that system.” (National Advisory
Commission on Criminal Justice Standards and Goals 1973, 593). These feelings of
estrangement from the justice system by the use of laws which continue to punish former
offenders long after their sentence has been served, can affect the attitudes of entire
communities toward the justice system. Neighborhoods with high numbers of former
offenders that face collateral consequences may be more likely to view the criminal
justice system with distrust.
Not only do collateral consequences lower the economic and social disincentives
to crime, and increase feelings of social exclusion, but these consequences likely have an
ongoing effect. Problems gaining employment due to a criminal record contributes to
ongoing problems gaining steady employment as it weakens a person’s employment
record, making them less attractive to future employers. Difficulties fostering a
This document is a research report submitted to the U.S. Department of Justice. This report has not been published by the Department. Opinions or points of view expressed are those of the author(s)
and do not necessarily reflect the official position or policies of the U.S. Department of Justice.

17
relationship with family members post-release contribute to strained relationships that
continue into the future. And feelings of exclusion can fester when background checks,
and ongoing restrictions on employment and voting, serve as a recurring reminder of this
exclusion.
Current Study
My dissertation will be the first empirical analysis of the effect of the harshness of
a state’s collateral consequence laws on rates of returns to prison, and will address three
hypotheses. First, that states that have a greater number of, and stricter, collateral
consequence laws will have higher rates of returns to prison due to new crimes. Second,
that states that have a greater number of, and stricter, collateral consequence laws will
have higher rates of returns to prison due to technical violations of parole. Third, that the
types of collateral consequence laws will vary in the effects that they have on rates of
returns to prison. Specifically, laws with a broader reach that affect day to day living
(e.g., restrictions of all felons on employment) will have a greater effect than those that
are limited in terms of who they affect (e.g., public housing restrictions for drug
offenders only) or that have less impact on day to day living (e.g., voting restrictions).
To address this question I have compiled a dataset of characteristics of state
collateral consequence laws in the areas of voting, access to records, employment, public
housing, public assistance, and driver’s licenses for the year 2009. These are the laws
which have garnered the most criticism for impairing the reintegration attempts of former
offenders, affect a large amount of offenders, and which lent themselves for comparison
between states. I used the Legal Action Center’s (LAC) review of laws in their
“Roadblocks to Reentry” report as the foundation for this dataset, and referred to state
This document is a research report submitted to the U.S. Department of Justice. This report has not been published by the Department. Opinions or points of view expressed are those of the author(s)
and do not necessarily reflect the official position or policies of the U.S. Department of Justice.

18
legal codes, and other sources of information regarding these laws, as necessary to
supplement this information. While this data is by no means comprehensive, as these
laws are too numerous to capture every aspect, and as some characteristics of these laws
defy easy comparison between states, this dataset represents the best available state-level
data at this time.4
In order to measure state rates of returns to prison, I rely on data compiled by the
Bureau of Justice Statistics (BJS) on rates of returns to prison in 2010, specifically the
percent of prison commitments which were due to violations of conditional release (from
the National Prisoner Statistics (NPS) survey) and the percent of persons on parole in
each state that were returned to incarceration due to new crimes or technical violations of
parole (from the Parole Survey). Each of these surveys is conducted annually and
provides aggregate data for all 50 states. They are derived from different sources,
specifically correctional agencies and parole supervising agencies, and cover slightly
different populations with somewhat different definitions. Hence they provide the
opportunity for two views of the same phenomena, providing greater confidence in the
measurement of the trends in reimprisonment that are the object of interest in the current
analysis.
In order to ensure proper specification of the model, I have paired the data on
state rates of returns to prison with state-level criminal justice controls such as percent of
released prisoners on conditional release, imprisonment rates, racial composition of
4 Although there have been attempts to categorize these laws, most notably the recent ABA website
devoted to documenting the specific laws of each state, the characteristics of these laws do not lend
themselves to easy comparison between states. The laws that are used here represent the laws that are best
suited to comparison between states.
This document is a research report submitted to the U.S. Department of Justice. This report has not been published by the Department. Opinions or points of view expressed are those of the author(s)
and do not necessarily reflect the official position or policies of the U.S. Department of Justice.

19
parolees, and crime types of parolees. I have also included state-level characteristics as
controls including rates of single-parent homes and unemployment rates.
I use multiple regression analysis to test whether states that have stricter collateral
consequence laws also experience higher rates of returns to prison, and I also look at the
relationship specific to both new crimes as well as for technical violations. These
analyses allow me to compare the magnitudes of the effects of specific collateral
consequence laws on rates of returns to prison.
In addition, as a sensitivity check on the results, I conduct a fixed-effects analysis
on the effects of restrictions on TANF. These laws were enacted in 1996 and states vary
in their implementation of this restriction. As a fixed-effects model analyzes change
within states rather than between states, this will ensure greater confidence that the results
are due to the effect of the restriction on TANF, and not related to any state differences in
reimprisonment policy, practice or definition of “returns to prison”. The TANF law lends
itself to a fixed effects analysis as the enactment of the law in 1996 provides significant
variation in the law over time.
This dissertation is comprised of five chapters. In the following chapter I provide
a description of collateral consequence laws along with their historical context and a
description of legal challenges to these laws. I also review the relevant literature dealing
with issues of collateral consequences and their effect on a range of outcomes, including
recidivism. In chapter three I describe how collateral consequence laws were codified for
use in the current study, along with a description of dependent and control variables. I
then give descriptive information about these variables and describe the proposed
analysis. In chapter four I present the results of the analysis, examining the effects of
This document is a research report submitted to the U.S. Department of Justice. This report has not been published by the Department. Opinions or points of view expressed are those of the author(s)
and do not necessarily reflect the official position or policies of the U.S. Department of Justice.

20
these laws across the two BJS datasets, as well as examine differences in the models for
returns to prison for new sentences as opposed to technical violations. I conclude the
dissertation in chapter five with a discussion of the results, the implications of these
findings, as well as a discussion of future research.
This document is a research report submitted to the U.S. Department of Justice. This report has not been published by the Department. Opinions or points of view expressed are those of the author(s)
and do not necessarily reflect the official position or policies of the U.S. Department of Justice.

21
Chapter 2: Collateral Consequence Laws in the United States
Overview of Collateral Consequence Laws
Characteristics of Collateral Consequence Laws
Civil restrictions on offenders that go beyond an initial punishment are not a new
phenomenon in society. Such laws can be found in the legal codes of ancient Rome,
Athens and among Germanic tribes and included the loss of the ability to engage in
public affairs, to own property, and could even result in a man’s wife being declared a
widow and his children orphans (Travis, 2002). Collateral consequence laws are also
embedded in the early history of the United States with the framers of the US constitution
giving states the right to restrict the ability of offenders to vote.
However, while these types of laws are by no means a new phenomenon, the
modern form of these laws is distinct from their historical counterparts. These laws are
unique in their relative “invisibility”, their pervasiveness across several aspects of
modern life, as well as that they take place in a very different context. They also are
applied to a larger percentage of the population, and last longer, than similar laws in the
past (Petersilia, 2003). Travis (2002) has called collateral consequence laws an “invisible
punishment,” and he argues that they are invisible in three ways. First, these laws operate
largely outside the public view. Many people are unaware of these laws, calling into
question the ability of these laws to have a general deterrent effect. Defendants are also
frequently unaware of these potential consequences, and may not be aware of these
restrictions until after they have served their sentence (Pinard, 2006). As such, the
This document is a research report submitted to the U.S. Department of Justice. This report has not been published by the Department. Opinions or points of view expressed are those of the author(s)
and do not necessarily reflect the official position or policies of the U.S. Department of Justice.

22
purpose of these laws is frequently unclear, whether it is for punishment, deterrence or
prevention, and it is also often ambiguous as to how the consequence is related to the
offense (Demleitner, 1999). For example, the relationship between a drug possession
conviction and a permanent ban from being employed as a barber is not easily apparent.
Second, collateral consequence laws are also invisible in that they take place
outside the traditional sentencing structure. While traditional punishments are meted out
by judges, these laws are dispersed throughout civil and administrative codes and are
designated as indirect consequences of crime rather than as punishments. As such, they
are exempt from the same standards as traditional punishments. Many defendants are
uninformed of these consequences when making decisions to take a plea or to proceed to
trial. In response to complaints regarding the lack of transparency of these laws, there
have been calls to collect all these laws in one place so that lawyers and judges may be
better informed and better able to notify defendants of these restrictions (Pinard, 2004).
In 2009, the American Bar Association received funding from the National Institute of
Justice to compile these laws and make them more transparent to lawyers, judges and
defendants. By the winter of 2012 they had already compiled over 38,000 laws across
the US and had not yet finished coding all the states.5
The third way that Travis categorizes these laws as invisible is that in terms of
legislative action they have frequently been passed as riders on other legislative bills, and
thus have not faced the scrutiny afforded to other sentencing laws, such as public
hearings. For instance, the restriction on welfare benefits for offenders was debated for
5 http://www2.americanbar.org/sections/criminaljustice/cr206500/pages/collateral.aspx
This document is a research report submitted to the U.S. Department of Justice. This report has not been published by the Department. Opinions or points of view expressed are those of the author(s)
and do not necessarily reflect the official position or policies of the U.S. Department of Justice.

23
only two minutes as part of the larger overhaul of the welfare system (Rubinstein and
Mukamal, 2002).
While these laws are frequently invisible, they are also highly pervasive through
many aspects of life, affecting civil, political, economic and social welfare rights
(Demleitner, 1999). In addition, technology has changed the context in which these laws
take place. For instance, while criminal records used to involve a lengthy process of
going to a courthouse, submitting a request and waiting for the appropriate file to located,
many criminal records can now be accessed by anyone with access to a computer.
Electronic records can also make it more difficult to expunge old or incorrect records as
they frequently have to be expunged from several different locations (Bushway et al
2007). Once the information is online, it can be difficult to erase all traces of the record.
Description of the laws
Collateral consequence laws cover a wide array of outcomes, including
deportation, sex offender registration, civil commitment of sex offenders, gun ownership
rights, access to social services, student loans, adoption and foster care eligibility,
employment restrictions, voting, driver’s licenses, and public access to criminal records.
Although most collateral consequence laws come from state and local legislation, more
recently federal legislation has also played a role. In the mid 1990’s, the War on Drugs
resulted in federal legislation restricting funding to states in the area of welfare assistance
and food stamps, public housing and driver’s licenses. States had the option to comply
with the federal requirements, or to pass legislation to opt out or alter the restrictions in
order to avoid losing federal funds.
This document is a research report submitted to the U.S. Department of Justice. This report has not been published by the Department. Opinions or points of view expressed are those of the author(s)
and do not necessarily reflect the official position or policies of the U.S. Department of Justice.

24
As mentioned previously, a comprehensive census of all collateral consequence
laws has been difficult. For the purposes of this study, I have chosen to focus on a subset
of collateral consequence laws based upon their pervasiveness across states, the number
of offenders they affect, the attention they have received from policy makers and
advocates, and the length of time they have been in place. I have chosen to examine the
laws which have received the most attention as being potentially harmful to the
successful reintegration of offenders (Demleitner 1999, Ewald 2012, Legal Action Center
2009, Love 2006, Petersilia 2003, Pinard 2010, Rubinstein and Mukamal 2002, Travis
2005, Uggen and Manza 2006) in order to test the merit in the critique of these laws.
Specifically, I include collateral consequence laws in the six following areas: voting,
access to criminal records, employment, public housing, public assistance, and driver’s
licenses.6
Voting
States have the right to determine the eligibility requirements of current and
former offenders in terms of voting rights, and there is a wide difference in these laws
maintained by states, ranging from two states that allow persons currently serving time in
prison to vote in elections to eleven states that have no automatic restoration of voting
6 I do not include information on laws related to restrictions on sexual offending as these restrictions are
particular to a group that is relatively small, and thus are not expected to have a large impact for returns to
prison. In addition, the BJS data does not contain information on the rate of sex offenders and so there is
no way to control for differences in the rate of sex offending for each state. I also do not include
information on laws related to gun restrictions. Gun restrictions have not received the same scrutiny as the
other collateral consequence laws in terms of the potential impact to hinder reintegration attempts.
This document is a research report submitted to the U.S. Department of Justice. This report has not been published by the Department. Opinions or points of view expressed are those of the author(s)
and do not necessarily reflect the official position or policies of the U.S. Department of Justice.

25
rights following conviction. 7
Voting restrictions have historically been based upon
preserving the “dignity” of the ballot box, with the argument that those with a criminal
history are both undeserving of political involvement as well as untrustworthy of the
responsibility. The idea of preserving the “purity of the ballot box” engages the idea that
ex-offenders are more likely to engage in voter fraud or to vote in an anti-democratic
manner (Demleitner, 1999; Kleinig and Murtagh, 2005).
While restrictions on voting date back to the framing of the constitution, these
laws proliferated during the post-Civil War era. Some states attempted to circumvent
federal law extending voting privileges to black men by instituting laws restricting the
right to vote of offenders that committed crimes deemed to be more likely to be
committed by blacks. For instance, the Mississippi Supreme Court of 1896 commented
that the legislature had effectively excluded blacks from voting through
disenfranchisement for particular crimes. They noted,
“By reason of its previous condition of servitude and dependence, this race
had acquired or accentuated certain peculiarities of habit, of temperament,
and of character, which clearly distinguished it as a race from that of the
whites…its criminal members given rather to furtive offenses than to the
robust crime of the whites. Restrained by the federal constitution from
discriminating against the negro race, the convention discriminated against
its characteristics and the offenses to which its weaker members were
prone…Burglary, theft, arson, and obtaining money under false pretenses
were declared to be disqualifications, while robbery and murder and
crimes in which violence was the principal ingredient were not.” 8
7 These laws continue to change. Most recently, in 2013 Virginia altered their voting restriction to allow
the automatic restoration of voting rights to certain categories of offenders. All numbers stated in this
document refer to the laws as of 2009. 8 Ratliffe v Beale, 20 So. 865, 868 (Miss 1896). As quoted in Chin 2002, 256.
This document is a research report submitted to the U.S. Department of Justice. This report has not been published by the Department. Opinions or points of view expressed are those of the author(s)
and do not necessarily reflect the official position or policies of the U.S. Department of Justice.

26
Such racially motivated disenfranchisement laws were later deemed
unconstitutional by the 1985 Supreme Court case Hunter v. Underwood as a violation of
the 14th
Amendment as its passage had a discriminatory intent.9 However without
specific evidence of racial motivation, voting disenfranchisement laws have been found
to be constitutional under Richardson v. Ramirez, 1974.10
Access to Criminal Records
A justification for public access to criminal records is that it allows potential
employers to assess the trustworthiness of job applicants, which can be particularly
important for jobs dealing with vulnerable populations such as the elderly, disabled, or
children, or in jobs in which there could be greater opportunities for fraud or
embezzlement. States vary in which criminal records they make available to the public
with some states providing arrest records and other states limiting access to only
convictions that have occurred within a certain number of years, or to certain offense
types. In addition, states vary in the ease with which a person can attain records, for
instance, whether they can be obtained online or if they must be obtained in person, as
well as who can attain access to records. While some states limit access to criminal
justice agencies, many states have expanded access to include potential employers across
the public and private sector, as well as potentially to any member of the public seeking
information. The proliferation of private criminal background check repositories has
further increased access to this information. In addition, in some states certain job
positions require a criminal background check by the employer (Stoll and Bushway,
9 Hunter v. Underwood, 471 U.S. 222 (1985)
10 Richardson v. Ramirez, 418 U.S. 24 (1974)
This document is a research report submitted to the U.S. Department of Justice. This report has not been published by the Department. Opinions or points of view expressed are those of the author(s)
and do not necessarily reflect the official position or policies of the U.S. Department of Justice.

27
2008 ). Also, several states allow “negligent hiring” lawsuits, in which an employer can
be sued for any criminal action on the part of their employee.
A concern about the ready availability of criminal records is that potential
employers may choose not to hire someone that has a criminal record despite the persons’
qualifications and desire to lead a crime free life. As early as 1962, the National Council
on Crime and Delinquency (NCCD) proposed allowing for the expungement of criminal
records (NCCD, 1962). Efforts in this area continued and in 1981 the American Bar
Association (ABA) and the American Correctional Association (ACA) jointly issued
standards advocating for a judicial procedure to expunge criminal conviction records.
However, in response to the “Get Tough” movement in the 1980’s to 1990’s, along with
technological innovations supporting electronic access, the availability of criminal
records has expanded in recent years with more states making criminal records available
online (BJS 2011, Travis 2002).
Employment
While many employers are reluctant to hire people that have criminal records,
states have codified this reluctance in laws restricting employment in certain fields, or
denying occupational licensing. To the extent that criminal activity is interpreted as a
reflection of a person’s character, the intent of these laws is to restrict the person from
using their occupation to commit further crimes. States are able to set the standards for
whether public and/or private employers, as well as whether state licensing agencies, can
deny employment based upon a person’s criminal history. The Equal Employment
Opportunity Commission has ruled that under Title VII of the Civil Rights Act,
This document is a research report submitted to the U.S. Department of Justice. This report has not been published by the Department. Opinions or points of view expressed are those of the author(s)
and do not necessarily reflect the official position or policies of the U.S. Department of Justice.

28
employers in companies with more than 15 employees11
cannot deny employment, or fire
an employee, unless there is a clear business justification. However, many states allow
employers and occupational boards to consider arrests that have not led to conviction, and
many states have no standards governing the relevance of the criminal offense type to the
specific position of employment. Many states refuse to grant occupational licenses,
regardless of the offense type, for certain positions, including jobs such as barbering
(Petersilia 2003). In addition, several states have allowed civil lawsuits regarding
negligent hiring of employees with a criminal history who later commit crimes while
employed (Thompson, 2008). These laws have faced criticism for making it more
difficult for returning offenders to find jobs to be able to support themselves and that in
“some states virtually the only “profession” open to an ex-felon is that of burglar” (May
1995: 193). Furthermore, the “character component” of many occupational licenses,
means that in many states there does not have to be a clear relationship between the
offense and the occupation, as any offense can serve as evidence of poor moral character
(May 1995).
Public Housing
Although local housing authorities ultimately determine the standards for
admission to federally assisted housing, federal law allows housing authorities to deny
housing to virtually anyone with a criminal background or drug history. In response to
concerns over the dangerousness of public housing establishments, Congress enacted the
11
Employer is defined as “a person engaged in an industry affecting commerce who has fifteen or more
employees for each working day in each of twenty or more calendar weeks in the current or preceding
calendar year, and any agent of such a person” and excluding the US government and private clubs. http://www.eeoc.gov/laws/statutes/titlevii.cfm
This document is a research report submitted to the U.S. Department of Justice. This report has not been published by the Department. Opinions or points of view expressed are those of the author(s)
and do not necessarily reflect the official position or policies of the U.S. Department of Justice.

29
Anti-Drug Abuse Act in 1988 requiring public housing authorities that received federal
funds or assistance to use lease provisions that would make criminal activity, particularly
drug-related criminal activity, a basis for eviction. This restriction included any member
of the household, including temporary guests. The goal of this law was to disrupt the
rampant drug market present in many public housing locations. These restrictions were
strengthened with the “one strike and you’re out” policy, in which residents found to be
selling drugs or committing crimes would be immediately expelled from public housing.
The Housing Opportunity Program Extension Act of 1996 and the Quality Housing and
Work Responsibility Act of 1998 established the basis for this policy, creating uniform
screening tools and standards for admission to public housing as well as eviction policies
for people with criminal records. A 2002 Supreme court case upheld evictions of the
entire household, even those not engaged in criminal activity.12
While federal law
requires that criminal activity be included as a basis for eviction from public housing, it
only requires eviction (or denial of housing) to registered sex offenders and those
convicted of manufacturing methamphetimines on public housing property. Otherwise it
is up to local housing authorities to set their own standards and policy regarding the
admission and evictions of households including criminal offenders.
A concern with restrictions on public housing is that many returning citizens
struggle to find living situations post-prison. Those with drug records cannot live with
family members in public housing, nor can they apply for such housing. For many, this
restriction increases the difficulty of reuniting with their minor children.
12
Department of Housing and Urban Development v. Rucker, 533 U.S. 125 (2002).
This document is a research report submitted to the U.S. Department of Justice. This report has not been published by the Department. Opinions or points of view expressed are those of the author(s)
and do not necessarily reflect the official position or policies of the U.S. Department of Justice.

30
Public Assistance
The 1996 Personal Responsibility and Work Opportunity Reconciliation Act
included a lifetime ban on Temporary Assistance for Needy Families (TANF) assistance
and Supplemental Nutrition Assistance Program (SNAP, also referred to as food stamps)
for individuals with drug felony convictions, which could include drug use, possession or
distribution. This restriction was introduced as an amendment by Senator Phil Gramm
from Texas who said “if we are serious about our drug laws, we ought not to give people
welfare benefits who are violating the nation’s drug laws” (Rubinstein and Mukamal,
2002),13
and thus appears to be primarily punitive in its intent. Unlike restrictions on
public housing, only the individual with the conviction is affected, the benefits for
children or other family members are not. States have the option to either adopt, opt out,
or to alter, the ban. Several states have altered the ban so that benefits are reinstated to
offenders who have received, or are undergoing, drug treatment, while other states have
put time limits on the length of the ban. The concern with this ban is that many returning
offenders, particularly those who are reuniting with minor children, have difficulty
finding employment, and without TANF are unable to support themselves or their
families.
Driver’s License
The purpose of suspending driver’s licenses of persons convicted of a drug
offense is to try to restrict people that may have drug addictions from driving while under
13
Presumably this would also be the case if “we are serious” about any laws, including violent or property
crimes, however the restriction was limited to drug offenses.
This document is a research report submitted to the U.S. Department of Justice. This report has not been published by the Department. Opinions or points of view expressed are those of the author(s)
and do not necessarily reflect the official position or policies of the U.S. Department of Justice.

31
the influence thus endangering the lives of people on the road. Federal legislation passed
in 1992 withheld 10% of certain federal highway funding to states that did not comply
with a mandate suspending the driver’s license of anyone convicted of a drug offense for
at least 6 months after the conviction. However, without access to a driver’s license, ex-
offenders may find it difficult to find or maintain steady employment due to the added
difficulty of obtaining transportation to and from work. If public transportation is not
readily available, many have to rely on family and friends, increasing the burden on
family and increasing the chances that they will be late or miss work. Some ex-offenders
may find themselves in violation of probation or parole after driving without a license in
order to try to meet work obligations. States can pass legislation to opt out, and several
states have changed the requirement to include only drug offenses that involved driving,
and to offer restricted licenses to travel to work, school, or drug treatment programs.
Legal Challenges and Concerns of Collateral Consequence Laws
History of Collateral Consequence Laws
The mid-1950’s through the 1970’s was a period in which the efficacy of
collateral consequence laws was called into doubt (Demleitner, 1999). As early as 1955,
the NCCD Standard Probation and Parole Act called for restoration of all civil rights
following periods of supervision (NCCD 1964). This was followed in 1956 by the
National Conference of Parole arguing that deprivation of civil rights was in
contradiction to modern correctional treatment goals, specifically the goal of
rehabilitation (NCCD 1962). During this period, collateral consequences declined overall
across US states and more states offered automatic, statutory restoration of rights as a
This document is a research report submitted to the U.S. Department of Justice. This report has not been published by the Department. Opinions or points of view expressed are those of the author(s)
and do not necessarily reflect the official position or policies of the U.S. Department of Justice.

32
way to reward former offenders’ efforts to rehabilitate (Demleitner 1999). However, as
the Get Tough on crime movement gained momentum in the 1980’s the trend reversed
and increasingly legislation was passed in states multiplying the number and extent of
collateral consequence laws. In addition, as part of the War on Drugs, federal legislation
affecting welfare benefits, public housing standards and drivers license suspensions were
passed as additional sanctions against drug offenders.
Legal Challenges to Collateral Consequences
Collateral consequences are unusual in that they are activated by the criminal
process (arrests and convictions), but are considered to be civil and administrative actions
rather than part of the criminal process. Legal challenges have been launched against
collateral consequence laws maintaining that they are unfairly punitive and that they
violate double jeopardy rules by acting as a second punishment after the sentence has
been served (Pinard, 2006). Thus far however courts have mainly ruled in defense of
collateral consequence laws under the determination that the laws are passed for a
purpose other than being punitive, they are not so punitive as to negate the original
intentions of the law, and because collateral consequence laws are enforced by
administrative agencies rather than by the criminal process, indicating that they are not
under the purview of the criminal justice process (Pinard, 2010).
Additional challenges to these laws have been made under the argument that they
violate due process protections as many defendants remain unaware of these
consequences throughout the criminal process, and their knowledge of these
consequences could affect decisions regarding pleading guilty or proceeding to trial.
Here too, courts have largely upheld collateral consequence laws arguing that trial courts
This document is a research report submitted to the U.S. Department of Justice. This report has not been published by the Department. Opinions or points of view expressed are those of the author(s)
and do not necessarily reflect the official position or policies of the U.S. Department of Justice.

33
and defense lawyers do not have a responsibility to inform defendants of these
consequences (Chin and Holmes, 2002). This has largely been justified under the
Supreme Court Brady v. United States (1970) ruling that decided that due process only
required trial courts to inform defendants of direct consequences of a guilty plea.14
Since
collateral consequences are considered indirect, as the court does not rule on them and a
separate administrative agency institutes the consequences, they are thus exempt from the
due process provisions. Courts have also noted the difficulty of requiring defense
attorneys or courts to gather all of the relevant statutes pertaining to any particular
defendant in order to inform a defendant of these consequences given that these laws are
dispersed throughout administrative and civil codes, (Pinard 2004). However, in stark
contrast to previous legal findings, in the recent Supreme Court ruling Padilla v.
Kentucky (2010) the Court noted that deportation is an “integral part” of the punishment
for non-citizens, and as such is “neither a collateral nor a direct consequence.”15
In
Padilla the court ruled that defendants have a right to be informed of the likely outcome
of deportation in a guilty plea and that the failure of a defense attorney to inform a client
of this outcome is a violation of the right to effective counsel as defined by Strickland v.
Washington (1984).16
Legal scholars make the case that this ruling opens the possibility
that other collateral consequences which are also linked to legal proceedings, such as
welfare and public housing, could also be viewed as an “integral part” of a legal
punishment and as such could also require legal protection for notification (Love and
Chin, 2010; Chin, 2011; Le, 2011).
14
Brady v. United States, 397 U.S. 742, 755 (1970). More information on the application of this case to
collateral consequences can be found in Chin and Holmes, 2002 (726-730). 15
Padilla v. Kentucky, 130 S. Ct. 1473 (2010). 16
Strickland v. Washington, 466 U.S. 668 (1984).
This document is a research report submitted to the U.S. Department of Justice. This report has not been published by the Department. Opinions or points of view expressed are those of the author(s)
and do not necessarily reflect the official position or policies of the U.S. Department of Justice.

34
Effect of Collateral Consequences
While evidence regarding the impact of collateral consequence on rates of returns
to prison has been sparse, previous studies have demonstrated an effect of these laws on
other outcomes. Past research has demonstrated the impact of collateral consequence
laws on a variety of outcomes, including voting turnout, election results, employment,
and wages, college attendance, food insecurity and racial inequality. All of the studies
reviewed below examine the impact of collateral consequences at the individual-level.
Effect of Collateral Consequences on Voting
Recent research indicates that voting disenfranchisement laws have had a
significant effect on rates of voting turnout, and that this effect on voting turnout is
responsible for a significant proportion of the drop in voter turnout rates in the last 30
years, as well as on the outcome of several federal elections. As part of their
comprehensive look at the effect of voter disenfranchisement, Manza and Uggen (2006)
estimate a predicted voter turnout rate of former felons if disenfranchisement laws were
not in place. To do this, they use socio-demographic information from the Current
Population Survey (CPS) to create a lower-bound estimate of the turnout rate if
disenfranchised felons were allowed to vote. They estimate 35% of the disenfranchised
population would vote compared to 52% of the entire electorate for federal elections.17
In a second analysis, they use data from the Minnesota Youth Development Study (YDS)
and again use socio-demographic characteristics to predict probability of voting. Based
17
This number represents a lower bound estimate as the estimate for how many offenders would vote if
allowed is based on characteristics of the currently incarcerated population. Thus it does not take into
account changes for formerly incarcerated – such as greater residential stability, labor force attachment and
marriage - that are correlated with higher rates of turnout.
This document is a research report submitted to the U.S. Department of Justice. This report has not been published by the Department. Opinions or points of view expressed are those of the author(s)
and do not necessarily reflect the official position or policies of the U.S. Department of Justice.

35
on this analysis they estimate a voter turnout probability in Minnesota of .63 for arrestees
– statistically insignificant from the .69 probability for non-arrestees. In both studies they
find that restrictions on voting prevents a significant number of people from voting in
elections. This is in agreement with their qualitative interviews which indicate that many
former felons would vote if given the opportunity.
While it appears that voter turnout has steadily declined since 1972, McDonald
and Popkin (2001) argue that when the denominator to determine voter turnout is based
upon a voting eligible population (VEP)18
figure that excludes ineligible voters rather
than a voting-age population (VAP) figure, that voter turnout has not declined. They use
a conservative estimate for disenfranchised offenders as they only include the currently
supervised (incarcerated, parolees, and probationers), and many states also disenfranchise
offenders post-supervision. They argue that voting disenfranchisement accounts for a
significant proportion of the supposed decline in voter turnout.
While McDonald and Popkin (2001) estimate approximately 3.2 million
disenfranchised individuals in 2004, Uggen et al (2012) estimate a higher number of 5.85
million once laws disenfranchising offenders post-supervision are included.
Furthermore, it appears that this disenfranchisement has had a meaningful impact on the
democratic process. Using the voting habits of people with similar demographic
characteristics to those of former offenders to estimate likely voter turnout rates and
voting preferences, Manza and Uggen (2006) estimate that without voting
disenfranchisement the 2000 presidential election along with 7 senate elections would
18
McDonald and Popkin construct the VEP figure by excluding individual ineligible to vote, including
felons and non-citizens, as well as eligible but excluded groups such as overseas citizens.
This document is a research report submitted to the U.S. Department of Justice. This report has not been published by the Department. Opinions or points of view expressed are those of the author(s)
and do not necessarily reflect the official position or policies of the U.S. Department of Justice.

36
have had different victors. Thus it would appear that these laws have an impact on the
demomcratic process.
Effect of Collateral Consequences on Employment and Wages
Former offenders face a multitude of barriers to obtaining and maintaining steady
employment, and these barriers have a documented relationship with employment rates
and wages. Research indicates that steady employment is related to lower levels of
offending (Bushway and Reuter, 2002; Lipsey, 1995). Maintaining employment is
important both for avoiding the draw of criminal activity and because it is frequently a
requirement of parole. Restrictions on occupational licenses and certain professions, the
availability of criminal records, and restrictions on driver’s licenses (and thus the ability
to drive to and from work) can all hinder an ex-offenders ability to successfully
reintegrate.
Employers are well documented as preferring to avoid hiring persons with a
criminal record. For instance, in her study Pager documents that white males with a
criminal record were 50% less likely to get a call back from employers if they had a
criminal record. Blacks suffered a similar disadvantage (65% less likely to get a call
back if they had a criminal record), on top of an already significant racial disadvantage.
For blacks, the combined disadvantage of race and a criminal record can make finding
employment a practically impossible proposition across a range of different contexts
(Pager 2003, Pager 2007). In a survey of employers, Holzer et al (2004) report that over
60% of employers responded that they definitely or probably would not hire someone
with a criminal record for their most recently filled position not requiring a college
This document is a research report submitted to the U.S. Department of Justice. This report has not been published by the Department. Opinions or points of view expressed are those of the author(s)
and do not necessarily reflect the official position or policies of the U.S. Department of Justice.

37
degree. Furthermore, they found that 63% of employers in 2001 always or sometimes
conducted background checks.
In addition to affecting levels of employment, criminal records also affect a
person’s wages. Pettit and Lyons (2007) find a wage penalty of 2-5% in Washington
State even when controlling for prior work experience, conditions of confinement, and
individual fixed effects. In their review of previous studies, Western et al (2001) report a
wage penalty of about 10-30% following incarceration. Wage penalties tend to be
highest among white collar jobs and those with at least some college education, perhaps
because there is a stronger stigma attached to incarceration among these jobs, or due to
laws prohibiting employment in certain industries.
Context does appear to have an effect on the employment stability of ex-
offenders. For instance, Raphael and Weiman (2007) found a moderate effect of county
unemployment rates on the likelihood of paroled offenders being returned to custody.
Sabol (2007) found a similar effect on unemployment rates for prisoners in Ohio. Uggen
(2000) found that employment opportunities reduced recidivism rates among offenders
age 27 or older, but had no effect on younger offenders. Finlay (2009) found that the
availability of criminal records online resulted in worse labor market outcomes for ex-
offenders. However, Stoll and Bushway (2008) found that employer-initiated
background checks only negatively affect hiring for employers that have a legal
obligation to perform background checks. Thus, it may not be the availability of criminal
history information that is detrimental to the hiring of ex-offenders, but rather the laws
that require these background checks for certain occupations.
This document is a research report submitted to the U.S. Department of Justice. This report has not been published by the Department. Opinions or points of view expressed are those of the author(s)
and do not necessarily reflect the official position or policies of the U.S. Department of Justice.

38
However, while the widespread access of criminal records can be detrimental to
the ability of ex-offenders to find jobs, there does appear to be a positive effect of their
availability. There is evidence that in the absence of criminal background checks
employers may be more likely to engage in statistical discrimination against people that
are members of groups with high rates of criminal histories, specifically young, black,
men. Employers that report an aversion to hiring ex-offenders and that check the
criminal backgrounds of applicants are more likely to hire black men, indicating that
employers that are averse to hiring ex-offenders and do not conduct background checks
are more likely to avoid hiring ex-offenders by avoiding hiring people from groups with a
higher likelihood of being ex-offenders (Bushway 2004, Holzer et al 2006, Holzer et al
2007). This introduces an added complexity to the issue of criminal records, with some
arguing that adding additional information on records, such as rehabilitative efforts or
behavior in prison, may be more beneficial than eliminating access to records (Freeman
2008). Another potential response, which is used in some states, is to place time limits
on criminal records. This practice is supported by current research predicting the time to
“redemption” or the time at which a former offenders risk of reoffending approximates
non-offenders (Blumstein and Nakamura 2009, Kurlychek et al 2006, Kurlychek et al
2007).
Effect of Collateral Consequences on Other Outcomes
Recent research also indicates the effect of collateral consequence laws on a
variety of other outcomes, such as college attendance (Lovenheim and Owens 2013),
racial inequality in employment (Wheelcock et al 2011) and food insecurity and risky
behaviors (Wang et al 2013). Using the NLSY 1997, Lovenheim and Owens (2013) find
This document is a research report submitted to the U.S. Department of Justice. This report has not been published by the Department. Opinions or points of view expressed are those of the author(s)
and do not necessarily reflect the official position or policies of the U.S. Department of Justice.

39
that amendments passed in 2001 to the Higher Education Act, which caused people
convicted of drug offenses to be temporarily ineligible for federal financial aid, had a
large negative impact on college attendance of students with drug convictions. The two
year ban on eligibility for federal financial aid increased the amount of time between high
school graduation and college, and the authors argue may have caused students convicted
of drug offenses to be less likely to ever go to college. They also find that the law did not
have any deterrent impact in reducing the number of young people committing drug
felonies.
There is also some preliminary evidence that collateral consequence laws
restricting employment may increase racial inequality in jobs that limit employment by
former offenders. Given that blacks are disproportionately likely to have a criminal
record, restricting felons from employment in certain occupations would be expected to
raise the racial inequality for those occupations. To test this, Wheelcock et al (2011)
compare racial inequality across different job types in New Jersey and Minnesota. While
both states restrict felony employment in some occupations, New Jersey prevent former
offenders from being employed in a higher number of occupations. Employing
Difference-in-Difference technique they find that for the occupations restricting felony
employment in New Jersey, but not in Minnesota, that racial inequality is higher in New
Jersey, whereas racial inequality is not higher in New Jersey for occupations that are
unrestricted in both states.
Wang et al (2013) examined the impact of bans on SNAP on food insecurity on a
sample of 110 individual across three states. They found that while food insecurity was
high among all former offenders (91% reported food insecurity and 37% reported not
This document is a research report submitted to the U.S. Department of Justice. This report has not been published by the Department. Opinions or points of view expressed are those of the author(s)
and do not necessarily reflect the official position or policies of the U.S. Department of Justice.

40
having eaten for a whole day at some point in the last month because of money), that
food insecurity and not having eaten for a whole day were significantly higher in states
with a total or partial ban on SNAP, compared to a state with no ban. They also found
that not having eaten for a whole day was correlated with HIV risk behaviors.
Collateral Consequences and Recidivism
Recidivism
Approximately 2/3 of released inmates are arrested within 3 years of release, with
the bulk of the reoffending occurring within 6 months (Langan and Levin, 2002). Crime
rates of an area increase as rates of released offenders returning to the area increase
(Vieratis et al 2007, Hipp and Yates 2009), however the role played by collateral
consequences in this relationship is largely unexplored. Currently the bulk of research on
recidivism has focused on individual-level predictors, such as employment history,
family relationships, drug history, physical or mental health problems, age, race, and
gender (Langan and Levin 2002, Lipsey 1995, Visher et al 2010, Berg and Huebner
2011) and on treatment programs related to individual-level factors (Lipsey 1995,
Gendreau 1996). However, recent research highlights the potential role that macro-level
factors, such as neighborhood context may play in the successful reentry of former
offenders. Kubrin and Stewart (2006) found that neighborhood socioeconomic status was
an important predictor of recidivism net of individual-level characteristics of those
offenders; specifically those who returned to resource rich communities after serving
time were less likely to recidivate. Morenoff and Harding (2011) found that the
This document is a research report submitted to the U.S. Department of Justice. This report has not been published by the Department. Opinions or points of view expressed are those of the author(s)
and do not necessarily reflect the official position or policies of the U.S. Department of Justice.
41
socioeconomic composition of the neighborhood a parolee returned to predicted the labor
market outcome of a parolee whereas the residential stability of a neighborhood predicted
recidivism. Hipp and Yates (2009) demonstrate that the social capital of a neighborhood,
specifically residential stability and the presence of voluntary organizations for youth,
can moderate the effect of high numbers of parolees in a community on crime rates.
These studies highlight the need to include macro-level processes in studies of
recidivism.
Integral to the study of recidivism is research on parole violations. Returns to
prison reflect decisions made by parolees, parole officers, parole boards, as well as
prosecutors. While actions by parolees, such as committing a new offense, failing a drug
test or missing appointments with a parole officer, can initiate proceedings to be returned
to prison, prosecutors, parole officers and parole boards have discretion in how to treat
these violations. Research indicates that while the decisions of parole officers and parole
boards vary based on the behavior of parolees (such as the number of appointments
missed, whether there was failed drug test, whether the parolee committed a new
offense), that these decision-makers also take into account parolee characteristics (such as
race, gender, age), offense characteristics (such as violent offenses) organizational
constraints (such as prison crowding) as well as community factors (such as community
punitiveness) (Lin et al 2010, Steen et al 2012). Steen et al 2012 find support that
individual characteristics, specifically gender, race, and age, play a role in the decisions
of parole officers even after controlling for the behaviors of parolees. Other studies have
found differential impacts of parolee characteristics for whether the violation was for a
new sentence or a technical violation. For instance, Lin et al, 2010 found that parole
This document is a research report submitted to the U.S. Department of Justice. This report has not been published by the Department. Opinions or points of view expressed are those of the author(s)
and do not necessarily reflect the official position or policies of the U.S. Department of Justice.

42
boards were more likely to return blacks (rather than whites) to prison after a parole
officer filed a violation for a new sentence, whereas they were evenly likely to return
blacks and whites to prison when parole officers filed a violation for technical violations.
Individual factors, organizational factors and community factors have also been found to
have an effect in decisions by parole boards to grant parole to people in prison, as well as
by prosecutors in decisions whether to file an arrest as a new crime or to have it charged
as a violation of probation (Huebner and Bynum 2008, Kingsnorth et al 2002).
Theoretical perspectives of collateral consequences and recidivism
When examining the effect of these collateral consequence laws through the lens
of criminological theories, most major theories support the expectation that harsh
collateral consequence laws will be related to high rates of returns to prison. While many
of the processes that have been described in this relationship are at the individual level,
and coincide with micro level theories, this study seeks to examine whether these policies
have an effect at the state-level. While ultimately this research is unable to test
individual-level theories at the risk of committing ecological fallacy, it can still be useful
to examine how criminological theories would explain this relationship. In particular,
strain, labeling and social disorganization theory are well suited to examining the role of
collateral consequence laws on rates of returns to prison.
According to strain theory, people are more likely to commit crime when they
experience strain in their lives. In the framework of traditional strain theory, collateral
consequence laws may produce strain by blocking access to conventional means, such as
legal work, to the culturally defined goal of financial success (Merton, 1968). Collateral
consequences are expected to increase the difficulty of achieving stable legitimate work
This document is a research report submitted to the U.S. Department of Justice. This report has not been published by the Department. Opinions or points of view expressed are those of the author(s)
and do not necessarily reflect the official position or policies of the U.S. Department of Justice.

43
due to restrictions on the type of employment for which they are eligible, making
individuals unattractive as potential employees through the availability of their criminal
record, or creating difficulties attending work due to restrictions on driver’s licenses and
thus individuals may turn to crime as a way to achieve financial success, or as a way to
dropout from societal norms through drug use. Those subject to employment-barring
collateral consequence laws would, then, become the classic Mertonian innovators or
retreatists. Similarly, modern versions of strain theory (Agnew 1992), would note the
negative affect or frustration that is expected to result due to the role of collateral
consequences in preventing people from attaining positively valued goals, such as stable
employment, or the ability to live with family members (if family members live in public
housing). These collateral consequences may be particularly influential to the extent that
they result in the clustering of negative events (as they can impact multiple aspects of a
person’s life, that they have a long duration (in that many of these restrictions never
expire, and effects, such as unemployment, may be long lasting), that they are of high
magnitude to the individual (such as failure to reunify with children is for most parents)
and recentness (given that the effects can be recurring, at any given time the sting of
these laws can be quite recent) In addition, blocking access to employment or family
relationships also hinders access to legitimate coping mechanisms that could alleviate
strain. Thus the individual is more likely to engage in illegitimate coping strategies, such
as illicit behavioral coping strategies of violence or theft, or emotional coping strategies
such as drugs.
Another theoretical avenue to consider is theories related to labeling,
stigmatization and legitimacy. As restrictions activated by a person’s criminal history,
This document is a research report submitted to the U.S. Department of Justice. This report has not been published by the Department. Opinions or points of view expressed are those of the author(s)
and do not necessarily reflect the official position or policies of the U.S. Department of Justice.

44
collateral consequences serve as a formal label of a person as criminal and as an isolating
action by society by preventing the person from easily gaining access to employment or
stable housing. The constant reminder of this label through restrictions could contribute
to a person internalizing the label and then engaging in further secondary deviance
(Lemert 1951). These restrictions can cause angry and defiant responses among former
offenders who then respond by engaging in further criminal behavior (Scheff and
Retzinger 1991, Sherman 1993). As these restrictions are frequently permanent, there is
no way for a person to overcome the label once it is applied, it is a permanent,
stigmatizing badge which would then lead a person to seek out support from other
similarly branded individuals (Braithwaite, 1989). Furthermore, the permanency of the
label serves as an additional block to an offender changing their self-label to one of a pro-
social person. Voting, successful employment and housing, could help an individual
redefine self as a contributing member to society, and these restrictions serve to prevent
the re-labeling process (Maruna 2001, Manza and Uggen 2006). In addition, the
permanent nature of these restrictions can lead to feelings of illegitimacy of a system in
which serving one’s time is not enough, thus leading individuals to reject the system and
engage in criminal activities (Manza and Uggen 2006, Tyler 2006). The formalization of
these restrictions as laws could also foster stigmatization by the public by formally
designating former offenders with a permanent “outsider” status, and this stigmatization
could extend to stigmatizing communities with high rates of parolees.
Social disorganization theory is particularly well suited to explaining the
relationship between collateral consequences and rates of returns to crime. Social
disorganization theory would predict a positive relationship between harsh collateral
This document is a research report submitted to the U.S. Department of Justice. This report has not been published by the Department. Opinions or points of view expressed are those of the author(s)
and do not necessarily reflect the official position or policies of the U.S. Department of Justice.

45
consequence laws and rates of returns to prison due to the effect of these laws on the
community, and the resulting inability of the community to prevent criminal activities.
Collateral consequences contribute to the economic problems of the community by
making it difficult for individuals with a criminal history to find stable employment, thus
increasing levels of poverty within the community. Similarly, restrictions on public
housing and the availability of criminal history records can make it more difficult for a
person to attain affordable, stable housing contributing to higher rates of family
breakdown and population movement. By restricting access to public housing, many
offenders are not able to return to living with their families. Returning offenders may
also be unable to provide financial assistance to the family, and are more likely to be a
drain on the families’ finances, thus leading to greater tension in these relationships (Berg
and Huebner 2011; Huebner and Berg 2011). This is likely to make it difficult for
individuals to rekindle and maintain positive pro-social bonds to significant others, or to
form a strong commitment to pro-social activities such as employment. These laws can
thus be expected to reduce the social cohesion within the community. This contributes to
the social disorganization of the community and the resulting weak controls contribute to
the high crime rates of these communities. Individuals returning to these communities
are thus more likely to return to prison due to the low collective efficacy in the
community, that is, the low levels of social cohesion among neighbors and their
collective willingness to intervene on behalf of the common good (Sampson,
Raudenbush, and Earls 1997).
Within the traditional of social disorganization, Rose and Clear (1998) emphasize
the role of coercive mobility, that is removing individuals from the community through
This document is a research report submitted to the U.S. Department of Justice. This report has not been published by the Department. Opinions or points of view expressed are those of the author(s)
and do not necessarily reflect the official position or policies of the U.S. Department of Justice.

46
incarceration, and that this removal further destabilizes the community and weakens its
ability to engage in informal social control. The coercive mobility hypothesis
emphasizes the role of both removing young residents from the community to
incarceration, as well as the destabilizing effect of individual reentering the community
from prison. They argue that the families and social networks in communities that receive
high rates of individuals returning from incarceration expend their already limited
interpersonal and social resources to assist these individuals. In keeping with coercive
mobility, collateral consequence laws would be expected to have a negative effect on the
community’s economic structure, family stability, parental capacity, and pro-social
beliefs. As in coercive mobility, while each of these individual effects would be expected
to be small, they are expected to be cumulative. Collateral consequence laws would
increase the demands on family and community resources, while limiting the subsequent
contributions these individuals can make to the community. Collateral consequences
would be expected to maintain this destabilization as people returning to the community
struggle with issues of employment and housing and are unable to help the community
build the social networks needed to maintain social control (Clear 2007).
While the majority of criminological theories support a positive relationship
between the harshness of collateral consequence laws and high rates of return to prison,
there is also the potential that collateral consequence laws could have a deterrent effect
on crime rates. Deterrence theory suggests that people are deterred from crime when
they perceive the risk of being caught, and the severity of the potential punishment as
being too high. It is possible that collateral consequence restrictions could serve as an
additional cost of engaging in criminal activity thus deterring potential offenders. Thus
This document is a research report submitted to the U.S. Department of Justice. This report has not been published by the Department. Opinions or points of view expressed are those of the author(s)
and do not necessarily reflect the official position or policies of the U.S. Department of Justice.

47
when a person is considering committing a criminal act s/he would not only consider
potential jail or prison time, but would also consider the loss of voting rights,
employment restrictions, loss of access to public housing and welfare, loss of her/his
driver’s license, as well as the creation of a criminal record. However, in applying this
view there are several items to consider. First, collateral consequences could depress
crime rates of first time, potential offenders, but they would not be expected to have a
specific deterrent effect on re-entering offenders as many of the consequences are
triggered by a first offense and do not increase with subsequent offending. Thus any
deterrent effect would only be among people with no criminal record, and this potential
effect on crime rates may not outweigh the effect of these laws on returning offenders.
Second, considering that many people are unaware of these consequences prior to
conviction, and in fact, many are unaware until after their release from custody, it is
unlikely to serve as a general deterrent from crime since even if potential offenders were
to consider the effect of their criminal actions on their future chances for housing,
employment or voting, many are unaware that these consequences exist (Travis, 2002).
Third, the deterrent effect of collateral consequences may be seen as fairly minor
additional cost compared to potential costs of crime such as prison. Fourth, from a wider
rational choice perspective, there are many aspects of the decision making process which
collateral consequences do not effect, such as the rewards of criminal activity. As
previously discussed, collateral consequences may also lower the social or economic
disincentives to crime. The delayed nature of collateral consequence restrictions
(imposed after serving a sentence), combined with decreasing the cost of secondary
offending (there is less to lose since by blocking access to conventional systems such as
This document is a research report submitted to the U.S. Department of Justice. This report has not been published by the Department. Opinions or points of view expressed are those of the author(s)
and do not necessarily reflect the official position or policies of the U.S. Department of Justice.
48
employment, or making contact with family more difficult due to housing restrictions)
can make crime less unattractive than if these blocks were not in place. Thus, while
rational choice theory could indicate that collateral consequence laws might have a
deterrent effect on initial crime, in terms of its effect on rates of return to prison these
laws would potentially decrease the costs associated with crime (by disrupting contact
with families or employment) and would not deter secondary crime as additional crime
would not incur any further costs in terms of additional collateral consequences.
Most criminological theories are consistent with the expectation of a positive
relationship between the burdens imposed by collateral consequence laws and rates of
return to prison. Given that the data used in this study is aggregate level data, it is not
possible to test the individual level processes that take place. Instead, this study will
examine the impact of these policies at the state level.
Research on collateral consequences and recidivism
Despite strong reasons to expect that collateral consequences may increase
recidivism, as of yet, there is scant evidence of the effect of collateral consequence laws
on the outcome of returns to prison. One notable exception to this dearth of research is
Lee (2011). Lee compared states based upon when criminal background checks became
available online and found that online availability of background checks was associated
with a 2.5% drop in aggregate property crimes, but that it had an insignificant
relationship with violent crime. However, using data from the Department of Justice
National Corrections Reporting Program (NCRP) Lee found that online records increased
the likelihood of a prisoner admitted for a new crime having a prior felony record by
11%, and that a parolee is 10% more likely to be returned to prison. This provides
This document is a research report submitted to the U.S. Department of Justice. This report has not been published by the Department. Opinions or points of view expressed are those of the author(s)
and do not necessarily reflect the official position or policies of the U.S. Department of Justice.

49
preliminary evidence of a modest general deterrent effect (for some crimes) but that it is
accompanied by higher rates of recidivism.
The bulk of available research on the effect of collateral consequences on
recidivism comes from the effect of sex offender registration and notification laws and
indicates mixed results, with some reporting reductions in offending (Duwe and Donnay,
2008), some reporting higher recidivism rates (Freeman, 2009), some reporting no
differences (Letourneau et al 2008; Letourneau et al, 2010; Sandler et al 2008;
Tewksbury and Jennings, 2010) and some reporting mixed findings (Prescott & Rockoff,
2008). In addition, research indicates that sex offenders fear and experience negative
outcomes as a result of registration and community notification laws – such as social
stigmatization, employment, housing, and verbal and physical assaults, (Levensen and
Cotter, 2005; Mercado et al, 2008; Tewksbury, 2005; Zgoba et al, 2009).
Another limitation of existing recidivism research, as well as research on
collateral consequence laws, is that with only a few exceptions, previous studies have
been restricted to individual counties or to a single state and have not examined the
factors that affect variations across states. Thus, the current project provides unique
insight into whether state-level differences in collateral consequence laws are a key
contributing factor behind variations in rates of returns to prison across U.S. states.
Conclusion
While many researchers, practitioners and policy makers have expressed concern
that collateral consequences hinder ex-offender reintegration and therefore make a return
to criminal activity more likely, as of yet there is a dearth of evidence to support this
This document is a research report submitted to the U.S. Department of Justice. This report has not been published by the Department. Opinions or points of view expressed are those of the author(s)
and do not necessarily reflect the official position or policies of the U.S. Department of Justice.

50
claim and it is possible that collateral consequences have a spurious or null relationship
with recidivism, or that they could in fact act as a deterrent. For instance, Western
(2008), in his policy response to Stoll and Bushway (2008), suggested that the
availability of background checks may be less important than the fact that the ex-
offenders subject to background checks tend to have a history of entrenched marginality
that already serves as a barrier to employment. It is also possible that even without
formal restrictions on employment that ex-offenders are likely to face discrimination in
hiring. Some also suggest that collateral consequences may serve as a deterrent as first-
time offenders will want to avoid having a criminal record (Lee, 2011) and thus while
removing these collateral consequences could lower recidivism, it may increase overall
crime. And finally, there is also the concern that the removal of some of these barriers
could have unfortunate consequences. For instance, removing restrictions on public
housing could result in more drug problems and higher crime rates in public housing
units, removing or limiting background checks could result in dangerous criminals
gaining employment with vulnerable populations or could result in employers engaging
in statistical discrimination against certain populations in an attempt to avoid hiring ex-
offenders. Thus there is a great need for empirical evidence regarding the relationship
between collateral consequences and crime.
A first step in examining the relationship between collateral consequence laws
and crime, is determining whether these laws are associated with higher rates of returns
to prison, as several scholars have speculated. This dissertation will examine this
relationship, investigating three hypotheses. First, that harsher collateral consequence
laws in the categories of voting, access to records, employment, public housing, public
This document is a research report submitted to the U.S. Department of Justice. This report has not been published by the Department. Opinions or points of view expressed are those of the author(s)
and do not necessarily reflect the official position or policies of the U.S. Department of Justice.

51
assistance and restrictions on drivers’ licenses will be related to higher rates of returns to
prison for new crimes. Second, that harsher collateral consequence laws in these
categories will be associated with higher rates of returns to prison for technical violations
of parole. Third, that these laws will vary in the magnitude of their relationship with rates
of returns to prison based upon whether they have an impact on daily living and whether
they are applied to all offenders.
This document is a research report submitted to the U.S. Department of Justice. This report has not been published by the Department. Opinions or points of view expressed are those of the author(s)
and do not necessarily reflect the official position or policies of the U.S. Department of Justice.

52
Chapter 3: Data and Methods
This project aims to address three hypotheses. First, that harsher collateral
consequence laws will make it more difficult for a person leaving prison to abstain from
crime, and thus states that have a greater number of, and stricter, collateral consequence
laws will have higher rates of returns to prison for new crimes. Second, that harsher
collateral consequence laws also make it more difficult to abide by conditions of parole,
such as maintaining employment or stable housing and will lead to increases in technical
violations of parole for failing to meet the conditions of release. Third, collateral
consequence laws will vary in the effect that they have on rates of returns to prison.
Specifically, laws with a broader reach that affect day to day living (e.g., restrictions of
all felons on employment) will have a greater effect than those that are limited in terms of
who they affect (e.g., public housing restrictions for drug offenders only) or that have less
impact on day to day living (e.g., voting restrictions).
Law Application: Applies to all (all) offenders, or only some (restricted),
or mixed (mixed) based on the state
Law Reach: Likely to affect daily living (daily) or only occasional
situations (limited)
Application Reach
Voting All Limited
Access to records All/Mixed Daily
Employment Mixed Daily
Housing Restricted Daily
Public Assistance Restricted Daily
Driver's License Restricted/Mixed Daily
This document is a research report submitted to the U.S. Department of Justice. This report has not been published by the Department. Opinions or points of view expressed are those of the author(s)
and do not necessarily reflect the official position or policies of the U.S. Department of Justice.

53
Data
The units of analysis for this study are US states. Data come primarily from two
sources. The independent variables, the collateral consequences faced by convicted
felons, are based upon the laws and practices of each state which were coded primarily
through reference from the Legal Action Center’s (LAC) review of laws in their
“Roadblocks to Reentry” module with reference to the actual laws as needed. The
dependent variables have been drawn from two separate surveys published by the Bureau
of Justice Statistics’ (BJS), specifically the prisoner survey and parole survey.
Independent Variables: State Collateral Consequence Laws and Practices
State collateral consequence laws have been notoriously difficult to catalog as
they are dispersed through states administrative, civil, and criminal codes (Love 2006;
Mauer 2010). These laws can also be quite complex, making comparison between states
difficult due to the wide variation in laws between states (Love, 2006; Mauer, 2010). As
a testament of the complexities of these laws, in 2009, NIJ awarded over $700,000 to the
American Bar Association (ABA) to fund a 3 year project to collect information on these
restrictions and to make them more transparent to defense lawyers, judges and
defendants. By February 23, 2012 they had compiled over 38,012 statutes, and had not
yet collected data from all the states.19
The LAC first compiled a review of state collateral consequence laws in 2004,
which they updated in March 2009. While the LAC does not attempt to catalog all
19
http://www.abacollateralconsequences.org As of October 9, 2013, the ABA data had information
available on 26 states.
This document is a research report submitted to the U.S. Department of Justice. This report has not been published by the Department. Opinions or points of view expressed are those of the author(s)
and do not necessarily reflect the official position or policies of the U.S. Department of Justice.

54
collateral consequence laws, they have collected information on a subset of laws which
have features that can be compared between states and that are particularly salient in their
repercussions. Researchers have begun turning to the LAC database as an important
source of information for these laws. Bushway (2004) used the database for his analysis
on the effects of records checks, and Finlay (2009) used it as a source for internet access
of records. I used the LAC database as a starting point for coding and I accessed the
original state laws as necessary to complete the coding. In this current study, I include
information on laws related to voting, access to criminal records, employment, public
housing, public assistance, and drivers’ licenses. This has resulted in the creation of a
unique dataset providing specific information of these laws by state, such as whether the
restriction is permanent, temporary, or can be petitioned for removal, or whether the
restriction is triggered by conviction or merely by arrest, among other characteristics (see
Table 1 for coding notes).20
This will allow an analysis to be conducted on the effect of
particular categories of laws, for instance the effect of collateral consequence laws related
to employment versus voting, dimensions of those laws, as well as a combined score of
the cumulative effect of all of the laws.21
I have identified 21 dimensions across six
categories of laws for 2009.22
Laws are coded so that higher numbers indicate harsher
20
The LAC currently employs its own ranking of states however I employ my own coding of the laws in
order to allow a more nuanced examination that includes analysis specific characteristics of the laws. 21
It should be noted that while this coding attempts to properly categorize states based upon their law and
practices, in many cases there is no way to capture the reality. Laws may be misinterpreted by policy
makers, for instance South Dakota settled a case in 2010 in which they had improperly barred persons on
probation from voting (projectvote.org 2010) . In addition to administrative mistakes, ex-offenders
themselves may not be fully informed of their rights. For instance, Manza and Uggen (2006) document
several ex-offenders that believed they were ineligible to vote when in reality their voting rights had been
restored. 22
Ultimately three dimensions were dropped from the analyses, as will be discussed later.
This document is a research report submitted to the U.S. Department of Justice. This report has not been published by the Department. Opinions or points of view expressed are those of the author(s)
and do not necessarily reflect the official position or policies of the U.S. Department of Justice.

55
characteristics of the law, while lower numbers indicate more lenient laws.23
Coding of
these laws can be found in Table 1, following the descriptions of these laws.
Coding of Collateral Consequence Laws
Voting
Comparison of voting restrictions between states is relatively straightforward in
that restrictions have only one dimension – the length of time which people must wait
until voting rights are restored. Coding began with a review of the LAC coding, and was
then compared with other sources, including Uggen et al, 2012. Discrepancies were
investigated and resolved by a review of the laws as available through Lexis-Nexus,24
and
ultimately matched the coding found in Uggen et al, 2012. Restrictions range from
permanent ineligibility to vote following a conviction to no restrictions on voting for
anyone (including those currently incarcerated). The largest category is states that
restrict inmates, parolees, and probationers from voting (19 states). While most states bar
only people convicted of a felony from voting, five states, Colorado, Illinois, Michigan,
South Carolina, and Maryland, bar anyone currently serving time, whether the offense
was a misdemeanor or a felony (Ewald, 2005).
23
Originally the intention was to create aggregate measures of these laws within each category, as well as
an overall measure of all measured collateral consequence laws, and factor analysis was employed in an
attempt to create these measures. However, initial analyses indicated that this would not be appropriate.
Many laws were negatively correlated with each other, even when they were in the same category of law.
In addition, many laws had contradictory effects with the dependent variable. 24
Two states, Louisiana and South Dakota, were particularly difficult to categorize. Despite language in
the Louisiana Constitution that states restrictions occur while “under an order of imprisonment for
conviction of a felony,” in practice “imprisonment” is interpreted to include probation and parole (Ewald,
2005). Similarly, while South Dakota law appears to allow the right to vote as long as a person is not
currently incarcerated, in practice it is extended to persons on probation, but not those on parole.
http://felonvoting.procon.org/sourcefiles/south-dakota-felon-voting-law-2012.pdf
This document is a research report submitted to the U.S. Department of Justice. This report has not been published by the Department. Opinions or points of view expressed are those of the author(s)
and do not necessarily reflect the official position or policies of the U.S. Department of Justice.

56
Access to Criminal Records
Access to criminal records was the category of law with the highest number of
dimensions coded with seven dimensions. The first dimension of access to criminal
records is the availability of online records; specifically, whether the state puts all
criminal records available online or only the records of people that are currently under
supervision, or whether records must always be requested in person or by mail to a state
agency.25
The second dimension of access to records is whether or not they have a time
limit on arrests not leading to conviction. Most commonly this involves states removing
arrests from the record after a period of time if there is no subsequent disposition,
frequently these are disposed after one year, although it may be as soon as 30 days
(Alabama) or as long as three years (North Dakota).26
In a few rare instances, states will
expunge arrest records that have resulted in conviction after a period of time following
25
While my coding of online availability was based upon information provided through the Legal Action
Center, I also conducted an in independent search to confirm this information. Specifically, I would go to
each state’s website and search for the last name “Smith” in the online database. Since “Smith” is the most
common surname in the US I would then search all the people with “Smith” as a last name to see if anyone
by that name had completed his/her sentence or was currently on probation or parole. Using this process I
ultimately found five states which were incorrectly marked by the LAC as not having online records (AZ,
CT, ID, NE and RI). I also compared my coding to the coding in a recent paper by Lee (2011). In it I
found 4 discrepancies in the coding; 3 were cases in which Lee reported no internet availability whereas my
data reported online records (AK, ME and MO), and 1 reported online availability whereas my data
indicated it was not available (DE). Through correspondence with Lee, I learned that two states were
incorrectly reported in her paper (DE and ME), that she did not include AK as having online availability as
the database is incomplete and does not include cases prior to 1990, and that she did not include MO as it
came online after she started her research. Although Alaska does not have complete records I have chosen
to include it in the category of having online availability since in 2009 it would have had 19 years worth of
cases. Since offenders are most likely to recidivate in the years immediately after their release I believe
that this database covers a large proportion of released ex-offenders. 26
A few states remove arrests from the record after a certain age, such as age 75 in South Carolina or age
99 in Arizona and New Mexico. As the removal of arrest records at this advanced age is unlikely to affect
the reintegration of the majority of returning offenders, these states were coded as having no time limit for
the removal of records.
This document is a research report submitted to the U.S. Department of Justice. This report has not been published by the Department. Opinions or points of view expressed are those of the author(s)
and do not necessarily reflect the official position or policies of the U.S. Department of Justice.

57
completion of the sentence. For instance, in Montana arrests are removed seven years
after completion of the sentence. In Massachusetts, public access to Criminal Offender
Record Information (CORI) has different time limits based on whether the offense was a
misdemeanor, felony or sex offense. Some states, such as Alaska, remove access to
records not resulting in disposition, however employers dealing with vulnerable
populations, such as minors or adults, are still able to access the removed records.27
The third dimension of access to criminal records, related to the second
dimension, is whether there are time limits on access to conviction data.28
Seven states
remove convictions from criminal records after a certain number of years following
completion of the person’s sentence, generally 3 to 15 years, and usually with the
requirement that there are no subsequent arrests or convictions during that time.29
The fourth dimension of access to criminal records is the extent to which
information is available. For coding, this combines two aspects – who has access to
information, and what information they can access. For instance, in some states only
statutorily authorized government agencies, or employers that work with vulnerable
populations such as children or the elderly, have access to records, whereas in other states
records, including both arrests and convictions, are available to all members of the public.
27
Washington and Hawaii also keep the removed information, however these states were coded as having
removed arrest information since it is only available in limited circumstances. 28
New Mexico removes convictions from the record after the person reaches 99 years of age, North
Caroline at age 80, and Louisiana removes convictions after age 61 with no convictions in the last 15 years.
Since these ages are too advanced to make a significant impact on the bulk of offenders, they were coded as
having no conviction time limits. 29
Some states exclude sex offenses and sex offenders from these time limits.
This document is a research report submitted to the U.S. Department of Justice. This report has not been published by the Department. Opinions or points of view expressed are those of the author(s)
and do not necessarily reflect the official position or policies of the U.S. Department of Justice.

58
The fifth dimension of access to criminal records is whether or not there are
penalties in place for violating rules of disseminating criminal records. A state that has
penalties in place for violations, whether or not they institute the penalties, may be seen
as placing a greater premium on privacy regarding records.
The final two dimensions of access to criminal records relate to the availability of
expunging aspects of the record, either arrests (dimension 6) or convictions (dimension
7). These typically require the defendant to actively initiate the expungement process. In
the case of expungements for arrest, this option is typically reserved for only cases in
which the defendant was found to be factually innocent, resulted in a dismissal, or for
which were not prosecuted. In the case of expunging arrests, many states will then allow
the person to deny the existence of the arrest if asked about it. In some cases, states will
not grant an expungement if the person has previously expunged a record, or if the person
has similar arrests for similar crimes (for example, North Carolina, Indiana and West
Virginia). Typically, expungement of arrests is available one year after the arrest,
although in other cases it may be 18 months (Pennsylvania) to 3 years (Washington) after
the arrest, and in rare instances could be sooner (such as 30 days in Utah).
The rules regarding expunging convictions vary by state. Some limit
expungements to certain offenses, such as minor drug or non-violent offenses (Arizona
and Arkansas). In some cases expungements may still appear on the record, but with a
notation that they have been expunged (California). In many cases, the offender must
wait several years with no subsequent criminal activity in order to see expungement (for
instance, Indiana requires people to wait 15 years) and the waiting period may vary based
upon the severity of the offense (such as Massachusetts and Illinois). I do not include
This document is a research report submitted to the U.S. Department of Justice. This report has not been published by the Department. Opinions or points of view expressed are those of the author(s)
and do not necessarily reflect the official position or policies of the U.S. Department of Justice.

59
states when the expungement is only available for a case in which the person was
pardoned or the conviction was reversed.30
The dimension of access to criminal records that has been most heavily
scrutinized by scholars in recent years has been the online availability of criminal records
(Finlay 2009; Lee 2011). This area has also seen the greatest change as an increasing
number of states have started to post criminal records online, leading to a greater number
of records being easily accessible than ever before (BJS, 2011). However, other
dimensions of the availability of criminal records may be equally important, particularly
whether time limits exist for criminal records and who has access to criminal records.
For instance, many states allow for expungement of arrests that did not result in
convictions, and a few states allow for expungements of convictions after a certain
number of years. These expungements could offset the effect of having records available
online. The multiple dimensions involved with access to criminal records can make
comparison between states very difficult since a state may be very harsh on one
dimension, but forgiving on another aspect. For instance, while Montana allows any
member of the public access to arrest and conviction records, they also have an automatic
time limit in which no records are available seven years after the completion of a
sentence.31
30
I do not include Wyoming as having a expungement policy, as the expungement is only available in
order to obtain a firearm and does not apply to record searches that might be conducted by potential
employers. I also do not include Pennsylvania which requires the person to be over age 70. 31
Interestingly, while Montana does not expunge arrests not leading to conviction, it does allow that
“fingerprints and arrest photographs will be returned to individual if requested where an arrest does not
lead to the filing charges or where charges filed do not result in a conviction.” The record however remains.
This seems as though it would have a varying effect based on whether your name is common, such as John
Smith, or if it is a more unique name.
This document is a research report submitted to the U.S. Department of Justice. This report has not been published by the Department. Opinions or points of view expressed are those of the author(s)
and do not necessarily reflect the official position or policies of the U.S. Department of Justice.

60
Employment
Within the category of employment I coded six categories of laws. The first two
dimensions are whether employers can ask about arrests not leading to conviction, and
whether employers can consider arrests not leading to conviction. Most states allow
employers to both ask about and consider arrests not leading to conviction.32
The third and fourth dimensions related to employment are whether or not
standards are in place to prevent discrimination by public employers and licensing
agencies (dimension three) or by private employers (dimension four). Standards
prohibiting employment discrimination vary, but frequently when in place they state that
employment or a licensure or certificate of registration necessary for employment cannot
be flatly denied based upon conviction, although it still allows consideration of the
conviction in determining whether or not the person can be entrusted to serve in that
occupation. Some states specifically mention that serious drug offenses can serve as a
bar to employment or licensure (for example, Indiana). A state which allows an
employer to view arrests not leading to conviction, may still have standards prohibiting
how those arrests are used (for example, Kansas requires that they must directly bear on
the person’s trustworthiness or safety or well-being of the employer’s employees or
customers). Maine has limits considering records after a three or ten year period (based
on the type of license) and only allows certain types of convictions within that time
period to be considered. In Massachusetts, Governor Patrick issued an Executive Order
32
One potential concern is that criminal records may contain inaccurate information. Maryland is unique
in stating that employers must allow individuals to inspect and challenge their record, but in other states
applicants may be rejected based on faulty information in a criminal record – information of which they are
unaware.
This document is a research report submitted to the U.S. Department of Justice. This report has not been published by the Department. Opinions or points of view expressed are those of the author(s)
and do not necessarily reflect the official position or policies of the U.S. Department of Justice.

61
(EO 495) in 2007 which prohibits background checks of prospective or current
employees until after s/he is deemed qualified for employment.
Dimension five in the category of employment is whether there are restrictions on
employment in the field of home health care for people with criminal records. Most
states (38) restrict jobs in the home health care profession for anyone convicted of a
felony.
Finally, dimension six is whether the state offers a mechanism to demonstrate the
person has been rehabilitated. This could also be offered in stages. For instance, Illinois
courts may give a “certificate of completion” after a sentence has been satisfactorily
served. While this does not lift occupational bars, it offers a first step in demonstrating a
commitment to moving past a conviction. A person with no more than two non-violent
felony offense can apply for a “Certificate of Relief from Disabilities”. This Certificate
goes a step farther and prevents occupational licensing agencies in 27 categories from
denying licensure based on lack of good moral character unless there is a direct
relationship between the offense and the type of license sought, or issuance of the license
would involve unreasonable risk to property or public safety. Similarly, Connecticut has
a “provisional pardon” which is available immediately after discharge and removes the
occupational bars associated with the conviction, but does not remove the conviction
from the record. After a three year waiting period, the person may apply for a full pardon
which would remove the offense from the record. Mississippi does not offer any
certificate to lift occupational bars, but does offer a certificate to restore access to
firearms.
This document is a research report submitted to the U.S. Department of Justice. This report has not been published by the Department. Opinions or points of view expressed are those of the author(s)
and do not necessarily reflect the official position or policies of the U.S. Department of Justice.

62
Mechanisms to demonstrate rehabilitation vary widely. In some states it is a
fairly standard process going through a board of pardons, whereas in other states (such as
Indiana) the pardon must be granted by the governor. The effect of the mechanism may
also differ, in some states the offense remains on the record and does not lift occupational
bars, but merely acts as an additional piece of information (such as Indiana), whereas in
others it removes the offense from the record (such as Connecticut’s full pardon), or it
lifts occupational bars associated with the record, but the conviction remains on the
record (such as Iowa’s “Certificate of Employability”). In some cases, states technically
have a process for pardons, but they use it so rarely, or it has such severe restrictions, that
I have coded them as having no mechanism for relief (for instance Wisconsin and
Washington).
Unfortunately, I am unable to capture perhaps the most important dimension of
employment – how many and what jobs and licenses are restricted by these laws. This
information is simply too complex to categorize. For instance, depending upon the state
there can be bars against employment in multiple areas, including child care, education,
security, nursing, law, real estate, physical therapy, barbering and cosmetology to name
but a few. There are roughly 6,000 occupations requiring licensing in one or more states
in the US (Clear and Cole 2000), and so trying to count, much less rank, the reach of
these laws is quite difficult.33
33
It is possible that this unaccounted for variation of specific forms of employment or licensing may be
related to the dimensions of employment measured in this study. For instance, states that don’t restrict
many occupations may not offer a certificate of rehabilitation, whereas states with a multitude of
restrictions may be more likely to offer certificates of rehabilitation as a mechanism to deal with those
restrictions. It is important to keep this in mind when interpreting the results of the effect of employment
laws on rates of returns to prison.
This document is a research report submitted to the U.S. Department of Justice. This report has not been published by the Department. Opinions or points of view expressed are those of the author(s)
and do not necessarily reflect the official position or policies of the U.S. Department of Justice.

63
Public Housing
While federal law requires that criminal activity be included as a basis for
eviction from public housing it is up to local housing authorities to set their own
standards and policy regarding admissions and evictions. The Legal Action Center
collected information from the public housing authority of the most populous city in the
state. Since it is well-documented that most parolees return to a few core counties, which
are generally located in the largest cities of the state, this should account for a significant
proportion of a state’s parolee population.
I coded three dimensions within the category of public housing. First, whether
the housing authority considers arrests in the screening process, or if they only include
convictions. Second, whether the housing authority makes individual determinations for
all cases or whether they automatically reject ex-offenders with certain offense
convictions.34
While only two housing authorities report that they have automatic
exclusions, ten housing authorities report that they have individual determinations for
most cases but not all (for instance the Birmingham housing authority of Alabama reports
an automatic bar for those convicted of drug trafficking), or that they have an appeal
process in place when a person is denied (for instance the Chicago housing authority of
Illinois).
The third dimension in the category of housing collateral consequence law is the
length of the longest conviction bar (excluding the mandatory bar for certain sex
34
Federal law requires that all federal housing agencies permanently bar individuals convicted of certain
sex offenses, or of methamphetamine production. Since there is no variation in this restriction, I do not
include it in my analysis.
This document is a research report submitted to the U.S. Department of Justice. This report has not been published by the Department. Opinions or points of view expressed are those of the author(s)
and do not necessarily reflect the official position or policies of the U.S. Department of Justice.

64
offenders or for methamphetamine manufacturing), categorized by no conviction bar,
conviction bar ranging from 2-3 years, to 5-7 years, or to 10 years or more. Some states
state that they do not have any set time limits because they consider evidence of
rehabilitation.
Public Assistance
Public Assistance is coded has having one dimension, the extent to which the state
adopted the 1996 Personal Responsibility and Work Opportunity Reconciliation Act ban
on Temporary Assistance for Needy Families (TANF) and food stamps for felony drug
offenders. States have the option to opt out of, modify, or adopt the federal drug felon
ban on TANF and food stamps. Coding of the laws as of 2009 was based on reference to
the LAC report, along with the “Welfare Rules Database” compiled by the Urban
Institute. Contradictions between the two reports were investigated by searching
information on state websites administering TANF. Ultimately, ten states we coded as
having chosen to opt out of the law, while 29 modified the ban in 2009. While there are a
multitude of ways that states might modify the law, including limiting the ban to only
certain drug offenses (such as drug trafficking) or setting time limits on the ban, the most
common modification was to reinstate benefits for individuals that participate in drug
treatment programs. For instance, in Kansas a person may receive benefits if s/he has
been evaluated by a licensed substance abuse provider as not needing treatment, is
currently undergoing treatment, or has successfully completed treatment. Some states
acknowledge the long waiting lists and lack of availability of drug treatment programs,
and also lift the ban if the person is on a waiting list for a drug treatment program (such
as California). Modified laws don’t always require the person to undergo treatment,
This document is a research report submitted to the U.S. Department of Justice. This report has not been published by the Department. Opinions or points of view expressed are those of the author(s)
and do not necessarily reflect the official position or policies of the U.S. Department of Justice.

65
sometimes they must only comply with probation or parole requirements which may or
may not require treatment (for instance, Pennsylvania and South Dakota). Sometimes
other exemptions are allowed as well – for instance in Kentucky the ban can be lifted for
pregnancy. Massachusetts removed the ban related to food stamps, and limited the
welfare ban to 12 months. Massachusetts also allows exemptions for the 12 month ban in
the case of disability, being a caregiver for a disabled child or spouse, those in the third
trimester of pregnancy or that have a child under 2 years of age, or those who are under
twenty-one years of age and are attending high-school full-time.
In addition to coding laws restricting TANF across states in 2009, I also coded
TANF laws across the states for the four year period following the 1996 Personal
Responsibility and Work Opportunity Reconciliation Act. This allows for a look at the
effect of these laws within states. In order to categorize the laws over this time period, I
compared data from several sources, including the LAC 2004 report, the “Summary of
State Laws” provided as part of the LAC “Opting out of federal ban on food stamps and
TANF Toolkit”, the 2005 Government Office of Accountability report, “Drug Offenders:
Various factors may limit the impact of federal laws that provide for denial of selected
benefits” and the “Welfare Rules Database” compiled by the Urban Institute.
Contradictions between the different sources were resolved by looking at information on
state websites, and in some cases contacting the authors of the reports.
Driver’s License
Collateral consequence laws related to restrictions of driver’s licenses are coded
on three dimensions. The first dimension is whether revocation of driver’s licenses occur
for all drug offenses or only for driving related offenses. The second dimension is
This document is a research report submitted to the U.S. Department of Justice. This report has not been published by the Department. Opinions or points of view expressed are those of the author(s)
and do not necessarily reflect the official position or policies of the U.S. Department of Justice.

66
whether or not the state offers a restrictive license to allow a person to drive to work,
school, or health related reasons (such as attending drug or alcohol treatment). The third
dimension is whether the state uses the federally recommended restriction of 6 months, or
whether they have instated a revocation period that lasts longer than six months for non-
driving drug related offenses.
The coding of all collateral consequence laws can be found in Table 1.35
Table 1: Coding Dimensions for Collateral Consequence Laws
Higher numbers indicate harsher laws
Voting (Periodic effect, all offenders)
1 dimension
Length of time until voting rights restored
2
13
4
17
14
1 incarcerated persons can vote
2 can vote once released (while on probation or parole)
3 can vote on probation, not parole
4 can vote once completed all supervision
5 can vote after set waiting period after supervision, or need to petition, or permanently ineligible
Access to Records (Daily effect, all offenders)
7 dimensions
19
5
26
Available on internet
0 Not available on internet
.5 Only parole, probation or incarcerated available online
1 Available on internet
21
29
Automatic time limit for arrests not leading to conviction
0 Automatic time limit for arrests not leading to conviction
1 Arrests not leading to conviction remain on criminal record
6
44
Automatic time limit for convictions
0 Automatic time limit for convictions following period with no subsequent arrests
1 No time limit on convictions
35
The numerical codes applied to these laws represents but one possible way to transform these laws into
empirical data. As a test on the sensitivity of the analyses to this coding I also tested other coding schema –
for example, constraining the measure of “online availability of records” to a binary measure. The results
based on these different coding schema were comparable to what is presented here, and I chose to use the
measures which I believe best capture the impact of these laws.
From a statistical standpoint however, it is more defensible to code laws that are not binary using dummy
variables as this avoids the assumption inherent in creating interval measures that the effects are equally
spaced. I address this aspect in greater depth in the chapter on Findings.
This document is a research report submitted to the U.S. Department of Justice. This report has not been published by the Department. Opinions or points of view expressed are those of the author(s)
and do not necessarily reflect the official position or policies of the U.S. Department of Justice.
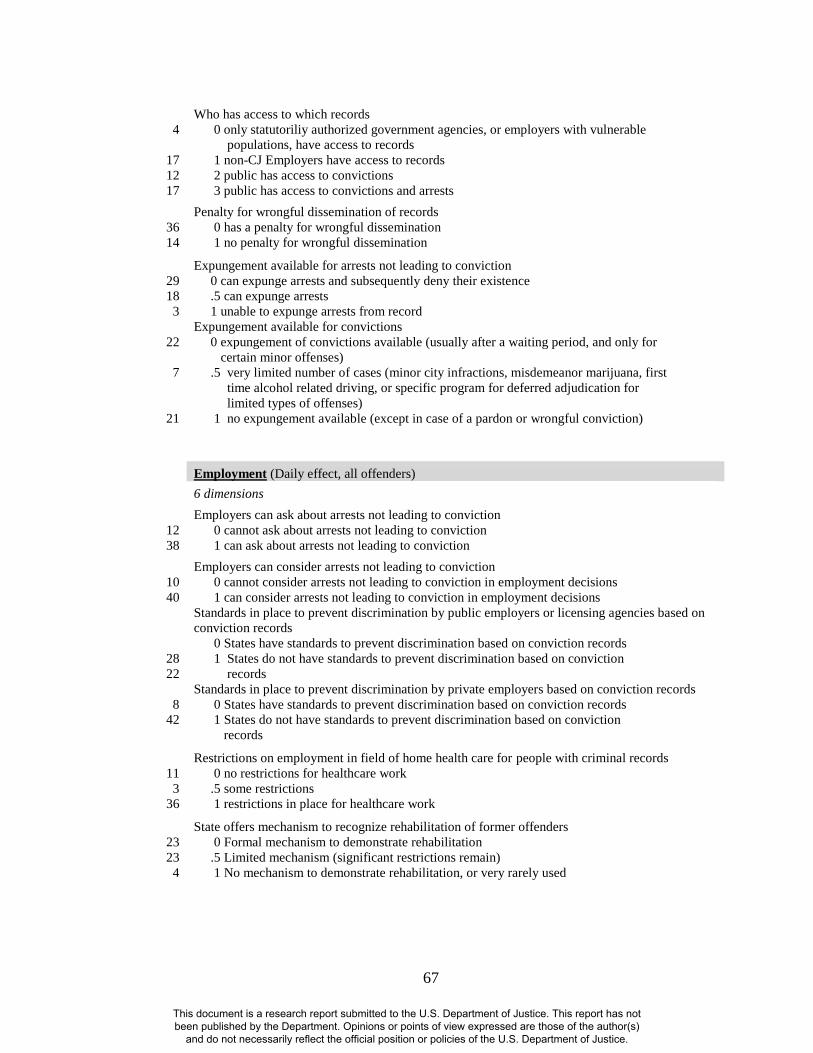
67
4
17
12
17
Who has access to which records
0 only statutoriliy authorized government agencies, or employers with vulnerable
populations, have access to records
1 non-CJ Employers have access to records
2 public has access to convictions
3 public has access to convictions and arrests
36
14
Penalty for wrongful dissemination of records
0 has a penalty for wrongful dissemination
1 no penalty for wrongful dissemination
29
18
3
Expungement available for arrests not leading to conviction
0 can expunge arrests and subsequently deny their existence
.5 can expunge arrests
1 unable to expunge arrests from record
22
7
21
Expungement available for convictions
0 expungement of convictions available (usually after a waiting period, and only for
certain minor offenses)
.5 very limited number of cases (minor city infractions, misdemeanor marijuana, first
time alcohol related driving, or specific program for deferred adjudication for
limited types of offenses)
1 no expungement available (except in case of a pardon or wrongful conviction)
Employment (Daily effect, all offenders)
6 dimensions
12
38
Employers can ask about arrests not leading to conviction
0 cannot ask about arrests not leading to conviction
1 can ask about arrests not leading to conviction
10
40
Employers can consider arrests not leading to conviction
0 cannot consider arrests not leading to conviction in employment decisions
1 can consider arrests not leading to conviction in employment decisions
28
22
Standards in place to prevent discrimination by public employers or licensing agencies based on
conviction records
0 States have standards to prevent discrimination based on conviction records
1 States do not have standards to prevent discrimination based on conviction
records
8
42
Standards in place to prevent discrimination by private employers based on conviction records
0 States have standards to prevent discrimination based on conviction records
1 States do not have standards to prevent discrimination based on conviction
records
11
3
36
Restrictions on employment in field of home health care for people with criminal records
0 no restrictions for healthcare work
.5 some restrictions
1 restrictions in place for healthcare work
23
23
4
State offers mechanism to recognize rehabilitation of former offenders
0 Formal mechanism to demonstrate rehabilitation
.5 Limited mechanism (significant restrictions remain)
1 No mechanism to demonstrate rehabilitation, or very rarely used
This document is a research report submitted to the U.S. Department of Justice. This report has not been published by the Department. Opinions or points of view expressed are those of the author(s)
and do not necessarily reflect the official position or policies of the U.S. Department of Justice.

68
Housing (Daily effect, select offenders)
3 dimensions
21
29
Housing Authority considers arrests in screening process
0 does not consider arrests in screening process
1 does consider arrests in screening process
38
10
2
Housing Authority makes individual determinations for all cases
0 makes individual determinations for all cases
.5 makes individual determinations for most cases, or have appeal process for
automatic denial
1 has mandatory bars
9
19
11
11
Length of longest conviction bar
does not include permanent bans for federal restrictions (meth production on
premises, sex offenders)
0 no conviction bars
1 longest conviction bar ranges from 2-3 years
2 longest conviction bar ranges from 5-7 years
3 longest conviction bar ranges from 10-permanent
Public Assistance (Daily effect, drug felons)
1 dimension
Adopted federal drug felon ban
10
29
11
1 opted out of ban
2 Modified the ban
3 Comply with federal ban, no modifications
Driver's License (Daily effect, limited group)
3 dimensions
22
28
Automatic revocation only for driving related offenses
0 only for offenses related to operating a vehicle under the influence
1 also revoked for other crimes
40
10
Offer restrictive license for school/work
0 offer a restrictive license
1 do not offer a restrictive license
44
6
Longer than 6 month restriction for non-driving drug related
0 no revocations longer than 6 months for non-driving related
1 revocations longer than 6 months for non-driving related
Dependent Variables: Bureau of Justice Statistics Prisoners Data and Parole Data
Data on the dependent variable, rates of returns to prison, comes from data
provided by the Bureau of Justice Statistics (BJS). Information on state rates of returns to
prison, as well as on characteristics of the prison population and of the prisons has been
obtained from the Bureau of Justice Statistics, specifically from the National Prisoner
This document is a research report submitted to the U.S. Department of Justice. This report has not been published by the Department. Opinions or points of view expressed are those of the author(s)
and do not necessarily reflect the official position or policies of the U.S. Department of Justice.

69
Statistics (NPS) and the Annual Parole Survey. The strength of both the prison and
parole survey is that they are not limited to a particular geographic area, but instead cover
the entire US. While both provide information on rates of returns to prison, they do so by
different avenues. The prison survey includes counts of all persons entering prison, and
whether they are entering while on conditional release, whereas the parole data provides
information on what percentage of people exiting parole returned to prison. While BJS
provides guidance on how states should report their numbers in both surveys, variation
between states in definitions, policy and practices may lead to some variation in the
numbers they supply creating the concern that reported rates of return to prison are a
reflection of these differences. To address this concern I will conduct separate analyses
using as the dependent variable rates of return to prison from both the NPS and parole
data. As rates of return are calculated differently within states by each agency, agreement
in the trends between the datasets can minimize this concern.
National Prisoner Statistics (NPS) Data
That National Prisoner Statistics (NPS) compiles data regarding the prison
population of each state. The US Census Bureau serves as the data collection agent for
the BJS, and they administer a survey to each state’s Department of Corrections on an
annual basis. The survey collects information on key characteristics of each state’s prison
population, such as year-end prison counts, admissions and releases during the year,
prison system capacity, and HIV/AIDS. An advantage of this data is that it is provided by
each state and the federal system and thus covers all prison inmates in the US. This data
allows me to examine the rates or returns to prison as all entrants to prison are
categorized as either new commitments or violators of conditional release. Thus, my first
This document is a research report submitted to the U.S. Department of Justice. This report has not been published by the Department. Opinions or points of view expressed are those of the author(s)
and do not necessarily reflect the official position or policies of the U.S. Department of Justice.

70
dependent variable is the percent of the state’s admissions to prison in 2010 that are
categorized as returns from conditional release.36
DV 1: Percent of the state’s admissions to prison in 2010 that are
categorized as returns from conditional release.
Violators of conditional release include anyone that was on conditional release
when returned to prison, whether the return was for a new crime or for a technical
violation of parole.37
A categorization of “new commitment” does not mean that the
person does not have a criminal history, but rather that they were not on any type of
conditional release when the current offense occurred. States vary greatly in the extent to
which they release offenders conditionally and this affects the number of offenders that
are eligible to be counted as “returns” to prison. The prison data reports the number of
people released from prison each year, and what percentage of those releases were
released conditionally, unconditionally, or by other reasons (transfers, deaths, etc). 38
In
order to control for differences by state in the use of conditional release, whenever I use
the dependent variable from the prison data I also include a control for the percent of
releases in the previous year that were conditional.
36
Ideally I would be able to test the percent of releases in a given year that are later returned to prison.
Unfortunately, based on how the data are structured, this is not possible, as we cannot control for what year
the person returned to prison was initially released. The individual-level BJS recidivism data, which is not
yet available, does report the percent of releases that are returned to prison. 37
This does not include probation violators entering prison on the probated sentence, probation violators
are counted as new court commitments. 38
Included in BJS’s definition of conditional release is “discretionary parole, mandatory parole, post-
custody probation, and other unspecified conditional releases”.
This document is a research report submitted to the U.S. Department of Justice. This report has not been published by the Department. Opinions or points of view expressed are those of the author(s)
and do not necessarily reflect the official position or policies of the U.S. Department of Justice.

71
Parole Survey
The US Census Bureau serves as the data collection agent for the BJS Parole
Survey, and collects the information annually from parole agencies. The data includes
information on the year-end and year beginning parole population counts, entries and
exits to parole, and characteristics of the parole population such as maximum
incarceration, gender, race, offense type and supervision status. The survey covers all
persons under parole in a given year.39
Although this data does not include individuals
that were not released on conditional release, approximately 80% of released prisoners
are released to parole supervision (Hughes and Wilson BJS, 2010), so it accounts for the
majority of people released from prison. Although many states have moved to
determinate sentencing, all states report some amount of conditional release, with 47
states reporting a third or more of their prisoners released as being on “conditional
release.”
Within the parole survey, each state reports the number of exits from parole,
along with whether the exit was categorized as a successful or unsuccessful completion.
Unsuccessful completions include returns to incarceration, absconders, and “other”
unsatisfactory completions40
. An advantage of this data is that it distinguishes between
returns to incarceration from parole that are due to a technical violation versus those that
39
The Parole Survey is part of a larger series that contains information on the probation and parole
populations of each state. Parole data is collected, and can be accessed separately, from probation data,
although they are both reported as part of the same series. The current research only uses data from the
parole portion of the series. 40
According to BJS this includes “parolees discharged from supervision who failed to meet all conditions
of supervision, had their parole sentence rescinded, or had their parole sentence revoked but were not
returned to incarceration because their sentence was immediately reinstated, and other types of
unsatisfactory exits. Includes some early terminations and expirations of sentence.”
This document is a research report submitted to the U.S. Department of Justice. This report has not been published by the Department. Opinions or points of view expressed are those of the author(s)
and do not necessarily reflect the official position or policies of the U.S. Department of Justice.

72
are returned with a new sentence from a new crime. This is of particular interest as
collateral consequence laws may make it more difficult for a person to comply with the
conditions of release, such as maintaining employment, stable housing or paying child
support. Thus even if collateral consequence laws do not impact rates of recidivism, they
are still of interest if they result in higher rates of return to prison through technical
violations, as these represent a high cost to the states which then must support the prison
population.41
As a result, I will run analyses based upon the number of all returns to
incarceration, as well as for technical violations and new crimes separately. 42
DV 2: Percent of exits from parole for a state that are returned to prison.
DV 3: Percent of exits from parole for a state that are returned to prison
for a new sentence.
DV 4: Percent of exits from parole for a state that are returned to prison
for a technical violation.
Summary and Comparison of the BJS Prison and Parole Data
Ultimately, five states were excluded for analysis for the prison data. Descriptives
of the percent of prison admissions that are returns to prison can be found in Table 2.
Two states were excluded because they were unable to distinguish between returns for
new commitments versus for violation of parole. Three additional states, FL, NC and VA
41
States differ in how they record violations of conditional release. For instance, some states are more
likely to return a person to prison on technical violations rather than pursuing new charges. In addition,
some states do not “terminate parole supervision” with a return to prison and thus these would not appear in
this dataset, but they would appear in the Prisoners 2009 dataset. This underlines the importance of using
combined measures, as well as using data from both datasets. 42
Originally I also included analyses on the dependent variable “Percent of parole exits that were
unsatisfactory” as measured by the parole survey. This variable was more inclusive of unsatisfactory exits
to parole that did not result in incarceration. Ultimately however, the models using this variable did not
differ from the model of “Percent of parole exits that were returned to incarceration (including new crimes
and technical violations) as measured by the parole survey”, so in the interest of parsimony it was dropped.
This document is a research report submitted to the U.S. Department of Justice. This report has not been published by the Department. Opinions or points of view expressed are those of the author(s)
and do not necessarily reflect the official position or policies of the U.S. Department of Justice.

73
had rates of returns to prison for parole violation that were markedly different from other
states. Examination of their parole policies indicated that these states had either abolished
parole or do not utilize it in a meaningful way. This was consistent with their relatively
low rates of number of people on parole per 100,000 population, as well as their low use
of conditional release.43
An additional four states were excluded due to missing
information on “percent of releases in 2009 that were conditional” which occurred in
states that reported that their data collection methods changed between 2009 and 2010,
causing discrepancies in their collection.
Descriptives of the dependent variables using the parole data can be found in Table 2. Four states
were excluded for analysis from “percent of parole completions that are returned to incarceration”
due to being unable to report returns to prison from parole. Ultimately, eight states had to be
excluded for “rates of returns to prison for new sentence only” and “rates of returns to prison for
revocation only”, as those states were not able to distinguish these types of returns. Table 2:
Summary Statistics of Measures for Rates of Returns to Prison
Prison Data 2010 Missing Min Max Mean Median
Percent of Prison Admissions that are Parole Violators 5 7% 65% 31% 29%
Parole Data 2010
Percent of all parole completions that are returned to
incarceration
4 9% 68% 32% 31%
Returned for New Sentence Only 8 0% 20% 9% 8%
Returned for Revocation only 8 2% 59% 23% 20%
The dependent variable for the prison data was significantly, positively related to
two of the measures in the parole data, “parole completions returned to incarceration” and
“parole completions returned for revocation only”, with a correlation of .481 and .435
respectively. Although weakly positively related to “parole completions returned for new
sentence only” the relationship was not significant. Although the variable “parole
completions returned to incarceration” is related to both “parole completions returned for
43
As a check, analyses were also conducted keeping these states in the model. These models did not
meaningfully differ from the models when these states were excluded.
This document is a research report submitted to the U.S. Department of Justice. This report has not been published by the Department. Opinions or points of view expressed are those of the author(s)
and do not necessarily reflect the official position or policies of the U.S. Department of Justice.

74
revocation only” and “parole completions returned for new sentence only” (as well as
“other” reasons for return to incarceration), the overall measure of “parole completions
returned to incarceration” has a much stronger correlation with returns to incarceration
for revocations (at .849) than to new sentences (.263). This reflects that on average
technical violations make up a higher percentage of all returns to incarceration than do
new sentences. As this is true in the prison data as well, it is not surprising that the prison
data has a higher correlation with technical violations than with new sentences.
Table 3: Correlations Between Dependent Variables
Percent of Prison
Admissions that are
Parole Violators
Parole completions
that are returned to
incarceration
Parole completions
returned for New
Sentence only
Beta .481
Sig .001
N 44
Beta .118 .263
Sig .466 .093
N 40 42
Beta .435 .849 -.143
Sig .005 .000 .367
N 40 42 42
Parole completions
that are returned to
incarceration
Parole completions
returned for New
Sentence only
Parole completions
returned for
Revocation only
Controls
Several controls will be used in the model in order to ensure proper specification
and avoid bias in estimating the effect of collateral consequence laws. Controls are
drawn from BJS data sources, as well as other national data sources, such as the Bureau
of Labor Statistics and the US census. Summary statistics of the control variables are
reported in Table 4.44
44
Several other potential controls were investigated, including percent of state population that is male and
percent of state population between ages 15 and 24. While gender and age have shown to have an effect on
parole revocations at the individual level (Steen et al 2012), at the aggregate level there was little variation
This document is a research report submitted to the U.S. Department of Justice. This report has not been published by the Department. Opinions or points of view expressed are those of the author(s)
and do not necessarily reflect the official position or policies of the U.S. Department of Justice.

75
Table 4: Summary Statistics for Control Variables Missing Min Max Mean Median
Prison Data - Controls 2009
Percent of Prison Releases that are Conditional 5 10% 98% 68% 73%
Imprisonment rate 0 150 881 406 382
Parole Data - Controls 2009
Percent of parolees released under Discretionary release* 0 0% 100% 52% 66%
Percent of parolees released under Mandatory release* 0 0% 100% 34% 4%
Percent of parolees released unde Other release* 0 0% 100% 14% 2%
Parolee Race - Percent Black 3 2% 72% 32% 33%
Percent Parolees - Violent 9 8% 68% 34% 31%
Percent Parolees - Property 9 7% 55% 22% 24%
Percent Parolees - Drug 9 3% 63% 30% 29%
State Level - Controls 2009
Unemployment as a percent of the civilian workforce 0 4% 13% 8% 8%
Percent of kids living in single-parent homes 0 16% 39% 27% 27%
*Ultimately these variables were not included in the models as they did not contribute to the models.
As previously discussed, it is necessary to control for the percent of prison
releases that are conditional as states that have lower rates of conditional release will
have a lower number of individuals eligible to be counted as “returns.” State
imprisonment rates may be correlated with rates of returns to prison as prior criminal
record is one of the strongest predictors of recidivism, (Petersilia, 2003), thus states with
higher imprisonment rates may also experience higher rates of returns to prison. High
imprisonment rates could also have an effect of eroding the stigma that is attached to the
prison record due to a higher number of citizens in the population with prison records
(Hirschfield and Piquero, 2010).45
between states on these factors, and they were not related to the dependent variables. As such, they were
excluded from the analyses. 45
This could increase the salience of collateral consequence laws. It is quite possible that employers or
housing agents show preferential treatment to applicants with no prison record regardless of the law,
however this may be less possible when there is an expanded number of persons in the pool with prison
records. Thus, in those circumstances, employers or housing officials may be more likely to ignore prison
records unless prevented by law.
This document is a research report submitted to the U.S. Department of Justice. This report has not been published by the Department. Opinions or points of view expressed are those of the author(s)
and do not necessarily reflect the official position or policies of the U.S. Department of Justice.
76
As rates of recidivism and of violations are parole vary based on individual
characteristics, such as race (Gendreau et al 1996, Lin et al 2010, Spohn and Holleran
2002), information as to the percent of parolees that are black will be included as a
control in the analysis. Three states were unable to provide statistics on the racial
breakdown of their parole population and were excluded from the analysis. Since some
collateral consequence laws are specific to certain offenders, for instance federal bans on
welfare assistance to drug offenders, and since different types of offenders may have
different likelihoods of returning to prison, I also control for the percent of parolees that
are property, violent or drug offenders.46
Nine states were unable to provide information
on the breakdown of parolees by offense type and were excluded from the analysis.
Community level theories argue that high levels of unemployment rates and high
rates of single-parent households will negatively impact the ability of a community to
regulate their members. In an attempt to capture this relationship, I include state-level
controls for unemployment rates and rates of single-parent households.
Due to missing data on the dependent and control variables, the number of states
included in the analyses was reduced to 32 in the prison analyses, 39 in the parole
analyses predicting all returns to incarceration, and 36 in the parole analyses predicting
returns to incarceration for new sentences only and for technical revocations only. The
specific states that were excluded for each analyses, as well as the reason for exclusion,
46
Initially I also included a control for the percent of parolees released on discretionary parole (as opposed
to mandatory parole, a reinstatement of parole, or other). Those who are released to parole through a
discretionary process may be less likely to recidivate than those who have mandatory release as they have
gone through a screening process which removes the offenders that are most likely to recidivate (Petersilia
2003; Travis 2005). Ultimately however, this variable was very weak and did not contribute to the model,
and so was dropped from analyses.
This document is a research report submitted to the U.S. Department of Justice. This report has not been published by the Department. Opinions or points of view expressed are those of the author(s)
and do not necessarily reflect the official position or policies of the U.S. Department of Justice.

77
can be found in the appendix. Examination of the remaining states does not indicate any
substantial differences with the full sample. Descriptives of each sample can be found in
the appendices.47
Analysis
As the dependent variables are continuous, this research will employ ordinary
least squares (OLS) regression analysis, and separate analyses will be run using the
dependent variables from the Prisoners and the Parole data. OLS regression estimates a
relationship between variables by finding the regression line in which the squared
deviations between the observed values and the actual values is the lowest. States will be
scored on the harshness of the collateral consequences of dimensions of laws within each
category, as well as a total cumulative value for all collateral consequence laws.
This research consists of four initial analyses, based upon different dependent
variables. I run this analysis for the laws in 2009 on rates of returns to prison for 2010.
One of the analyses pulls on data from the prison data, while three pull on data from the
parole data. The parole data includes more analyses in order to examine the differences
between new crimes and technical violations.
Analysis 1: Percent of new admissions to prison that are violations of conditions
of release (including new crimes and technical violations) as measured by NPS
Analysis 2: Percent of parole exits that were returned to incarceration (including
new crimes and technical violations) as measured by the parole survey
47
Of the full 50 states, 16 are considered to be in the “South” (32%). In the analyses using prison data, 9 of
32 (28%) are in the South. In the analyses predicting percent of parole exits that are returned to
incarceration, 14 of 39 (36%) are in the South. In the analyses predicting percent of parole exits that are
returned to incarceration for New Sentences Only or for Technical Violations Only, 13 of the 36 (36%) are
in the South.
This document is a research report submitted to the U.S. Department of Justice. This report has not been published by the Department. Opinions or points of view expressed are those of the author(s)
and do not necessarily reflect the official position or policies of the U.S. Department of Justice.

78
Analysis 3: Percent of parole exits that resulted from new crimes as measured by
the parole survey
Analysis 4: Percent of parole exits that resulted from technical parole violations as
measured by the parole survey
A preliminary examination of the data indicates that there is significant variation
between states on the dependent and independent variables. In 2010, states varied in the
percentage of prison admissions that were made up of parole violations from 7% to 65%,
with an average and median of 31% and 29% respectively. For the parole data, states
varied from 9% to 68% of parole exits being due to returns to incarceration, with an
average and median of 32% and 31%.48
Due to missing data, each analysis includes 42 to
48 states.
As a sensitivity check on the results, I conduct a fixed-effects analysis on the
effect of collateral consequence laws between 1994 and 2000, a time period which
includes the implementation of these laws in 1996. The TANF restrictions are well
suited to this type of analysis as there was significant variation in their use during this
time, as it captures the period of their implementation.49
As a fixed-effects model
48
In comparing the two datasets, the Prisoners data tends to have higher numbers of persons entering prison
that are parole violators than those that are counted as parole violators in the Parole data. There are several
explanations for this, for instance, in the parole data a person may still be under parole supervision even
after they have been returned to prison and thus they would appear in the Prisoners data, but would not be
counted as an “exit” in the Parole data. In addition, some states may have a more inclusive definition of
what is covered by “conditional release” as opposed to what is covered under “parole” in the parole data.
However, in some states the trend is reversed, and the number is higher in the parole data than the NPS
data. These may reflect instances in which a person’s parole is terminated, but the person is returned to
incarceration at the local rather than the state level. Again, these differences highlight the importance of
using multiple datasets. 49
Ideally, I would be able to conduct similar analyses on other laws as well. Unfortunately, changes in laws
regarding voting and employment do not provide enough variation. Fixed effects analyses on public
This document is a research report submitted to the U.S. Department of Justice. This report has not been published by the Department. Opinions or points of view expressed are those of the author(s)
and do not necessarily reflect the official position or policies of the U.S. Department of Justice.

79
analyzes change within states rather than between states, this will ensure greater
confidence that the results are due to the effect of collateral consequence laws, and not
related to any state differences in reimprisonment policy, practice or definition of
“returns to prison”.
housing is not possible as these changes occur with local housing authorities and has not been sufficiently
documented.
This document is a research report submitted to the U.S. Department of Justice. This report has not been published by the Department. Opinions or points of view expressed are those of the author(s)
and do not necessarily reflect the official position or policies of the U.S. Department of Justice.

80
Chapter 4: Findings
In this chapter I use ordinary least squares regression to examine the relationship
between collateral consequence laws and state rates of returns to prison. In my analyses, I
expect to see a positive relationship between the harshness of laws and higher rates of
returns to prison. All collateral consequence variables have been coded in such a way that
higher numbers are associated with “harsher” laws, thus a positive relationship indicates
that harsher laws are related to higher rates of returns to prison, whereas a negative
relationship indicates that harsher laws are related to lower rates of returns to prison.
Given the large number of independent variables, and the relatively small sample size, I
have run my analyses for each category of law separately.
It is helpful to first examine a baseline model with only the controls included as it
allows us to examine the relationship of the controls to the dependent variable, and will
also allow us to compare whether the models including collateral consequence laws
improve the explanatory power of the baseline model. It also allows a preliminary look at
the similarities between the prison and parole models. I first present the results using the
rates of returns to prison from the prison data, and then I examine the relationship using
the rates of returns to prison from the parole data. I examine the effects of percent of
releases that are conditional,50
state imprisonment rate, the percent of parolees that are
black, percent of parolees whose most serious offense was a violent offense, percent of
parolees whose most serious offense was a property offense, percent of parolees whose
50
As will be discussed later, this variable is only included in the model using the prison data.
This document is a research report submitted to the U.S. Department of Justice. This report has not been published by the Department. Opinions or points of view expressed are those of the author(s)
and do not necessarily reflect the official position or policies of the U.S. Department of Justice.

81
most serious offense was a drug offense, the state unemployment rate, and the percent of
households headed by a single-parent. 51
In the first baseline model using the prison data (see table 5), only the variable
measuring “Percent of Releases that are Conditional” obtains statistical significance.
Given the small N in this model, as the units of analysis are states rather than individuals,
this is not entirely surprising. The model indicates that states with higher rates of
conditional release also have higher rates of returns to prison. This is expected as people
are only counted as returns to prison if they were on conditional release when they enter
prison, thus states that have low rates of conditional release have fewer people eligible to
be counted as a “return to prison.” This relationship is fairly strong with a standardized
coefficient of .444.
51
I also ran analyses controlling for the percent of parolees that were released on discretionary release. The
inclusion of the variable resulted in a decrease in the adjusted R-square and ultimately was not included in
the model.
This document is a research report submitted to the U.S. Department of Justice. This report has not been published by the Department. Opinions or points of view expressed are those of the author(s)
and do not necessarily reflect the official position or policies of the U.S. Department of Justice.

82
Table 5: Estimated Effects of Controls on Rates of Returns to Prison using
Ordinary Least Squares
Variables
b (SE) Beta t
Percent of Releases that are Conditional .425 * .182 .444 2.336
Imprisonment rate -.044 .029 -.453 -1.510
Parolee Race - Percent Black -.131 .236 -.166 -.555
Percent Parolees - Violent -.084 .264 -.089 -.318
Percent Parolees - Property .071 .400 .049 .178
Percent Parolees - Drug .111 .291 .099 .381
Unemployment Rate 1.191 1.810 .158 .658
Single-Parent Homes .692 1.166 .217 .594
R-square: .308
N=32∗
p < .05;
∗∗
p < .01;
∗∗∗
p < .001
Percent of Prison Admissions that are Parole
Violators
States with high imprisonments rates are associated with lower rates of returns to
prison. While states that rely heavily on imprisonment may be more likely to also revoke
parole, it appears that they maintain a high proportion of new offenders. Although this
relationship fails to reach statistical significance, it is moderately strong at -.453.
Interestingly, states with a higher proportion of black parolees tend to have slightly lower
rates of returns to prison. Although this relationship is fairly weak, with a standardized
coefficient of -.166, the negative relationship is surprising as at the individual level
blacks are more likely to be returned to prison from parole. States with a higher
proportion of parolees from violent crimes have slightly lower rates of returns to prison,
whereas states with high rates of parolees for property or drug crimes are more likely to
have slightly higher rates of returns to prison, although these relationships are very weak
with standardized coefficients of -.089, .049 and .099 respectively. Finally states with
high rates of unemployment, as well as high rates of single-parent headed families, have
This document is a research report submitted to the U.S. Department of Justice. This report has not been published by the Department. Opinions or points of view expressed are those of the author(s)
and do not necessarily reflect the official position or policies of the U.S. Department of Justice.

83
higher rates of returns to prison with standardized coefficients of .158 and .217
respectively. This is consistent with the idea that higher employment and strong family
networks can work to provide supervision in the community, and thus prevent people
from returning to crime. The R-square for the model is .308.
When examining the same baseline model using dependent variables from the
parole data (see table 6), we see similar results. This model does not include the variable
“percent of releases that are conditional.” As the parole data uses all persons on parole in
the state as the base number, there is not the concern as with the prison data that lower
rates of returns to prison is a reflection of lower rates of conditional release. In this data I
examine three potential outcomes; returned to incarceration, retuned to incarceration for a
new sentence, and returned to incarceration for a technical violation.52
It must be noted
that these three measures are interdependent as returns to prison for new sentences and
for technical violations make up a large percentage of all returns to incarceration.53
52
Coding of Dependent Variables for Parole
Parole completions that are returned to incarceration: The sum of all four returns to incarceration (new
commitments, revocations, receive treatment, and other) divided by total known exits (successful
completions, all four returns to incarceration, as well as absconder and “other unsatisfactory”)
Parole completions returned for New Sentence only: Returns to incarceration for new commitments
divided by the total typical exits (successful completions, incarcerated for new commitments, and
incarcerated for revocation)
Parole completions returned for Revocation only: Returns to incarceration for revocations divided by
the total typical exits (successful completions, incarcerated for new commitments, and incarcerated for
revocation) 53
As a check on the data, originally a fourth dependent variable was also included in the analyses:
All unsatisfactory parole completions: The sum of all four returns to incarceration (new commitments,
revocations, receive treatment, and other) as well as other unsatisfactory (“absconder” and “other
unsatisfactory”) divided by total known exits (successful completions, all four returns to incarceration, as
well as absconder and “other unsatisfactory”)
The two dependent variables “all unsatisfactory parole completions” and “parole completions that are
returned to incarceration” were correlated with one another at .88, and the results from the model “all
unsatisfactory parole completions” mirrored “parole completions that are returned to incarceration”, and so
it was not included for this chapter. While running the analysis using the alternative dependent variable was
a check on whether there was a differential impact by including “absconders” and “other unsatisfactory”
ultimately it was determined that there was no significant difference.
This document is a research report submitted to the U.S. Department of Justice. This report has not been published by the Department. Opinions or points of view expressed are those of the author(s)
and do not necessarily reflect the official position or policies of the U.S. Department of Justice.

84
Returns to incarceration for technical violations have a particularly large effect on the
total number of parole completions that are returned to incarceration. On average,
roughly two-thirds of returns to incarceration are due to technical violations. These two
variables, “all returns to incarceration” and “returns to incarceration for technical
violations” are correlated at .849, as contrasted by a correlation of .263 between “all
returns to incarceration” and “returns to incarceration for a new sentence”.54
Table 6: Estimated Effects of Controls on Rates of Unsuccessful Parole
Completions using Ordinary Least Squares Variables
b (SE) Beta t b (SE) Beta t b (SE) Beta t
Imprisonment rate -.029 (.021) -.319 -1.368 .015 (.011) .357 1.382 -.034 (.020) -.350 -1.667
Parolee Race - Percent Black -.224 (.135) -.369 -1.665 .045 (.071) .161 .633 -.209 (.133) -.325 -1.570
Percent Parolees - Violent .081 (.216) .102 .374 .084 (.116) .224 .725 .084 (.218) .096 .384
Percent Parolees - Property .335 (.288) .250 1.163 .132 (.151) .223 .871 .312 (.284) .228 1.099
Percent Parolees - Drug .241 (.231) .260 1.046 -.043 (.123) -.091 -.347 .408 (.230) .377 1.775
Unemployment Rate .375 (1.266) .058 .296 -.311 (.655) -.105 -.475 1.395 (1.228) .204 1.136
Single-Parent Homes -.074 (.813) -.026 -.090 -.588 (.442) -.413 -1.331 -.597 (.828) -.181 -.721
R-square: 0.314 0.157 0.445
N 39 36 36∗
p < .05;
∗∗
p < .01;
∗∗∗
p < .001
Parole completions that are
returned to incarceration
Parole completions returned for
New Sentence only
Parole completions returned for
Revocation only
None of the tested control variables are statistically significant across the three
models, although again this is likely due to the small number of cases. What is perhaps
most interesting is that it appears that the controls have different effects based on whether
the person is returned for a new sentence or for a technical violation. Of the seven
controls included, four have different effects on whether the model predicts returns for
new sentences or for technical violations. (Not surprisingly, given that returns to prison
for technical violations make up two-thirds of all returns to incarceration, the model
predicting “all returns to incarceration” mirrors the relationships in the model “returns for
54
“Returns to incarceration for technical violations” is actually negatively correlated with ““returns to
incarceration for a new sentence” at -.143, which hints that different processes may be at work for returns
to prison for technical violations versus for new sentences.
This document is a research report submitted to the U.S. Department of Justice. This report has not been published by the Department. Opinions or points of view expressed are those of the author(s)
and do not necessarily reflect the official position or policies of the U.S. Department of Justice.

85
technical violations”.) None of the models exactly mirrors the relationships found in the
prison data, although the “returns for technical violations” and “all returns to
incarceration” models more closely mirror the prison model with relationships in the
same direction for five of the seven controls. Given that the prison data does not
distinguish between returns to prison for new crimes versus for technical violations, and
that roughly two-thirds of returns to incarceration are due to technical violations, it makes
sense the relationship observed in the prison data would more closely mirror the
relationship observed in the parole data for the models of “all returns to incarceration”
and “returns for technical violation”.
In the parole models, the effect of a state’s imprisonment rate is negative,
consistent with the prison data, in the “all returns to incarceration”, and the “returns to
incarceration for technical violations” models, but has a positive relationship for “returns
to incarceration for a new sentence”. These relationships are moderate in strength with an
absolute magnitude for the standardized coefficients of roughly about .3 in each model.
The percent black of the parolee population has a negative effect for “all returns to
incarceration”, and “returns to incarceration for technical violations” (with standardized
coefficients of -.369 and -.325 respectively), however it has a positive effect for returns
for a new sentence, with a standardized coefficient of .161. Although impossible to test
using aggregate data, this suggests the possibility that blacks may be more likely to be
returned to incarceration under a new sentence, than for a technical violation. This
explanation is consistent with findings by Lin et al 2010, which find that blacks have
higher odds than whites of having parole revoked by the parole board following a parole
This document is a research report submitted to the U.S. Department of Justice. This report has not been published by the Department. Opinions or points of view expressed are those of the author(s)
and do not necessarily reflect the official position or policies of the U.S. Department of Justice.

86
officer filing a revocation complaint for criminal violations, but not for technical
violations.
Contrary to the prison data, having a high percent of parolees for violent crimes
indicates higher rates of returns to prison across all three models, with standardized
coefficients of .201, .224, and .096. This finding is consistent with previous research
indicating that parolees of violent crime are more likely to be returned for both new
crimes and technical violations (Lin et al 2010, Steen et al 2012). Consistent with the
prison data, high rates of property parolees is weakly to moderately related to higher rates
of returns to prison across all three models, while high rates of drug parolees have higher
rates of returns to prison for in the “all returns to incarceration”, and the “returns to
incarceration for technical violations” models. Percent of parolees that are drug offenders
may be related to higher returns to prison for technical violations, but lower rates of
returns for new sentences, due to drug testing of parolees. People on parole may be both
more likely to fail a drug test, and also more likely to have a parole officer file a failed
drug test as a technical violations as it is consistent with the original offense (Steen et al
2012). This would result in a lower rate of return to prison for new sentences as drug
offenders may be more likely to commit drug offenses rather than other crimes (which
are more likely to be processed as a technical violation) and the higher rate of returns to
prison for technical violations could leave drug offenders with less time in the
community to commit a new crime.
Consistent with the prison data, states with high unemployment rates also have
higher rates of returns to prison for “all returns to incarceration” and “returns for
technical violations”, however, high unemployment rates indicate lower rates of returns
This document is a research report submitted to the U.S. Department of Justice. This report has not been published by the Department. Opinions or points of view expressed are those of the author(s)
and do not necessarily reflect the official position or policies of the U.S. Department of Justice.

87
to prison for new sentences. Interestingly, and in contrast to the prison data, in these
models states with higher levels of single-parent headed families have lower rates of
returns to prison across all three models. This relationship is moderately strong with a
standardized coefficient of .413 for returns for new sentences, and of .181 for returns for
technical violations. This is in contrast to the predicted direction as we would expect that
higher levels of single-parent headed households would reduce the ability of areas to
monitor and regulate their surroundings, leading to higher rates of returns to
imprisonment.
The R-squares for these models range from .157 to .445, with the highest R-
square for the model predicting rates of returns to prison for technical violations, and the
lowest for the model predicting rates of returns to prison for new sentences. It appears
that the models do a better job explaining returns for technical violation, than returns to
incarceration for new sentences.
In sum, a preliminary look at these models, without including measures for
collateral consequence laws, indicates that there are potentially different processes at
work for explaining returns to incarceration for new sentences versus for technical
violations. There are also variations between the effects of the control variables between
the prison and parole data. While the prison data most closely resembles the parole data
measuring technical violations, two of the seven control variables have different
relationships between those two models. Interestingly, even factors which have a
moderately strong relationship in the prison data, as well as the “technical violations”
model (such as the imprisonment rate or the percent of parolees that are black), have a
different relationship for the “returns to incarceration for new sentences” model. The
This document is a research report submitted to the U.S. Department of Justice. This report has not been published by the Department. Opinions or points of view expressed are those of the author(s)
and do not necessarily reflect the official position or policies of the U.S. Department of Justice.

88
model predicting returns to prison from parole for technical violations had the highest R-
square, at .445, followed by the model using the prison data which had an R-square of
.439. The R-square was lowest for returns to prison from parole for new sentences, with
an R-square of .157. It must be noted however, that apart from the impact of “percent of
releases that are conditional” in the prison model, none of the controls reached statistical
significance, and thus are not significantly different from zero.
Voting
The first collateral consequence model tests the effect of voting restrictions. I
expect that voting laws should have a positive, though relatively weak relationship to
rates of returns to prison. Extending the right to vote has been argued as a mechanism by
which people can be reintegrated. The right to vote can encourage people to be involved
in civic engagement, and thus re-invest them in the community. By contrast, excluding
people from voting can reinforce the notion that they will never be part of society, thus
freeing them to reengage in criminal activity. However, as the effect of the law does not
impact a person’s day to day life, and only periodically affects them during elections, I
would expect the relationship to be relatively weak.
Contrary to expectations, harsher voting restrictions are associated with lower
rates of returns to prison in the prison model, as well as across the three parole models
(see table 7 and 8). The relationship between voting and rates of returns to prison is
fairly weak, the highest standardized coefficient is -.168, and does not approach statistical
significance, but it is consistently negative across the four models.
This document is a research report submitted to the U.S. Department of Justice. This report has not been published by the Department. Opinions or points of view expressed are those of the author(s)
and do not necessarily reflect the official position or policies of the U.S. Department of Justice.

89
Table 7: Estimated Effects of Voting Laws on Rates of Returns to Prison using
Ordinary Least Squares
Variables
b (SE) Beta t
Percent of Releases that are Conditional .392 * .190 .410 2.068
Imprisonment rate -.044 .029 -.453 -1.490
Parolee Race - Percent Black -.145 .239 -.184 -.606
Percent Parolees - Violent -.078 .267 -.083 -.291
Percent Parolees - Property .052 .406 .035 .128
Percent Parolees - Drug .163 .303 .145 .537
Unemployment Rate 1.173 1.830 .156 .641
Single-Parent Homes .819 1.193 .256 .687
CC Voting Laws -1.646 2.343 -.141 -.702
R-square: .323
N=32∗
p < .05;
∗∗
p < .01;
∗∗∗
p < .001
Percent of Prison Admissions that are Parole
Violators
That voting laws are negatively related to rates of returns to prison is surprising
given that there is no reason to suspect that restricting a person’s right to vote would
make them more likely to abide by their conditions of release or less likely to commit
additional crime. It is possible that voting laws are correlated with a spurious,
unmeasured variable that is causing this relationship. The direction of the control variable
relationships stayed the same, as did their relative magnitude, although as with the
baseline model, apart from percent of releases that are conditional in the prison model,
they did not achieve statistical significance.
This document is a research report submitted to the U.S. Department of Justice. This report has not been published by the Department. Opinions or points of view expressed are those of the author(s)
and do not necessarily reflect the official position or policies of the U.S. Department of Justice.

90
Table 8: Estimated Effects of Voting Laws on Rates of Unsuccessful Parole using
Ordinary Least Squares Variables
b (SE) Beta t b (SE) Beta t b (SE) Beta t
Imprisonment rate -.028 (.021) -.314 -1.343 .016 .011 .369 1.421 -.034 .021 -.346 -1.621
Parolee Race - Percent Black -.211 (.136) -.346 -1.550 .052 .072 .186 .722 -.204 .136 -.317 -1.499
Percent Parolees - Violent .125 (.221) .158 .564 .108 .120 .287 .899 .100 .227 .116 .442
Percent Parolees - Property .361 (.290) .269 1.244 .144 .153 .244 .946 .321 .289 .235 1.108
Percent Parolees - Drug .297 (.239) .320 1.244 -.017 .127 -.036 -.132 .427 .240 .395 1.775
Unemployment Rate .137 (1.294) .021 .106 -.409 .667 -.138 -.612 1.325 1.266 .194 1.047
Single-Parent Homes -.002 (.818) -.001 -.003 -.554 .446 -.388 -1.243 -.572 .845 -.174 -.677
CC Voting Laws -1.685 (1.804) -.156 -.934 -.830 .957 -.168 -.867 -.599 1.815 -.052 -.330
R-square: 0.333 0.180 0.447
N 39 36 36∗
p < .05;
∗∗
p < .01;
∗∗∗
p < .001
Parole completions returned for
New Sentence only
Parole completions returned for
Revocation only
Parole completions that are
returned to incarceration
The R-squares indicates only a very minor improvement in the models compared
to the baseline model. The R-square for returns to prison for technical violations barely
increased – from .445 to .447, and the increase for new sentences was only from .157 in
the baseline model to .180 in the model including collateral consequences for voting.
Access to Records
In examining the effect of collateral consequence laws related to access to
records, I test the effect of six collateral consequence laws in a single model55
. I
hypothesize that in areas where employers have greater access to criminal records, that it
will be harder for people leaving prison to find work. This will subsequently make it
more difficult to abide by the terms of release if they are required to maintain steady
employment, and will also increase the chances of parolees returning to criminal activity.
I test the effect of six laws, whether the state provides access to criminal records online,
55
Originally another law related to access to records was included – whether or not the state has a statute
specifying a punishment (civil or criminal) for a person that violates laws related to access to records. This
variable was eventually dropped from the analysis. There is no indication in the literature that this process
has actually been used in any state. The variable did not improve the model and so was eventually
dropped.
This document is a research report submitted to the U.S. Department of Justice. This report has not been published by the Department. Opinions or points of view expressed are those of the author(s)
and do not necessarily reflect the official position or policies of the U.S. Department of Justice.
91
whether arrest records expire after a certain amount of time, whether conviction records
expire after a certain amount of time, whether arrest records are available to the general
public or to a limited group, whether arrest records can be expunged, and whether
conviction records can be expunged.56
I looked at correlations between the laws related to
access to records, and I also examined the Variance Inflation Factors to ensure there was
no multi-collinearity among the variables.
Access to records online has a positive, albeit somewhat weak, effect in three of
the four models, indicating that states that have greater access to criminal records online,
generally also have higher rates of returns to prison (see tables 9 and 10). The one
exception is the parole data which models returns to prison for technical violations, in
which online records have a negative effect. The strength of the relationship is strongest
in the model predicting new sentences, with a standardized coefficient of .177, and is
weaker in the model predicting all returns to incarceration from parole (.032) and in the
prison data (.038). The weaker relationship in the prison data, and in the “all returns to
incarceration” model, is likely a reflection of the differential effect found in technical
violations, which makes a large proportion of all returns. Technical violations have a
standardized coefficient of -.142, indicating that states with online access to records have
lower rates of returns to prison for technical violations. Although this is counter to the
original hypothesis, one potential explanation is that parole officers may employ greater
discretion in deciding to return a person for a technical violation versus a new sentence.
Parole officers may be more sympathetic for technical violations, particularly if the
56
The variables measuring whether records expire differs from expungement in that expiration occurs
automatically, whereas expungement is a process in which the person must apply to have their records
erased.
This document is a research report submitted to the U.S. Department of Justice. This report has not been published by the Department. Opinions or points of view expressed are those of the author(s)
and do not necessarily reflect the official position or policies of the U.S. Department of Justice.

92
violation is for failure to maintain steady employment if there are statutes in place that
explicitly increase the difficulty of obtaining employment.
Whether a state has statutes in which records of arrests not leading to conviction
are automatically removed from the records has mixed results, with the expected positive
relationship in only two of the four models (in the prison model, as well as in the model
for technical violations only). This effect is stronger in the prison model (standardized
coefficient of .271) than for technical violations (.092), and indicates that states in which
records of arrests not leading to conviction are automatically removed from the records
have lower rates of admissions to prison for violations of conditional release, as well as
lower rates of returns to prison for technical violations. However states in which records
of arrests not leading to conviction are automatically removed from criminal records have
somewhat higher rates of returns to prison for new sentences, with a standardized
coefficient of -.215. This is contrary to prediction and is surprising as we would expect
that removing an arrest from a criminal record would make it easier for a person to
reintegrate, and thus less likely to commit an additional offense.
This document is a research report submitted to the U.S. Department of Justice. This report has not been published by the Department. Opinions or points of view expressed are those of the author(s)
and do not necessarily reflect the official position or policies of the U.S. Department of Justice.

93
Table 9: Estimated Effects of Access to Criminal Records Laws on Rates of Returns
to Prison using Ordinary Least Squares
Variables
b (SE) Beta t
Percent of Releases that are Conditional .553 * .223 .579 2.479
Imprisonment rate -.057 .036 -.588 -1.590
Parolee Race - Percent Black -.274 .285 -.349 -.961
Percent Parolees - Violent -.171 .306 -.182 -.558
Percent Parolees - Property .087 .465 .060 .187
Percent Parolees - Drug -.009 .378 -.008 -.025
Unemployment Rate .083 2.466 .011 .034
Single-Parent Homes 1.199 1.469 .375 .816
CC Online Records 1.168 9.561 .038 .122
CC Arrest Records expire 7.768 6.877 .271 1.130
CC Conviction Records expire -5.438 10.461 -.126 -.520
CC Who has access to Records 3.242 5.373 .235 .603
CC Arrest Records can be expunged -15.592 13.188 -.360 -1.182
CC Conviction Records can be expunged -3.521 9.264 -.107 -.380
R-square: .402
N=32∗
p < .05;
∗∗
p < .01;
∗∗∗
p < .001
Percent of Prison Admissions that are Parole
Violators
While automatically removing arrests not leading to conviction has a negative
effect on new sentences, it appears that automatically removing (certain) convictions
from the record has a positive effect for new sentences, but a negative effect for the other
three models. Thus states that automatically remove certain convictions have higher rates
of returns to prison for new sentences (with a standardized coefficient of .211). The
prison data indicates a negative relationship (standardized coefficient of -.126) as does
the overall parole data (standardized coefficient of -.088) and returns for technical
violation (standardized coefficient of -.227). As was mentioned previously, this could
indicate a certain amount of sympathy among parole officers, and a certain reluctance to
revoke parole when laws make finding employment more difficult.
This document is a research report submitted to the U.S. Department of Justice. This report has not been published by the Department. Opinions or points of view expressed are those of the author(s)
and do not necessarily reflect the official position or policies of the U.S. Department of Justice.

94
Table 10: Estimated Effects of Access to Criminal Records Laws on Rates of
Unsuccessful Parole Completions using Ordinary Least Squares Variables
b (SE) Beta t b (SE) Beta t b (SE) Beta t
Imprisonment rate -.024 .025 -.272 -.990 .019 .013 .460 1.515 -.031 .025 -.318 -1.257
Parolee Race - Percent Black -.209 .152 -.343 -1.370 .066 .077 .239 .865 -.213 .147 -.332 -1.446
Percent Parolees - Violent -.017 .266 -.022 -.064 .123 .136 .327 .905 -.042 .261 -.048 -.160
Percent Parolees - Property .273 .345 .204 .789 .166 .176 .280 .942 .160 .338 .117 .474
Percent Parolees - Drug .220 .277 .238 .796 .041 .140 .088 .295 .310 .270 .287 1.149
Unemployment Rate .616 1.756 .095 .351 .314 .873 .106 .360 1.299 1.679 .190 .774
Single-Parent Homes -.186 .964 -.065 -.192 -.763 .500 -.535 -1.527 -.483 .961 -.147 -.503
CC Online Records .880 7.544 .032 .117 2.290 4.407 .177 .520 -4.243 8.476 -.142 -.501
CC Arrest Records expire -.474 5.138 -.018 -.092 -2.559 2.607 -.216 -.981 2.516 5.014 .092 .502
CC Conviction Records expire -3.678 9.288 -.088 -.396 3.882 4.601 .211 .844 -9.640 8.849 -.227 -1.089
CC Who has access to Records -2.500 3.550 -.201 -.704 -2.577 1.954 -.451 -1.319 -.309 3.758 -.023 -.082
CC Arrest Records can be expunged -2.631 8.942 -.066 -.294 4.499 4.505 .251 .999 -3.511 8.664 -.085 -.405
CC Conviction Records can be
expunged3.716 6.189 .135 .600 2.101 3.127 .166 .672 1.796 6.015 .061 .299
R-square: 0.345 0.271 0.494
N 39 36 36∗
p < .05;
∗∗
p < .01;
∗∗∗
p < .001
Parole completions returned for
Revocation only
Parole completions returned for
New Sentence only
Parole completions that are
returned to incarceration
States that allow greater access to records, for instance having records available to
the general public, have higher rates of returns to prison in the prison data, but have lower
rates of returns to prison in the parole data. That is, in the prison data states that allow
greater access to public records, for instance, in which the general public has access to
criminal records, have higher rates of returns to prison (with a standardized coefficient of
.235). This is the expected relationship, as greater access to criminal records may make a
person more likely to be discriminated against in a job search, and may also lead to
feeling alienated from the community if former offenders believe that community
members are aware of their criminal records, thus preventing the person from
reintegrating into the community. However, the relationship is reversed in all the models
using the parole data, indicating that states that allow more widespread access to criminal
records have lower rates of returns to prison for both new sentences as well as for
technical revocations. This relationship is somewhat strong for new sentences
(standardized coefficient of .451) but substantially weaker for technical violations (.023).
This document is a research report submitted to the U.S. Department of Justice. This report has not been published by the Department. Opinions or points of view expressed are those of the author(s)
and do not necessarily reflect the official position or policies of the U.S. Department of Justice.

95
While leniency by parole officers could potentially explain lower rates of technical
violations, it would not explain the returns to prison for new sentences.
States which allow arrest records to be expunged, a process in which a person
must apply to have the record removed as opposed to having it automatically expire, have
higher rates of returns to prison in three of the four models, with the exception for new
sentences only. Thus while it appears that states which do not allow a process to expunge
arrests not leading to conviction have higher rates of returns to prison for new sentences
(with a standardized coefficient of .251), they have lower rates of returns to prison in the
prison data (standardized coefficient of -.360), as well as a weak negative relationship for
the overall exits from parole that are returns to incarceration (standardized coefficient of -
.066) and for technical violations (standardized coefficient of -.085). It is possible that
these negative relationships are again a reflection of leniency by parole officers, but that
this leniency does not extend to new crimes, explaining why the relationship for new
sentences is in the expected direction.
States which allow conviction records to be expunged have the expected
relationship in the parole data, but a weak, negative relationship in the prison data
(standardized coefficient of -.107). Thus states which allow people to have certain
convictions removed from their record have slightly lower rates of exits from parole due
to returns to prison, although the relationship is weak with a magnitude ranging from .061
for technical violations to .166 for new sentences.
The effect of the control variables changed somewhat between the baseline
models and the models which included collateral consequence laws related to access to
criminal records. In the prison model, the magnitude of the effect of percent of parolees
This document is a research report submitted to the U.S. Department of Justice. This report has not been published by the Department. Opinions or points of view expressed are those of the author(s)
and do not necessarily reflect the official position or policies of the U.S. Department of Justice.

96
that are black increased from a standardized coefficient of -.166 in the baseline model, to
-.349 in the new model, although it still failed to reach statistical significance. The effect
of the percent of parolees that are drug offenders changed direction from a weak positive
effect (standardized coefficient of .099) to a very weak negative effect (standardized
coefficient of -.008). The effect of percent of parolees that are violent offenders changed
direction in both the overall parole model, as well as the technical violation model, from
a weak positive effect to a very weak negative effect. In the model predicting rates of
returns to crime for new sentences, both percent of parolees that are drug offenders, as
well as unemployment rate both changed direction, from weak negative effects, to weak
positive effects. Given that these variables had weak relationships initially and were not
statistically significant, it is not surprising that they changed direction.
Access to criminal records was hypothesized to have a moderately strong positive
relationship to rates of returns to prisons. I expected this relationship to hold for both new
sentences as well as for technical violations, and as criminal records can have an impact
on a person’s day to day life through their effect on employment and interactions within
the community, I expected this relationship to be moderately strong. However, findings
were mixed, both between the prison versus the parole data, as well as within the
different measures used in the parole data. 57
Interestingly, the models indicate that
57
In response to criticism that laws that could not be categorized as binary would be better categorized
using dummy variables, I recoded one of the laws, access to records online, to test the difference in coding
the data using this method. The advantage of dummy coding is that it avoids the assumption that the
middle category, (in this case states in which only the records of people on parole, probation or currently
incarcerated), are evenly spaced with the other categories (in this case states in which records are not
available online versus those in which records are available online). Interestingly, when coded in this
way, states which post records of parole, probationers and currently incarcerated individuals only, have a
significant, negative relationship. This could support the idea that parole officers are more sympathetic, and
therefore more lenient, with parolees when these laws are in place although it should be noted that the
This document is a research report submitted to the U.S. Department of Justice. This report has not been published by the Department. Opinions or points of view expressed are those of the author(s)
and do not necessarily reflect the official position or policies of the U.S. Department of Justice.

97
different processes may be at work for technical violations versus returns for new
sentences. Returns for new sentences were slightly more likely to have relationships in
the expected direction (four of the six relationship) than returns to prison for technical
violations (two of the six relationships). While negative relationships between rates of
returns to prison for technical violations and collateral consequence laws related to access
to criminal records could potentially be explained by more leniency by parole officers in
states which formalize laws giving greater access to criminal records, it is more difficult
to find an explanation as to why laws which allow arrest records to expire, or which
prevent widespread public access to records would result in lower rates of returns to
prison for new sentences. A limitation of the data is that there is no measure of the
employment rates of parolees, and therefore I am unable to test whether access to records
impacts employment as expected. The R-square with the greatest increase was in the
model predicting returns to prison for new sentences, and was .271 in the model
including measures of collateral consequence laws related to access to records, compared
to .157 in the baseline model. The prison model saw an increase in the R-square from
.308 in the baseline model to .402 when measures of access to criminal records are
included. The increase in the R-square for the model predicting technical violations was
more modest, at .494 in the new model, compared to .445 in the baseline model.
Employment
Collateral consequence laws related to employment include four laws; whether
employers are allowed to consider arrests not leading to conviction in hiring decisions,
relationship is strongest for returns for new sentences. However, this does indicate that future work with
this data should incorporate dummy coding of these variables.
This document is a research report submitted to the U.S. Department of Justice. This report has not been published by the Department. Opinions or points of view expressed are those of the author(s)
and do not necessarily reflect the official position or policies of the U.S. Department of Justice.

98
whether there are standards in place to prevent hiring discrimination of former offenders
by public companies, whether there are standards in place to prevent hiring
discrimination of former offenders by public companies, and whether the state offers a
“Certificate of Rehabilitation” or something comparable to indicate that a person has
officially been rehabilitated.58
These laws are expected to be positively related to returns
to prison. Allowing employers to consider arrests in hiring, lack of standards preventing
hiring discrimination against former offenders in private or public employment, as well
as not offering any form to officially recognize rehabilitation attempts, are all expected to
make finding employment more difficult, leading to higher rates of returns to prison for
technical violations (particularly for violated conditions requiring steady employment) as
well as for new sentences. Correlations between the laws related to employment, as well
as Variance Inflation Factors, indicated that there was no concern with multi-collinearity
among the variables.
Results on these laws indicate mixed findings. States in which employers were
allowed to consider arrests not leading to conviction were associated with lower rates of
returns to prison in all four models, contrary to expectations (see tables 11 and 12). This
negative relationship was strongest for returns to prison for new sentences, having a
standardized coefficient of -.370, and weakest for returns to prison for technical
violations, which had a standardized coefficient of -.052 (see table 12). This is surprising
58
Originally I also coded whether the law allowed employers to ask about arrests (but not “consider” them)
and whether the state had restrictions on home health care workers. Ultimately I dropped both of these
variables. There was a strong overlap between states that were allowed to “ask” about arrests not leading to
conviction and whether they were allowed to “consider” those arrests. There was no indication of a
substantive difference between those two variables. Also, as the number of people employed in “home
health care” is relatively small, I ultimately dropped this variable as well given that the numbers of
individuals affected by this law are relatively small compared to the entire population of re-entering
individuals.
This document is a research report submitted to the U.S. Department of Justice. This report has not been published by the Department. Opinions or points of view expressed are those of the author(s)
and do not necessarily reflect the official position or policies of the U.S. Department of Justice.

99
and indicates that states which allow employers to consider arrests not leading to
conviction in hiring decisions have lower rates of returns to prison. Once again, leniency
by parole officers could explain a negative relationship between allowing employers to
consider arrests and rates of returns to prison for technical violations. While it is more
difficult to explain a negative relationship between allowing employers to consider
arrests and rates of returns to prison for new sentences, it is possible that these laws allow
employers to better screen potential employees.
Table 11: Estimated Effects of Employment Laws on Rates of Returns to Prison
using Ordinary Least Squares
Variables
b (SE) Beta t
Percent of Releases that are Conditional .311 .215 .325 1.448
Imprisonment rate -.028 .037 -.288 -.760
Parolee Race - Percent Black -.167 .257 -.213 -.651
Percent Parolees - Violent -.107 .287 -.114 -.374
Percent Parolees - Property -.156 .461 -.106 -.338
Percent Parolees - Drug -.008 .325 -.007 -.024
Unemployment Rate .963 2.004 .128 .481
Single-Parent Homes .386 1.358 .121 .284
CC Allowed to consider arrests -12.467 10.660 -.341 -1.170
CC Standards in place for public employers -1.901 7.166 -.064 -.265
CC Standards in place for private employers 10.531 10.340 .288 1.018
CC Certificate of Rehabilitation available 6.602 13.046 .137 .506
R-square: .374
N=32
Percent of Prison Admissions that are Parole
Violators
Having standards in place for public employers to protect potential employees
from discrimination had a differential effect for returns to prison for new sentences
versus for technical violations. States which did not have standards in place for public
employers had higher rates of returns to prison for new sentences (with a standardized
This document is a research report submitted to the U.S. Department of Justice. This report has not been published by the Department. Opinions or points of view expressed are those of the author(s)
and do not necessarily reflect the official position or policies of the U.S. Department of Justice.

100
coefficient of .141), providing support for the idea that in the absence of these laws
former offenders had a more difficult time finding employment, and were perhaps more
likely to return to criminal activity. The effect was reversed for returns for technical
violations, in which it appeared that a lack of standards preventing discrimination by
public employers saw a reduction in returns to prison for technical violations
(standardized coefficient of -.142). As discussed with previous laws, it is possible that
this could indicate parole officers are being more lenient regarding technical violations
when there are laws in place which make it more difficult to abide by the terms of
release. The effects of these laws were very weak in the prison data (standardized
coefficient of -.064) and for the percent of all parole violators exiting due to returns to
incarceration (standardized coefficient of .077) which is likely a result of these measures
being made up of both technical violations and new sentences, which appear to have
opposing effects.
Table 12: Estimated Effects of Employment Laws on Rates of Unsuccessful Parole
Completions using Ordinary Least Squares Variables
b (SE) Beta t b (SE) Beta t b (SE) Beta t
Imprisonment rate -.021 .023 -.234 -.934 .020 .011 .469 1.809 -.034 .021 -.348 -1.586
Parolee Race - Percent Black -.250 .139 -.411 -1.801 .040 .068 .143 .582 -.177 .134 -.275 -1.321
Percent Parolees - Violent .118 .221 .148 .532 .095 .110 .252 .859 .108 .215 .124 .502
Percent Parolees - Property .388 .330 .290 1.175 .097 .158 .164 .613 .387 .309 .283 1.251
Percent Parolees - Drug .176 .239 .190 .738 -.110 .120 -.234 -.910 .303 .235 .281 1.291
Unemployment Rate .298 1.321 .046 .226 -.343 .636 -.116 -.538 1.124 1.242 .165 .905
Single-Parent Homes -.148 .832 -.052 -.178 -.785 .428 -.550 -1.832 -.921 .836 -.280 -1.102
CC Allowed to consider arrests -8.303 6.929 -.237 -1.198 -6.181 3.403 -.370 -1.816 -2.017 6.642 -.052 -.304
CC Standards in place for public
employers1.934 4.914 .077 .394 1.625 2.387 .141 .681 -3.781 4.658 -.142 -.812
CC Standards in place for private
employers.798 8.079 .023 .099 4.117 4.049 .247 1.017 .151 7.903 .004 .019
CC Certificate of Rehabilitation
available-4.669 7.567 -.108 -.617 -3.498 4.307 -.164 -.812 -13.066 8.406 -.266 -1.554
R-square: 0.383 0.353 0.537
N 39 36 36
Parole completions returned for
Revocation only
Parole completions returned for
New Sentence only
Parole completions that are
returned to incarceration
Standards preventing private employers from discriminating had a consistently
positive effect across the four models, although the effect was the strongest for returns for
This document is a research report submitted to the U.S. Department of Justice. This report has not been published by the Department. Opinions or points of view expressed are those of the author(s)
and do not necessarily reflect the official position or policies of the U.S. Department of Justice.

101
new sentences (standardized coefficient of.247) and weakest for returns for technical
violations (.004). This is consistent with the hypothesis that states with standards in place
to prevent private employers from discriminating against former offenders may then
employ more former employers and have lower rates of returns to prison for new
sentences, as well as for technical violations. The very weak effect for technical
violations is consistent with the idea that the negative effect of a lack of standards to
prevent discrimination may be offset by sympathetic parole officers.
Finally, the availability of a “Certificate of Rehabilitation,” or something
comparable, was associated with lower rates of returns to prison in the prison data,
consistent with expectations, but higher rates of returns to prison in the parole data.
Certificates of Rehabilitation have met with enthusiasm as a way to placate both sides of
the debate – leaving criminal access to records intact, but also giving former offenders a
mechanism by which to indicate to employers that the former offender has changed. The
negative relationship is strongest for returns to prison for technical violations (with a
standardized coefficient of -.266), which could once again be explained as parole officers
being more lenient regarding technical violations when there is no mechanism for a
person to indicate a reformed status, however the negative relationship persists, although
more weakly, for returns to prison for a new sentence (standardized coefficient of -.164).
One potential explanation is that the presence of Certificates of Rehabilitation may make
it more difficult for some returning offenders to obtain work as employers may only be
willing to hire former offenders that have a Certificate of Rehabilitation, thus making
offenders that do not have one more vulnerable to employee discrimination. It should be
noted however, that the prison data does indicate a positive, (although weak with a
This document is a research report submitted to the U.S. Department of Justice. This report has not been published by the Department. Opinions or points of view expressed are those of the author(s)
and do not necessarily reflect the official position or policies of the U.S. Department of Justice.

102
standardized coefficient of .137) relationship, indicated that states that offer a Certificate
of Rehabilitation (or something comparable) have lower rates of returns to prison.
The impact of the control variables stayed largely the same as in the baseline
model, although there were a few exceptions. The percent of parolees that are property
offenders changed from a very weak positive relationship in the baseline model using
prison data to a very weak negative relationship in the prison model once employment
variables were added, however this is not surprising given that both of these relationships
are very weak, and that neither achieved statistical significance. The effect of percent of
parolees that are drug offenders increased in magnitude in the model predicting new
sentences from a standardized coefficient of -.091 in the baseline model to a standardized
coefficient of -.234, whereas the effect of single parent homes increased in magnitude
from a standardized coefficient of -.181 in the baseline model to a standardized
coefficient of -.280.
I expected laws restricting access to employment would have a moderately strong
effect on rates of returns to prison as these laws affect the day-to-day living of former
offenders by restricting access to work. I expected that harsher restrictions on
employment would be accompanied by higher rates of returns to prison for both new
sentences, based on the idea that persons that do not have stable employment may be
more likely to return to crime, as well as for technical violations, as people without stable
employment may be more likely to be in violation of conditions of release, such as
maintaining steady employment. However, the data tells a different story, with roughly
half of the relationships in the opposite direction as predicted. Most particularly, allowing
employers to consider arrests was negative across all models, and the availability of
This document is a research report submitted to the U.S. Department of Justice. This report has not been published by the Department. Opinions or points of view expressed are those of the author(s)
and do not necessarily reflect the official position or policies of the U.S. Department of Justice.

103
Certificates of Rehabilitation was negative in the parole data. One potential concern is
that this study is not able to look at the intermediary effect of employment. These models
are based upon the assumption that states that allow employers to consider arrest, that do
not have standards in place to prevent discrimination by employees, and that do not offer
Certificates of Rehabilitation will have lower rates of employment for former offenders,
and subsequently will have higher rates of returns of prison. However, as this data is not
able to measure the percent of parolees with steady employment, we are unable to
examine whether these laws have the expected impact on employment.
Interestingly, these laws had a generally negative effect on rates of returns to
prison for technical violations (the only law without a negative relationship has a
magnitude of .004). This could offers the intriguing possibility that while former
offenders could face employment difficulties with or without formalized laws, that parole
officers may be more sympathetic in states in which there are laws documenting the
barriers faced by former offenders.
Public Housing
One area of concern for many people leaving prison is finding housing. Due to
federal legislation targeted at reducing drug markets in public housing, public housing
authorities were encouraged to adopt standards which would evict people suspected of
drug offenses from public housing, and would permanently bar drug offenders from
public housing. However, it is possible that preventing returning offenders from public
housing could make reintegration more difficult, increasing the likelihood of returning to
crime. Also, as many states include maintaining stable housing as a condition of release,
preventing former offenders from living with family in public housing or from applying
This document is a research report submitted to the U.S. Department of Justice. This report has not been published by the Department. Opinions or points of view expressed are those of the author(s)
and do not necessarily reflect the official position or policies of the U.S. Department of Justice.

104
for public housing, could increase the likelihood of being returned to prison for a
technical violation if that person is unable to find alternative housing arrangements.
These laws could have a strong effect given that housing affects a person’s day to day
living, however this effect is likely to be tempered as these restrictions apply only to drug
offenders.
An important caveat to note when examining the relationship between
restrictions on public housing and rates of returns to prison, is that this data reflects the
practices of the most populous county in the state, and that public housing policies can
differ across the state. Thus while it is expected that a high proportion of returning
offenders will be subject to these practices, the data does not account for differences
within the state. The practices considered are whether the Public Housing Authority
(PHA) considers arrests not leading to conviction in their housing decisions, whether
decisions are individualized, and whether there are time limits on how long offenses will
be considered.59
59
Correlations between these factors, as well as Variance Inflation Factors, indicated that there was no
concern with multi-collinearity among these three variables.
This document is a research report submitted to the U.S. Department of Justice. This report has not been published by the Department. Opinions or points of view expressed are those of the author(s)
and do not necessarily reflect the official position or policies of the U.S. Department of Justice.

105
Table 13: Estimated Effects of Housing Laws on Rates of Returns to Prison using
Ordinary Least Squares
Variables
b (SE) Beta t
Percent of Releases that are Conditional .448 * .192 .469 2.342
Imprisonment rate -.044 .030 -.451 -1.447
Parolee Race - Percent Black -.218 .258 -.277 -.845
Percent Parolees - Violent -.265 .301 -.282 -.881
Percent Parolees - Property -.135 .441 -.093 -.307
Percent Parolees - Drug .002 .305 .002 .008
Unemployment Rate 1.762 1.859 .234 .948
Single-Parent Homes .563 1.228 .176 .458
CC Housing decisions consider arrests -9.622 6.257 -.334 -1.538
CC Housing decisions are individualized .985 12.139 .017 .081
CC Housing decisions put time limits on -.784 3.141 -.052 -.249
R-square: .396
N=32∗
p < .05;
∗∗
p < .01;
∗∗∗
p < .001
Percent of Prison Admissions that are Parole
Violators
When first looking at the effect of these laws based on the prison data, the results
indicate that contrary to prediction, harsher housing laws are associated with lower rates
of returns to prison, although the relationship is generally weak (see table 13). Public
Housing Authorities (PHA) that consider arrests not leading to conviction, and which do
not have time limits on crimes that they will consider in the decision making process are
associated with lower rates of returns to prison, while making individualized decisions is
barely positive. This effect is very weak for individualized housing decisions (with a
standardized coefficient of .017) and time limits on offenses (with a standardized
coefficient of -.052), whereas the effect of considering arrests is slightly stronger with a
standardized coefficient of -.334. This indicates that states in which the PHA of the most
populous county is allowed to consider and reject applications for housing based on
arrests for drug offenses that did not lead to conviction have a lower rate of return to
This document is a research report submitted to the U.S. Department of Justice. This report has not been published by the Department. Opinions or points of view expressed are those of the author(s)
and do not necessarily reflect the official position or policies of the U.S. Department of Justice.

106
prison. This is surprising as I expected that allowing the PHA to consider arrests, having
across-the-board exclusionary decisions instead of individualized decisions, and not
having time limits on offenses would lead to more difficulty in obtaining housing, which
would subsequently lead to higher rates of returns to prison for new sentences as well as
technical violations.
Table 14: Estimated Effects of Housing Laws on Rates of Unsuccessful Parole
Completions using Ordinary Least Squares Variables
b (SE) Beta t b (SE) Beta t b (SE) Beta t
Imprisonment rate -.031 .022 -.343 -1.426 .015 .011 .367 1.378 -.038 .021 -.386 -1.810
Parolee Race - Percent Black -.222 .159 -.365 -1.399 .063 .083 .228 .763 -.181 .154 -.283 -1.179
Percent Parolees - Violent .067 .251 .084 .266 .151 .141 .403 1.075 .050 .261 .058 .192
Percent Parolees - Property .406 .348 .303 1.168 .220 .187 .373 1.181 .397 .346 .291 1.149
Percent Parolees - Drug .243 .240 .262 1.010 -.044 .126 -.094 -.350 .408 .234 .378 1.748
Unemployment Rate .300 1.358 .046 .221 -.387 .706 -.131 -.549 1.321 1.308 .193 1.011
Single-Parent Homes .160 .867 .056 .185 -.669 .466 -.469 -1.435 -.397 .863 -.121 -.460
CC Housing decisions consider arrests2.532 4.737 .099 .534 -1.275 2.471 -.109 -.516 3.457 4.576 .128 .756
CC Housing decisions are
individualized7.389 9.515 .144 .777 -4.775 5.483 -.204 -.871 8.622 10.152 .160 .849
CC Housing decisions put time limits
on offense-1.703 2.290 -.132 -.744 -1.130 1.183 -.197 -.955 -2.477 2.191 -.187 -1.131
R-square: 0.347 0.216 0.496
N 39 36 36∗
p < .05;
∗∗
p < .01;
∗∗∗
p < .001
Parole completions returned for
Revocation only
Parole completions returned for
New Sentence only
Parole completions that are
returned to incarceration
The models using information from the parole dataset are more mixed than the
prison data, but also give some indication of a negative relationship between these laws
and rates of returns to prison (see table 14). States in which the PHA of the most
populous county does not consider arrests not leading to conviction, and which make
individualized decisions, have lower rates of returns to prison for percent of all parole
exits resulting in a return to prison and all technical revocations, however they have
higher rates of returns for returns to prison for new sentences. That is, it appears that
when the PHA is allowed to consider arrests not leading to conviction in housing
decisions, that they have a slightly higher rates of returns to prison for technical
violations (.128), but slightly lower rates of returns to prison for a new sentence (-.109).
This document is a research report submitted to the U.S. Department of Justice. This report has not been published by the Department. Opinions or points of view expressed are those of the author(s)
and do not necessarily reflect the official position or policies of the U.S. Department of Justice.

107
And if the PHA makes blanket decisions regarding certain categories of drug offenders,
rather than individualized decisions, that they have higher rates of returns to prison for
technical violations (.160), but lower rates of returns to prison for a new sentence (-.204).
Having time limits on whether offenses can be considered in the housing decision
has a consistently negative effect, indicating that in states where the PHA of the most
populous counties can consider a drug offense indefinitely after it was committed have
lower rates of returns to prison. This relationship is similar between returns for new
sentences (with a standardized coefficient of -.197) and technical violations (with a
standardized coefficient of -.187).
For the most part, the control variables included in the model including housing
practices maintained the general relationship found in the baseline models. However,
there were some exceptions. In the prison data, the percent of parolees that were property
offenders, and the percent of parolees that were drug offenders changed directions from
being very slightly positively related to rates of returns to prison, to very slightly
negatively related to rates of returns to prison (with standardized coefficients of .047 and
.116 in the baseline model respectively, to standardized coefficients of -.089 to -.011 in
the model including housing practices). Again, this is not concerning given their weak
relationships and that they were not statistically significant. The only change in the
control variables in the parole variables was in the overall model looking at parole
violations, in which single-parent homes changed from a very weak negative relationship
(with a standardized coefficient of -.026) to a very weak positive relationship (.056).
One potential explanation for the negative relationships found between laws
restricting access to public housing and rates of returns to prison may be related to the
This document is a research report submitted to the U.S. Department of Justice. This report has not been published by the Department. Opinions or points of view expressed are those of the author(s)
and do not necessarily reflect the official position or policies of the U.S. Department of Justice.

108
original intent of these laws, which was to disrupt drug markets within public housing. It
may be that by preventing returning drug offenders from living in public housing, that
they prevent those offenders from re-entering the drug market. This would explain why
practices restricting access to public housing have a consistently negative relationship on
rates of returns to prison in the prison data, as well as percent of exits from parole due to
returns to incarceration for new sentences. However this interpretation is speculative at
best, the increases to the R-square were relatively modest, and the relationship with
technical violations was mixed. States in which the PHA in the largest county considered
drug arrests not leading to conviction and which did not use individualized decisions had
higher rates of returns to prison for technical violations, but states which did not put time
limits on offenses had lower rates of returns to prison for technical violations. The largest
increase in R-square was in the prison data, and only increased from .308 in the baseline
model to .396 in the model including housing laws. These modest increases in R-square
may be indicative of the fact that these practices do not cover all PHAs in the state, but
only the PHA in the most populous county.
Unfortunately I am unable to capture other housing options in the state, for
instance whether there are affordable private housing options, the willingness of
landlords to rent to returning offenders, as well as the availability of transitional housing
such as halfway houses. It is quite possible that these factors could have a spurious
relationship in the model – that is, PHAs may be more amenable to allowing former
offenders to live in public housing, when they see other housing options as being more
limited. These other options may also be related to lower rates of returns to prison.
This document is a research report submitted to the U.S. Department of Justice. This report has not been published by the Department. Opinions or points of view expressed are those of the author(s)
and do not necessarily reflect the official position or policies of the U.S. Department of Justice.

109
Unfortunately, without measures of these alternative living arrangements, we are unable
to test whether this is the case.
Public Assistance
The 1996 Personal Responsibility and Work Opportunity Reconciliation Act
instituted a lifetime ban on Temporary Assistance for Needy Families (TANF) for
persons that were convicted of a drug felony. States had the option to adopt, modify or
opt out of this law. I expect that states that adopted this law will have higher rates of
returns to prison as many people with a prison record may struggle to support themselves.
I would expect these laws to have a strong effect as they effect a person’s day to day
living, but the effect on the aggregate rates of return to prison may be tempered by the
fact that these restrictions only affect people convicted of a drug felony, and not all
offenders.
Restrictions on access to TANF have a mixed relationship with rates of returns to
prison. Contrary to expectation, restrictions on TANF are negatively related to rates of
returns to prison in the prison data, with a standardized coefficient of -.238 (see table 15).
This indicates that states that restrict access to TANF for drug offenders have a lower
percent of prison admissions being made up of offenders that were on conditional release
when they entered prison. Similarly, states that restrict access to TANF have lower rates
of returns to prison for new sentences, with a standardized coefficient of -.210 (see table
16). This is surprising given that it is difficult to explain why restricting access to public
assistance would make a person less likely to return to criminal activity.
This document is a research report submitted to the U.S. Department of Justice. This report has not been published by the Department. Opinions or points of view expressed are those of the author(s)
and do not necessarily reflect the official position or policies of the U.S. Department of Justice.

110
Table 15: Estimated Effects of TANF Laws on Rates of Returns to Prison using
Ordinary Least Squares
Variables
b (SE) Beta t
Percent of Releases that are Conditional .435 * .180 .455 2.413
Imprisonment rate -.045 .029 -.460 -1.544
Parolee Race - Percent Black -.144 .234 -.183 -.615
Percent Parolees - Violent -.161 .270 -.172 -.598
Percent Parolees - Property .109 .398 .075 .275
Percent Parolees - Drug .133 .289 .119 .460
Unemployment Rate .743 1.834 .099 .405
Single-Parent Homes .708 1.156 .221 .612
CC TANF Restrictions -5.559 4.694 -.238 -1.184
R-square: .350
N=32∗
p < .05;
∗∗
p < .01;
∗∗∗
p < .001
Percent of Prison Admissions that are Parole
Violators
In contrast, rates of returns for technical violations, as well as overall violations in
the parole data, are positively related to restrictions on TANF (with standardized
coefficients of .185 and .215 respectively), indicating that states that restrict access to
TANF have higher rates of returns to prison for technical violations (as well as in the
overall measure of returns to prison from parole). However, it is puzzling as to why
restrictions on TANF would result in higher rates of returns to prison for technical
violations, but not for new sentences.
This document is a research report submitted to the U.S. Department of Justice. This report has not been published by the Department. Opinions or points of view expressed are those of the author(s)
and do not necessarily reflect the official position or policies of the U.S. Department of Justice.

111
Table 16: Estimated Effects of TANF Laws on Rates of Unsuccessful Parole Completions using
Ordinary Least Squares Variables
b (SE) Beta t b (SE) Beta t b (SE) Beta t
Imprisonment rate -.030 .021 -.335 -1.456 .016 .011 .373 1.449 -.035 .020 -.364 -1.747
Parolee Race - Percent Black -.238 .133 -.392 -1.791 .055 .071 .199 .779 -.230 .133 -.358 -1.732
Percent Parolees - Violent .134 .216 .169 .621 .055 .118 .147 .466 .143 .221 .164 .646
Percent Parolees - Property .358 .284 .267 1.259 .119 .151 .201 .786 .338 .282 .248 1.202
Percent Parolees - Drug .289 .230 .312 1.259 -.074 .125 -.157 -.590 .471 .233 .436 2.020
Unemployment Rate .739 1.274 .114 .580 -.476 .667 -.161 -.713 1.729 1.245 .253 1.388
Single-Parent Homes -.118 .802 -.041 -.147 -.619 .440 -.434 -1.405 -.535 .822 -.163 -.651
CC TANF Restrictions 4.409 3.174 .215 1.389 -1.951 1.712 -.210 -1.140 3.966 3.195 .185 1.241
R-square: 0.355 0.196 0.475
N 39 36 36∗
p < .05;
∗∗
p < .01;
∗∗∗
p < .001
Parole completions returned for
New Sentence only
Parole completions that are
returned to incarceration
Parole completions returned for
Revocation only
The control variables in these models had similar relationships as found in the
baseline model, and none changed direction. The increase in the R-squares for these
models were modest, the largest increase was in the measure of all parole completions
that are returned to incarceration which increased from .314 in the baseline model to .355
in the model including restrictions on access to TANF.
Driver’s Licenses
Restrictions on access to driver’s licenses for people convicted of drug crimes has
come under scrutiny as making it more difficult for returning offenders to drive to and
from their jobs, thus increasing the likelihood of losing their job. This law affects the day
to day living of offenders, but similar to the public housing and TANF law is restricted in
effect to only drug offenders. Three laws are examined; whether driver’s licenses are
revoked for driving-related offenses only (as opposed to drug offenses not involving
driving) whether a restricted license is offered to allow a person to drive to and from
work, and whether driver’s licenses are revoked for more than six months.
This document is a research report submitted to the U.S. Department of Justice. This report has not been published by the Department. Opinions or points of view expressed are those of the author(s)
and do not necessarily reflect the official position or policies of the U.S. Department of Justice.

112
Table 17: Estimated Effects of Drivers' License Laws on Rates of Returns to Prison
using Ordinary Least Squares
Variables
b (SE) Beta t
Percent of Releases that are Conditional .494 * .195 .516 2.528
Imprisonment rate -.044 .032 -.456 -1.368
Parolee Race - Percent Black -.137 .258 -.175 -.532
Percent Parolees - Violent -.039 .289 -.042 -.136
Percent Parolees - Property .090 .426 .061 .211
Percent Parolees - Drug .118 .332 .106 .357
Unemployment Rate .972 1.916 .129 .507
Single-Parent Homes .712 1.219 .223 .584
CC Drivers' Licenses only driving related
offenses.478 6.337 .017 .075
CC Drivers' Licenses offer restrictive license 9.604 7.599 .244 1.264
CC Drivers' Licenses more than 6 months -2.330 10.260 -.048 -.227
R-square: .366
N=32∗
p < .05;
∗∗
p < .01;
∗∗∗
p < .001
Percent of Prison Admissions that are Parole
Violators
Laws restricting access to driver’s licenses have an inconsistent effect on rates of
returns to prison. States that only restrict driver’s licenses for driving related offenses,
rather than all drug offense, are related to lower rates of returns to prison only in the
prison model, and this effect is exceedingly weak with a standardized coefficient of .008
(see table 17). States which limit revocation of driver’s licenses to only driving related
incidents have higher rates of returns to prison, contrary to expectations, in the parole
data (see table 18), however this relationship is relatively weak with a standardized
coefficient of -.113 for returns for new sentences, and -.026 for returns for technical
violations.
This document is a research report submitted to the U.S. Department of Justice. This report has not been published by the Department. Opinions or points of view expressed are those of the author(s)
and do not necessarily reflect the official position or policies of the U.S. Department of Justice.

113
Table 18: Estimated Effects of Drivers' License Laws on Rates of Unsuccessful
Parole Completions using Ordinary Least Squares Variables
b (SE) Beta t b (SE) Beta t b (SE) Beta t
Imprisonment rate -.033 .022 -.369 -1.494 .021 .011 .504 1.884 -.046 * .019 -.472 -2.481
Parolee Race - Percent Black -.239 .141 -.393 -1.696 .066 .074 .236 .885 -.264 * .122 -.411 -2.164
Percent Parolees - Violent .089 .220 .112 .403 .059 .114 .158 .520 .154 .187 .178 .823
Percent Parolees - Property .361 .292 .269 1.234 .105 .148 .178 .707 .408 .244 .299 1.672
Percent Parolees - Drug .283 .237 .305 1.193 -.082 .121 -.176 -.678 .515 * .199 .476 2.587
Unemployment Rate .317 1.302 .049 .244 -.222 .646 -.075 -.344 1.118 1.060 .164 1.054
Single-Parent Homes .053 .831 .018 .063 -.702 .445 -.492 -1.578 -.221 .731 -.067 -.303
CC Drivers' Licenses only driving
related offenses-1.430 4.459 -.056 -.321 -1.318 2.401 -.113 -.549 -.709 3.942 -.026 -.180
CC Drivers' Licenses offer restrictive
license-6.857 5.304 -.208 -1.293 4.761 2.981 .307 1.597 -13.980
*4.896 -.391 -2.855
CC Drivers' Licenses more than 6
months3.217 7.964 .068 .404 -3.654 4.004 -.175 -.913 8.672 6.574 .180 1.319
R-square: 0.367 0.286 0.639
N 39 36 36∗
p < .05;
∗∗
p < .01;
∗∗∗
p < .001
Parole completions returned for
Revocation only
Parole completions returned for
New Sentence only
Parole completions that are
returned to incarceration
Access to a restrictive license, which allows a person access to a vehicle for only
certain activities, such as those related to employment, is related to lower rates of returns
to prison in the prison model, and in the “new sentences only” parole model, but is
related to higher rates of returns to prison in the overall percent of exits from parole that
are returns to incarceration as well as for technical violations. The positive effect is
moderately strong for new sentences, with a standardized coefficient of .307, indicating
that offering a restrictive driver’s license lowers rates of returns to prison for new
sentences. Interestingly, the negative relationship of restrictive driver’s licenses on
technical violations is moderately strong with a standardized coefficient of -.391, and is
the only time a collateral consequence law has a statistically significant relationship. This
is contrary to expectations as we would expect that in states in which people have access
to a restrictive license, that they are better able to abide by conditions of release, such as
maintaining stable employment or attending parole appointments, when they have access
to a vehicle. However, once again, it is possible that parole officers are more lenient
This document is a research report submitted to the U.S. Department of Justice. This report has not been published by the Department. Opinions or points of view expressed are those of the author(s)
and do not necessarily reflect the official position or policies of the U.S. Department of Justice.

114
regarding technical violations when a law is in place that formally restricts a former
offenders access to a motor vehicle, in this case in terms of maintaining steady
employment but also in attending regular appointments with parole officers. Possibly
parole officers are more lenient when a person misses a parole appointment, or if the
person loses their job, when the offender is legally restricted from access to a vehicle.
Finally states that restrict drivers’ licenses for more than six months have higher
rates of returns to prison for technical violations and for all parole exits due to returns to
incarceration, however they have lower rates of returns to prison in the prison model and
the “new sentences” only model. Thus it appears that longer periods without access to a
car increase the likelihood of a person returning to prison on a technical violation
(standardized coefficient .180), but lower the chances that they will return to prison for a
new sentence (standardized coefficient -.175). One explanation for a negative relationship
with new sentences is that perhaps having access to a car creates more opportunities or
temptations for a person to engage in criminal activity. For instance, having access to a
drivers’ license may increase the social activities a person is able to engage in, and could
lead to temptations for criminal involvement. Given that the other two collateral
consequence laws (for limiting restrictions to only driving offenses, and offering a
restrictive license) had negative relationships with technical violations, it is surprising
that restrictions on drivers’ licenses of more than six months would have a positive
relationship. If it is true that parole officers are more lenient when formal, legal
restrictions are in place, this may indicate that there is a time limit to this leniency when it
comes to driver’s licenses. While parole officers may be more lenient regarding
violations that may stem from lack of access to a vehicle, they may have expected for
This document is a research report submitted to the U.S. Department of Justice. This report has not been published by the Department. Opinions or points of view expressed are those of the author(s)
and do not necessarily reflect the official position or policies of the U.S. Department of Justice.

115
offenders to have adjusted to these restrictions after several months, and found ways,
such a public transportation, to accommodate these restrictions. On the other side, it is
possible that parolees may be more likely to violate parole by driving without a license
when the restriction lasts longer than six months, whereas when the restriction is for only
six months, they may be more committed from abstaining from driving during that time.
The control variables in the models retained the same relationship with rates of
returns to prison.60
Interestingly, the magnitude of the relationships of the control
variables strengthened in the model predicting rates of returns for technical violations to
the extent that imprisonment rates, percent of parolees that are black, and percent of
parolees that are drug offenders were statistically significant in the model. The model
predicting technical violations also saw the largest increase in R-square, from .445 in the
baseline model to .639 in the model including restrictions on driver’s licenses. The model
predicting new sentences saw an increase in the R-square from .157 in the baseline model
to .286 in the new model.
The results from the models examining the effect of laws restricting access to
driver’s licenses offer some intriguing findings. They appear to hint that restrictions on
driver’s licenses could reduce the likelihood of criminal activity among former offenders,
contrary to expectations. One potential explanation is that when former offenders are able
to drive, particularly in the six month period after release when recidivism rates are at
their highest, that have access to a vehicle could put them in more situations that might
tempt them to return to criminal activity. The car could allow them to attend more social
60
The effect of “single-parent homes” changed directions in the “percent of prison admissions that are
parole violators” model, but it changed from a standardized coefficient of -.029 in the baseline model, to a
standardized coefficient of .018 in the new model, and thus is a very minor change.
This document is a research report submitted to the U.S. Department of Justice. This report has not been published by the Department. Opinions or points of view expressed are those of the author(s)
and do not necessarily reflect the official position or policies of the U.S. Department of Justice.

116
engagements, where drugs could be present, where altercations could occur, or where
they may make the decision to drive after drinking with friends. The exception to this is
when a person is given access to a restrictive license which allows them to travel only for
certain purposes, such as to and from a job. States with access to a restrictive license have
lower rates of returns to prison than states that do not have access to a restrictive license.
This may indicate that a restrictive license allows a person to maintain employment, but
does not offer them the opportunity to be as involved socially.
These laws appear to have a different effect on technical violations. States that
restrict driver’s licenses of all drug offenders, even when the offense was not driving
related, and states that do not offer a restrictive license, have lower rates of returns to
prison. This may indicate greater sympathy on the part of parole officers in situations
when a law makes abiding by the terms of release more difficult. However, the
relationship differs when driver’s licenses are revoked for more than six months, with
these states experiences higher rates of returns to prison for technical violations, perhaps
indicating that this leniency by parole officers eventually expires.
Cumulative Effect of Collateral Consequence Laws
Potentially the effect of collateral consequence laws could combine in a
cumulative effect. To examine these effects, I created two cumulative scores for each
state as a measure of the overall harshness of their collateral consequence laws. The first
score scaled each law from zero to one, and then summed the scores. Thus scores had a
possible range from zero to 18, although in actuality ranged from two to 13.41. This
measure gives equal weight to each individual law. The second score gives equal weight
to each category of law, rather than each individual law. Each law (scored zero to one)
This document is a research report submitted to the U.S. Department of Justice. This report has not been published by the Department. Opinions or points of view expressed are those of the author(s)
and do not necessarily reflect the official position or policies of the U.S. Department of Justice.

117
was summed within each category. These measures were then scaled from zero to one,
and then combined, resulting in a score that could hypothetically range from zero to 6.
Actual scores ranged from 1.25 to 4.72.61
I first tested the effect of these scores in bivariate relationships with the four
measures of rates of returns to prison. Both variables had very weak positive relationships
with returns to prison for new sentences, but had moderate negative relationships with the
other measures. Particularly interesting is that both variables reached significance in the
model predicting rates of returns to prison for technical violations using a .1 cutoff (see
table 19).62
Table 19: Bivariate Correlation of Collateral Consequence Laws on Rates of Unsuccessful Parole
Completions
Beta Sig. N Beta Sig. N Beta Sig. NSum of 18 laws, each law weighed equally
-.153 .311 46 .091 .564 42 -.301 .053 42
Sum of 18 laws, each category weighed
equally -.198 .187 46 .040 .803 42 -.296 .057 42
Parole completions that are
returned to incarceration
Parole completions returned
for New Sentence only
Parole completions returned
for Revocation only
These variables were no longer significant in regression models in which control
variables were included, however they did maintain the negative relationship (see tables
20 and 21). This is consistent with the hypothesis that parole officers may be more lenient
in which formalize barriers to reintegration through collateral consequence laws.
61
I also created two scores (based on the 18 laws, and based on the 6 categories) using factor analysis.
Results were similar to those reported here, with slight differences in magnitude and significance. 62
Scatter Plots of the cumulative collateral consequence measures and the dependent variables can be
found in the appendix.
This document is a research report submitted to the U.S. Department of Justice. This report has not been published by the Department. Opinions or points of view expressed are those of the author(s)
and do not necessarily reflect the official position or policies of the U.S. Department of Justice.

118
Table 20: Estimated Effects of Collateral Consequence Laws on Rates of Unsuccessful Parole
Completions using Ordinary Least Squares Variables
b (SE) Beta t b (SE) Beta t b (SE) Beta tImprisonment rate -.029 .021 -.324 -1.388 .015 .011 .356 1.364 -.034 .020 -.353 -1.732
Parolee Race - Percent Black -.228 .135 -.376 -1.694 .044 .072 .160 .621 -.210 .129 -.328 -1.631
Percent Parolees - Violent .078 .216 .098 .361 .082 .117 .218 .700 .075 .211 .086 .354
Percent Parolees - Property .360 .290 .269 1.243 .140 .153 .237 .913 .346 .276 .253 1.253
Percent Parolees - Drug .208 .233 .224 .890 -.058 .126 -.124 -.461 .343 .226 .317 1.514
Unemployment Rate .078 1.303 .012 .060 -.414 .677 -.140 -.611 .961 1.220 .141 .788
Single-Parent Homes .045 .823 .016 .054 -.555 .448 -.389 -1.237 -.455 .808 -.138 -.563
CC Laws - 18 laws weighed equally -.857 .882 -.151 -.971 -.326 .463 -.128 -.704 -1.383 .834 -.236 -1.658
R-square: 0.157 0.173 0.496
N 39 36 36∗
p < .05;
∗∗
p < .01;
∗∗∗
p < .001
Parole completions that are
returned to incarceration
Parole completions returned for
New Sentence only
Parole completions returned for
Revocation only
Table 21: Estimated Effects of Collateral Consequence Laws on Rates of Unsuccessful Parole
Completions using Ordinary Least Squares Variables
b (SE) Beta t b (SE) Beta t b (SE) Beta tImprisonment rate -.028 .021 -.315 -1.335 .016 .011 .375 1.460 -.033 .021 -.338 -1.607
Parolee Race - Percent Black -.223 .136 -.366 -1.636 .049 .070 .176 .694 -.203 .133 -.316 -1.520
Percent Parolees - Violent .082 .218 .104 .377 .085 .115 .226 .738 .085 .218 .098 .389
Percent Parolees - Property .351 .293 .262 1.199 .149 .151 .252 .986 .336 .285 .247 1.179
Percent Parolees - Drug .233 .234 .251 .996 -.060 .123 -.128 -.490 .382 .232 .354 1.647
Unemployment Rate .191 1.323 .029 .144 -.501 .669 -.169 -.749 1.116 1.266 .163 .881
Single-Parent Homes -.014 .830 -.005 -.017 -.551 .439 -.386 -1.253 -.542 .832 -.165 -.651
CC Laws - 6 Categories weighed equally -1.502 2.733 -.087 -.549 -1.701 1.416 -.216 -1.201 -2.504 2.680 -.138 -.934
R-square: 0.320 0.200 0.303
N 39 36 36∗
p < .05;
∗∗
p < .01;
∗∗∗
p < .001
Parole completions that are
returned to incarceration
Parole completions returned for
New Sentence only
Parole completions returned for
Revocation only
Fixed Effects Analysis of TANF Restrictions
As another test of the effect of collateral consequence laws, I examine the
longitudinal effect of one law in particular – access to Temporary Assistance to Needy
Families (TANF). TANF restrictions are particularly well suited to a focused
examination because these laws were spurred by federal legislation, and therefore were
implemented, albeit in different forms, across states at roughly the same time. This means
there is significant change in the laws during this time, as states moved from having no
restrictions on access to public assistance for drug offenders, to several states adopting
such restrictions. I collected data on a seven year period – starting in 1994, roughly three
years before the law went into effect for most states, and continuing until 2000.
This document is a research report submitted to the U.S. Department of Justice. This report has not been published by the Department. Opinions or points of view expressed are those of the author(s)
and do not necessarily reflect the official position or policies of the U.S. Department of Justice.

119
The advantage of the fixed effects approach is that unobserved heterogeneity is
modeled as a time constant intercept for each state, and therefore the unobserved
heterogeneity is no longer part of the error term (Bushway et al 1999, Loughran 2011).
That is, while in random-effects models, stable, unmeasured differences that exist
between the states introduce error into the model, those differences are accounted for as
part of this model by using state-specific dummy variables. This model takes into account
state-specific factors that occur over time, such as cultural differences, allowing estimates
to remain unbiased when unmeasured, stable characteristics that are associated with the
independent variable influence the dependent variable.
The equation used to represent the fixed-effects model is as follows:
yit = β1xit + δ0d2t + ai + εit
The yit denotes the rates of returns to prison (y) for the state (i) at time (t). β1 is the
coefficient for the explanatory variable (xit). δ0d2t is an indicator for being in time period
two. The term ai represents the unobserved factors that remain constant at the state level
(i), controlling for the unobserved heterogeneity. εit represents the idiosyncratic error that
effects the dependent variable and occurs within the state (i) and across time (t).
Data for Fixed Effects Analysis
States are coded as either adopting the laws (making anyone convicted of a felony
drug offense permanently ineligible for TANF), modifying the law (such as allowing
persons to regain eligibility after a rehabilitation program, or by only restricting TANF
for certain drug offenders), or opting out of the laws (allowing drug offenders to maintain
eligibility for TANF). While the initial source of information on collateral consequence
This document is a research report submitted to the U.S. Department of Justice. This report has not been published by the Department. Opinions or points of view expressed are those of the author(s)
and do not necessarily reflect the official position or policies of the U.S. Department of Justice.

120
laws in the previous analyses was the 2009 LAC report, for this analysis I needed to
examine the data as it was initially passed in each state, as well as any subsequent data in
the years of interest. The Urban Instituted has compiled the “Welfare Rules Database”,
which tracks changes in TANF by state on an annual basis since 1996. Information from
the Welfare Rules Database on restrictions on TANF for drug offenders was compared to
other data sources, including the LAC 2004 report, the “Summary of State Laws”
provided as part of the LAC “Opting out of federal ban on food stamps and TANF
Toolkit”, and the 2005 Government Office of Accountability report, “Drug Offenders:
Various factors may limit the impact of federal laws that provide for denial of selected
benefits.” Contradictions between the different sources were resolved by looking at
information on state websites, and in some cases contacting the authors of the reports.
During the four year period following the 1996 Personal Responsibility and Work
Opportunity Reconciliation Act, about two-fifths of states adopted the ban in its entirety,
while half of the states adopted a modified version of the ban (see table 22).
Table 22: Eligibility of drug offenders to receive public assistance
1994* 1995* 1996* 1997 1998 1999 2000
Eligible 50 50 50 8 7 7 7
Modified
23 24 24 25
Ineligible
19 19 19 18
* Restrictions on access to public assistance for drug offenders was introduced with the
1996 Personal Responsibility and Work Opportunity Reconciliation Act
As a measure of state rates of returns to prison I used the Bureau of Justice
Statistics (BJS) parole data,63
specifically the percentage of people that exited parole
63
Originally I used data from the parole dataset with the intent to measure returns for “new sentences” as
compared to “returns for technical violations only.” Unfortunately, an insufficient number of states
collected such data during this time period.
This document is a research report submitted to the U.S. Department of Justice. This report has not been published by the Department. Opinions or points of view expressed are those of the author(s)
and do not necessarily reflect the official position or policies of the U.S. Department of Justice.

121
status due to a return to incarceration for new sentences, technical violations, or for other
reasons.64
While initially the intention of using the parole data was to be able to run
separate analyses for rates of returns to prison for new sentences and for technical
violations, ultimately not enough states collected information on this distinction during
this time period.
Findings of Fixed Effects Analysis
In the model, states’ laws restricting access to TANF are regressed on the states’
percent of parole completions resulting from a return to prison, with a dummy variable
included for each state. I also include a parameter for the year effect in order to control
for any annual trends.
The model indicates that, as predicted, the restrictions on TANF did have a
positive, and statistically significant effect on a state’s rate of return to prison, with a
standardized coefficient of .204 (see table 23). This offers preliminary support for the
hypothesis that states that instituted restrictions on TANF experienced an increase in their
percent of parole completions that were returned to incarceration, however a more
complete analysis which includes state-level controls is needed.
64
This variable counts only unsatisfactory completions that were due to returns to incarceration (whether
for new sentences, technical violations, or “other” reasons), and excludes from the numberator and
denominator completions for “other” reasons, such as deaths, transfers, absconders, and “other”.
I also tested another measure which measured any completion that was not considered “successful”. This
would include exits for absconding, death, transfers etc. This variable also had a relationship with the
TANF variable in the expected direction, but did not reach significance. This was as expected as there is
little reason to expect TANF laws to have an effect on how states use the “other” category.
Beginning in 1998 BJS broke the “other” category into more category choices, including “other-
unsatisfactory” and absconder. As an additional test, I created another dependent variable which used the
previously mentions “not successful” category prior to 1998, and which excluded “other” categories that
were not explicitly unsatisfactory (such as deaths, transfers and “others”). Ultimately this variable mirrored
the “not successful” variable, the effect of TANF was in the expected direction, but was not significant.
This document is a research report submitted to the U.S. Department of Justice. This report has not been published by the Department. Opinions or points of view expressed are those of the author(s)
and do not necessarily reflect the official position or policies of the U.S. Department of Justice.

122
Table 23: Fixed Effects Regression on TANF Laws
Measure
Fixed-
Effects
B
Standard
Error Beta t
TANF Law .168 ** .040 .204 4.253
1995 .076 ** .025 .065 3.037
1996 .084 *** .025 .071 3.335
1997 -.011 .035 -.009 -.306
1998 -.010 .035 -.009 -.289
1999 -.030 .035 -.025 -.836
2000 -.038 .035 -.033 -1.074∗
p < .05;
∗∗
p < .01;
∗∗∗
p < .001
Discussion of Results
In these analyses I used data from two different sources – the BJS prison data and
the BJS parole data Agreement between the two data sources would increase confidence
in any trends that were found. Unfortunately, the effects of the collateral consequence
laws were mixed between the two datasets, as well as within the parole data (when using
different outcome measurements). Perhaps most intriguing in the data was the suggestion
of different processes for rates of returns to prison for new sentences versus technical
violations. While the effect of the laws on returns to prison for new sentences was mixed,
it was more likely to be found in the expected direction (harsher laws leading to higher
rates of returns for new sentences), whereas technical violations were more likely to have
a negative relationship, indicating that harsher laws led to lower rates of returns to prison
for technical violation. Although this data is unable to speak to why this relationship
exists, one potential explanation is that in states with harsher laws, parole officers may be
more sympathetic when a parolee commits a technical violation, particularly one that can
This document is a research report submitted to the U.S. Department of Justice. This report has not been published by the Department. Opinions or points of view expressed are those of the author(s)
and do not necessarily reflect the official position or policies of the U.S. Department of Justice.

123
be directly traced to these restrictions. More research is necessary to confirm these
findings.
Restrictions on voting were related to lower rates of returns to prison, indicating
that states in which more people were disenfranchised had lower rates of returns to
prison. Although these effects were weak, they were consistent across all models. There
is little reason to expect that disenfranchisement would reduce levels of offending or
likelihood of committing a technical violation of parole. It is possible that voting laws
are correlated with an unmeasured variable, and thus an unmeasured, spurious effect is
causing this relationship. For instance, voting laws may be correlated with political
leanings in a state and consequently how a state administers parole or responds to parole
violations. Voting laws are significantly negatively correlated with the percent of
individuals that voted for Obama in the 2008 election, and are also significantly
correlated with being located in the South. While inclusion of these variables in the
model does not affect the negative relationship of the voting laws, they suggest that there
may be error in the model due to an unmeasured spurious relationship.
The effects of access to criminal records on state rates of returns to prison vary
based upon the law, and also varied between the prison and parole models. For instance,
access to online records was positive in three of the four models, a relationship that is
consistent with previous research (Lee 2011). However, access to online records has a
negative relationship for returns to prison for technical violations only. Most interesting
in these models was the variation in the effect of the laws on returns to prison for new
sentences as opposed to technical violations. Harsh collateral consequence laws were
more likely to be positively related to returns to prison for new sentences, but negatively
This document is a research report submitted to the U.S. Department of Justice. This report has not been published by the Department. Opinions or points of view expressed are those of the author(s)
and do not necessarily reflect the official position or policies of the U.S. Department of Justice.
124
related to rates of returns to prison for technical violation. While this is consistent with
the original prediction that harsher collateral consequence laws will lead to higher rates
of returns to prison for new sentences, it was unexpected that these same harsh laws were
likely to be related, although weakly, to lower rates of returns to prison for technical
violations.
As previously suggested, one possible explanation is that parole officers may be
more lenient with parolees for technical violations, particularly in violations involving
maintaining steady employment, if they believe that parolees are facing discrimination in
the workforce. Parole officers may be more sympathetic when a parolee has difficulty
abiding by the terms of release when they are aware that online access to records may
make employment more difficult for the parolee. This may also help explain some of the
other negative relationships found between collateral consequence laws related to access
to records and technical violations: time limits on convictions, access by the general
public to records, and whether a person can petition to have an arrest not leading to
conviction expunged all had negative relationship with technical violations. Potentially
this could reflect that parole officers are more sympathetic to parolees, and thus more
reluctant to return them to prison on a technical violation, when there are public laws that
may make employment more difficult. Previous research has indicated that when
employers do not have access to public records, that they are more likely to engage in
statistical discrimination in an attempt to not hire persons with a criminal record (Holzer
et al 2006). Thus it is possible that employers in states with less access to criminal
records still manage to avoid hiring formerly incarcerated persons (using cues such as
gaps in employment history), but that because it is not formalized by law, that parole
This document is a research report submitted to the U.S. Department of Justice. This report has not been published by the Department. Opinions or points of view expressed are those of the author(s)
and do not necessarily reflect the official position or policies of the U.S. Department of Justice.

125
officers in those states view inability to find a job as a personal failing rather than as a
systematic event.
While we can explain a negative relationship between these laws and technical
violations as being a result of sympathy by parole officers regarding these laws, it is
difficult to explain why two of the six collateral consequence laws, time limits on arrests
not leading to conviction and wider availability of records to the public would have lower
rates of returns to prison for new sentences.
The effects of restrictions on employment were also mixed, both between the two
datasets as well as within the parole dataset. Contrary to prediction, states which allowed
employers to consider arrests not leading to conviction had lower rates of returns to
prison across all four models. Similar to the access to records, this could indicate that
formalization of hurdles may cause parole officers to be more lenient in deciding whether
or not to return a parolee to incarceration. In terms of explaining its relationship with new
sentences, perhaps allowing employers to consider arrests not leading to conviction does
allow them to avoid hiring people that might commit more crime during the course of the
job. Having standards in place to prevent discrimination in private companies did appear
to be helpful in all four models, however those having standards in place to prevent
discrimination in public companies was beneficial in terms of rate of returns to prison for
new sentences and in the overall parole data, but had a negative relationship in the prison
data, as well as in returns for technical violations. Once again, a potential explanation for
this is due to leniency by parole officers in these states. Certificates of rehabilitation have
been argued by some to be one of the most important factors in allowing people to
successfully reintegrate (private correspondence with Margy Love), however they had a
This document is a research report submitted to the U.S. Department of Justice. This report has not been published by the Department. Opinions or points of view expressed are those of the author(s)
and do not necessarily reflect the official position or policies of the U.S. Department of Justice.

126
negative relationship in all of the models using parole data. However, while the
relationship was consistently negative in the parole data, it was positive in the prison
data. The negative relationship found in the parole data may indicate that Certificates of
Rehabilitation may not be sufficient to convince employers to overlook the criminal
records of potential employees. One potential concern is that these measures do not
capture what may be the most important factor of employment laws - namely which jobs
are restricted. That is, whether or not employers consider arrests, have standards in place
to prevent discrimination, or offer certificates of rehabilitation, may not be as important
as whether the state flatly refuses occupational licenses in particular fields – such as
being a barber, or being a garbage collector. In addition, as I am unable to include a
measure of the employment rates of employees, I am unable to determine whether these
laws actually have an impact on employment.
While a person’s ability to maintain stable housing is potentially important in
successful reintegration, the relationships uncovered indicated primarily negative
relationships, indicating that contrary to expectations greater restrictions on public
housing led to lower rates of returns to prison. It is important to note in the interpretation
of these results however, that public housing practices can vary across the state and these
practices reflect only the policies Public Housing Authority (PHA) in the most populous
county in the state, whereas the rates of returns to prison are for the entire states.
The three measures of collateral consequence laws in housing were all negative in
the prison data. The parole data was more equivocal, with positive relationships for
considering arrests not leading to conviction and the use of automatic denial in the overall
parole model, as well as for technical violations. However these same two variables were
This document is a research report submitted to the U.S. Department of Justice. This report has not been published by the Department. Opinions or points of view expressed are those of the author(s)
and do not necessarily reflect the official position or policies of the U.S. Department of Justice.

127
associated with lower rates of returns to prison for new sentences. Having time limits on
when a persons’ past criminal record could be considered in an application to public
housing had a negative relationship across the three parole models. One potential
explanation for a negative relationship is that while restrictions on public housing may
make finding housing more difficult, it may also help prevent returning offenders from
renewing relationships with past criminal networks. Living in public housing may
provide more opportunities to commit crime, or make it harder to resist temptations, such
as using drugs. These models hint at the possibility that access to public housing may be
detrimental to successful reintegration.
A difficulty with these measures of housing, is that they only measure one small
aspect of housing, that is, public housing. It does not include measures of a states use of
half-way houses, which may be more important in transitioning people back into the
community. It also does not include the availability of affordable housing choices, or of
the screening choices of private housing options. Whether private housing agents are
willing to rent to former offenders may have a larger impact on the ability of parolees to
find and maintain housing than public housing, particularly given the long waiting lists
found for public housing in many states. Another possible explanation for the negative
relationship between housing practices and rates of returns to prison is the possibility of a
spurious effect. It is possible that counties that do not have a strong transition network
from prison to the community, are more likely to allow access to public housing, whereas
states that have greater access to transitional housing (such as halfway houses) may be
less likely to allow access to public housing. It could be that alternative transitional
housing options offer greater support than what is found in public housing, and as such it
This document is a research report submitted to the U.S. Department of Justice. This report has not been published by the Department. Opinions or points of view expressed are those of the author(s)
and do not necessarily reflect the official position or policies of the U.S. Department of Justice.

128
is the access to these other options, rather than not having access to public housing,
which reduces rates of returns to prison. However, as we do not have a measure of the
living accommodations available to returning parolees, it is not possible to test this
hypothesis.
Access to public assistance (TANF), had a positive relationship for overall
percent of exits from parole that were returns to prison as well as returns to prison for
technical violations, however it had a negative effect in the prison model, as well as in the
model predicting returns to prison for new sentences. It is hard to explain why access to
public assistance would cause higher rates of returns to prison for new sentences, or why
this relationship would occur in the prison data. A benefit of the TANF legislation
however, is that it lends itself to being studied longitudinally. I was able to examine the
relationship more closely by looking at a seven year period that included data for three
years prior to the enactment of the TANF legislation as well as for four years after the
legislation. This data allowed me to examine within state variation rather than between
state variation, thus controlling for unmeasured stable differences between states. This
analysis indicated that restrictions on TANF for former drug offenders, did have a
positive, though modest, effect on rates of returns to prison, although the inclusion of
state-level control variables is needed before conclusions can be drawn from this data.
Similar to the other collateral consequence laws, restrictions on driver’s licenses
for persons convicted of drug offenses have mixed findings between the two sources of
data, as well as within the parole data. States that suspend driver’s licenses only when the
underlying offense was driving related had lower rates of returns to prison in the parole
data, but higher rates of returns to prison in the prison data. Arguably these laws could
This document is a research report submitted to the U.S. Department of Justice. This report has not been published by the Department. Opinions or points of view expressed are those of the author(s)
and do not necessarily reflect the official position or policies of the U.S. Department of Justice.

129
reduce the likelihood of returns to prison as suspension of a driver’s license may reduce a
person’s chances of driving while intoxicated, however given that the two datasets are not
in agreement we cannot draw any conclusions. States that offer a restrictive license,
which allow persons convicted of drug-related offenses to drive under particular
circumstances, generally to drive to and from work, have lower rates of returns in the
prison data and for new sentences, but lower rates of returns for technical violation, and
for overall parole returns to incarceration. The negative relationship is particularly strong
in the model predicting technical violations, and is the only instance in which the effect
of a collateral consequence law reaches statistical significance. Here again, it could be
that parole officers are more lenient in states in which there is no access to a driver’s
license, and thus if parolees are unable to meet conditions of parole, such as maintaining
stable employment, parole officers may be less likely to return the person to prison.
Finally, the effect of whether states restrict driver’s licenses for more than 6 months has a
mixed effect across the models, and the strength of the relationship is very weak in each
model. This could indicate that whether a state restricts the license for more than 6
months has very little effect, which is not surprising given that most violations occur
within the first six months of release (Langan and Levin, 2002). It may also indicate that
the leniency offered by parole officers based on restrictions to driving, expires at some
point and that parole officers expect parolees to make adjustments to respond to lack of
access to a car.
The results of these analyses are in no way conclusive regarding the effects of
collateral consequence laws. Rather they suggest that the laws may be more nuanced,
with some having a negative effect and some a positive effect. Furthermore, these results
This document is a research report submitted to the U.S. Department of Justice. This report has not been published by the Department. Opinions or points of view expressed are those of the author(s)
and do not necessarily reflect the official position or policies of the U.S. Department of Justice.
130
indicate that different processes may be at work to explain returns to prison for new
sentences as opposed to technical violations. However, as will be discussed in the
conclusion of the dissertation, data limitations, both on measurements of the law, as well
as in measuring state rates of returns to prison, limit the interpretation of these results and
may obfuscate the true relationship.
This document is a research report submitted to the U.S. Department of Justice. This report has not been published by the Department. Opinions or points of view expressed are those of the author(s)
and do not necessarily reflect the official position or policies of the U.S. Department of Justice.

131
Chapter 5: Conclusion
With the massive increase in incarceration that has taken place in the U.S. over
the last several decades, the issue of reentry has become an important issue in the field of
criminology, as well as for the government, as we struggle with how to best reintegrate
former offenders back into society. In order to address the issue of reentry, the US is
devoting greater resources toward the issue of reentry of offenders, as evidenced by
authorizing $165 million for the Second Chance Act in 2008. However, some scholars,
advocates and policy makers have expressed concern that at the same time that federal,
state and local governments are expending resources to assist with reentry, they also
maintain laws that hinder this process. Specifically, that collateral consequence laws that
restrict voting, increase access to criminal records, restrict employment, block access to
public assistance and public housing, and that restrict driver’s licenses make it more
difficult for former offenders to successfully re-integrate, and increase the chances of
returning to prison for a new crime or for a technical violation (Legal Action Center
2009, Manza and Uggen 2006, Petersilia 2003, Thompson 2008, Travis 2005).
In the last several years, collateral consequence restrictions have come under
increased scrutiny in the government sector. The Smart on Crime Coalition (2011),
comprised of over 40 notable organizations and individuals, recommended “expanding
and improving legal mechanisms for individuals to obtain relief from collateral
consequences” as part of their recommendations to the 112th
congress; and in June 2010,
Marc Mauer of The Sentencing Project provided testimony to the House Judiciary
Subcommittee on Crime, Terrorism and Homeland Security regarding the need to provide
relief in the area of collateral consequences (Mauer, 2010).
This document is a research report submitted to the U.S. Department of Justice. This report has not been published by the Department. Opinions or points of view expressed are those of the author(s)
and do not necessarily reflect the official position or policies of the U.S. Department of Justice.

132
Although there has been an increasing concern with the effect of collateral
consequence laws on the reintegration of offenders, to date there has been no systematic
analysis on the impact of these laws on recidivism or technical violations (Petersilia,
2003; Travis, 2005; Mauer and Chesney-Lind, 2002). Collateral consequence laws may
have the unintended consequence of increasing victimization through rising crime rates,
as well as the expense to taxpayers of re-imprisoning offenders, and the social costs of
removing these individuals from the community and their families. If such a relationship
exists, legislatures will need to reconsider the efficacy of these policies.
This study is the first to systematically look at the effect of these laws on state
rates of returns to prison. Pairing data on specific collateral consequence laws with data
from two BJS datasets, I sought to address three hypotheses. First, that the measured
collateral consequence laws are related to higher rates of returns to prison for new crimes.
Second, that that the measured collateral consequence laws are related to higher rates of
returns to prison due to technical violations of parole. Third, that the types of collateral
consequence laws vary in the effects that they have on rates of returns to prison. The
analyses conducted did not support the first two hypotheses – that collateral consequence
laws result in higher rates of returns to prison for new crime or for technical violations.
While collateral consequence laws did vary in their effects, they did not appear to vary in
the expected direction – specifically that collateral consequence laws with a greater effect
on day to day living would have a greater effect.
While ultimately data limitations limit the conclusions that can be drawn from this
study, the analyses show some support for two, tentative findings. First, based upon the
fixed effects analysis of seven years worth of data, that states that restricted access to
This document is a research report submitted to the U.S. Department of Justice. This report has not been published by the Department. Opinions or points of view expressed are those of the author(s)
and do not necessarily reflect the official position or policies of the U.S. Department of Justice.

133
TANF appear to have had a small increase in the percent of exits from parole that are
returns to incarceration. Second, that harsh collateral consequence laws appear to be
related to lower rates of returns to prison for technical violations.
Although the measures of collateral consequence laws in the cross-sectional
analyses failed to reach significant levels, the uniqueness of the TANF data allowed for a
more robust analysis. As restrictions on TANF were passed by states in response to a
1996 federal law, there was significant variation within states in passing these laws over
this time period. Using seven years of data, I found that states that restricted access to
TANF appear to have also seen subsequent increases in rates of returns to prison, and that
this change was statistically significant. Although this analysis is not yet complete as it at
risk of misspecifcation for failing to include controls, this finding warrants further
investigation into the effects of restrictions on TANF.
The second tentative finding is that harsh collateral consequence laws appear to
be related to lower rates of returns to prison for technical violation. This finding is
surprising, and is contrary to the predicted relationship. This relationship was found for
several of the laws. When the cumulative measures of these laws were used, this
relationship was statistically significant in the bivariate relationship with rates of returns
to prison for technical violations. One speculative explanation for this relationship is that
the formalization of collateral consequences into law may make parole officers more
cognizant of the hardships faced by returning offenders. Former offenders may have
similar difficulties in terms of abiding by the terms of their conditional release, such as
making appointments with their parole officers, maintaining stable employment,
maintaining stable housing, making child support payments, and passing drug tests (when
This document is a research report submitted to the U.S. Department of Justice. This report has not been published by the Department. Opinions or points of view expressed are those of the author(s)
and do not necessarily reflect the official position or policies of the U.S. Department of Justice.

134
applicable). These issues may be similarly difficult for offenders across states, however
the formalization of employment restrictions, restrictions on driver’s licenses, or barriers
on public housing, may make parole officers more aware of these issues. As such, they
may be choose to be more lenient when parolees violate the conditions of their release.
While this data suggests the possibility of a negative relationship between collateral
consequence laws and state rates of returns to prison for technical violations, this data is
unable to offer any evidence as to whether this is a result of different choices being made
by parole officers, or due to another process.
Data Limitations
Unfortunately, while this analyses was exploratory, it largely failed to find
statistically significant relationships between collateral consequence laws and state rates
of returns to prison. While this may indicate that collateral consequence laws do not
significantly impact rates of returns to prison, it may also be that the data used in this
analysis may not be robust enough to support these analyses. Ultimately there were
several potential problems with this data.
As the data is aggregate, state level data, it is severely limited in the number of
data points available. It is possible that variations in how these laws affect individuals is
lost with aggregation. Similarly, the impact of these laws may simply not be strong
enough to create an impact at the aggregate level.
There are several concerns with the BJS data sources. While data was used from
two separate sources – prison data and parole data – in an attempt to address these
limitations, the two data sources had significant variation between them in measuring the
effect of collateral consequence laws. This can be a reflection of several potential issues
This document is a research report submitted to the U.S. Department of Justice. This report has not been published by the Department. Opinions or points of view expressed are those of the author(s)
and do not necessarily reflect the official position or policies of the U.S. Department of Justice.

135
with these data sources. First, there may be too much variation in how states respond and
record rates of returns to prison. For instance, when a person that is on conditional release
is arrested for a crime, there is some discretion as to whether the person is returned to
incarceration as a violation of conditional release, or whether they are processed under a
new sentence. These decisions may be impacted by local culture or by local resources (as
processing a new sentence can be more expensive and time consuming that returning on a
violation of parole) (Kingsnorth et al 2002). Another difficulty within the BJS data is that
it is not possible to adequately control for differences in the parole and prison populations
within each state. Although I include controls for the percent of parolees whose crimes
were violent, property or drug, this may not sufficiently capture variations in the parole
and prison populations of each state.
In addition to problems with the BJS data source, there are also potential
concerns with the measures of the laws as well. Unfortunately, the measures that lend
themselves to comparison between states, may not be able to capture some of the
important aspects of these laws. For instance, the laws on restrictions for employment
don’t measure which specific jobs former offenders are restricted from holding or for
acquiring an occupational licenses. While the specific occupations that former offenders
are excluded from may have a strong impact on the ability of offenders to gain
employment, it is difficult to compare between states as there are literally thousands of
jobs that can be restricted, states vary in what triggers exclusion (drug or violent offense,
misdemeanor or felony, specific) and they can also vary in how it implemented. Two
states may both restrict access to particular jobs through an individualized review
This document is a research report submitted to the U.S. Department of Justice. This report has not been published by the Department. Opinions or points of view expressed are those of the author(s)
and do not necessarily reflect the official position or policies of the U.S. Department of Justice.

136
process, however they may vary greatly in the number of former offenders that are
rejected for an occupational license.
In addition, while this data looks at the effects of a number of collateral
consequence laws, these laws largely reflect what is in the state statutes, and the reality
could vary in implementation. For instance, in South Dakota probationers were prevented
from voting, even though by law they were eligible. Similarly, discrimination against
former offenders could occur in spite of legal restrictions against it. Former offenders
have reported that employers have informally told them that former offenders “need not
apply” even though based on the laws of the state they are required to show a relationship
between a specific offense and the current job. It’s quite possible that discrimination in
the areas of employment and housing are so widespread, that the variations found in the
legal statues measured here have little impact. This is in line with Pager’s (2006) finding
that employers are much less likely to call someone for an interview if there is an
indication on their resume that they have served time, as well as Holzer et al’s (2006)
finding that in the absence of criminal records, employers are more likely to engage in
statistical discrimination. It is also possible that even when states do not have laws in
place that restrict former offenders, that individuals may assume they are ineligible for
services or rights, even though that is not the case in their state. For instance, Manza and
Uggen (2006) found that many individuals were misinformed about their voting rights,
and believed themselves to be ineligible to vote, when in reality they were eligible.
Another potential issue with these analyses, is related to the impact these laws
may have on entire communities, and not just individuals. In keeping with the coercive
mobility hypothesis, by making it more difficult for offenders to find stable employment,
This document is a research report submitted to the U.S. Department of Justice. This report has not been published by the Department. Opinions or points of view expressed are those of the author(s)
and do not necessarily reflect the official position or policies of the U.S. Department of Justice.

137
access public assistance or food, or to reunite with families, these laws negatively impact
the social cohesion of the communities to which parolees return, and disproportionately
consume valuable social and family resources in the community. As such, these laws
would be expected to have a negative impact on entire communities. Due to their effect
on the community, potentially these laws could have community wide effects that would
impact not only rates of returns to prison, but also crime rates as a whole. As the
measures of rates of returns to prison used in this study are affected by changes in rates of
entries to prison for new crimes, this could obscure the effect of these laws.
A final limitation in this data is insufficient controls for factors that could affect
the impact of these laws. It should be noted that these laws could be significantly related
to other factors in the state of which I am unable to control. For instance, in the area of
employment, it is possible that states that are limited in the number of jobs they restrict
for former offenders, may not offer a certificate of rehabilitation as it is less necessary,
whereas states with a multitude of restrictions may be more likely to offer certificates of
rehabilitation as a mechanism to deal with those restrictions. Thus a state that appears
harsh based upon the laws measured for this analysis, may in reality be relatively lenient.
It is important to keep this in mind when interpreting the results of the effect of
employment laws on rates of returns to prison.
Similarly, this data does not include controls for factors that could temper the
effect of these laws, such as the availability of reentry programs, treatment programs,
transitional housing, soup kitchens, effective public transportation, etc. Thus states
that may appear to be similarly situated in terms of their formal laws, may vary
markedly in the context to which parolees are released.
This document is a research report submitted to the U.S. Department of Justice. This report has not been published by the Department. Opinions or points of view expressed are those of the author(s)
and do not necessarily reflect the official position or policies of the U.S. Department of Justice.

138
Finally, these analyses are limited to the extent that they are unable to account
for the mediating factors predicted to be relevant to these laws. Collateral
consequence laws are predicted to be related to higher rates of returns to prison based
on the mediating factors of decreasing the employment of parolees, contributing to
family disruption, negatively impacting the social cohesion of communities, and
decreasing housing options. Thus without being able to measure these mediating
factors, it is not possible to effectively test the relationship between rates of returns to
prison and collateral consequence laws.
Conclusions and Future Directions
Although ultimately this research was unable to find firm support for the original
hypothesis predicting that collateral consequence laws increase rates of returns to prison,
there are too many potential problems with the data to say that this data indicates a
finding of the absence of a relationship. When a more robust analysis was conducted,
that is, longitudinal data on the effect of TANF laws, preliminary statistically significant
results were found in the expected direction. Additional research is needed before we can
dismiss the possibility of a relationship between collateral consequence laws and rates of
returns to prison.
While the findings of this study are suggestive of a potential negative relationship
between collateral consequence laws and rates of returns to prison for technical violation
more research is needed to determine whether this relationship holds in future research,
and if so, if it is spuriously related to an unmeasured variable. Additional research would
This document is a research report submitted to the U.S. Department of Justice. This report has not been published by the Department. Opinions or points of view expressed are those of the author(s)
and do not necessarily reflect the official position or policies of the U.S. Department of Justice.

139
be needed into the decision making process of parole officers and parole boards to
determine their role in this relationship.
While more research is needed to determine whether a relationship exists between
collateral consequence laws and rates of returns to prison, there are still reasons to be
concerned about the negative impact of these laws in other areas, such as their impact on
election outcomes (Manza and Uggen 2006), labor market outcomes (Finlay 2009, Stoll
and Bushway 2008), racial inequality in the employment (Wheelcock et al 2011), college
attendance (Lovenheim and Owens 2013) and food insecurity (Wang et al 2013).
Furthermore, it should be noted that some laws, such as permanent voting
disenfranchisement, are not supported by the public (Pinaire 2002).
This dissertation highlights the need for future research on this topic. First and
foremost is the need for individual level data. Unfortunately this dissertation was
ultimately limited in the use of aggregate level data. Individual level data would be better
suited to determining a relationship between collateral consequence laws and recidivism.
Specifically, the Bureau of Justice Statistics collects data on individual recidivism data.
They have recently collected data on individuals released from 30 states in 2005,
although this data has not yet been released. They tracked these individuals for a five year
period following release. As this data includes arrest data, and uses consistent definitions
across states within the dataset, many of the data limitations present in the BJS prison and
parole data can be avoided.
Another advantage of the BJS recidivism data, is that the impact of some collateral
consequence laws may be more pronounced for some groups than others. For instance,
women may be more vulnerable to restrictions on government assistance or public
This document is a research report submitted to the U.S. Department of Justice. This report has not been published by the Department. Opinions or points of view expressed are those of the author(s)
and do not necessarily reflect the official position or policies of the U.S. Department of Justice.

140
housing, as women are more likely to rely on these services prior to entering prison, and
because women are more likely to have custody of their children. While minorities may
be more likely to be impacted by these laws given their disproportionate levels of contact
with the criminal justice system, potentially collateral consequence could be less
pronounced for racial minorities, given that they already face significant discrimination in
the workforce, and may face statistical discrimination, whether or not they have a
criminal record (Holzer et al 2006, Pager 2007).
Another avenue worth exploring in this area is the impact of collateral
consequence laws on overall crime rates. To the extent that these laws affect
communities, they may affect the overall crime rates of an area. In addition, these laws
could have a differential impact on type of crime rates, such as violent or property crime
rates (as reported to the police) or on drug arrests.
It may also be of value to look at the impact of these laws on additional outcomes.
For instance, whether restrictions on drivers’ licenses have had an impact on traffic
fatalities. If restrictions on drivers’ licenses are effective in targeting people that are more
likely to engage in risky driving behaviors, and if they are able to effectively reduce the
amount of time these people spend on the road, then potentially these laws could reduce
the number of traffic fatalities in a state. All states implemented some restrictions on
drivers’ licenses based on the 1992 federal legislation, so a time series analysis on this
event would be appropriate. This could be supplemented with a fixed effects analysis to
determine whether the variations in the laws, as measured in this study, have an impact
on traffic fatalities.
This document is a research report submitted to the U.S. Department of Justice. This report has not been published by the Department. Opinions or points of view expressed are those of the author(s)
and do not necessarily reflect the official position or policies of the U.S. Department of Justice.

141
One final area of study worth mentioning is looking into the differential impact of
these laws on minorities based upon their geographic placement. While scholars have
mentioned the disproportionate impact of these laws on minorities due to the
disproportionate involvement of minorities with the criminal justice system, as well as
due to higher rates of drug offenses which some of these laws target specifically, an
aspect that has not been explored is that laws may be harsher in states with higher
percentages of minorities. A preliminary look at the data suggests that states with harsher
laws are also tend to have higher percentages of minorities. Thus minorities may be
disproportionately impacted simply based upon where they reside.
Collateral consequence laws have been called “invisible” in that they take place
largely outside the public view and that generally offenders are unaware of them until
after they have been sentenced (Travis 2002). Another way in which they can be regarded
as “invisible” is that to date there has been a dearth of research on the impact of these
laws on former offenders as well as communities. Given the increasing number of
individuals facing collateral consequences, and the potential impact of these laws, this
dissertation supports the need for additional research in this area.
This document is a research report submitted to the U.S. Department of Justice. This report has not been published by the Department. Opinions or points of view expressed are those of the author(s)
and do not necessarily reflect the official position or policies of the U.S. Department of Justice.

142
Appendix
Appendix 1: Excluded States in Models Predicting Percent of Prison Admissions
that are Violations
State
Percent of
Prison
Admissions
that are
Parole
Violators
Percent of
Prison
Releases
that are
Conditional
Parolee
Race
Percent
Black
Percent
Parolees
Violent/
Property/
Drug Total
Excluded
Alabama
Excluded Excluded
Alaska Excluded
Excluded
Arizona
Arkansas
California
Colorado
Connecticut
Delaware
Florida Excluded
Excluded
Georgia Excluded
Excluded
Hawaii
Excluded Excluded Excluded
Idaho
Illinois
Indiana
Iowa
Kansas
Kentucky
Louisiana
Maine
Excluded Excluded Excluded
Maryland
Excluded
Excluded
Massachusetts
Excluded Excluded
Michigan
Minnesota
Mississippi
Missouri
Montana
Nebraska
Nevada
Excluded Excluded Excluded
New
Hampshire
Excluded Excluded
New Jersey
This document is a research report submitted to the U.S. Department of Justice. This report has not been published by the Department. Opinions or points of view expressed are those of the author(s)
and do not necessarily reflect the official position or policies of the U.S. Department of Justice.

143
New Mexico
Excluded Excluded
New York
North
Carolina Excluded
Excluded
North Dakota
Excluded Excluded
Ohio
Oklahoma
Oregon
Pennsylvania
Rhode Island
Excluded
Excluded
South
Carolina
Excluded
Excluded
South Dakota
Tennessee
Texas
Utah
Vermont
Virginia Excluded Excluded
Excluded
Washington
West Virginia
Wisconsin
Excluded Excluded
Wyoming
Excluded
Excluded
Excluded
States 5 5 3 9 18
This document is a research report submitted to the U.S. Department of Justice. This report has not been published by the Department. Opinions or points of view expressed are those of the author(s)
and do not necessarily reflect the official position or policies of the U.S. Department of Justice.

144
Appendix 2: Excluded States in Models Predicting Percent of Parole
Exits that are Returned to Incarceration
State
Parole
completions
that are
returned to
incarceration
Parolee
Race
Percent
Black
Percent
Parolees
Violent/
Property/
Drug Total
Excluded
Alabama
Excluded Excluded
Alaska
Arizona
Arkansas
California
Colorado
Connecticut
Delaware Excluded
Excluded
Florida
Georgia
Hawaii
Excluded Excluded Excluded
Idaho
Illinois
Indiana
Iowa
Kansas
Kentucky
Louisiana
Maine Excluded Excluded Excluded Excluded
Maryland
Massachusetts
Excluded Excluded
Michigan
Minnesota
Mississippi
Missouri
Montana
Nebraska
Nevada
Excluded Excluded Excluded
New
Hampshire
Excluded Excluded
New Jersey
New Mexico Excluded
Excluded Excluded
New York
North
This document is a research report submitted to the U.S. Department of Justice. This report has not been published by the Department. Opinions or points of view expressed are those of the author(s)
and do not necessarily reflect the official position or policies of the U.S. Department of Justice.

145
Carolina
North Dakota
Excluded Excluded
Ohio
Oklahoma
Oregon
Pennsylvania
Rhode Island
South
Carolina
South Dakota
Tennessee
Texas
Utah
Vermont
Virginia
Washington Excluded
Excluded
West Virginia
Wisconsin
Excluded Excluded
Wyoming
Excluded
States 4 3 9 11
This document is a research report submitted to the U.S. Department of Justice. This report has not been published by the Department. Opinions or points of view expressed are those of the author(s)
and do not necessarily reflect the official position or policies of the U.S. Department of Justice.

146
Appendix 3: Excluded States in Models Predicting Percent of Prison Admissions
that are Returned for New Sentences Only or for Technical Violations Only
State
Parole
completions
returned for
New
Sentence
only
Parole
completions
returned for
Revocation
only
Parolee
Race
Percent
Black
Percent
Parolees
Violent/
Property/
Drug Total
Excluded
Alabama
Excluded Excluded
Alaska
Arizona
Arkansas
California
Colorado
Connecticut Excluded Excluded
Excluded
Delaware Excluded Excluded
Excluded
Florida
Georgia
Hawaii
Excluded Excluded Excluded
Idaho
Illinois
Indiana
Iowa Excluded Excluded
Excluded
Kansas
Kentucky
Louisiana
Maine Excluded Excluded Excluded Excluded Excluded
Maryland
Massachusetts
Excluded Excluded
Michigan
Minnesota
Mississippi Excluded Excluded
Excluded
Missouri
Montana
Nebraska
Nevada
Excluded Excluded Excluded
New
Hampshire Excluded Excluded
Excluded Excluded
New Jersey
New Mexico Excluded Excluded
Excluded Excluded
New York
This document is a research report submitted to the U.S. Department of Justice. This report has not been published by the Department. Opinions or points of view expressed are those of the author(s)
and do not necessarily reflect the official position or policies of the U.S. Department of Justice.

147
North
Carolina
North Dakota
Excluded Excluded
Ohio
Oklahoma
Oregon
Pennsylvania
Rhode Island
South
Carolina
South Dakota
Tennessee
Texas
Utah
Vermont
Virginia
Washington Excluded Excluded
Excluded
West Virginia
Wisconsin
Excluded Excluded
Wyoming
Excluded
States 8 8 3 9 14
This document is a research report submitted to the U.S. Department of Justice. This report has not been published by the Department. Opinions or points of view expressed are those of the author(s)
and do not necessarily reflect the official position or policies of the U.S. Department of Justice.

148
N Min Max Mean Median
Prison Data - Controls 2009
Percent of Prison Releases that are Conditional 32 48% 98% 76% 78%
Imprisonment rate 32 189 881 426 423
Parole Data - Controls 2009
Parolee Race - Percent Black 32 2% 66% 30% 31%
Percent Parolees - Violent 32 8% 68% 30% 25%
Percent Parolees - Property 32 7% 55% 23% 24%
Percent Parolees - Drug 32 11% 63% 32% 31%
State Level - Controls 2009
Unemployment as a percent of the civilian workforce 32 5% 13% 8% 8%
Percent of kids living in single-parent homes 32 16% 39% 27% 27%
Appendix 4: Summary Statistics for Control Variables in Models Predicting Percent of
Prison Admissions that are Violations
N Min Max Mean Median
Prison Data - Controls 2009
Percent of Prison Releases that are Conditional 34 11% 98% 71% 75%
Imprisonment rate 39 189 881 428 420
Parole Data - Controls 2009
Parolee Race - Percent Black 39 2% 72% 33% 33%
Percent Parolees - Violent 39 8% 67% 33% 31%
Percent Parolees - Property 39 7% 55% 23% 24%
Percent Parolees - Drug 39 3% 63% 30% 29%
State Level - Controls 2009
Unemployment as a percent of the civilian workforce 39 5% 13% 9% 8%
Percent of kids living in single-parent homes 39 16% 39% 27% 27%
Appendix 5: Summary Statistics for Control Variables in Models Predicting Percent of
Parole Exits that are Returned to Incarceration
This document is a research report submitted to the U.S. Department of Justice. This report has not been published by the Department. Opinions or points of view expressed are those of the author(s)
and do not necessarily reflect the official position or policies of the U.S. Department of Justice.

149
N Min Max Mean Median
Prison Data - Controls 2009
Percent of Prison Releases that are Conditional 31 11% 98% 71% 77%
Imprisonment rate 36 189 881 425 423
Parole Data - Controls 2009
Parolee Race - Percent Black 36 2% 72% 33% 33%
Percent Parolees - Violent 36 8% 67% 35% 33%
Percent Parolees - Property 36 7% 55% 23% 24%
Percent Parolees - Drug 36 3% 62% 28% 29%
State Level - Controls 2009
Unemployment as a percent of the civilian workforce 36 5% 13% 9% 8%
Percent of kids living in single-parent homes 36 16% 37% 27% 27%
Appendix 6: Summary Statistics for Control Variables in Models Predicting Percent of
Prison Admissions that are Returned for New Sentences Only or for Technical Violations
This document is a research report submitted to the U.S. Department of Justice. This report has not been published by the Department. Opinions or points of view expressed are those of the author(s)
and do not necessarily reflect the official position or policies of the U.S. Department of Justice.

150
Appendix 7: Scatter Plot of Percent of Prison Admissions that are Violations and
Cumulative Collateral Consequence Score (with laws weighed equally)
This document is a research report submitted to the U.S. Department of Justice. This report has not been published by the Department. Opinions or points of view expressed are those of the author(s)
and do not necessarily reflect the official position or policies of the U.S. Department of Justice.

151
Appendix 8: Scatter Plot of Percent of Prison Admissions that are Violations and
Cumulative Collateral Consequence Score (with categories weighed equally)
This document is a research report submitted to the U.S. Department of Justice. This report has not been published by the Department. Opinions or points of view expressed are those of the author(s)
and do not necessarily reflect the official position or policies of the U.S. Department of Justice.

152
Appendix 9: Scatter Plot of Percent of all Parole Completions that are Returned to
Incarceration and Cumulative Collateral Consequence Score (with laws weighed
equally)
This document is a research report submitted to the U.S. Department of Justice. This report has not been published by the Department. Opinions or points of view expressed are those of the author(s)
and do not necessarily reflect the official position or policies of the U.S. Department of Justice.

153
Appendix 10: Scatter Plot of Percent of all Parole Completions that are Returned to
Incarceration and Cumulative Collateral Consequence Score (with categories
weighed equally)
This document is a research report submitted to the U.S. Department of Justice. This report has not been published by the Department. Opinions or points of view expressed are those of the author(s)
and do not necessarily reflect the official position or policies of the U.S. Department of Justice.

154
Appendix 11: Scatter Plot of Percent of all Parole Completions that are Returned to
Incarceration for New Sentence Only and Cumulative Collateral Consequence
Score (with laws weighed equally)
This document is a research report submitted to the U.S. Department of Justice. This report has not been published by the Department. Opinions or points of view expressed are those of the author(s)
and do not necessarily reflect the official position or policies of the U.S. Department of Justice.

155
Appendix 12: Scatter Plot of Percent of all Parole Completions that are Returned to
Incarceration for New Sentence Only and Cumulative Collateral Consequence
Score (with categories weighed equally)
This document is a research report submitted to the U.S. Department of Justice. This report has not been published by the Department. Opinions or points of view expressed are those of the author(s)
and do not necessarily reflect the official position or policies of the U.S. Department of Justice.

156
Appendix 13: Scatter Plot of Percent of all Parole Completions that are Returned to
Incarceration for Technical Revocation Only and Cumulative Collateral
Consequence Score (with laws weighed equally)
This document is a research report submitted to the U.S. Department of Justice. This report has not been published by the Department. Opinions or points of view expressed are those of the author(s)
and do not necessarily reflect the official position or policies of the U.S. Department of Justice.

157
Appendix 14: Scatter Plot of Percent of all Parole Completions that are Returned to
Incarceration for Technical Revocation Only and Cumulative Collateral
Consequence Score (with categories weighed equally)
This document is a research report submitted to the U.S. Department of Justice. This report has not been published by the Department. Opinions or points of view expressed are those of the author(s)
and do not necessarily reflect the official position or policies of the U.S. Department of Justice.

158
Bibliography
Agnew, Robert. 1992, "Foundation for a General Strain Theory of Crime and
Delinquency." Criminology 30:47.
Berg, Mark T. and Beth M. Huebner. 2011. Reentry and the Ties that Bind: An
Examination of Social Ties, Employment, and Recidivism. Justice Quarterly, 28:
382-410.
Blumstein, A. and A.J. Beck. 1999. Population growth in U.S. prisons, 1980-1996. In M.
Tonry and J. Petersilia (eds) Prisons. Chicago: The University of Chicago Press. P
1-16.
Blumstein, A. and Cohen, J. 1973. A Theory of the Stability of Punishment. Journal of
Criminal Law & Criminology, 64, 198-207.
Blumstein, Alfred, and Kiminori Nakamura. 2009. Redemption in the Presence of
Widespread Criminal Background Checks." Criminology 47:2 327-359.
Bonczar, Thomas P. 2003. Prevalence of Imprisonment in the U.S. Population, 1974-
2001. Bureau of Justice Statistics Special Report. Washington, DC: U.S.
Department of Justice. http://www.bjs.gov/index.cfm?ty=pbdetail&iid=836
Bonczar, T. P. 2008. Characteristics of State Parole Supervising Agencies, 2006.
Bureau of Justice Statistics Special Report. Washington, D.C: U.S. Department of
Justice.
Brady v. United States, 397 U.S. 742, 755 (1970).
Braithwaite, J. 1989. Crime, shame and reintegration. Cambridge: Cambridge University
Press.
Bureau of Justice Statistics. 1994. Survey of State Criminal History Information
Systems, 1993. Criminal Justice Information Policy Report, Washington, DC:
Bureau of Justice Statistics.
Bureau of Justice Statistics. 2011. Survey of State Criminal History Information
Systems, 2010. Criminal Justice Information Policy Report, Washington, DC:
Bureau of Justice Statistics, November 2011.
Bushway, Shawn. 2004. “Labor Market Effects of Permitting Employer Access to
Criminal History Records,” Journal of Contemporary Criminal Justice. Special
issue on Economics and Crime. 20:276-291.
This document is a research report submitted to the U.S. Department of Justice. This report has not been published by the Department. Opinions or points of view expressed are those of the author(s)
and do not necessarily reflect the official position or policies of the U.S. Department of Justice.

159
Bushway, Shawn, Robert Brame, and Raymond Paternoster. 1999. “Assesssing Stability
and Change in Criminal Offending: A Comparison of Random Effects,
Semiparametric, and Fixed Effects Modeling Strategies” Journal of Quantitative
Criminology 15:23-61.
Bushway, Shawn, Shauna Briggs, Faye Taxman, Meridith Thanner, and MischelleVan
Brakle. 2007. “Private Providers of Criminal History Records: Do You Get What
You Pay For?” in Bushway, Shawn D., Michael Stoll, and David Weiman (eds.)
2007 Barriers to Reentry? The Labor Market for Released Prisoners in Post-
industrial America. New York: Russell Sage Foundation Press. P. 174-200.
Bushway, Shawn and Peter Reuter. 2002. “Labor Markets and Crime Risk Factors” in
Sherman, Lawrence, David Farrington, Brandon Welsh and Doris MacKenzie,
Evidence-Based Crime Prevention, Rutledge Press, NY, NY
Bushway, Shawn and Gary Sweeten 2007. “Abolish Lifetime Bans for Ex-Felons.”
Criminology and Public Policy 6:4:697-706.
Chin, Gabriel J. 2002. “Race, The War on Drugs, and the Collateral Consequences of
Criminal Conviction" The Journal of Gender, Race & Justice 6:253-275.
Chin, Gabriel J. 2002. “Making Padilla Practical: Defense Counsel and Collateral
Consequences at Guilty Plea” Howard Law Journal 54: 675-691.
Chin, Gabriel J and Richard W. Holmes. 2002. "Effective Assistance of Counsel and the
Consequences of Guilty Pleas" Cornell Law Review 87: 697-742.
Clear, Todd R. 2007. Imprisoning Communities: How Mass Incarceration Makes
Disadvantaged Neighborhoods Worse. New York: Oxford University Press.
Clear, Todd R. and George Cole. 2000. American Corrections. Wadsworth, Monterey,
CA.
Clear, Todd R., Dina R. Rose, Elin Waring and Kristen Scully. 2003. “Coercive Mobility
and Crime: a Preliminary Examination of Concentrated Incarceration and Social
Disorganization,” Justice Quarterly. 20: 33-64.
Clear, Todd R.. 2003. "The Problem with 'Addition by Subtraction': The Prison-Crime
Relationship in Low Income Communities," in Marc Mauer and Meda Chesney-
Lind, eds., Invisible Punishment: The Collateral Consequences of Mass
Imprisonment, NY: The New Press. 181-194.
Cohen, Jacqueline and Jose A. Canela-Cacho. 1994. “Incarceration and Violent Crime:
1965-1988.” In Understanding and Preventing Violence, vol 4, Consequences and
This document is a research report submitted to the U.S. Department of Justice. This report has not been published by the Department. Opinions or points of view expressed are those of the author(s)
and do not necessarily reflect the official position or policies of the U.S. Department of Justice.

160
Control, edited by Albert J. Reiss and Jeffrey A. Roth. Washington, D.C.: National
Academy Press.
Demleitner, Nora. 1999. “ Preventing Internal Exile: The Need for Restrictions on
Collateral Sentencing Consequences” Stanford Law and Policy Review 11:153-62.
Department of Housing and Urban Development v. Rucker, 533 U.S. 125 (2002).
Duwe, G. Donnay, W., & Tewksbury, R. 2008. “Does residential proximity matter? A
geographic analysis of sex offense recidivism.” Criminal Justice and Behavior,
35(4), 484–504.
Ewald, Alec. 2005. “A Crazy-Quilt of Tiny Pieces: State and Local Administration of
American Criminal Disenfranchisement Law.” The Sentencing Project,
Washington, DC.
Ewald, Alec. 2012. “Collateral Consequences in the American States” Social Science
Quarterly 93:211-247.
Fagan, Jeffrey, Valerie West, Jan Holland. 2003. “Reciprocal Effects of Crime and
Incarceration in New York City Neighborhoods.” Fordham Urban Law Journal
30:1551-1601.
Finlay, Keith. 2009. “Effect of Employer Access to Criminal History Data on the Labor
Market Outcomes of Ex-Offenders and Non-Offenders.” In Studies of Labor
Market Intermediation, edited by David H. Autor. Chicago, Ill: University of
Chicago Press.
Fischer, R.G. 2005. Are California’s Recidivism Rates Really the Highest in the Nation?
It Depends on What Measure of Recidivism You Use. Center for Evidence Based
Corrections, University of California-Irvine.
Freeman, Richard. 2008. Incarceration, Criminal Background checks, and employment
in a low(er) crime society. Criminology and Public Policy 7:405-412.
Geller, Amanda, Irwin Garfinkel, Carey E. Cooper, and Ronald B. Mincy. 2009. Parental
Incarceration and Child Well-Being: Implications for Urban Families. Social
Science Quarterly 90: 1186–1202.
Gendreau, Paul, Tracy Little, and Claire Goggin. 1996. “A Meta-Analysis of the
Predictors of Adult Offender Recidivism: What Works!” Criminology 34(4):575-
608.
This document is a research report submitted to the U.S. Department of Justice. This report has not been published by the Department. Opinions or points of view expressed are those of the author(s)
and do not necessarily reflect the official position or policies of the U.S. Department of Justice.

161
Glaze, Lauren E., Thomas P. Bonczar, and Fan Zhang. 2010. Probation and Parole in
the United States 2009. Washington, DC: Bureau of Justice Statistics.
http://bjs.ojp.usdoj.gov/index.cfm?ty=pbdetail&iid=2233
Glaze, Lauren E. 2011. Correctional Population in the United States, 2010. Bureau of
Justice Statistics Bulletin. Washington, DC: U.S. Department of Justice.
http://bjs.ojp.usdoj.gov/index.cfm?ty=pbdetail&iid=2237
Glaze, Lauren E. & Maruschak, Laura M. (2008). Parents in prison and their minor
children. U.S. Department of Justice, Bureau of Justice Statistics, Special Report.
NCJ 222984. http://bjs.ojp.usdoj.gov/content/pub/pdf/pptmc.pdf
Grant, Walter M., John LeCornu, John A. Pickens, Dean H. Rivkin, C.R. Vinson. 1970.
Special Project: The Collateral Consequences of a Criminal Conviction. Vanderbilt
Law Review 23:929-1241.
Guerino, Paul, Paige M. Harrison, and William J. Sabol. 2012. Prisoners in 2010.
Bureau of Justice Statistics Bulletin. Washington, DC: U.S. Department of Justice.
http://bjs.ojp.usdoj.gov/index.cfm?ty=pbdetail&iid=2230
Hagan, John, & Juleigh Petty Coleman. 2001. “Returning captives of the American war
on drugs: Issue of community and family re-entry.” Crime & Delinquency 47:352-
367.
Hagan, John and Ronit Dinovitzer. 1999. Collateral consequences of imprisonment for
children, communities, and prisoners. In M. Tonry and J. Petersilia (eds). Prisons.
Chicago IL: The University of Chicago Press.
Hipp, John R. and Daniel K. Yates. 2009. “Do returning parolees affect neighborhood
crime? A case study of Sacramento.” Criminology. 47(3): 619-656.
Hirschfield, P.J. and Piquero, A.R. 2010. Normalization and Legitimation: Modeling
stigmatizing attitudes toward ex-offenders. Criminology, 48:27-55.
Holzer, Harry J., Steven Raphael, and Michael A. Stoll. 2004. Will employers hire
former offenders? Employer preferences, background checks, and their
determinants. In Mary Pattillo, David Weiman, and Bruce Western. Imprisoning
America. New York, NY: Russell Sage Foundation.
Holzer, Harry J., Steven Raphael, and Michael A. Stoll. 2006. Perceived Criminality,
Criminal Background Checks, and the Racial Hiring Practices of Employers.
Journal of Law and Economics. Vol 49, No 2: P 451-480.
Holzer, Harry J., Steven Raphael, and Michael A. Stoll. 2007. “The Effect of an
Applicant’s Criminal History on Employer Hiring Decisions and Screening
This document is a research report submitted to the U.S. Department of Justice. This report has not been published by the Department. Opinions or points of view expressed are those of the author(s)
and do not necessarily reflect the official position or policies of the U.S. Department of Justice.

162
Practices: New Evidence from Los Angeles.” In S. Bushway, M. Stoll and D.
Weiman eds. Barriers to Reentry? The Labor Market for Released Prisoners in
Post-Industrial America. New York: Russell Sage Foundation.
Huebner, Beth M., and Mark T. Berg. 2011. Examining the Sources of Variation in Risk
for Recidivism. Justice Quarterly. 28: 146-173.
Hughes and Wilson. 2010. Reentry Trends in the United States. Bureau of Justice
Statistics Webpage, accessed 6/21/2010. Washington, D.C.: U.S. Department of
Justice.
Hughes, Timothy A., Doris James Wilson, and Allen J. Beck. 2001. Trends in State
Parole, 1990-2000. Bureau of Justice Statistics Special Report. Washington, D.C:
U.S. Department of Justice.
Hunter v. Underwood, 471 U.S. 222 (1985)
Kingsnorth, Rodney F., Randall C. MacIntosh, Sandra Sutherland. 2002. Criminal charge
or probation violation: Prosecutorial discretion and implications for research in
criminal court processing. Criminology 40:553-578.
Kleinig, John and Kevin Murtagh. 2005. Disenfranchising Felons. Journal of Applied
Philosophy 22: 217–239.
Kubrin, Charis E., and Eric A. Stewart. 2006. Predicting who reoffends: The neglected
role of neighborhood context in recidivism studies. Criminology 44: 165-197.
Kurlychek, Megan, Robert Brame and Shawn Bushway. 2006. “Scarlet Letters and
Recidivism: Does An Old Criminal Record Predict Future Offending?”
Criminology and Public Policy 5:3:483-504.
Kurlychek, Megan C., Robert Brame, and Shawn D. Bushway 2007. “Enduring Risk?
Old Criminal Records and Predictions of Future Criminal Involvement,” Crime &
Delinquency 53:1:64-83.
Langan, Patrick A., and David J. Levin. 2002. Recidivism of Prisoners Released in
1994. Bureau of Justice Statistics Special Report. Washington, DC: U.S.
Department of Justice.
La Vigne, Nancy G., and Vera Kachnowski. 2003. A Portrait of Prisoner Reentry in
Maryland. Washington, DC: Urban Institute.
http://www.urban.org/UploadedPDF/410655_MDPortraitReentry.pdf.
This document is a research report submitted to the U.S. Department of Justice. This report has not been published by the Department. Opinions or points of view expressed are those of the author(s)
and do not necessarily reflect the official position or policies of the U.S. Department of Justice.

163
La Vigne, Nancy G., and Cynthia A. Mamalian. 2003. A Portrait of Prisoner Reentry in
Illinois. Washington, DC: Urban Institute.
http://www.urban.org/UploadedPDF/410662_ILPortraitReentry.pdf.
La Vigne, Nancy G., and Gillian L. Thomson. 2003. A Portrait of Prisoner Reentry in
Ohio. Washington, DC: Urban Institute.
http://www.urban.org/UploadedPDF/410891_ohio_reentry.pdf.
Le, Hanh H. 2011. “The "Padilla Advisory" and its Implications Beyond the
Immigration Context” William and Mary Bill of Rights Journal 20:589-618.
Lee, Dara N. 2011. The Digital Scarlet Letter: The Effect of Online Criminal Records
on Crime. Unpublished.
Legal Action Center. 2009. After Prison: Roadblocks to Reentry. A Report on State
Legal Barriers Facing People with Criminal Records. 2009 Update.
Lemert, Edwin M. 1951. Social Pathology: A Systematic Approach to the Theory of
Sociopathic Behavior. New York, NY, US: McGraw-Hill.
Letourneau, E. J. & Armstrong, K. S. (2008). Recidivism rates for registered and
nonregistered juvenile sexual offenders. Sexual Abuse: A Journal of Research and
Treatment, 20, 393-408.
Letourneau, Elizabeth J., Dipankar Bandyopadhyay, Kevin S. Armstrong and Debajyoti
Sinha. 2010. Criminal Justice and Behavior 37:553-569.
Levenson, J. S., & Cotter, L. P. 2005. The effect of Megan’s Law on sex offender
reintegration. Journal of Contemporary Criminal Justice, 21(1), 49–66.
Lin, J., Gratett, R., & Petersilia, J. (2010). ‘Back-end sentencing’ and reimprisonment:
Individual,organizational, and community predictors of parole sentencing decisions.
Criminology, 48, 759–795.
Lipsey, Mark W. 1995. What do we learn from 400 research studies on the effectiveness
of treatment with juvenile delinquents? In What Works? Reducing Reoffending,
edited by J. McGuire. New York, NY: John Wiley, pp. 63-78.
Loughran, Tom. 2011. Fixed Effects Regression Model. Presentation as part of the
University of Maryland at College Park Department of Criminology and Criminal
Justice Statistical Applications in Criminology and Criminal Justice (SACC) series.
October 4, 2011.
This document is a research report submitted to the U.S. Department of Justice. This report has not been published by the Department. Opinions or points of view expressed are those of the author(s)
and do not necessarily reflect the official position or policies of the U.S. Department of Justice.

164
Love, Margaret C. 2006. Relief from the Collateral Consequences of a Criminal
Conviction: A State-by-State Resource Guide. Buffalo , NY : Williams S. Hein &
Co., Inc
Love, Margaret C. and Gabriel J. Chin. 2010. “Padilla v. Kentucky: The Right to
Counsel and the Collateral Consequences of Conviction.” The Champion. May. 18-
24.
Lynch, James P., and William J. Sabol. 2001. Prisoner Reentry in Perspective. Crime
Policy Report, vol 3. Washington, DC: Urban Institute: Justice Policy Center.
Lynch, James P., and William J. Sabol. 2004 a. Assessing the effects of mass
incarceration on informal social control in communities. Criminology and Public
Policy 3(2): 267-94.
Lynch, James P., and William J. Sabol. 2004 b. Effects on incarceration on informal
social control in communities. In Mary Pattillo, David Weiman, and Bruce
Western, eds., Imprisoning America: The Social Effects of Mass Incarceration,
135-64. New York: Russell Sage.
Manza, Jeff and Christopher Uggen. 2006. Locked Out: Felon Disenfranchisement and
American Democracy. New York: Oxford University Press.
Maruna, Shadd. 2001. Making Good: How Ex-offenders Reform and Reclaim Their Lives.
Washington, D.C.: American Psychological Association Books.
Mauer, Marc. 2006. Race to Incarcerate. 2nd
edition. New York: New Press.
Mauer, Marc. 2010. Testimony of Marc Mauer Executive Director The Sentencing
Project. Prepared for House Judiciary subcommittee on Crime, Terrorism, and
Homeland Security. Collateral Consequences of Criminal Convictions: Barriers to
Reentry for the Formerly Incarcerated. June 9, 2010.
http://www.sentencingproject.org/doc/dp_cracktestimonyhouse.pdf
Mauer, Marc and Meda Chesney-Lind. 2002. Invisible Punishments: The Collateral
Consequences of Mass Imprisonment. New York: New Press.
McDonald, Michael P., and Popkin, Samuel L. 2001. The Myth of the Vanishing Voter.
American Political Science Review 95(4): 963-974.
Mears, Daniel P., Joshua C. Cochran, Sonja E. Siennick and William D. Bales. 2011.
Prison Visitation and Recidivism. Justice Quarterly 29: 888-918.
Mercado, C. C., Alvarez, S., & Levenson, J. S. 2008. The impact of specialized sex
offender legislationon community re-entry. Sexual Abuse: A Journal of Research &
Treatment, 20(2), 188–205.
This document is a research report submitted to the U.S. Department of Justice. This report has not been published by the Department. Opinions or points of view expressed are those of the author(s)
and do not necessarily reflect the official position or policies of the U.S. Department of Justice.

165
Merton. 1968, Social Theory and Social Structure. New York: The Free Press.
Morenoff, Jeffrey D., and David J. Harding. 2011. Neighborhoods, Recidivism, and
Employment Among Returning Prisoners. Final Technical Report National Institute
of Justice.
National Advisory Commission on Criminal Justice Standards and Goals. 1973. Report
of the National Advisory Commission on Criminal Justice Standards and Goals
Corrections. Washington, DC.
https://www.ncjrs.gov/App/Publications/abstract.aspx?ID=10865
National Council on Crime and Delinquency (NCCD). 1962. Annulment of a Conviction
of Crime: A Model Act. Crime and Delinquency 8:97-98.
National Council on Crime and Delinquency (NCCD). 1964. Standard Probation and
Parole Act.
Padilla v. Kentucky, 130 S. Ct. 1473 (2010).
Pager, Devah. 2003. "The Mark of a Criminal Record." American Journal of
Sociology 108:937-75.
Pager, Devah. 2007. Marked: Race, Crime, and Finding Work in an Era of Mass
Incarceration. Chicago: University of Chicago Press.
Petersilia, Joan. 2003. When Prisoners Come Home: Parole and Prisoner Reentry.
New York, NY; Oxford University Press.
Petersilia, Joan and Susan Turner. 1993. “Intensive Probation and Parole.” In Crime
and Justice: An Annual Review of Research, edited by Michael Tonry, 281-335.
Chicago, ILL.: University of Chicago Press.
Pettit, Becky and Bruce Western. 2004. “Mass Imprisonment and the Life Course: Race
and Class Inequality in U.S. Incarceration.” American Sociological Review 69:151–
69.
Pettit, Becky and Christopher J. Lyons. 2007. Status and the Stigma of Incarceration: The
Labor Market Effects of Incarceration by Race, Class, and Criminal Involvement.
Pg. 203-226 in Barriers to Reentry? The Labor Market for Released Prisoners in
post-Industrial America, edited by Shawn Bushway, Michael A. Stoll and David F.
Weiman. New York: Russell Sage Foundation
Pinard, Michael. 2004. Broadening the Holistic Mindset: Incorporating Collateral
Consequences and Reentry into Criminal Defense Lawyering, 31 Fordham Urban
Law Journal 1067.
This document is a research report submitted to the U.S. Department of Justice. This report has not been published by the Department. Opinions or points of view expressed are those of the author(s)
and do not necessarily reflect the official position or policies of the U.S. Department of Justice.

166
Pinard, Michael. 2006. An Integrated Perspective of the Collateral Consequences
of Criminal Convictions and the Reentry of Formerly Incarcerated Individuals, 86
Boston University Law Review 623-690.
Pinard, Michael. 2010. Collateral Consequences of Criminal Convictions: Confronting
Issues of Race and Dignity, 85 New York University Law Review 457.
Prescott, James J. and Jonah Rockoff. 2008. “Do Sex Offender Registration and
Notification Laws Affect Criminal Behavior?” The John M. Olin Center for Law
and Economics Working Paper Series.
President’s Commission on Law Enforcement and Criminal Justice, Task Force Report:
Corrections 88 (1967).
ProjectVote.org. 2010. Settlement Reached in South Dakota Felon Disenfranchisement
Suit. ) http://www.projectvote.org/blog/2010/06/settlement-reached-in-south-
dakota-felon-disenfranchisement-suit/
Raphael and David Weiman. 2007. The Impact of Local Labor Market Conditions on
the Likelihood that Parolees Return to Custody," in Bushway, Shawn; Stoll, Michael
A., and David F. Weiman. Barriers to Reentry? The Labor Market for Released
Prisoners in Post Industrial America, Russell Sage Foundation, New York,
Ratliffe v Beale, 20 So. 865, 868 (Miss 1896).
Richardson v. Ramirez, 418 U.S. 24 (1974)
Rose, Dina R. and Todd R. Clear. 1998. " Incarceration, Social Capital and Crime:
Implications for Social Disorganization Theory." Criminology 36:441-79.
Rubinstein, Gwen and Debbie Mukamal. 2002. Welfare and Housing: Denial of Benefits
to Drug Offenders. in Invisible Punishment: The Collateral Consequences of Mass
Imprisonment. Marc Mauer and Meda Chesney-Lind, editors, New York: New
Press, 2002.
Sabol, William J. 2007. Local Labor Market Conditions and Post-prison Employment
Experience of Offenders Released from Ohio Prisons. in Bushway, Shawn; Stoll,
Michael A., and David F. Weiman. Barriers to Reentry? The Labor Market for
Released Prisoners in Post Industrial America, Russell Sage Foundation, New
York.
Sampson, Robert J., Stephen W. Raudenbush, and Felton Earls. 1997. Neighborhoods
and violent crime: A multilevel study of collective efficacy. Science 277:918-24.
This document is a research report submitted to the U.S. Department of Justice. This report has not been published by the Department. Opinions or points of view expressed are those of the author(s)
and do not necessarily reflect the official position or policies of the U.S. Department of Justice.

167
Sandler, Jeffrey C., Naomi J. Freeman, and Kelly M. Socia. 2008. “Does a Watched Pot
Boil? A Time-Series Analysis of New York State’s Sex Offender Registration and
Notification Law;” Psychology, Public Policy, and Law 14: 284–302.
Scheff, Thomas J. and Suzanne M. Retzinger. 1991. Emotion and Violence: Shame and
Rage in Destructive Conflicts. Lexington, MA: Lexington.
Shapiro, Carol. Coming Home: Building on Family Connections. Corrections
Management Quarterly 5:52-62
Sherman, Lawrence W. 1993. Defiance, Deterrence and Irrelevance: A Theory of the
Criminal Sanction. Journal of Research in Crime and Delinquency 30: 445-473.
Smart on Crime Coalition, The. 2011. Smart on Crime: Recommendations for the
Administration and Congress. The Constitution Project: Washington, D.C.
Spohn, Cassia and David Holleran. 2000. The imprisonment penalty paid by young
unemployed black and Hispanic male offenders. Criminology 38:281–306.
Steen, Sara, Tara Opsal, Peter Lovegrove, and Shelby McKinzey. 2012. Putting parolees
back in prison: Discretion and the parole revocation process. Criminal Justice
Review 38:70-93.
Stoll, Michael A. and Shawn D. Bushway. 2008. The Effect of Criminal Background
Checks on Hiring Ex-Offenders Criminology and Public Policy 7:3:371-404.
Stone, Matthew. 2013. Maine House defeats GOP efforts restricting welfare. Maine Sun
Journal. June 17, 2013. Online version.
Strickland v. Washington, 466 U.S. 668 (1984).
Tewksbury, R. 2005. Collateral consequences of sex offender registration. Journal of
Contemporary Criminal Justice, 21(1), 67–82.
Tewksbury, R., & Jennings, W.G. 2010. Assessing the impact of sex offender registration
and community notification on sex offending trajectories. Criminal Justice and
Behavior, 37(5), 570-582.
Thompson, Anthony C. 2008. Releasing Prisoners, Redeeming Communities. New
York, NY: New York University Press.
Travis, Jeremy. 2002. “Invisible Punishment: An Instrument of Social Exclusion.” In
Invisible Punishment: The Collateral Consequences of Mass Imprisonment. Edited
by Marc Mauer, and Meda Chesney-Lind. The New Press: New York, New York.
This document is a research report submitted to the U.S. Department of Justice. This report has not been published by the Department. Opinions or points of view expressed are those of the author(s)
and do not necessarily reflect the official position or policies of the U.S. Department of Justice.

168
Travis, Jeremy. 2005. But They All Come Back: Facing the Challenges of Prisoner
Reentry. Washington, DC : Urban Institute Press.
Travis, Jeremy and Sarah Lawrence. 2002. Beyond the Prison Gates: The State of Parole
in America. Washington, DC: Urban Institute.
Tonry, Michael. 1995. Malign Neglect. New York: Oxford University Press.
Tonry, Michael.1996. Sentencing Matters. New York: Oxford University Press.
Tyler, Tom R. 2006. Why People Obey the Law. Princeton University Press: Princeton,
New Jersey.
Uggen, Christopher. 2000. Work as a Turning Point in the Life Course of Criminals: A
Duration Model of Age, Employment, and Recidivism. American Sociological
Review 65:529-46.
Uggen, Christopher, and Jeff Manza. 2002. "Democratic Contraction? Political
Consequences of Felon Disenfranchisement in the United States." American
Sociological Review 67:777-803
Uggen, Christopher, Sarah Shannon, and Jeff Manza. 2012. State-level Estimates of
Felon Disenfranchisement in the United States, 2010. Washington, DC: Sentencing
Project.
Vieraitis, Lynne M., Kovandzic, Tomislav V. & Marvell, Thomas B. 2007. The
Criminogenic Effects of Imprisonment: Evidence from State Panel Data, 1974-
2002. Criminology & Public Policy 6:589-622.
Visher, Christy A., Debus-Sherrill, Sara A., and Jennifer Yahner. 2010. Employment
after prison: A longitudinal study of former prisoners. Justice Quarterly, 28: 698-
718.
Wacquant, Loic. 2000. Deadly Symbiosis: When Ghetto and Prison Meet and Mesh.
Punishment and Society (2000).
Wang, Emily A., Gefei A. Zhu, Linda Evans, Amy Carroll-Scott, Rani Desai, and Lynn
E. Fiellin. 2013. A pilot study examining food insecurity and HIV risk behaviors
among individuals recently released from prison. AIDS Education and Prevention
25: 112–123.
West, Heather C., William J. Sabol, and Sarah J. Greenman. 2010. Prisoners in 2009.
Washington, DC: Bureau of Justice Statistics.
http://bjs.ojp.usdoj.gov/index.cfm?ty=pbdetail&iid=223
This document is a research report submitted to the U.S. Department of Justice. This report has not been published by the Department. Opinions or points of view expressed are those of the author(s)
and do not necessarily reflect the official position or policies of the U.S. Department of Justice.

169
Western, Bruce. 2006. Punishment and Inequality in America. Russell Sage
Foundation, NY.
Western, Bruce. 2008. Criminal Background Checks and Employment Among Workers
with Criminal Records. Criminology and Public Policy 7:1201–1205.
Western, Bruce, Jeffrey R. Kling, and David F. Weiman. 2001. The Labor Market
Consequences of Incarceration. Crime and Delinquency 47:410–427.
Wheelcock, Darren, Christopher Uggen and Heather Hlavka. 2011. Employment
Restrictions for Individuals with Felons Status and Racial Inequality in the Labor
Market. Global Perspectives on Re-Entry, edited by Ikponwosa O. Ekunwe and
Richard S. Jones. Tampere, Finland: Tampere University Press.
Zgoba, Kristen M., Jill Levenson, and Tracy McKee. 2009. Examining the Impact of
Sex Offender Residence Restrictions on Housing Availability. Criminal Justice
Policy Review 20:91-110.
This document is a research report submitted to the U.S. Department of Justice. This report has not been published by the Department. Opinions or points of view expressed are those of the author(s)
and do not necessarily reflect the official position or policies of the U.S. Department of Justice.