the effect of collaborative computer aided learning on...
TRANSCRIPT

THE EFFECT OF COLLABORATIVE COMPUTER AIDED LEARNING ON
PROBLEM SOLVING SKILLS IN ALGEBRA AMONG POLYTHECNICS STUDENTS
MOHD SAZALI KHALID
MAIZAM ALIAS
3RD INTERNATIONALCONFERENCE ON SCIENCE AND MATHEMATICS EDUCATION
10-12 NOVEMBER 2009 PENANG

1
THE EFFECT OF COLLABORATIVE COMPUTER AIDED LEARNING ON PROBLEM SOLVING SKILLS IN ALGEBRA AMONG POLYTECHNIC
STUDENTS
Abstract Algebra is the foundation of many analytical-mathematical problem solving tool in technical oriented discipline. Algebra however, is not well understood by many technical students especially those who are at the foundation level of engineering programme. The purpose of this study was to determine if collaborative computer aided learning can improve problem solving skills in algebra among engineering students in polytechnic certificate programmes. A quasi-experimental design with four intact groups of students was used in the study. Scores obtained on algebra problems after using either one of the following method were compared, the collaborative computer aided learning method (CDiCL method), the collaborative learning (CL) method, the computer aided learning method (CD method) and the conventional method. The Student Team Assessment Division method of collaborative learning was used by the collaborative learning group and the CDiCL group. A specifically designed algebra courseware developed using Hermann Brain Dominance principles were used by the CD and the CDiCL group. Interactions during teaching and learning were also observed. Analysis of variance was used to test equality of means obtained on the algebra test. The descriptive statistical analysis results show that the CDiCL group obtained the
highest gain score ( X =6.40),followed by the CD group ( X =6.08), the conventional group X =3.71) and the CL group ( X =1.91). Results of the analysis using Welch test indicate that the differences between means is statistically significant (F=4.551, dfl=3, <#2=58.06, p=0.01). A post hoc test indicates that the mean score of the CDiCL group is statistically significantly different from the CL
group only. The CDiCL group also perceived themselves to be more effective (X =2.94, s=0.54), more participative (X =4.03, s=l .4) and
more prepared ( X =4.14, s=l .54) compared to the other groups. In conclusion, the CDiCL group although no better than the conventional group in terms of inducing algebra learning appears to be providing a more conducive learning experience indicated by students' perception of their learning experience.
Algebra is the foundat ion of m a n y analy t ica l -mathemat ica l p r o b l e m solving tool in technical or iented discipl ine. A lgebra however , is no t wel l unders tood by m a n y technical s tudents especial ly those w h o are at the foundat ion level of engineer ing p rograms .
Poly technics under the Minis t ry of Higher Educa t ion ( M o H E ) are technical educat ions inst i tut ion that is responsible for p roduc ing semi skil led professionals for m a n y engineer ing discipl ines. However , the average poly technic engineer ing s tudents whose ach ievements in ma themat i c s have been med ioc re at the Sijil Pelajaran Malays i a ( G C E " O " levels) find that engineer ing mathemat ics very chal lenging. Current approach l ike intensive remedia t ion that are c o m m o n l y pract iced in m a n y parts of the wor ld Z h a n g et.al (2008) is t ime consuming . T h e pract ice of a l lowing n e w inexper ienced engineer ing graduates to teach mathemat ics is also not he lp ing the s i tuat ions. M o h d . Sal leh (1990) d iscovered that fresh s tudents in U T M , Malays i a were bo th w e a k in unders tanding the structure of algebra and their difficulties were due to ability like language comprehens ion . M o h d Sal leh (1990) showed there is a s trong ev idence be tween unders tanding mathemat ics and teaching me thods . Efforts have b e e n constant ly m a d e to identify n e w m e t h o d s ensur ing the ma themat i c s s tandards of po ly technic engineer ing s tudents are of adequate level and they cou ld comple te their engineer ing p rog rams (certificate and d ip loma) wi th in specified t ime.
The use of t echnology to improve learning effectiveness has b e e n wide ly s tudied. T h e o u t c o m e of these s tudies has been m i x e d depending on levels of educat ion, type o f s tudents and the context o f learning. For example M a y s (2001) in her diagnost ic error analysis in ma themat i c s d iscovered significant differences in the c lass room instruct ions which is dependent on the technology used. T h e use of col laborat ive learning m e t h o d has also been tried in some ins tances to improve mathemat ics learning Felder and Brent (2004) . T h e a im of this s tudy is to de termine the effect of t echnology suppor ted by col laborat ive learning on the learning of algebraic concepts a m o n g poly technic engineer ing s tudents under the M o H E .
M o h d Sazali Khal id Univers i t i Tun Husse in O n n Malays i a
h j s a z a l i @ u t h m . e d u . m y
M a i z a m Al ias Univers i t i Tun Husse in O n n Malays ia
m a i z a m @ u t h m . e d u . t n y
Introduct ion

2
O b j e c t i v e s
Aspec t s of ma themat ics that are of critical impor tance to engineer ing educat ion is a lgebra and p rob lem solving. A lgebra is the ga te to calculus . P r o b l e m solving helps to b r idge the k n o w l e d g e the s tudents have wi th the appl icat ion that is war ran ted (Levine , 1990). The object ives o f this pape r are to de termine:
(i) the effect of t echnology suppor ted col laborat ions on learning b y learners of different abil i ty (ii) wh ich abil i ty-levels of s tudent in different me thods per form m u c h better as opposed to i tem tested in
pre and pos t tests? (iii) the effect of us ing technology suppor ted col laborat ive learning on ach ievement in a lgebra p rob lems
solving (iv) the effect of the learning processes - the peer interactions be tween student to student, s tudent to teacher
in the t echnology suppor ted group that p romotes learning The independen t var iables are the tradit ional teaching me thod (control) , Col labora t ive learning only
(CL) , t echnology only ( C D ) and technology-suppor ted col laborat ive learning ( C D i C L ) . The dependen t var iables are the gain score . The media t ing var iables are the level of percept ions of m e m b e r effectiveness and par t ic ipat ions and preparedness a m o n g group m e m b e r s . Cont ro l led var iables are teacher quali t ies, lecture notes , and c lass room t ime o f interaction.
R e l a t e d W o r k s
In ma themat i c s educat ion, researchers like L inchevsk i and Herscov ics (1996) tried to ove rcome the cogni t ive gap whe re m a n y students are not able to spontaneous ly operate wi th u n k n o w n s . Difficulties in simplifying a lgebraic express ions whe re s tudents finish off a lgebraic equat ions such as 2x+3 as 5x or 5 were me t by Tirosh et al. (1998) . This is because literal symbols is found to b e the m a i n cause of their difficulties in ma themat ics Chr is tou et al. (2007) . H o w e v e r a body of research found that teaching cul ture whe re s tudents are mos t ly been spoon fed b y teachers in Schifter & Fosno t (1993) did p lay impor tant role in shaping the unders tanding concepts in algebra. Tel l ing methods in ma themat i c s teaching created confidence in handl ing mathemat ica l content and this support is lacking in teaching mathemat ics wi th compute r s (Zain, et al. 2006) .
G r o u p dia logue used b y s tudents whi le solving p rob lems generates l inkages be tween mathemat ica l symbol s and formal language (Morel l et al, 2001) . Bu t g roup work depends on mot iva t ion thus influencing effectiveness, p reparedness and commi tmen t levels a m o n g m e m b e r s .
C o m p u t e r Based Learn ing C B L through drilling and pract ice in mathemat ics packages he lps s tudents to acquire more skills and unders tanding . A cogni t ive theory b y H e r m a n n (1995) wrote : the h u m a n left bra in specia l ized o n facts whi le the r ight b ra in dwel ls bet ter on visual images . S tyne (2004) adapted H e r m a n n m o d e l for ma themat ics work and concepts in Sou th Africa. Styne found that h u m a n ' s re tent ion rate wh ich differs f rom one individual to another based on different learning styles and att i tude upbr ing ing can be improved through col laborat ive learning. Bu t des igning compute r software wi th mul t imed ia t echnology is a b ig chal lenge w h e n M a y e r et al (2001) c la imed mos t instructional designers talked about h u m a n m e m o r y over loading . But in the compute r laborator ies , one screen per idea m a y not be the mos t effective m e t h o d for g roup . Thus a merg ing poin t be tween group learning a n d C B L individual ized learning has to b e explored. C D i C L is p roposed here to address the above issues.
M e t h o d o l o g y
The target popula t ion of the s tudy is poly technic engineer ing students in 20 polytechnics in Malays ia . The samples were four intact classes of certificate engineer ing students f rom Kota Bharu Poly technic (KBP) , a total of 139 s tudents . T h e y were expec ted to be representa t ive o f the who le popula t ions of poly technic engineer ing s tudents in Malays ia as insti tutions are under one govern ing body .
Research Tools and Materials Five research tools were used in this s tudy, a courseware (CD-in terac t ive) , lecture notes , pee r evaluat ion
form, a pre-test , and a pos t test. The CD-interact ive was wri t ten in Engl i sh deve loped us ing the A D D I E
3
instruct ional mode l . Its content was l imited to Pre-Algebra , Factor iza t ion and Simplif icat ion only. This was de te rmined from S P M ( G C S E equivalence) i tem analysis . There are three modu les in the C D cal led Revis ion, Tes t and Links . Exercises were p rov ided at the end of each topic in the Rev is ion modu le . T h e C D Tes t modu le ( M C Q format) conta ined three levels . The s tudents wil l n e e d m o r e than 5 0 % correctness in order to p roceed from one level to another . The Links p rov ided as an enr ichment s trategy. The layout, content and interface des ign of this cd was deve loped based on the H e r m a n n W h o l e Bra in Theory mode l . The C D des ign also incorporates the educat ion ph i losophy called psychomotor , cogni t ive and affective.
A pi lot test on the usabi l i ty gave a) learning ability 8 7 % ; b) effectiveness 7 6 % ; c) screen a r rangement 7 6 % ; d) graphics 7 7 % ; e) use r satisfaction - 7 9 % ; f) overal l pe r fo rmance 8 8 % . A m o r e than 7 0 % depict acceptable and s t rong level as Sung (1997) suggested. Conten t val idi ty was assured b y a subject mat te r expert in K B P , mathemat ics graduate teachers from a Kelan tan secondary school , two senior ma themat ics lecturers in U T H M w h o checked the accuracy of the mark ing schemes and 23 math lecturers in K B P part ic ipat ing in an effective ma th teaching m e t h o d course . The Engl ish difficulty level was tried to 10 F o r m T w o (aged 14+) secondary school s tudents in S M Merant i , Kelan tan and c ross -examined b y a senior Engl i sh language lecturer f rom K B P . Thir ty quest ions (both in Engl i sh and Malays ian language) were des igned to facilitate col laborat ive learning in C L modu le bu t four quest ions were tr ied per week focusing on solving w o r d p rob l em solving ( W P S ) for g roup discussion. A short test w a s p repared to mon i to r their m a t h e m a t i c s ' unders tanding 10 minu tes before the end of each compute r laboratory interactions in each week thus creat ing t eam c o m m i t m e n t and accountabi l i ty .
Lecture notes based on the B 1 0 0 1 modu le w a s taken from the D P C C E M o H E . The content of these lecture notes were pi loted to 50 D I T Dip loma Students 2005 /2006 K U i T T H O / U T H M . Peer Evaluat ion F o r m w a s adminis te red to all par t ic ipants in g roup work . Each m e m b e r w a s graded on the scale of 2 to 10 in t e rms of g roup interaction. The forms were adapted from M u r d o c h Univers i ty . SPSS Vers ion 12.0 w a s used to process the f indings. Col laborat ive learning used S T A D format wi th five important ro les i.e. g roup leader, ass is tant leader , t ime keeper , runner and reporter . A n y team leader lasted for two weeks . A n observat ion sheet was used to check the learning processes in all t eams us ing C L only and C D i C L me thods . Externa l mot iva t ion (like C A D B U R Y ) is g iven for the t e am that s h o w e d the m o s t learning p rocesses taking their respect ive roles .
The Pre Test and Pos t Tes t ins t ruments consis ted of 10 quest ions in each test. It covered factorization, simplification, equat ions , n u m b e r computa t ions , and fractions. The quest ions in Pre and Post Tests were checked b y K B P ma th lecturers and 4 0 marked scripts were c ross -checked by two independent lecturers from K U i T T H O / U T H M to ensure consis tency wi th the mark ing scheme . Aud io -v ideo record ing and semi-s t ructured in terviews were done to t r iangulate the results from the quanti tat ive analysis results done . Qual i ta t ive analysis was done wi th Atlas/ t i Vers ion 5.
Research Procedure The s tudy uses a quas i -exper imenta l des ign approach wi th pre and pos t test us ing equivalent groups . T o
control any confounding var iables like differences in t eachers ' impact , the researcher taught all the four different c lasses in the morn ing sessions wi th in the eight w e e k per iod cover ing ear ly pre-a lgebra topics as conta ined in poly technic teaching and learning syl labus B 1 0 0 1 . Par t ic ipant observat ion was also used to extract information re la ted to the object ives. Bas ic des ign of s tudy is s h o w n in F igure 1.
G r o u p 1: P re Test -> t rea tment 1 -> Pos t Test G r o u p 2: P re Tes t -z> t rea tment 2 -> Pos t Tes t G r o u p 3 : P re Tes t -> t reatment 3 -> Pos t Test Group 4: Pre Test -> t rea tment 4 -> Pos t Tes t
Figure 1. S u m m a r y of the research des ign and p rocedure
In Trea tmen t 1, s tudents were g iven no CD-interac t ive and no C L (Contro l Group) . In Trea tment 2, s tudents were g iven C L only wh i l e in Trea tment 3 , s tudents were given C D only . Final ly in Trea tment 4 , s tudents were given both CD-interac t ive and CL. S T A D (student t e a m s ' ach ievement division) and no t T G T ( t eam g a m e tournament ) was appl ied in C L me thod in G r o u p 2 and G r o u p 4. F ive s tudents w o r k in a g roup taking specific roles . C L par t ic ipants tried to solve 4 word type p rob l em solving quest ions per session. Everyone

4
has to help each other to solve the quest ions . The roles in CL changed after every 2 weeks . Peer Evalua t ion F o r m s were comple t ed at the end of each C L session to enforce accountabi l i ty and c o m m i t m e n t levels . C o m m o n to all groups is a hard copy of lecture notes . C D i C L Dict ionar ies were given to all g roups to familiarize m a t h te rms.
Each g roup has four different levels of s tudents b a s e d on their ma themat ics grade at S P M . The levels are h igh (scoring 1A,2A), average( 3B,4B) , weak( 5C.6C) and very weak ( 7D,8E) . T h e group leader in CL was chosen from the h igh achiev ing s tudents . Each s tuden t ' s w o r k were c o m p a r e d at P re Test and Pos t Test . The i r learning gain/ lose was recorded based on tested i tems like ar i thmetic , symbo l manipula t ions and w o r d p rob lems .
Dura t ion of t rea tment was 8 w e e k s (but 2 w e e k s were u s e d to t rain C L a n d C D skil ls) . Each w e e k the t rea tment was adminis te red in the first hour of a B 1 0 0 3 Compute r Appl ica t ion subject. In terviews and v ideo record ing done to t r iangulate f indings. In terview was done dur ing late evenings for 3 mo n t h s consecut ively in F -Block, K B P to avoid adminis t ra t ive p rob lems wi th the s tudents .
Results
This sect ion has two parts - learning gains and learning processes . The immedia te sect ion p roduced the learning ga in componen t s of this research.
Effect of technology supported collaborative learning on learners of different ability For ty marked scripts that was done b y the researcher and cross examined b y another senior ma themat ics
lecturer were used to gather the data be low. Compar i son be tween marks at the pre-test and pos t test be tween each level o f s tudents f rom all the four different g roups were ana lyzed and the learning gain is recorded.
F igure 2 shows the distr ibution of learning accord ing to g roup and abili ty ( lowest , low, midd le and highest ) . F r o m Figure 2 (a) all g roup types contain losers ( < = 0 ga in score) . H o w e v e r the h ighes t number s of losers are in G r o u p 1 (Control Group) . F igure 2(b) G r o u p 3 and Group 4 conta ined m o r e gainers ( 6 - 1 5 marks) . F igure 2(c) depic ted more gainers in G r o u p 4 (6 - 20 marks ) . Whi le in F igure 2(d) more gainers in G r o u p 2 and G r o u p 3 only. This indicate that only low to middle achievers in mathemat ics in C D i C L and C D groups had benefi ted from technology whi le low achievers in C L only group ga ined the m o s t f rom elaborated explanat ion b y peers and lecturers .
THE LOWEST
1 1 2
3 10
6 4 -H 2 0 m
2 3
Group Typa
(a)
MIDDLE
• 1 - 5
0 6 - 1 0
• 11-15
• 16-20
0 > 20
i
T ! 1 z r r;zi 1
Q< = 0
• 1 - 5
• 6 - 1 0
011-15
• 16-20
• > 20
2 3
Group Type
(c)
LOW
C 2 » •a E 1 3
1 0
3 4
S 2 n E
2 3
Group Type
(b)
The HIGHEST
JIJLTL JUL 2 3
Group Type
(d)
m< - o • 1 - 5
• 6 - 1 0
• 11-15
• 16-20
m>20
• < = 0
• 1 - 5
• 6 - 1 0
• 11-15
• 16-20
• > 20
5
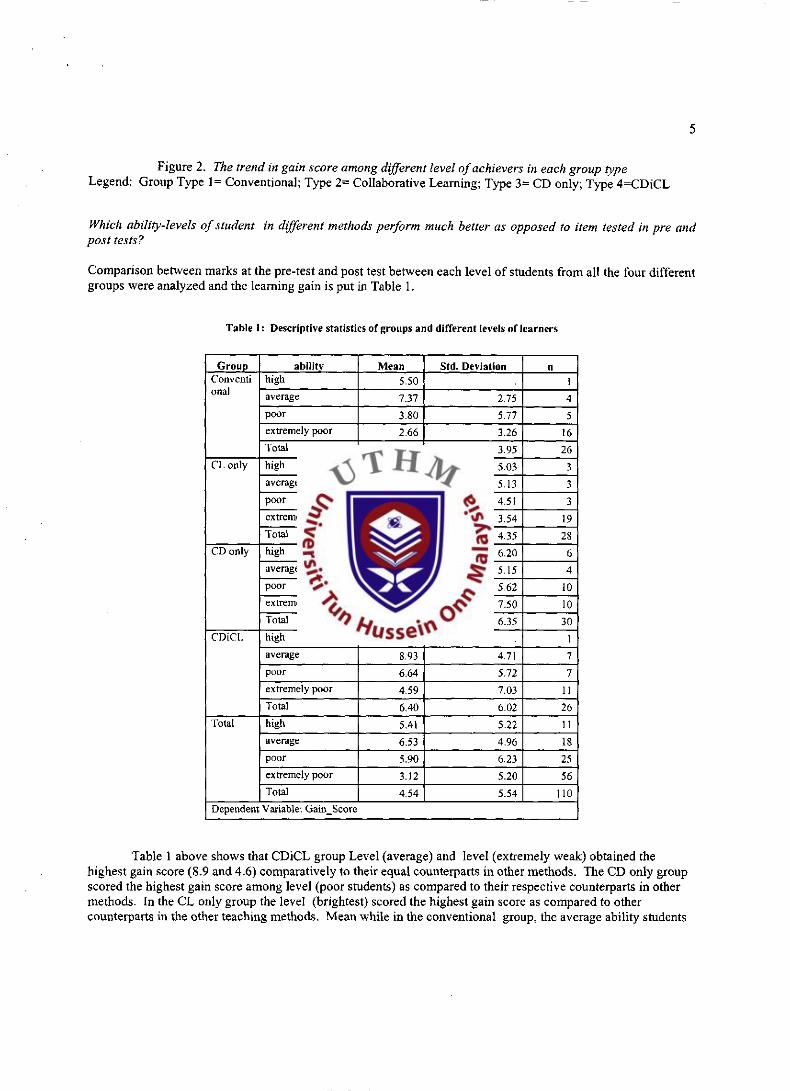
Figure 2. The trend in gain score among different level of achievers in each group type Legend : G r o u p Type 1= Convent ional ; T y p e 2= Col laborat ive Learning; Type 3= C D only; Type 4 = C D i C L
Which ability-levels of student in different methods perform much better as opposed to item tested in pre and post tests?
Compar i son be tween marks at the pre-test and pos t test be tween each level of s tudents f rom all the four different g roups were ana lyzed and the learning gain is pu t in Tab le 1.
Table 1: Descriptive statistics of groups and different levels of learners
Group ability Mean Std. Deviation n Conventi onal
high 5.50 1 Conventi onal average 7.37 2.75 4
Conventi onal
poor 3.80 5.77 5
Conventi onal
extremely poor 2.66 3.26 16
Conventi onal
Total 3.71 3.95 26 CL only high 7.67 5.03 3 CL only
average 1.33 5.13 3
CL only
poor -1.67 4.51 3
CL only
extremely poor 1.66 3.54 19
CL only
Total 1.91 4.35 28 CD only high 4.00 6.20 6 CD only
average 5.38 5.15 4
CD only
poor 8.70 5.62 10
CD only
extremely poor 5.00 7.50 10
CD only
Total 6.08 6.35 30 CDiCL high 7.00 1 CDiCL
average 8.93 4.71 7
CDiCL
poor 6.64 5.72 7
CDiCL
extremely poor 4.59 7.03 11
CDiCL
Total 6.40 6.02 26 Total high 5.41 5.22 11 Total
average 6.53 4.96 18
Total
poor 5.90 6.23 25
Total
extremely poor 3.12 5.20 56
Total
Total 4.54 5.54 110 Dependent Variable: Gain_Score
Tab le 1 above shows that C D i C L group Leve l (average) and level (ext remely weak) obtained the h ighes t gain score ( 8 . 9 a n d 4.6) compara t ive ly to their equa l counterpar ts in other m e t h o d s . The C D only g roup scored the h ighes t gain score a m o n g level (poor students) as compared to their respect ive counterpar ts in other me thods . In the C L only g roup the level (brightest) scored the highest ga in score as compared to other counterpar ts in the other t each ing m e t h o d s . M e a n whi le in the convent ional group , the average abil i ty s tudents

6
obta ined the h ighes t m e a n gain. Howeve r , the impact b e t w e e n ability level against m e t h o d is no t statistically significant (p=0 .324) as s h o w n in Table 2 be low.
Table 2: Tests of Between-Subjects Effects
Source Type III Sum of Squares df Mean Square F Sig.
Corrected Model 777.71(a) 15 51.85 1.90 .033 Intercept 1353.90 1 1353.90 49.51 .000 Group 167.90 3 55.97 2.05 .113 ability 89.12 3 29.71 1.09 .359 Group * ability 287.75 9 31.97 1.17 .324 Error 2570.64 94 27.35 Total 5612.00 110 Corrected Total 3348.36 109 a R Squared = .232 (Adjusted R Squared = .110) Dependent Variable: Gain_Score
Effect of technology supported collaborative learning on algebra achievements: analysis of quantitative data T w e n t y n ine s tudents failed to c o m e for the Pos t Test . Thus only data from 110 students were used in the
analysis (Table 3) . The W e l c h F me thod was used to compare the m e a n s as sugges ted by Fields (2000) because one of the t w o impor tant assumpt ions of A N O V A i.e. equal i ty of var iance cannot b e m e t (Table 4 ) . T h e result of the W e l c h Tes t in Tab le 5 shows that there is statistically significant difference be tween at least two m e a n s (p< .05) . A pos t hoc test (Tab le 6) were carr ied out to compare the m e a n s us ing the T a m h a n e ' s test as sugges ted b y Fields (2000) . Tab le 3 shows that the m e a n scores of each group are different f rom the other wi th the lowest score achieved b y G r o u p 2 and the h ighes t score b y group 4 . The Welch test in Tab le 4 indicates that at least two m e a n s are statistically significantly different ( p < 0 5 ) . A pos t hoc test (Table 6) indicates that the m e a n of G r o u p 4 is statistically significantly different at the 5 % level of significance from Group 2 a n d m e a n of G r o u p 3 is a lso statistically significantly different from G r o u p 2. Thus C D i C L t reatment p roduced greater learning of algebraic concepts and procedures c o m p a r e d to col laborat ive learning only.
Tab le 3 Descriptive Statistics of Gain Score in each group
N Mean Std. Deviation Std. Bnor
95 % Confidence Interval for Mean
Mnimum Maximum N Mean Std. Deviation Std. Bnor Lower Bound Upper Bound Mnimum Maximum 1 28 3.7115 3.95265 .77518 2.1150 5.3080 -1.50 13.50 2 28 1.9107 4.34625 .82136 .2254 3.5960 •6.00 13.00 3 30 6.0833 6.36051 1.15944 3.7120 8.4647 -5.50 18.00 4 26 6.4038 6.01668 1.17997 3.9737 8.8340 -9.00 17.00 Total 110 4.5364 5.54246 .52845 3.4890 5.5837 -9.00 18.00
Table 4 Levene Statistic - Homogeneity of Variances
Test of Homogeneity of Variances
Gain Score Levene
Statistic df1 df2 Siq. 3.083 3 106 .031
Table 5 Welch Method - as an alternative to ANOVA
Robust Tests of Equality of Me a ns
Gain Score Statistic3 dfl df2 Siq.
Welch 4.551 3 58.056 .006
a. Asymptotically F distributed.
Tab le 6 Cross difference between groups using Post-Hoc alternative

7
D e p e n d e n t V a r i a b l e : Q a i n _ S o o r e
M e a n D i f f e r e n c e 9 5 % C o n f i d e n c e I n t e r v a l
(1) G r o u p (J ) G r o u p ( l -J ) S t d . Error S i g . L o w e r B o u n d U p p e r B o u n d
T a m h a n e 1 2 1 . 8 0 0 8 2 1 . 1 2 9 4 0 . 5 2 6 - 1 . 2 8 8 0 4 . 8 8 9 7 3 - 2 . 3 7 1 7 9 1 . 3 9 4 7 1 . 4 5 2 - 6 . 1 9 4 5 1 . 4 5 0 9 4 - 2 . 6 9 2 3 1 1 . 4 1 1 8 2 . 3 2 4 - 6 . 5 8 4 8 1 . 2 0 0 1
2 1 - 1 . 8 0 0 8 2 1 . 1 2 9 4 0 . 5 2 6 - 4 . 8 8 9 7 1 . 2 8 8 0 3 - 4 . 1 7 2 6 2 " 1 . 4 2 0 8 9 . 0 2 9 - 8 . 0 6 0 2 - . 2 8 5 0 4 - 4 . 4 9 3 1 3 " 1 . 4 3 7 6 0 . 0 1 8 - 8 . 4 4 8 3 - . 5 3 8 0
3 1 2 . 3 7 1 7 9 1 . 3 9 4 7 1 . 4 5 2 - 1 . 4 5 0 9 6 . 1 9 4 5 2 4 . 1 7 2 6 2 " 1 . 4 2 0 8 9 . 0 2 9 . 2 8 5 0 8 . 0 6 0 2 4 - . 3 2 0 5 1 1 . 6 5 4 2 7 1 . 0 0 0 - 4 . 8 3 9 7 4 . 1 9 8 7
4 1 2 . 6 9 2 3 1 1 . 4 1 1 8 2 . 3 2 4 - 1 . 2 0 0 1 6 . 5 8 4 8 2 4 . 4 9 3 1 3 " 1 . 4 3 7 6 9 . 0 1 8 . 5 3 8 0 8 . 4 4 8 3 3 . 3 2 0 5 1 1 . 6 5 4 2 7 1 . 0 0 0 - 4 . 1 9 8 7 4 . 8 3 9 7
". T h e m e a n d i f f e r e n c e is s i g n i f i c a n t a t t h e . 0 5 l e v e l .
W h y is this so? Perhaps there is some differences be tween the learning processes in each of the teaching me thod . N o w the nex t par t s h o w s the result f rom the learning processes . This is d o n e w h e n the par t ic ipants are requi red to fill in the Peer Asses smen t forms and some v ideo and audio recordings were m a d e .
Pee r Eva lua t ion F o r m s asked opinions on: a) h o w effective was y o u r group, b) h o w m a n y m e m b e r s par t ic ipated in your work g roup and c) h o w m a n y part ic ipants were real ly prepared . Table 7 s h o w e d that C D i C L group has the h ighes t ra t ings for all three and therefore was the mos t effective. It was conc luded that if a s tudent perce ived his peers to b e effective then there wil l be more posi t ive at t i tude, mot iva t ion and par t ic ipat ion in the work ing group . Table 7 b e l o w p roduced m e a n and s tandard devia t ion on factors for successful learning.
The effect of the learning processes - the peer interactions between student to student, student to teacher in the technology supported group that promotes learning
Tab le 7 Mean and standard deviation Item —_ Group
Level
I II III IV Likert Scale used —_ Group Level a Description \J
X a
x KJ
X Lt
1 Effective 2.4 0.67 2.5 0.62 2.5 0.72 2.9 0.54 4 2 Participation 2.3 0.55 3.6 1.15 2.8 1.17 4.1 1.54 6 3 Fully preparedness 2.5 0.63 3.8 1.15 3.1 1.23 4.0 1.36 6
Other than pee r assessment forms, each t eam m e m b e r was asked to assess their peers in their t e am based on a s tandard rubrics . T h e score is 10 for perfect col laborat ive work and 2 for m i n i m u m col laborat ive work . Since each team has 5 m e m b e r s then each t e a m ' s m a x i m u m point is 40 . Tab le 8 be low can he lp to explain the above data w h e n t eam totals pee r week ly rat ings are scored. The C D i C L and C L only groups conta ined 5 m e m b e r per team.
Table 8 Total Marks from each team in Group CL only
Week Number \ Team's Name
W l W 2 W 3 W 4 W 5 W6 W 7 W8
PROTON 40 35 35 30 30 30 25 25 TNB 40 30 30 25 30 25 30 25 WIRA 40 35 35 20 20 20 20 20 MAWAR 40 40 25 20 20 20 20 20
F r o m Table 8 in the CL only group, the girl t e am called M A W A R scored the lowest total as compared to the b o y s ' team like P R O T O N , T N B and W I R A . Col lect ing their peer assessment forms is very t ime consuming .

8
Table 9 Total Marks from each team in Group CDiCL Week Number \
Team's Name W l W 2 W 3 W 4 W 5 W 6 W7 W8
PERWIRA 40 35 35 30 30 30 30 30 MOTO 40 30 30 25 30 30 25 25 GIRLS 40 35 35 20 20 20 20 20 REMPIT 40 40 25 20 25 25 25 25 ASTRO 40 40 25 30 30 20 20 20
The trend as in Tab le 8 in the C L group shows the girls evalua ted each other lower than the b o y ' s team was also observed in C D i C L group as s h o w n in Table 9. E v e n though from the observa t ion of the researcher and technic ians regard ing the s tudents ' w o r k whe re they hav ing difficulty wi th the w o r d problem solving, the b o y s s eemed to award h igh evaluat ion poin ts t o each other as compared to the g i r l s 1 t e ams M A W A R a n d G I R L S . This interest ing p h e n o m e n o n wil l b e used as the bas is for the interviews later on be tween the researcher and the s tudents .
Differences in the learning processes i.e., learning interaction between groups
All g roups p layed the s tandard learning process such as teaching, learning and assessment . The convent ional g roup repl icated the comfor table teach and l e a m me thod l ike their former schools . C L only g roup p l a y e d out the 5 different ro les S T A D as needed whi le solving word prob lem. T h e solut ion sheet g iven out was u s e d to guide their unders tand ing in ma themat ic s . They are requi red to sit for short test 10 minu tes before the sess ion ended. This p roduced some t eam commi tmen t s and accountabi l i ty . T h e C D only g roup tried dyad me thod whi le us ing the cd and they could hear other pairs d iscuss ing and talking a loud at other te rminals . Once they comple ted the sub-modules from the C D after the 2 0 t h minute they were g iven handouts to discuss W P S . Final ly the C D i C L used the cd for 20 minutes and the nex t 20 minu tes they p layed out the S T A D roles as requi red b y C L method . T h e y got the solut ion sheet in guiding their unders tanding and they sat for short 10 minu te test s imilar to C L g roup .
T h e differences are the a m o u n t of g roup interact ion be tween C D i C L , C L m e t h o d s and C D only method . Other differences are qual i ty of d iscuss ion wou ld be different be tween t eams of size 5 compared to t e am of size 2. T h e qual i ty of interact ion and discuss ion wou ld b e m o r e intense if all t e a m m e m b e r s w e r e put t ing serious effort in W P S . Bu t somet imes it was not iced that t e am of similar abil i ty could function better (comple t ing the sub modules from the C D faster and accurate) c o m p a r e d to pairs of different level of abili ty. T e a m that has m i x e d gender looks more vibrant in their interact ion as compared to teams of s imilar gender . Ano the r important observa t ion was no t all h igh achievers ( leader) can lead their t e am well . F e w average abil i ty peers can function as effective leaders because they were bo rn leaders wi th social skills like persuas ion and good personal i ty . C D and convent ional groups were exposed to short and directed ques t ion b y the researcher whi le C L and C D i C L were g iven s o m e exper ience in handl ing cogni t ive and meta cogni t ive th inking quest ions , i.e., ' w h y ' quest ions .
Discuss ion
The findings are the g roup that uses C D i C L has similar m e a n score on a lgebra test to g roup us ing C D and convent ional . Group us ing C D i C L have more interact ions compared to other groups . Group us ing C D i C L has h igher m e a n score on a lgebra p rob lems compared to g roup us ing C L method . There are few explanat ions to this . First ly, the s tudents are still n e w in us ing the technology C D i C L and they got different k ind of learning exper ience . Secondly , they are w e a k in Engl i sh and since C D i C L is pu t in Engl i sh the learning gains was quite low. Thi rd ly , the s tudents are n e w to each other thus the intensi ty of interactions in col laborat ive learning g roups could no t be op t imized and next, it was found that some s tudents are surface learners and not deep learners through their exper ience wi th the C D i C L . Final ly the w o r d p r o b l e m solving exercises p r o v e d strongly that m a n y s tudents did no t have m u c h exper ience doing this k ind o f w o r k dur ing their p rev ious secondary schools . T h e y preferred to do n u m b e r p rob lems compared to w o r d p rob l em solving. Simplifying mathemat ics

9
prob lems b y the researcher did not he lp the s tudents in the long run. Students w h o improved concurs to More l l et al. (2001) w h e r e technology improves learning by encourag ing groups to funct ion actively in the c lassroom. Part ic ipant observat ion me thodo logy found that the t eache r ' s voice and ques t ioning techniques p l ayed important roles as paral le l to Fe lders (1991) s ince the voice p layed an impor tant par t in const ruct ing mathemat ica l unders tanding . It was found that if p r o b l e m solving was no t p roper ly gu ided m a n y s tudents wou ld be off-task. This d e m a n d a lot of energy to imp lemen t (Slavin, 1995). Some group w o r k failed to p roduce important impact due to the lack o f mot iva t ion , interest a n d commi tmen t s level a m o n g t eam m e m b e r s especial ly b y in t roducing W P S . W P S d e m a n d e d three levels of skills - comprehens ion , mathemat ica l m o d e l and finally solving the mode l . This is hard because some low achieving learners took t ime to learn n e w skills like wri t ing mathemat ica l symbols . Thus there is a possibi l i ty that pee r assessment forms are filled up wi th some feeling of handicaps of W P S . S o m e misconcep t ions be tween ar i thmet ic and a lgebra could b e solved if the researcher was t ra ined on correct ma themat i c s ques t ioning techniques that were cons idered vital for cogni t ive deve lopmen t and matur i ty paral le l to M o u r s u n d (2006) propagated . This matur i ty d idn ' t happen in C D i C L w h i c h run for two mon ths only.
F r o m the short t ranscr ipt of this mathemat ics w o r k in K B P there is some signs of significant influence b e t w e e n g roup interactions and the courseware in bui ld ing the unders tand ing of algebra. This mul t imedia courseware b y adapt ing H e r m a n n W h o l e Bra in mode l p lus effective interact ions b e t w e e n lecturers , s tudents a n d peers did mot iva te s tudents to learn from interviews. The findings in this project w e r e consis tent wi th M a y e r (2003) whe re text , an imat ions and personal iza t ion are very impor tant e lements in t echnology learning. However , some students avoided text b y cla iming '..the pictures and animations are more than enough to understand the material.focus on numbers and literals ..not the language.. ' . T h e contr ibut ion m a d e b y this research is the use o f the H e r m a n n Bra in M o d e l i.e., four-quadrant screen m o d e l wh ich he lped the s tudents to moni tor their p rogress as conta ined in the lesson object ives. T h e y have m o r e control wi th the courseware w h e n they k n o w in advance h o w m u c h m o r e quadran ts in each screen to cover in order to achieve any lesson objective. B y feeling s/he is in control of their learning could b e a p lus factor a m o n g low achieving s tudents to l e am more . This is different to M a y e r et al (2001) mode l where their us ing o f text and visual screens he lped students to l e a m ra in and l ightning concepts in the science laboratory. Biologica l sc iences need the s tudents to see and bel ieve instantly whi le C D i C L four quadrant m o d e l p roposed that the s tudents mus t b e t ra ined to th ink deeply from text mater ia ls in the first p lace (Healy, 1998) fol lowed b y some discuss ion be tween peers in reaching c o m m o n unders tand ing before they w e r e g iven the v isual or an imated d iagrams as a s u m m a r y of a concept . In short the s tudents in C D i C L were t ra ined to think first , to unders tand second and to achieve full agreement third wi th their peers . Th i s has to b e done to p roduce some thinkers in ma themat ics educat ion (Healy , 1998). It is difficult to achieve the mos t learning impact from C D i C L wh ich was in Engl ish . However , nothing is lost w h e n from interview sessions they admit ted to apprecia te w h e n texts were r e m o v e d pr ior to an imat ion and pic tures . This a l lowed focusing to happen a m o n g C D and C D i C L users . Th ink ing a loud protocols were vividly d isp layed at m o s t terminals , encourag ing peer interact ions, e laborat ions and mere d iscuss ion a m o n g team m e m b e r s . Poor ques t ioning t echn iques b y the researcher that fail to m a k e discuss ion w o r k m o r e mot iva t ing has so m u c h to b e desired. It s eems that f rom proper ly ex tended elaborat ion be tween peers and researcher , low and middle achievers ga ined the extra benefi t as consis tent wi th Fe lder (1991) . In K B P w e found that the success of col laborat ive learning depended on good leadership and peer mode l ing of ex tended elaborat ion. These quali t ies are no t easy to obtain from low per forming students . The two other miss ing factors a m o n g the s tudents were they hesi tate to lead and take chal lenging roles in their learning processes . This is against the bel ief that mos t construct ivis ts and cognit ivists agree that learning can happen from active part icipat ion. The low and poores t g roup of s tudents failed to a t tend interview sessions because of anxie ty that w a s no t yet r e m o v e d from the 8 w e e k work in K B P . Their wi thdrawing from taking effective l eade r ' s role in any C L exercise regardless of persuas ion by the researcher caused a surpris ing result w h i c h is no t paral le l to S lav in(1995) C L work . Howeve r , teaching b y better peers to weake r peers not only resulted in the low achieving s tudents to benefit ( see Figure 1) bu t a lso the h igh achieving students themselves gain from structuring and restructur ing their unders tanding all a long the episodes . The different total t e am scores as in Table 8 and Table 9 expla ined that few m e m b e r s were not g iv ing their bes t effort to achieve t eam success in C L activit ies especial ly their week ly quizzes . This is because as the w e e k s m o v e d on towards the end of the e ighth week , everybody sensed that each one of t h e m is falling beh ind in p lay ing their respect ive roles l ike leader and repor ter of the team. The hard ques t ions in W P S added more we igh t expla in ing this behavior . This k ind of t e a m behav iour expla in some h o w the differences
10
be tween effectiveness, p reparedness and percept ion of each s tudent in any CL teams as paral lel to Slavin (1995) . In short, the benefi ts in K B P were l imited because t ime constraint ( 1 hour laboratory pe r week) and difficulties encountered in Engl i sh C D contents and interpret ing W P S into mathemat ica l s tructure. T h e s tudy contr ibuted a bi t for Malays ia in deciding whe the r ma themat ics should be taught in Engl i sh in all inst i tut ions Future research cou ld try to ex tend the use of C D i C L ( m a l a y language) in checking the mos t learning effect us ing technology .
Conc lus ion
The s tudy set out to identify whether there is an impact of interact ion be tween three important componen t s of teaching and learning, name ly lecturers, s tudents , peers whi le us ing C D i C L courseware . The learning ou tcomes resul t ing from using t echnology suppor ted col laborat ive learning was that us ing C D i C L leads to m o r e s tuden t s ' interactions as compared to the convent ional m e t h o d and us ing C D i C L also p roduces superior p rob l em solving per formance w h e n c o m p a r e d to the C L me thod bu t not the other two me thods . The average and w e a k students f rom both C D i C L and C D was found to learn mathemat ics us ing technology. The contr ibut ion m a d e b y C D i C L towards mathemat ics educat ion us ing M a y e r ' s cogni t ive loading pr inciples was also explained.
A c k n o w l e d g e m e n t s
U T H M for financial support , E P R D M o H E , M r Mokh l i s Jaafar, Director , Cur r i cu lum Divis ion of D P C C E , M o H E , Director , all Staff D M S C and part icipat ing 2006 /2007 s tudents in K B P , Pr incipal S M Merant i , Kelantan, and D I T 1 F T M M 2005 /2006 ba tch of s tudents and Mis s W a h i d a h A b u Baka r F T M M for test ing the cd.
References
Atkinson , S. (2001) . A n explora t ion of cogni t ive style and compute r a ided learning from the perspect ive of the user and des igner in I. Mot t ie r & M . D e Vries(Eds) PATT11: New Media in Technology Education (pp.3-14) Hol land: E indhoven Univers i ty of Technology .
Chris tou, K.P. , Vosn iadou , S. and Vamvakouss i , X . (2007) . Reconstructing Mathematics Education: Stories of teachers meeting the challenge of reform. N . Y : Teachers Col lege Press .
Chris tou, K.P. , Vosn iadou , S. and Vamvakouss i , X . (2007) . Students interpretations of literal symbols in Algebra. Chapter 19. In Reframing the Conceptual Change Approach in Learning and Instructions. [online] h t tp : / /books .google .com/books Accessed on 30th Augus t 2007 .
Fe lder R . M . (1991) . Effective teaching: A workshop. Depa r tmen t of Chemica l Engineer ing . N o r t h Corol ina State Univers i ty . Rale igh . N . C .
Fe lde r R . M and Bren t (2004) . No te s on Co-Opera t ive Learn ing . Skudai : U T M Field, A . (2000) . Discovering Statistics Using SPSS for Windows (2nd Edi t ion) . London : Sage. Healy , J .M.(1998) . Fai lure to connect : H o w Compute r affect our ch i ld ren ' s minds for bet ter and worse . U S A :
S i m o n and Schuster . H e r m a n n , N . (1995) . The Creative Brain ( 2 n d Edi t ion) . U S A : Quebecor Pr int ing B o o k Group . Levine, M. (1994). "Effective Problem Solving". 2 n d Ed. New Jersey: Prentice-Hall. Linchevsk i , L , and Herscov ics , N . (1996) . Cross ing the cogni t ive gap b e t w e e n ar i thmetic and algebra:
operat ing on the u n k n o w n s in the context of equat ions . Educational studies in mathematics. 30(1) . (pp 39 - 6 5 )
Marz i ta Puteh . (2002) . Factors associated with mathematics anxiety. Tan jung M a l i m : Univers i ty Perguruan Sul tan Idris .
Mayer , R E (2001) . The C a m b r i d g e H a n d b o o k O f Mul t imedia Learning . Cambr idge : Cambr idge Univ Press . Mayer , R.E. (2003) . The p romise of mul t imedia learning: us ing the same instruct ional design me thods across
different media . Learning and Instructions. 13. (pp. 125-139) . London : P e r g a m o n
M a y s , H. (2001) . An Intelligent Diagnostic System for Algebra Based in a Taxonomy of errors and a Computational Model of Mathematical Problem Solving. Unpub l i shed P h D Thes i s Univers i ty of Bal lara t Austral ia .

11
M o h d Salleh A b u (1990) . A n exploratory study of mathemat ica l difficulties exper ienced by the pre-univers i ty s tudents at Univers i ty Tekno log i Malays ia and the relat ion to the structure of mathemat ica l ability. Unpub l i shed P h D thesis . Brunei Univers i ty London .
More l l L., B u x e d a R., Orenga M. , Sanchez A . (2001) . After so m u c h effort: Is faculty us ing cooperat ive learning in the c lass room? Journal of Engineering Education (pp. 357 - 362) .
Mour sund , D .G. (2006) . Computational thinking and mathematics maturity : improving math education in K-8 schools, [online] h t tp : / /uoregon .edu/~moursund/Books /Elmath /ElMath .h t in l .
Schifter D . , and Fosnot , C.T. (1993) . Restructuring Mathematics Education: Stories of teachers meeting the challenge of reform. N Y : Teachers Col lege Press
S tyne T. Workshop on the principles and practices of an academic support programme for engineering students. Facul ty of Engineer ing . U K M . 28-29 January 2004 .
S u n g H.L . (1999) . Usabi l i ty test ing for developing effective interact ive mul t imedia software. Concepts , d imens ions and procedures . Educational Technology & Society. 2(2) . (pp 20-29) .
Tirosh, D „ Even , R., and Robinson , N . (1998) . Simplifying algebraic express ions : Teacher awareness and teaching approaches . Educational Studies in Mathematics. 35 . (pp 51-64) . Ne ther lands : K luwer A c a d e m i c Publ ishers .
Zain , M.Z .M. , Majid, O., Luan , W.S . , Fong , S.F., Atan , H. & Idrus , R . M . (2006) . Compute r s in Malays ian Smar t School : T h e changing of technologies and mindse t s . Malaysian Journal of Educational Technology. 6(2) . (pp. 61-70) . Zhang , R., Zhou ,Y . , & Ishino, F . (2008) . A pre l iminary s tudy on Predic t ion M o d e l s for Engl i sh W e b - B a s e d
Remed ia l Educa t ion : Appl ica t ion of Data M i n i n g T h e o r y ' . W S E A S Transac t ions on A d v a n c e s in Engineer ing Educat ion . 5(5) . 3 3 1 - 3 4 1 .