the effect of casino proximity on lottery sales: zip code-level evidence from maryland 10 th...
TRANSCRIPT
The Effect of Casino Proximity on Lottery Sales: Zip Code-Level Evidence from Maryland
10th European Conference on Gambling Studies and Policy IssuesHelsinki, Finland
11 September 2014
Douglas M. Walker and Will E. Cummings

Casino Proximity and Lottery Sales 2
Background
• Maryland lottery established in 1973• Annual Sales reached $1 billion in the 1990s, then more
– But traditional products began to decline in early 2012• Maryland’s first casino (Hollywood) opened in 2010• Except for Virginia, Maryland is surrounded by casino
states– Delaware– West Virginia– Pennsylvania– New Jersey & Ohio also in the region
11 September 2014

Casino Proximity and Lottery Sales 3
Map of Northeast USA
11 September 2014
Casino Proximity and Lottery Sales 4
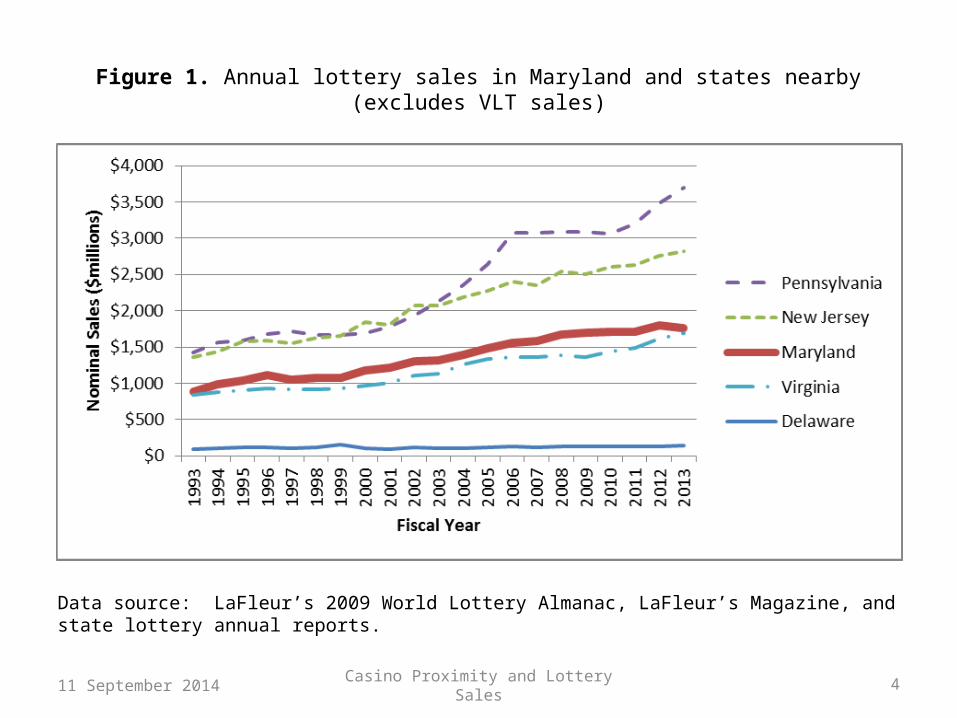
Figure 1. Annual lottery sales in Maryland and states nearby(excludes VLT sales)
Data source: LaFleur’s 2009 World Lottery Almanac, LaFleur’s Magazine, and state lottery annual reports.
11 September 2014

Casino Proximity and Lottery Sales 5
Figure 2. Maryland and nearby casinos
11 September 2014

Casino Proximity and Lottery Sales 6
Background, continued
• Study purpose: Analyze lottery sales data to determine if/how lottery has been affected by casinos in and around Maryland– We also analyze proximity of casinos on lottery sales
• Lottery data provided by Lottery’s vendor, Scientific Games– Vendor-level monthly sales data on 17 lottery games
offered– July 2009 through February 2014
• Data begin over 1 year before first Maryland casino opened
11 September 2014
Casino Proximity and Lottery Sales 7
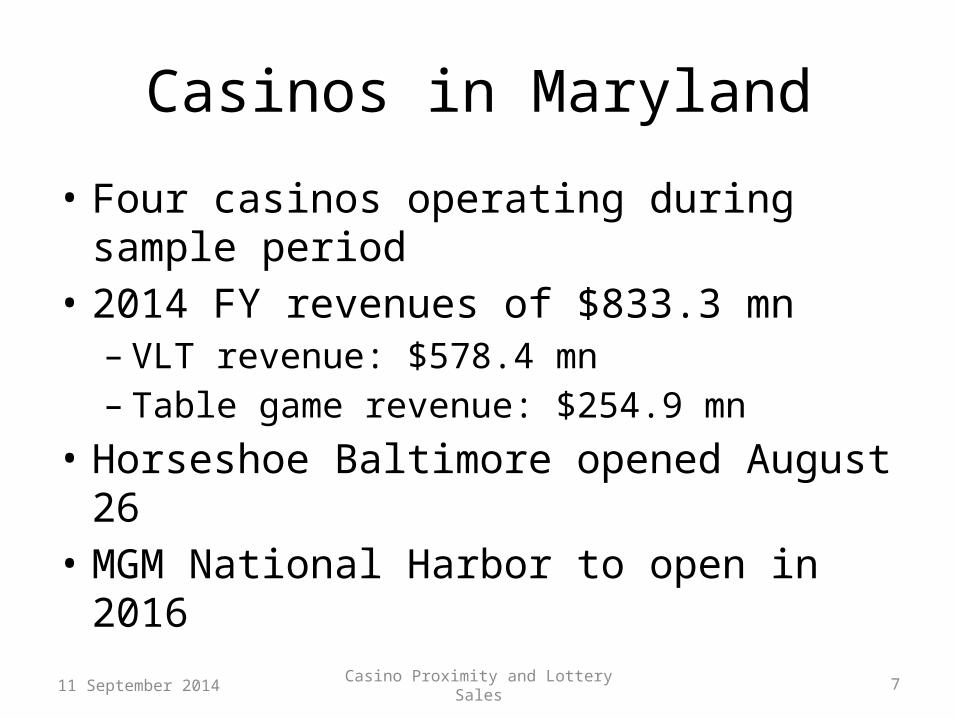
Casinos in Maryland
• Four casinos operating during sample period• 2014 FY revenues of $833.3 mn– VLT revenue: $578.4 mn– Table game revenue: $254.9 mn
• Horseshoe Baltimore opened August 26• MGM National Harbor to open in 2016
11 September 2014
Casino Proximity and Lottery Sales 8
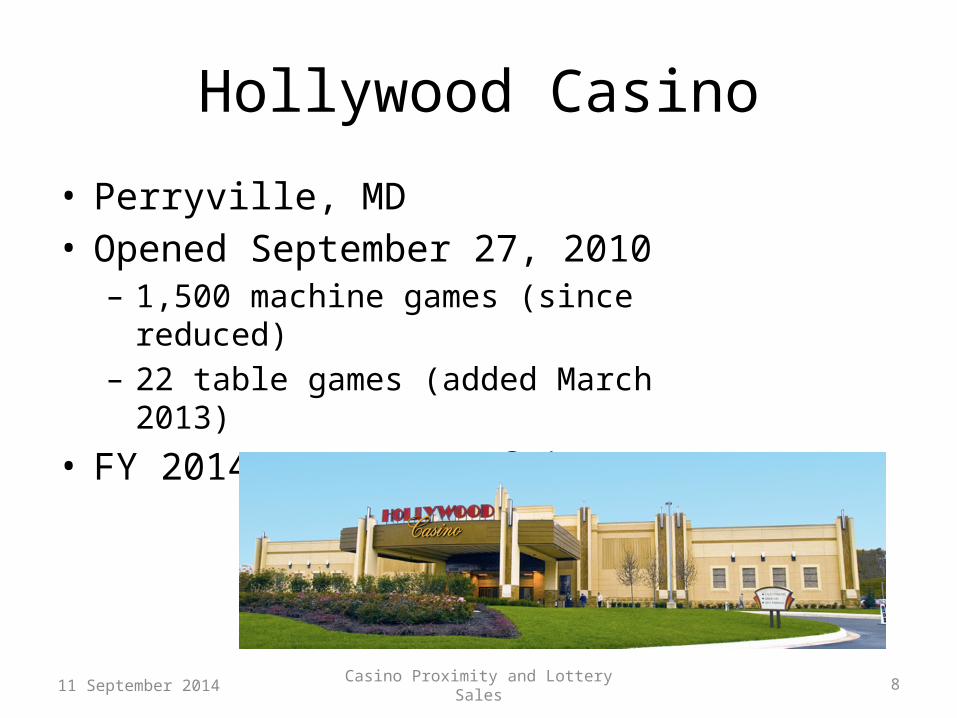
Hollywood Casino
• Perryville, MD• Opened September 27, 2010– 1,500 machine games (since reduced)– 22 table games (added March 2013)
• FY 2014 revenues of $85.7 mn
11 September 2014

Casino Proximity and Lottery Sales 9
Casino at Ocean Downs
• Berlin, MD• Opened January 1, 2011– 800 machine games– No table games (yet)
• FY 2014 revenues of $52 mn
11 September 2014

Casino Proximity and Lottery Sales 10
Maryland Live! Casino
• Hanover, MD• Opened June 5, 2012– 4,332 machine games– 177 table games
• FY 2014 revenues of $754.4 mn
11 September 2014
Casino Proximity and Lottery Sales 11
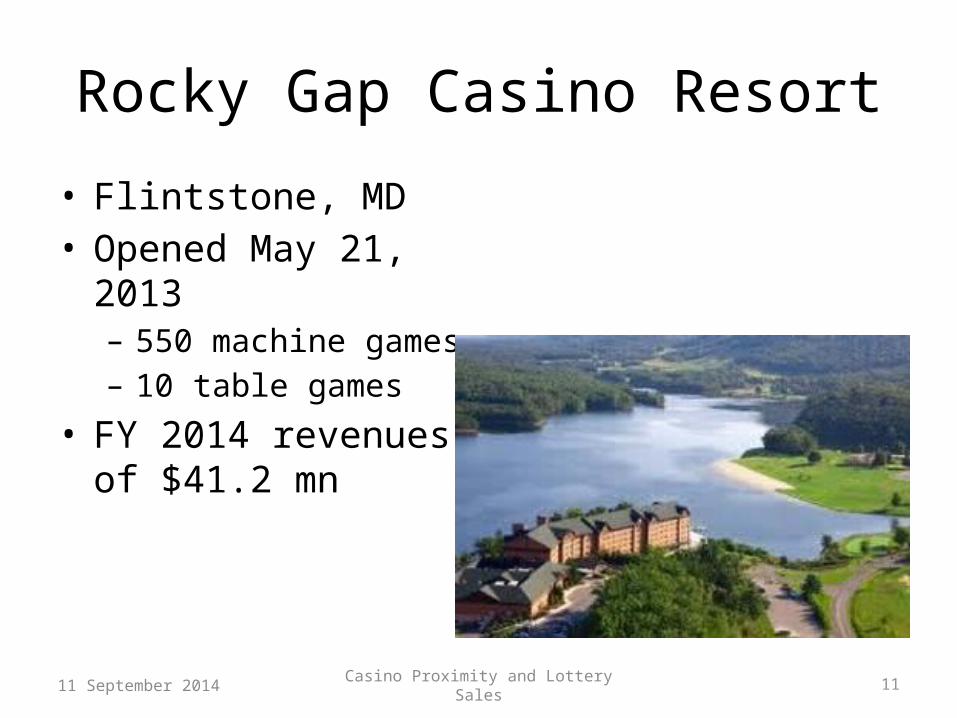
Rocky Gap Casino Resort
• Flintstone, MD• Opened May 21, 2013– 550 machine games– 10 table games
• FY 2014 revenues of $41.2 mn
11 September 2014

Casino Proximity and Lottery Sales 12
Lottery trends
• Data indicate positive sales trend until early 2012, then sales begin to decline
• Downward trend continues through end of sample period
• “Monitor” and “Monitor” games appear to have most negative trends
11 September 2014

Casino Proximity and Lottery Sales 13
Figure 3. Total monthly sales, all Maryland lottery games
11 September 2014
Casino Proximity and Lottery Sales 14
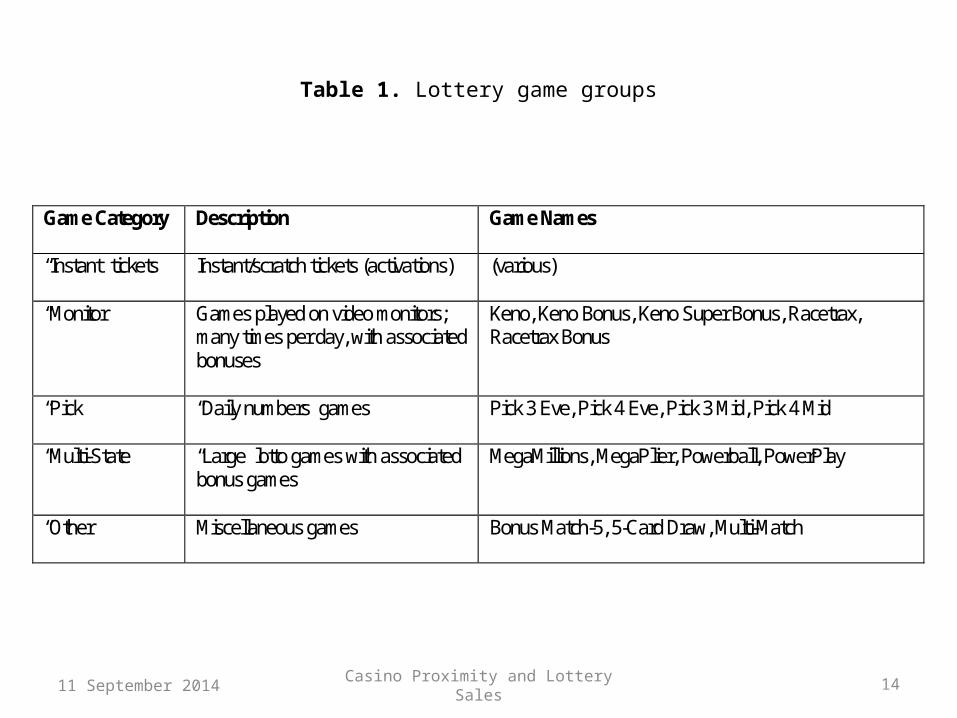
Table 1. Lottery game groups
Game Category Description Game Names
“Instant” tickets Instant/scratch tickets (activations)
(various)
“Monitor” Games played on video monitors; many times per day, with associated bonuses
Keno, Keno Bonus, Keno Super Bonus, Racetrax, Racetrax Bonus
“Pick” “Daily numbers” games
Pick 3 Eve, Pick 4 Eve, Pick 3 Mid, Pick 4 Mid
“Multi-State” “Large” lotto games with associated bonus games
MegaMillions, MegaPlier, Powerball, PowerPlay
“Other” Miscellaneous games
Bonus Match-5, 5-Card Draw, Multi-Match
11 September 2014
Casino Proximity and Lottery Sales 15
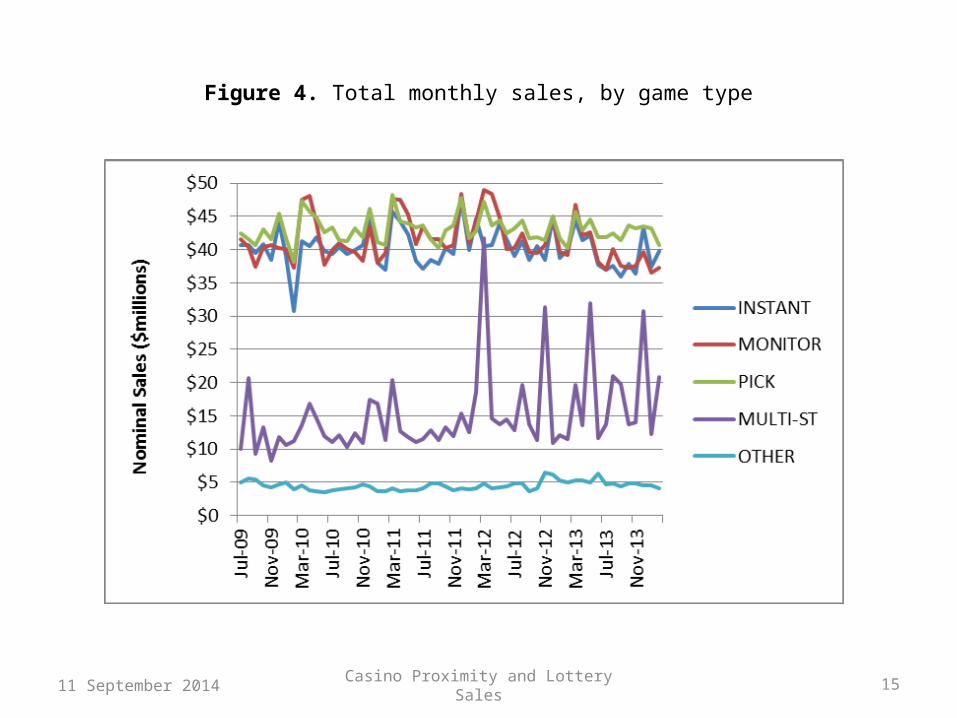
Figure 4. Total monthly sales, by game type
11 September 2014
Casino Proximity and Lottery Sales 16
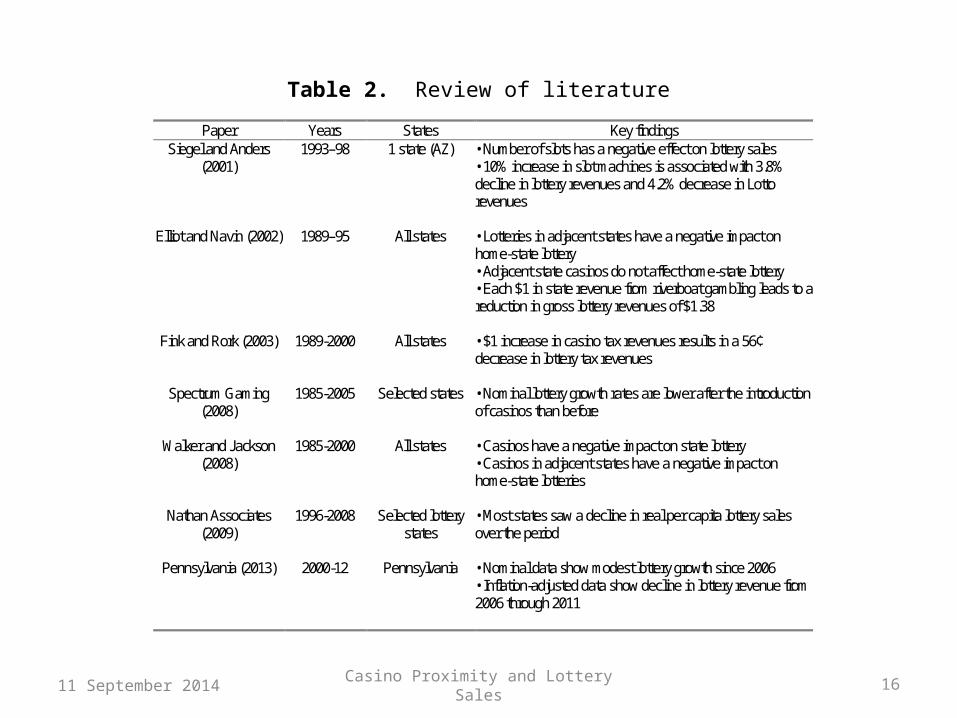
Table 2. Review of literature
Paper Years States Key findings Siegel and Anders
(2001) 1993–98 1 state (AZ) • Number of slots has a negative effect on lottery sales
• 10% increase in slot machines is associated with 3.8% decline in lottery revenues and 4.2% decrease in Lotto revenues
Elliot and Navin (2002) 1989–95 All states • Lotteries in adjacent states have a negative impact on
home-state lottery • Adjacent state casinos do not affect home-state lottery • Each $1 in state revenue from riverboat gambling leads to a reduction in gross lottery revenues of $1.38
Fink and Rork (2003) 1989-2000 All states • $1 increase in casino tax revenues results in a 56¢ decrease in lottery tax revenues
Spectrum Gaming
(2008) 1985-2005 Selected states • Nominal lottery growth rates are lower after the introduction
of casinos than before
Walker and Jackson (2008)
1985-2000 All states • Casinos have a negative impact on state lottery • Casinos in adjacent states have a negative impact on home-state lotteries
Nathan Associates (2009)
1996-2008 Selected lottery states
• Most states saw a decline in real per capita lottery sales over the period
Pennsylvania (2013) 2000-12 Pennsylvania • Nominal data show modest lottery growth since 2006
• Inflation-adjusted data show decline in lottery revenue from 2006 through 2011
1
11 September 2014
Casino Proximity and Lottery Sales 17
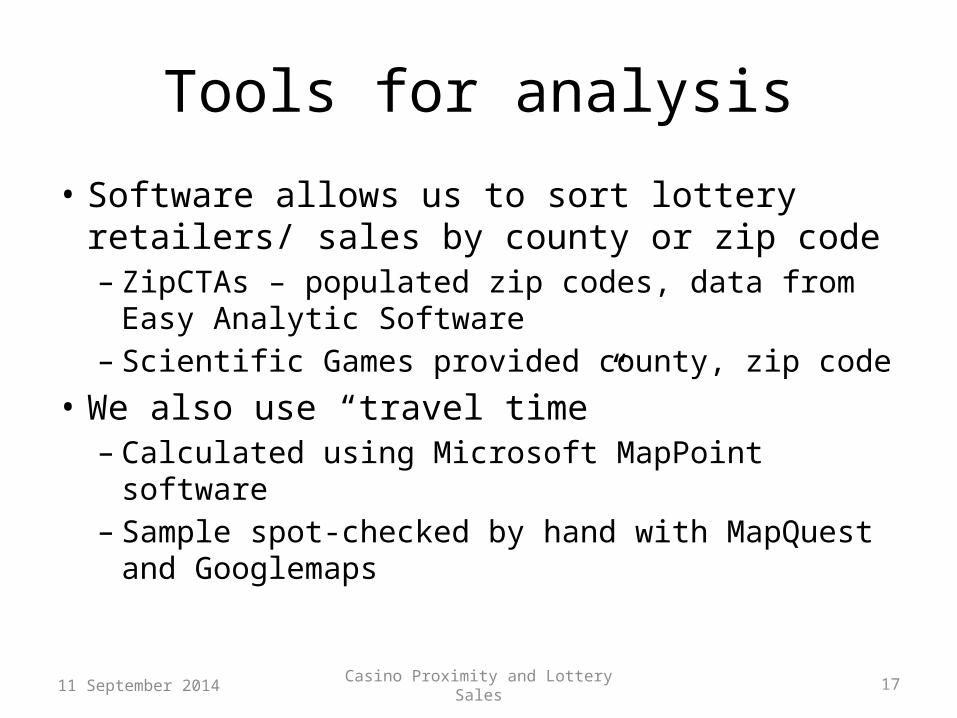
Tools for analysis
• Software allows us to sort lottery retailers/ sales by county or zip code– ZipCTAs – populated zip codes, data from Easy
Analytic Software– Scientific Games provided county, zip code
• We also use “travel time” – Calculated using Microsoft MapPoint software– Sample spot-checked by hand with MapQuest and
Googlemaps
11 September 2014

Casino Proximity and Lottery Sales 18
Scale of analysis
• Lottery sales data are monthly, by retailer• Should we analyze casino effect by county, zip
code, or individual retailer?– Maryland counties are large, and Maryland Live is
near border of three counties– Zip code-level analysis is possible and provides a
more ‘micro’ view of effects– Retailer-level would be extremely complicated and
tedious, with few advantages• 4 million data points…
11 September 2014
Casino Proximity and Lottery Sales 19
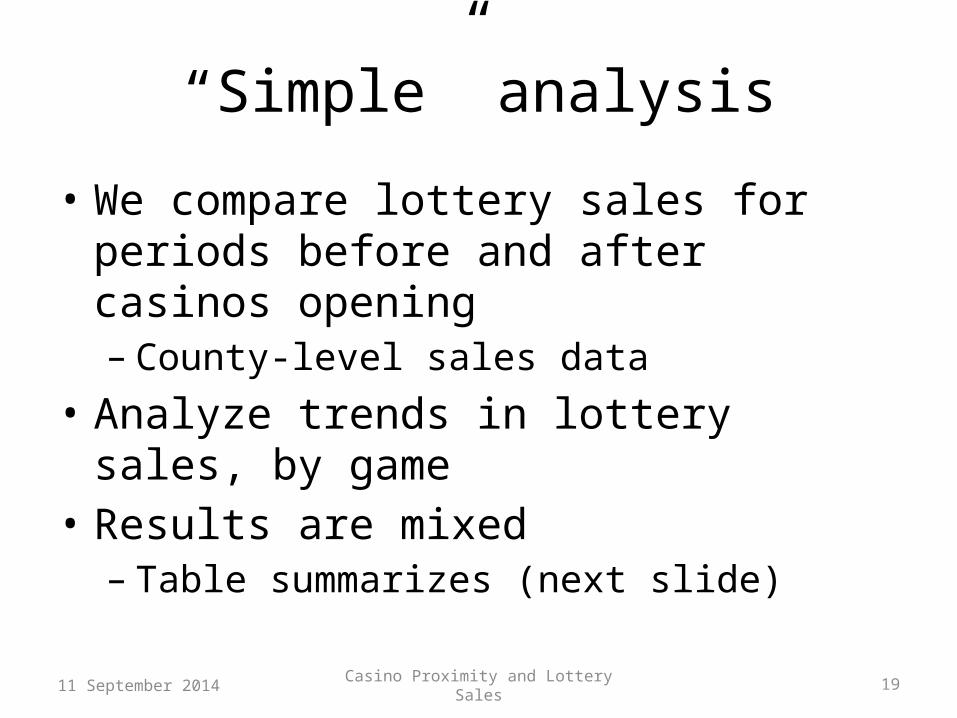
“Simple” analysis
• We compare lottery sales for periods before and after casinos opening– County-level sales data
• Analyze trends in lottery sales, by game• Results are mixed– Table summarizes (next slide)
11 September 2014

Casino Proximity and Lottery Sales 20
Table 3. Summary of apparent near-term impacts on local lottery sales
Instant Monitor Pick Multi-St Hollywood Casino -0.2% -0.8% -16.0% -2.5% Ocean Downs Casino -11.6% -15.1% -7.1% 0.7% Maryland Live Casino -9.6% -12.8% 2.7% 3.1% Rocky Gap Casino* 0.3% -4.5% 2.0% 12.5%
* Changes for Rocky Gap are for the 9 months following, not 11 or 12.
11 September 2014

Casino Proximity and Lottery Sales 21
Econometric analyses
• Model explains “change in sales” (Δ Sales) over the same month the year before
• Controls for other factors that might affect lottery sales
• This is the first study to explain lottery sales using an intra-state casino proximity variable– Other studies found negative impact from
adjacent state casinos
11 September 2014

Casino Proximity and Lottery Sales 22
The model
• Explanatory variables:– “change in gravity” (Δ Gravity) over the same
month the year before• “Gravity” = 1/travel time
– Zip code fixed effects– Time period fixed effects
• The model: Δ Sales$i,t = Constant + Δ Gravityi,t + εi,t
(Constant = Zip fixed effects + Time fixed effects)
11 September 2014

Casino Proximity and Lottery Sales 23
Table 4. Basic regression results
Instant
Monitor Pick Multi-State Other
Constanta
(p-value) 321.1293 (0.0451)
40.08864 (0.8911)
229.3958 (0.0740)
4638.434 (0.0000)
151.9791 (0.0000)
Δ Gravity (p-value)
-192057.6 (0.0000)
-374069.5 (0.0000)
-62338.24 (0.0000)
-84463.49 (0.0011)
32246.77 (0.0000)
n
16,403 16,403 16,403 16,403 16,403
R2 0.256667
0.149506 0.261548 0.435712 0.331153
11 September 2014

Casino Proximity and Lottery Sales 24
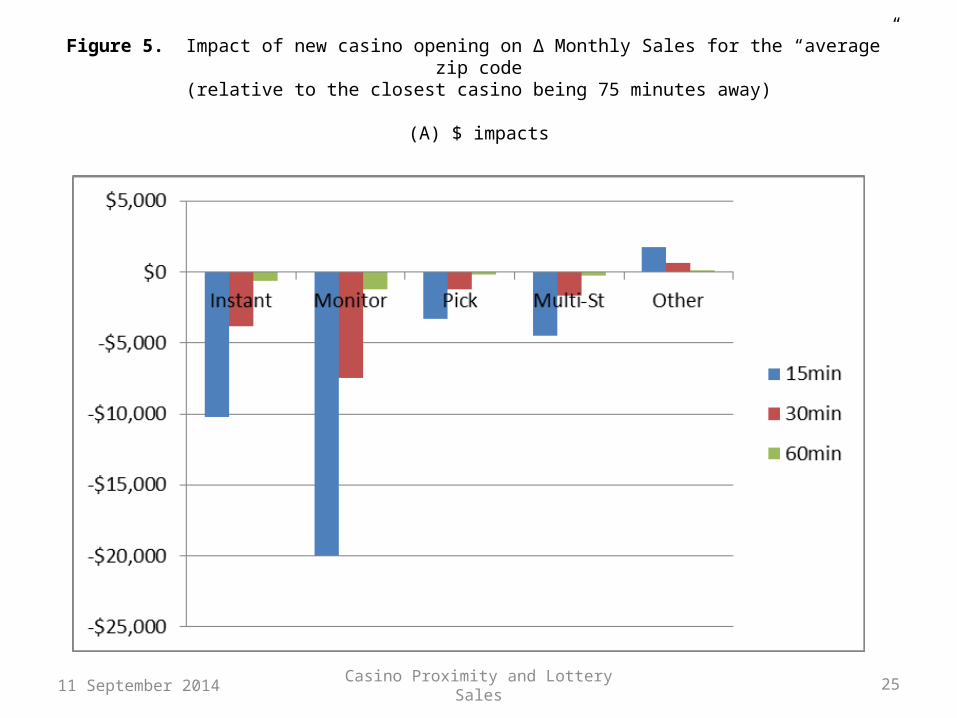
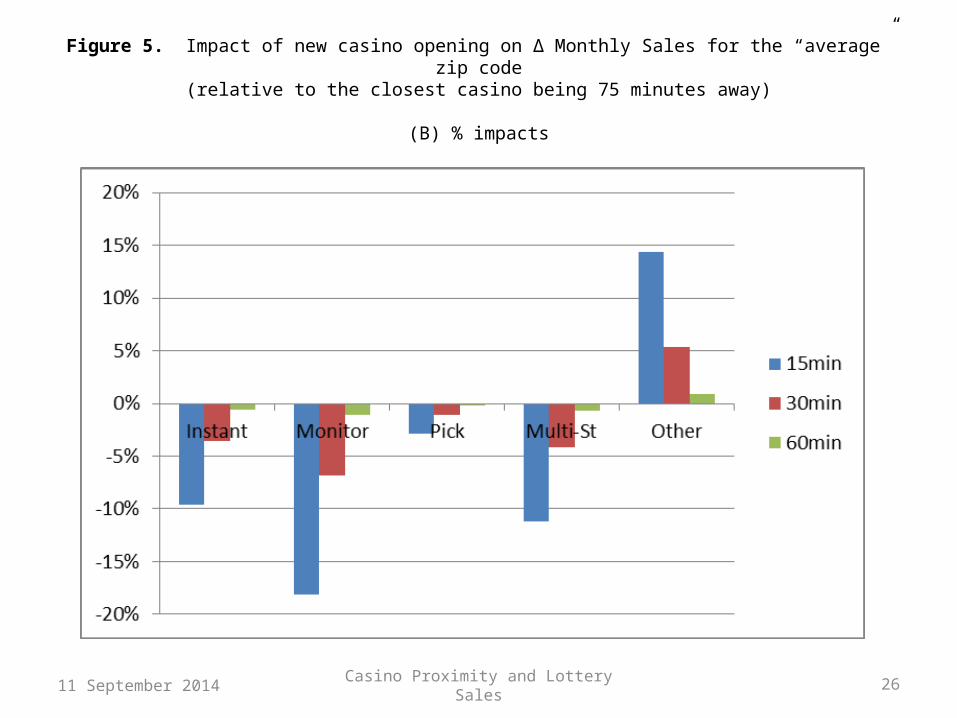
Interpretation of results
• Gravity coefficients are negative and significant
• Interpretation of coefficients for panel data (many zips, 56 time periods) isn’t intuitive
• We show the results in terms of the impact of a casino opening within certain travel times to an “average” zip code– Results are relative to baseline in which the
closest casino being 75 minutes away11 September 2014
Casino Proximity and Lottery Sales 25
Figure 5. Impact of new casino opening on Δ Monthly Sales for the “average” zip code(relative to the closest casino being 75 minutes away)
(A) $ impacts
11 September 2014
Casino Proximity and Lottery Sales 26
Figure 5. Impact of new casino opening on Δ Monthly Sales for the “average” zip code(relative to the closest casino being 75 minutes away)
(B) % impacts
11 September 2014

Casino Proximity and Lottery Sales 27
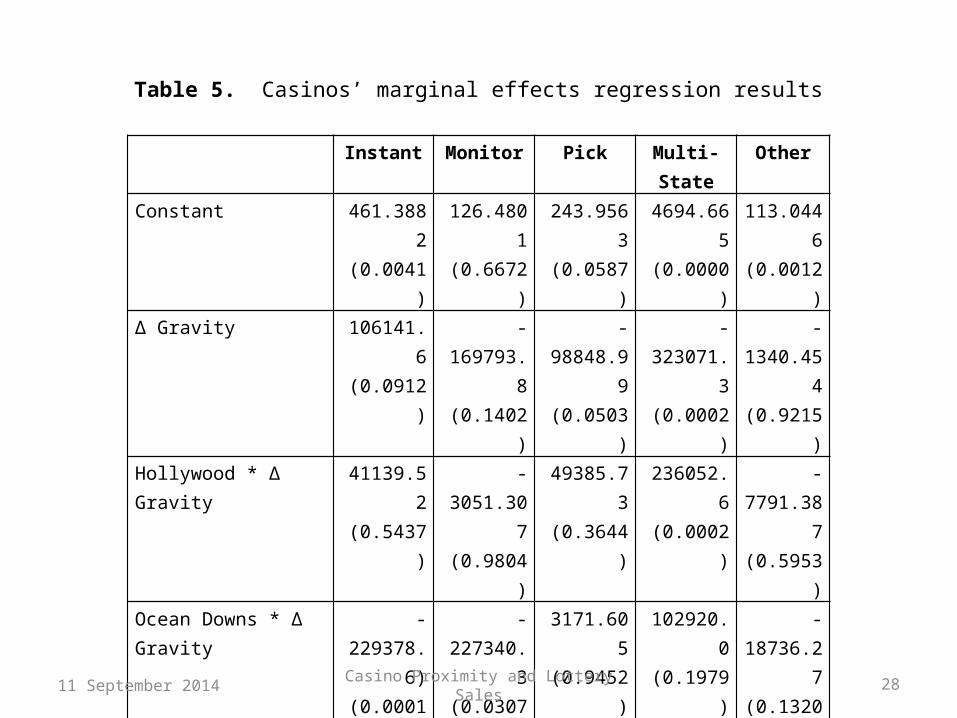
Casino-specific effects
• We next model the incremental impact on the lottery from each casino individually
• Variables are casino dummies multiplied by Δ Gravity– This isolates the Δ Gravity in each month to the casino
responsible for the Δ Gravity• Model is again run for each type of lottery game:
Δ Sales$ i,t = Constant + Δ Gravity + (Hollywood dummy * Δ
Gravity) + (Ocean Downs dummy * Δ Gravity) + (Maryland Live dummy * Δ Gravity) + (Rocky Gap dummy * Δ Gravity) + e i,t
11 September 2014
Casino Proximity and Lottery Sales 28
Table 5. Casinos’ marginal effects regression results
Instant
Monitor Pick Multi-State Other
Constant 461.3882(0.0041)
126.4801(0.6672)
243.9563(0.0587)
4694.665(0.0000)
113.0446(0.0012)
Δ Gravity 106141.6(0.0912)
-169793.8(0.1402)
-98848.99(0.0503)
-323071.3(0.0002)
-1340.454(0.9215)
Hollywood * Δ Gravity 41139.52(0.5437)
-3051.307(0.9804)
49385.73(0.3644)
236052.6(0.0002)
-7791.387(0.5953)
Ocean Downs * Δ Gravity -229378.6)(0.0001)
-227340.3(0.0307)
3171.605(0.9452)
102920.0(0.1979)
-18736.27(0.1320)
Maryland Live * Δ Gravity -480594.6(0.0000)
-366019.8(0.0021)
-3719.379(0.9432)
74634.02(0.4087)
78948.39(0.0000)
Rocky Gap * Δ Gravity -39262.92(0.4677)
303612.4(0.0022)
107688.5(0.0132)
450357.2(0.0000)
37140.16(0.0015)
n
16,403 16,403 16,403 16,403 16,403
R2 0.261405 0.151262 0.261922 0.437304 0.337682
11 September 2014

Casino Proximity and Lottery Sales 29
Monetary estimates from results
• We calculated the impact of all Maryland casinos on annual lottery sales– Based on last full year of sales data (3/13 – 2/14)– Δ Gravity from first to last period, mult. by Δ
Gravity coeff from Table 4 (aggregate regression)• Next we calculated impact of each casino on
annual lottery sales– Δ Gravity plus marginal impact coeff of each
casino (from Table 5), multiplied by Δ Gravity
11 September 2014

Casino Proximity and Lottery Sales 30
Table 6. Estimated impact of all Maryland casinos on annual lottery sales($ millions)
Instant Monitor Pick Multi-St Other
Total, All Games
Actual Last Year Sales (3/2013 – 2/2014) $471.2 $472.5 $515.3 $223.2 $58.63 $1,740.8
Estimated Casino Impact ($12.44) ($24.24) ($4.04) ($5.47) $2.09 ($44.10) -2.64% -5.13% -0.78% -2.45% 3.56% -2.53%
95% Confidence Interval, Lower Bound ($14.81) ($28.58) ($5.93) ($8.76) $1.58 ($56.48)
-3.14% -6.04% -1.15% -3.92% 2.69% -3.24%
95% Confidence Interval, Upper Bound ($10.08) ($19.91) ($2.14) ($2.19) $2.60 ($31.72) -2.14% -4.21% -0.42% -0.98% 4.44% -1.82%
11 September 2014

Casino Proximity and Lottery Sales 31
Table 7. Estimated impacts of individual Maryland casinos on annual lottery sales($ millions)
Instant Monitor Pick Multi-St Other
Total, All Games
Actual Last Year Sales (3/2013 – 2/2014) $471.2 $472.5 $515.3 $223.2 $58.63 $1,740.8
Hollywood Casino Impact $2.56 ($3.01) ($0.86) ($1.51) ($0.16) ($2.98) 0.54% -0.64% -0.17% -0.68% -0.27% -0.17%
Ocean Downs Impact ($0.66) ($2.11) ($0.51) ($1.17) $0.11 ($4.55)
-0.14% -0.45% -0.10% -0.52% 0.18% -0.26%
Maryland Live Impact ($13.99) ($20.03) ($3.83) ($9.29) $2.90 ($44.24) -2.97% -4.24% -0.74% -4.16% 4.95% -2.54%
Rocky Gap Impact $0.30 $0.61 $0.04 $0.58 $0.16 $1.70
0.06% 0.13% 0.01% 0.26% 0.28% 0.10%
Total Estimated Impacts ($11.78) ($24.54) ($5.16) ($11.39) $2.80 ($50.07) -2.50% -5.19% -1.00% -5.10% 4.77% -2.88%
11 September 2014

Casino Proximity and Lottery Sales 32
Forecast of new casinos’ impacts
• Lastly, we forecasted the likely impacts of the Horseshoe Baltimore (opened 8/26/14) and MGM National Harbor (to open summer 2016)– Assume that each casino has marginal impacts
similar to Maryland Live casino– Both new casinos are in populous areas, like
Maryland Live
11 September 2014

Casino Proximity and Lottery Sales 33
Table 8. Forecasted impact of two new casinos on annual lottery sales($ millions)
Instant Monitor Pick Multi-St Other
Total, All Games
Actual Last Year Sales (3/2013 – 2/2014)
$471.2 $472.5 $515.3 $223.2 $58.63 $1,740.8
Horseshoe Casino, Baltimore Estimated Impact
($8.45) ($12.09) ($2.32) ($5.61) $1.75 ($26.72) -1.79% -2.56% -0.45% -2.51% 2.99% -1.53%
MGM, National Harbor Estimated Impact
($5.90) ($8.45) ($1.62) ($3.92) $1.22 ($18.66) -1.25% -1.79% -0.31% -1.75% 2.09% -1.07%
Horseshoe AND MGM Casinos Estimated Total Impact
($14.35) ($20.54) ($3.93) ($9.52) $2.98 ($45.38) -3.05% -4.35% -0.76% -4.27% 5.07% -2.61%
11 September 2014

Casino Proximity and Lottery Sales 34
Conclusion
• Existing casinos have caused a decline in annual lottery sales of $44-50 million
• Two new casinos expected to cause decline in lottery sales of another $45 million
• Total casino impact on lottery around $95 million, around 5.5%
• This is the first study to analyze…– Effect of casino proximity on lottery sales– Impact of casinos on individual lottery game types
• The model could be applied to other jurisdictions• Follow-up research on net tax impact of new casinos11 September 2014

Casino Proximity and Lottery Sales 35
Contact information
Doug WalkerProfessorDepartment of EconomicsCollege of Charleston66 George St.Charleston, SC [email protected]
Will CummingsPresidentCummings Associates135 Jason St.Arlington, MA [email protected]
11 September 2014