the effect of barrage releases on the biota of the ......responses of biota of the northern lagoon...
TRANSCRIPT

The effect of barrage releases on the collective responses of biota of the Northern Lagoon of the
Coorong and Murray Mouth
A report prepared for the South Australian Department of Environment and Natural Resources
Ben Hamilton, Rebecca Lester and Peter Fairweather
September 2011
The effect of barrage releases on the biota of the Coorong and Murray Mouth: A synthesis Report prepared for DENR
Page 2 of 36
Contents
Introduction ............................................................................................................................................ 3
Summary of findings relating to individual taxonomic groups ............................................................... 6
Monitoring of macroinvertebrate assemblages (Dittmann et al. 2011)............................................. 6
Monitoring of phytoplankton and water quality (Aldridge & Brookes 2011) .................................... 7
Monitoring of zooplankton assemblages (Shiel 2011) ....................................................................... 8
Monitoring of fish assemblages (Ye et al. 2011) ................................................................................. 9
Monitoring of fish assemblages (Wedderburn et al. 2011) .............................................................. 10
Monitoring of bird assemblages (Paton 2011) ................................................................................. 11
Methods for the synthetic analysis ....................................................................................................... 13
Results ................................................................................................................................................... 16
Assessing the effect of site and time on individual biotic assemblages ........................................... 16
Assessing the effect of site and time on each of the syntheses ....................................................... 20
Relating environmental conditions to observed biotic patterns ...................................................... 23
Relating biotic responses to the response for other taxonomic groups .......................................... 30
Discussion.............................................................................................................................................. 31
Conclusions ........................................................................................................................................... 34
References ............................................................................................................................................ 35

The effect of barrage releases on the biota of the Coorong and Murray Mouth: A synthesis Report prepared for DENR
Page 3 of 36
Executive Summary Severe drought in recent years, combined with over-extraction, has dramatically reduced flows in the River Murray, so that end-of-system flows in the Murray-Darling Basin dwindled from 2002 onwards, ceasing entirely between 2007 and 2010. During this period, the Coorong, the estuary for the Murray-Darling Basin, became a marine to hypersaline environment, with large impacts on the typically-estuarine biota of the region.
River Murray flows increased during winter in 2010, allowing water flow over barrages to recommence from late August, creating an increase in water levels, increasing connectivity and improving water quality. The impact on biotic assemblages was monitored between November 2010 and April 2011 for fish, phytoplankton, zooplankton and benthic macroinvertebrates. Bird monitoring was also undertaken during the period. Monitoring occurred at multiple locations downstream of the barrages, clustered in the Murray Mouth region, with several in the North Lagoon. Here we identify whether there is any concordance in the messages arising from the various taxon-specific studies (with the exception of birds, for whom data were not available), as well as any ecosystem-level responses to the release of water following drought.
The time of sampling was the predominant driver of both taxonomic-specific and ecosystem-level responses. This is likely to represent the ongoing response of the biota to the freshening associated with barrage flows, although a lack of data from before barrage flows commenced means that time cannot be definitively linked to flow alone. The lack of significant site-to-site variability was unexpected, given that a range of sites extending into the North Lagoon was surveyed. This may suggest that the effect of barrage flows was relatively uniform across the sites sampled, and sites located further into the Coorong may have shown different responses.
Patterns in individual and cross-taxonomic assemblages were best correlated with environmental syndromes including water quality variables. This suggests that ecological change was driven by the effects of freshwater flows, rather than the flows themselves. The relatively limited set of environmental data available may have restricted the correlations that were apparent, but the patterns identified provide several useful hypotheses for further testing.
Furthermore, there were several key relationships identified between pairs of individual assemblages. Patterns in fish and phytoplankton assemblages, and in macroinvertebrate and zooplankton assemblages, were significantly correlated, respectively. These relationships may either reflect links through trophic webs or be due to responses to the same set of environmental cues for each pair. Additionally, more specific testing would be required to determine which one was the case.
The consistent and overlapping design of monitoring among taxonomic groups provided a strong basis for synthesis across groups and identification of ecosystem-level responses and interactions. However, the lack of sites unaffected by flows and of sampling times prior to the release of water limited the inferences that could be drawn, so that patterns observed cannot be categorically linked to flow. However, a number of useful hypotheses were identified that warrant further testing to better understand the drivers of ecological response to a return to barrage flows.

The effect of barrage releases on the biota of the Coorong and Murray Mouth: A synthesis Report prepared for DENR
Page 4 of 36
Introduction
The estuarine and coastal lagoon system at the terminal end of the Murray-Darling Basin consists of the Coorong, Lower Lakes and Murray Mouth, which is regionally, nationally, and globally unique (Phillips and Muller 2006). The region supports a range of ecological communities (including plants, invertebrates, birds and fish) and biodiversity at a range of scales (Phillips & Muller 2006), whilst holding significant cultural, economic and recreational values.
Anthropogenic impacts (including river regulation and water extraction) have had profound effects on these natural ecosystems, and such impacts are often more evident at the terminal end of the basin than further upstream. Severe drought in the Murray-Darling Basin has reduced outflow significantly, with little to no flow leaving the Murray Mouth from 2002 through to mid-2010. The lack of freshwater input led to the Coorong becoming a marine to hypersaline environment, impacting heavily on the region’s ecology (Brookes et al. 2009).
Different components of the ecosystem are likely to respond differently, firstly to the lack of fresh water in the Coorong, but then also to the return of flows. Native fish (which tend to be relatively slow responders to ecological change; Lester & Fairweather 2009) are influenced by the effects of reduced freshwater flow on biotic variables (including the impact on nursery, breeding and feeding grounds), but also the recruitment of diadromous fish (i.e. those that travel between fresh and marine environments to complete their life cycle) is likely to fail due to a lack of physical connectivity (Ye et al. 2011). Birds also respond slowly to ecological changes (except through movement), influenced by food resources and habitat availability, as determined by the salinities and water levels associated with previous drought conditions (Paton 2011). Macroinvertebrates, however, respond to ecological change rapidly (Dittmann et al. 2011), influenced by water quality, water levels and sediment attributes.
In winter 2010, River Murray flows increased, allowing the first barrage releases to occur since 2007. The associated rise in water levels flooded key wetlands, increasing aquatic habitat, reducing elevated salinity levels, improving water quality and covering acid sulphate soils, and restoring physical connectivity upstream within the Murray-Darling Basin. The exact impact that these water releases would have on the biotic assemblages of the region was unknown and thus individual components of the ecosystem were monitored by specialists for each taxonomic group, implemented soon after barrage releases began. The effect of re-introducing flows after a period of severe drought allows us to take an ecosystem-wide approach to understanding the effect of water release on multiple taxonomic assemblages in the region, which can then inform management on future prevailing conditions when flow regimes are more variable.
Targeted monitoring occurred for phytoplankton, zooplankton, benthic macroinvertebrates and fish.

The effect of barrage releases on the biota of the Coorong and Murray Mouth: A synthesis Report prepared for DENR
Page 5 of 36
The specific objectives of the monitoring program were to:
• determine whether juvenile congolli (Pseudaphritis urvilli) utilise the Goolwa barrage fishway to travel from the estuary into the Goolwa weir pool during a fishway release of 5 GL;
• assess abundances and movements of other diadromous and estuarine fish during the release, and compare to previous assessments under no-flow conditions;
• assess any changes in diatoms and other phytoplankton or zooplankton assemblages in the estuary in comparison to baseline (no-flow) conditions, in relation to Goolwa cockle food sources; and
• assess any rapid changes in benthic invertebrate abundances and diversity in the region directly downstream of the Goolwa Barrage.
These individual objectives are being addressed by the individual reports into fish, phytoplankton, zooplankton and benthic macroinvertebrates, respectively. Ongoing bird monitoring also continued through the release period.
Here, we address the overarching objectives of identifying whether there is any concordance of messages emerging from these different taxon-specific studies about the response to barrage releases, as well as identify clues to ecosystem-level reactions. Furthermore, these messages can then form baseline data sets, and hence lead to the development of hypotheses as to whether patterns observed through time (i.e. as recorded here) are in fact as a result of barrage releases.
The design adopted for this monitoring sought to contrast sites located downstream (none were located upstream) of the barrages. Sites were heavily clustered around the Murray Mouth and throughout the Goolwa Channel, with relatively few extending below the North Lagoon. Sites were not located further south due to the small flow volumes predicted when the monitoring program was initially designed, which were subsequently exceeded. Sampling commenced during November and December of 2010 (i.e. several months after the opening of barrages in late August), and carried on into January and February 2011 with flows continuing during 2011, with no sampling possible to monitor the assemblages in pre-flow conditions.
This report attempts to synthesise the findings across datasets collected for these different taxonomic groups, based on the data collected between November 2010 and April 2011. We provide a brief summary of the individual taxonomic findings, as they have been provided by the original authors, then outline the methods used for, and results of, a synthetic meta-analysis combining datasets across the different taxonomic groups. We conclude by discussing the management implications of the findings.

The effect of barrage releases on the biota of the Coorong and Murray Mouth: A synthesis Report prepared for DENR
Page 6 of 36
Summary of findings relating to individual taxonomic groups
Reports outlining the findings of barrage releases on the biota of the North Lagoon were provided for:
• macroinvertebrates (Dittmann et al. 2011);
• phytoplankton and water quality (Aldridge & Brookes 2011);
• zooplankton (Shiel 2011);
• fish (Ye et al. 2011); and
• birds (Paton 2011).
These reports are summarised here to provide context for the subsequent analyses. Bird data were collected but were not supplied and thus have not been used in subsequent analyses, although the findings have been summarised along with the other interim reports. A second group also studied fish assemblage structure over the same period (see Wedderburn et al. 2011). We did not utilise these data, however, because the spatial arrangement of sites did not overlap with what was needed for our analyses. Data were sourced for water level, salinity, pH and numerous other water quality variables at corresponding sites from Aldridge & Brookes (2011) and Department of Water (2011). The timing of reporting meant that only interim reports were available at the time of writing. These interim reports have been summarised below. More detailed analyses and interpretations may be contained in the final reports prepared by each group and should be consulted for further information.
Monitoring of macroinvertebrate assemblages (Dittmann et al. 2011)
To determine trends in macroinvertebrate communities after recent significant freshwater inflow, community structure, environmental condition and habitat quality were monitored throughout the Goolwa Channel and the North Lagoon of the Coorong (Dittmann et al. 2011).
Nine sites throughout the Murray Mouth and North Lagoon of the Coorong were sampled in December 2010 and February 2011, where 10 each of core and Ekman grab samples were taken from nearshore and subtidal habitats, respectively. Grain size, organic matter, and chlorophyll a concentrations of the sediment were also sampled. PRIMER and PERMANOVA+ software was used to run permutation-based analyses of variance (PERMANOVA), principal coordinate ordinations (PCO) and analysis of similarities (ANOSIM) analyses on the resultant data.
Twenty species were recorded throughout the entire monitoring program, where the taxonomic contribution from annelids (6 species), crustaceans (6 species) and insect larvae (6 species) was consistent across sites. The polychaetes (Simplisetia aequisetis and Nephtys australiensis), amphipod peracarids (Amphipoda) and non-biting midge flies (Chironomidae) were present at almost all sites, having the highest frequency of occurrence. Species richness was highest in December 2010, dropping in January 2011 (Dittmann et al. 2011).
Numerous diversity indices were used (including Shannon-Wiener diversity, Pielou’s index for equitability and total species number), which revealed an overall low diversity with few dominant

The effect of barrage releases on the biota of the Coorong and Murray Mouth: A synthesis Report prepared for DENR
Page 7 of 36
species, and with no consistent pattern across sites, between intertidal and subtidal environments, or over time. Abundance was highest in subtidal compared to intertidal samples, but remained relatively low in comparison to previous studies (Dittmann et al. 2011).
The authors concluded, based on the presence of different size classes of polychaetes and amphipods, that a recruitment event had occurred prior to sampling, indicating a positive response to freshwater inflow. This conclusion is somewhat speculative, as samples designed to quantify recruitment per se did not detect similar responses.
The authors also concluded that the prevailing freshwater conditions in the region (<5 ppt) had led to unfavourable conditions for estuarine and marine macroinvertebrates, with some species appearing to migrate south from the Murray Mouth region to the North Lagoon, presumably seeking a refuge from the prevailing freshening conditions (Dittmann et al. 2011).
Interestingly, the authors noted that the polychaete spp. Capitella (a pollution indicator according to Dittmann et al. 2011), which was a dominant feature of sediments in the past, was absent from all sites sampled, whilst other species of polychaete and amphipod (which were absent in the past due to degradation of environmental conditions) have returned. The assumptions made here were presumably based on personal observations and expert opinion, as no data analysis containing information from historical pre-flow conditions appeared in the interim report.
Unfortunately, the authors noted that, whilst the barrages opened in August, the sampling did not commence until December, so 3-4 months of early response were missed.
Monitoring of phytoplankton and water quality (Aldridge & Brookes 2011)
Recent large freshwater inflows from the highly-regulated and drought-affected Murray River caused rapid changes in the North Lagoon, Murray Mouth and nearshore environments of the Southern Ocean (Aldridge & Brookes 2011).
Eleven sites throughout the region (including the Goolwa Barrage, the Murray Mouth, Mundoo Channel, Boundary Creek and the western end of the North Lagoon), were visited at fortnightly intervals from November 2010 through to mid-January 2011, where a calibrated multiprobe was lowered into the water column at 0.25-m depth intervals to record temperature, specific electrical conductivity, dissolved oxygen (concentration and % saturation), pH, turbidity and chlorophyll a. Monthly water samples were collected for nutrient and phytoplankton sampling across the same time period.
Sampling by Aldridge & Brookes (2011) did not capture the beginning of significant freshwater inflow (e.g. prior to November 2010, when electrical conductivities were reportedly >54,000 µS cm-1) but, due to the magnitude of flows, electrical conductivity showed little variation spatially. Throughout the course of this study salinities fell from 2500 µS cm-1to 800 µS cm-1. Outside the Murray Mouth salinity levels were below that of saltwater, even with the influence of daily tidal and wind mixing conditions, indicating the sheer volume of freshwater flow passing through the Murray Mouth (Aldridge & Brookes 2011).
Density differences prevented the complete mixing of the two waterbodies, with anoxic conditions recorded in the lower-most layer of dense cold water. This stratification had the potential to restrict

The effect of barrage releases on the biota of the Coorong and Murray Mouth: A synthesis Report prepared for DENR
Page 8 of 36
suitable habitat for benthic or demersal flora and fauna, potentially promoting nutrient release from sediments (although this was untested in the interim report) (Aldridge & Brookes 2011). At several sites, sustained freshwater inflows appeared to break down salinity stratification, increasing dissolved oxygen levels in the hypolimnion (a dense cold layer of water at the bottom of the water column), and thus potentially increasing habitat availability for numerous organisms (i.e. through the provision of suitable water quality in a greater proportion of the water column) (Aldridge & Brookes 2011).
Observed decreases in dissolved oxygen concentrations toward the end of the study period may have been a result of increases in microbial respiration. This phenomenon may be linked to the rapid breakdown of organic material after a rapid change in salinity or source water, when waters already low in dissolved oxygen collected previously dry and dead organic matter that has been inundated with recent flows whose breakdown consumes the available dissolved oxygen (also known as a ‘blackwater event’) (Aldridge & Brookes 2011).
Phytoplankton communities changed rapidly during the study period, going from an assemblage dominated by green algae (Chlorophyta), as per pre-flood conditions (although no data from pre-flood condition were included in this report), to an assemblage dominated by blue-green algae (Cyanobacteria), thought to be a consequence of water movement from the Lower Lakes (Aldridge & Brookes 2011). The authors considered that phytoplankton assemblages were likely to continue to change through time based on the increasing diversity with decreasing cyanobacterial dominance in January 2011.
Numerous physico-chemical conditions varied considerably through the study period, with inflows resulting in increased turbidity, total phosphorus, filterable reactive silica and total nitrogen, whilst pH fell through time. Increased concentrations of nutrients discharged from the Lower Lakes into the Coorong, Murray Mouth and Encounter Bay were considered likely to result in elevated primary productivity, cascading through the food web and thus increasing secondary production (Aldridge & Brookes 2011).
The authors concluded that freshwater flows had the capacity to influence salinities and biotic assemblages further south-east of the southern-most site within the North Lagoon, even though sites did not extend beyond the top of the North Lagoon.
No statistical analyses were undertaken as a part of this interim report, and thus these conclusions were based on observations of raw data and trends.
Monitoring of zooplankton assemblages (Shiel 2011)
Monitoring was undertaken by Shiel (2011), with results and interpretations from unanalysed raw data summarized below.
Zooplankton was sampled by standard net haul and plankton trapping in open water across 11 sites in November 2010 and January 2011. Sites ranged from the Goolwa Barrage, the Murray Mouth, Mundoo Channel, Boundary Creek, and the western end of the North Lagoon as per the sampling sites of Aldridge and Brookes (2011). Shiel (2011) acknowledged that current sampling sites are
The effect of barrage releases on the biota of the Coorong and Murray Mouth: A synthesis Report prepared for DENR
Page 9 of 36
concentrated toward the western end of the North Lagoon, restricting possible conclusions about the influx of zooplankton further eastward.
A total of 90 taxa were recorded across five major groups, including Protista, Rotifera, Cladocera, Copepoda and Ostracoda. Only 9% of zooplankton taxa sampled to date were euryhaline, whilst the remaining 91% were freshwater taxa previously recorded and derived from upstream in the River Murray and Lower Lakes. Broken down into the respective groups, the majority of protists and rotifers recorded inhabited freshwater, while only a few comparatively less-abundant estuarine/marine protists were sampled. The Rotifera assemblage was predominantly characteristic of fresh waters with few exceptions. Cladocerans were notably sparse, and limited to freshwater habitat. Copepoda showed the most diverse range of salinity-tolerant species, with freshwater, as well as estuarine and halophilic, species (including one initially described from the Spencer Gulf) present. Small nektonic macroinvertebrates and fish fry were also incidentally recorded (Shiel 2011).
Differences observed in plankton densities and composition were attributed to disparate flows, where large freshwater inflows effectively flushed estuarine assemblages out to sea, and replaced them with freshwater assemblages resembling those observed upstream (Shiel 2011). These conclusions appear to have been based on the expert opinion of the author, as no sampling occurred upstream of the Goolwa Barrage.
Shiel (2011) concluded that the rapid change in the zooplankton assemblage across sampling dates is likely to have depended on disparate outflows, but these are likely to continue to stimulate secondary consumers.
Monitoring of fish assemblages (Ye et al. 2011)
The recent large barrage releases have allowed intervention monitoring of fish assemblages in the Murray Estuary and Coorong. The aims of the study were to determine whether current barrage releases were sufficient in volume to elicit any ecological response in recovery or recruitment response of estuarine fish of the Murray Mouth and Coorong following years of no barrage releases (Ye et al. 2011).
Sampling had been undertaken across eleven sites during November and December 2010, and February 2011, with sites located near the Murray Mouth, and in the North and South Lagoons. Sampling was undertaken with a seine net during the day and a composite gill net set overnight. Authors divided study sites into an estuary component (sites around the Murray Mouth), a North Lagoon component and a South Lagoon component.
A total of 24, 496 fish across 22 species were caught during November and December 2010, representing freshwater, diadromous, estuarine and marine fish. Three species accounted for over 87% of individuals: sandy sprat (Hyperlophus vittatus); smallmouth hardyhead (Atherinosoma microstoma); and redfin perch (Perca fluviatilis). The estuary accounted for over 80% of all fish sampled.
The authors used multivariate statistics to compare with fish assemblages from two previous drought years, including 2006 and 2007. In the Estuary and Northern Lagoon sub-regions, fish assemblages were significantly different between 2010 and the drought years 2006 and 2007, with

The effect of barrage releases on the biota of the Coorong and Murray Mouth: A synthesis Report prepared for DENR
Page 10 of 36
no significant difference between 2006 and 2007 for either region. The Southern Lagoon fish assemblages showed no significant difference among years.
Assemblage differences observed among sites during 2010 were associated with the abundance of sandy sprat and a number of other abundant freshwater species, including redfin perch, bony herring (Nematolosa erebi), Australian smelt (Retropinna spp.) and flatheaded gudgeon (Philypnodon grandiceps). There was an increase observed in abundance of several estuarine species compared to the two previous drought years, 2006 and 2007, including sandy sprat, Tamar goby (Afurcagobius tamarensis), smallmouth hardyhead, and greenback flounder (Rhombosolea tapirina). A southward extension in distribution of greenback flounder, black bream (Acanthopagrus butcheri) and yelloweye mullet (Aldrichetta forsteri) was interpreted by the authors as a potential indicator of recovery of estuarine species in the Coorong.
February data were not included in the interim report, and the authors noted that further analysis would be undertaken at a later date, including an assessment of length-frequency distributions.
Monitoring of fish assemblages (Wedderburn et al. 2011)
River hydrology (freshwater input) is the major ecological influence on river biodiversity (Wedderburn et al. 2011). The Lower Lakes and Coorong, due to their hydrology, have the highest diversity of fish throughout the Murray Darling Basin, including the presence of freshwater, estuarine, and diadromous fish. This study aimed to describe temporal changes in fish assemblages, the recruitment of estuarine and diadromous fish populations and whether fish species were able to complete their life cycle during and/or after barrage-flow releases (Wedderburn et al. 2011).
The authors used a set of double-winged and single-winged fyke nets set across six sites spread through Mundoo Channel and Boundary Creek. Nets were set overnight on three occasions; December (2010), January and February (2011). Species were identified, counted, and their total length measured. A total of 38, 055 fish representing 25 fish species were caught across the entire study. Fish numbers declined substantially over time, with 59% caught in the first sampling event, 28% in the second and 13% in the third.
The relative abundance and length-frequency distributions of five fish species, including congolli (diadromous), common galaxias (Galaxias maculatus - diadromous), smallmouth hardyhead (estuarine), greenback flounder (estuarine) and the Tamar river goby (estuarine) were included (see Wedderburn et al. 2011 for additional details).
The presence of young-of-the-year for two diadromous fish, congolli and common galaxias demonstrated breeding in the Coorong and Lower Lakes prior to 2010. Congolli were previously considered to be in decline during recent drought years (i.e. with movement inhibited by disconnection of the river and Coorong) but recent re-establishment of flows coincided with hatching and a young-of-the-year cohort was recorded (Wedderburn et al. 2011).
Several estuarine species showed early recruitment events, with two young-of-the-year cohorts recorded for the smallmouth hardyhead. Adults of two species, greenback and long-snouted (Ammotretis rostratus) flounders, became less abundant however, throughout the study period, with the authors attributing their absence to migration to other parts of the Coorong due to their

The effect of barrage releases on the biota of the Coorong and Murray Mouth: A synthesis Report prepared for DENR
Page 11 of 36
preference for higher salinities. Five estuarine gobies were present but by February the young-of-the-year cohort replaced adults. Adult fish may have moved back to the Coorong after recent freshwater inflow, following a previous incursion into the salinised Lower Lakes during the recent drought (Wedderburn et al. 2011).
Several freshwater species dominated the fish assemblage throughout the study, with the introduced redfin perch four times more abundant than any other species. Redfin perch numbers declined by February, when two native species, the flat-headed gudgeon and bony herring, became more abundant. Interestingly, bony herring was the only species to increase in abundance during the study (Wedderburn et al. 2011).
Whilst the fish assemblage sampled in the present study (Wedderburn et al. 2011) resembled those of previous drought years in the Lower Lakes, lower salinities may account for some absence for estuarine species (e.g. yelloweye mullet) due to potential migration elsewhere in the Coorong. Young-of-the-year of diadromous and small-bodied estuarine fish species still utilised local habitats (including Mundoo Channel and Boundary Creek).
The authors concluded that the early life stages of all fish species could have been missed due to the late commencement date of sampling (Wedderburn et al. 2011). No formal statistical analyses were undertaken in this interim report, with observations made upon raw data, with no formal comparison made to previous sampling events pre-flow.
Monitoring of bird assemblages (Paton 2011)
Significant rainfall returned large flows to the Murray-Darling Basin, flooding many key inland wetlands (e.g. Macquarie Marshes). Waterbirds using wetlands are likely to respond to flows such as these by dispersing into the highly-productive but short-lived ecosystems inland, or adjusting their distribution, abundance and behaviour to local changes in habitat or food availability. The study by Paton (2011) focused on changes in the abundance of birds within the Coorong relative to previous years, bird distributions near the barrages during different flow regimes, and bird performance (e.g. foraging effort and success rates) at different locations over time.
The author used a census (completed annually since January 2000) that systematically counted bird species, along with their associated activity, along a 113-km stretch from the southernmost point of the South Lagoon to the Goolwa Barrage.
The author based his observations in waterbird abundances (summarised below) on comparisons between the average number of birds observed between three time periods, 2000 to 2007 (eight years of declining flows), 2008 to 2010 (three years of drought) and 2011 (returning flows). This method is an informal assessment of the effect of different flows, but was not adjusted for inter-annual variability or differing numbers of years in the three time periods.
The author stated that, of fifteen predominantly fish-eating bird species, four, including hoary-headed (Poliocephalus poliocephalus) and great-crested (Podiceps cristatus) grebes, little pied cormorant (Phalacrocorax melanoleucos) and whiskered tern (Chlidonias hybridus), were notably absent in January 2011. The great egret (Ardea alba) and little egret (Egretta garzetta) continued to decline over each subsequent time period, whilst the common greenshank (Tringa nebularia) and

The effect of barrage releases on the biota of the Coorong and Murray Mouth: A synthesis Report prepared for DENR
Page 12 of 36
fairy tern (Sterna nereis) were substantially less abundant in later time periods when compared with previous years. Australian pelican (Pelecanus conspicillatus) and crested tern (Sterna bergii) populations were similar to previous years, possibly driven by their habit of feeding exclusively outside the Coorong, whilst the white-faced heron (Egretta novaehollandiae) maintained its population due to a history of foraging in adjacent habitats, according to the author. The author believed there was no overall increase in any predominantly fish-eating species in the Coorong associated with returning flows.
Of the largely non-piscivorous species, only three, pied oystercatcher (Haematopus longirostris), Australian shelduck (Tadorna tadornoides) and chestnut teal (Anas castanea), maintained the same average population number in January 2011 compared to previous years. Species that largely vacated the Coorong (or at least were in very low abundances compared to previous years) during January 2011 included grey teal (Anas gracilis), black swan (Cygnus atratus), musk duck (Biziura lobata), red-necked stint (Calidris ruficollis), sharp-tailed sandpiper (Calidris acuminata), curlew sandpiper (Calidris ferruginea), black-winged stilt (Himantopus himantopus), red-necked avocet (Recurvirostra novaehollandiae) and red-capped plover (Charadrius ruficapillus). Only two species were dominant in the Coorong during January 2011, banded stilt (Cladorhynchus leucocephalus) and silver gull (Larus novaehollandiae).
The author reported anecdotal evidence that extremely high water levels in the Coorong during January 2011 covered much of the surrounding mudflats, samphire (Sarcocornia spp.) habitat and terrestrial vegetation, potentially preventing most species from accessing foraging areas, whilst increased turbidity of the incoming freshwater may have disrupted visual foraging. Data on these abiotic (salinity, water levels and turbidity) and biotic (the distribution and abundance of available food) variables were not collected in this study, so the author was unable to corroborate the findings.
The author also suggested another possible explanation that some species may have dispersed to inland or distant wetlands.
The author concluded by stating that the bird assemblage response to freshwater releases is likely ongoing, and not limited to the first initial release.
Data from this study were not provided, and so have not been included in the analyses presented later in this report.

The effect of barrage releases on the biota of the Coorong and Murray Mouth: A synthesis Report prepared for DENR
Page 13 of 36
Methods for the synthetic analysis
Detailed methods are presented here for the analyses undertaken to synthesise the individual (taxonomic) data sets. Please refer to the individual reports (Aldridge & Brookes 2011; Dittmann et al. 2011; Ye et al. 2011; Shiel 2011) of each taxonomic group for collection and processing methods. Any analyses or descriptions of raw data regarding patterns of responses for each individual taxonomic group undertaken can also be found in the reports cited above.
Three syntheses of data (Table 1) were constructed to maximise the number of taxonomic groups and associated sites within each analysis to compare patterns that may exist across different taxonomic groups. Data were available over a six month period between November 2010 and April 2011 since significant freshwater flows returned to the Coorong. Synthesis 1 utilised all taxonomic assemblages, including macroinvertebrates, fish, phytoplankton and zooplankton across only four sites: downstream of Goolwa Barrage; Boundary Creek; Tauwitchere; and Mark Point (Figure 1). Synthesis 2 excluded fish (retaining macroinvertebrates, zooplankton and phytoplankton) based on reduced site alignment, allowing the comparison of patterns across eight sites, including halfway between the Goolwa Barrage and the Murray Mouth (‘Half Way’), Sugars Beach, Hunters Creek, and Ewe Island (Figure 1), in addition to the four sites included in Synthesis 1. Synthesis 3 looked at patterns across phytoplankton and zooplankton assemblages across all previously mentioned sites, with the addition of Mundoo Channel, Southern Ocean, and the Murray Mouth (Figure 1). In each of the three Syntheses, three time periods were represented. Time period 1 consisted of sampling during November and December 2010, time period 2 included January and February 2011, and time period 3 covered March and April 2011.
Table 1: Summary of each synthesis of the data chosen to maximise the number of taxonomic groups utilised to compare patterns that may exist across the three sampling time periods. X = included in a particular analysis; a blank indicates it was not.
Synthesis 1 Synthesis 2 Synthesis 3 Phytoplankton (Aldridge & Brookes 2011) X X X Zooplankton (Shiel 2011) X X X Macroinvertebrates (Dittmann et al. 2011) X X Fish (Ye et al. 2011) X Maximum number of sites available 4 8 11

The effect of barrage releases on the biota of the Coorong and Murray Mouth: A synthesis Report prepared for DENR
Page 14 of 36
Figure 1: A map of the study region. Black dots show the location of the eleven monitoring sites (left to right, Goolwa Barrage, Half Way, Southern Ocean, Sugars Beach, Murray Mouth, Hunters Creek, Mundoo Channel, Boundary Creek, Ewe Island, Tauwitchere and Mark Point), black lines (from left to right, respectively) represent the Goolwa, Mundoo, Ewe Island and Tauwitchere Barrages. Sites do not represent exact sampling locations for each taxonomic group. (Map adapted from Aldridge & Brookes 2011).
In order to achieve the analysis of each subset, aliasing of data via averaging was necessary in some instances, in order to include data collected on slightly different dates or at similar locations. Such aliasing has the potential to add an additional source of variation.
Two specialist groups (Ye et al. 2011; Wedderburn et al. 2011) sampled estuarine fish assemblages in the Coorong over the same period. Data collected by Wedderburn et al. (2011) were not used in the construction of Synthesis 1, because their samples covered Mundoo Channel and Boundary Creek only. Whilst sampling by Ye et al. (2011) did not include Mundoo Channel, the study was conducted over a broader spatial scale. Aliasing the two fish studies (which used different methods and sampling effort) would have required true relative abundance (CPUE) data to be transformed into less-informative presence/absence data, reducing the information content compared to other assemblages. Thus, only data from Ye et al. (2011) were included in these analyses. Bird data were not supplied and have therefore not been included in any subset (Table 1).
The effect of location (11 sites in total, although not represented for each assemblage) and time (three time periods, 1 included sampling from November and December, time period 2 included all sampling from January and February and time period 3 included sampling undertaken in March and April) was assessed using PERMANOVA (Anderson et al. 2008). PERMDISP was used to test homogeneity of multivariate dispersion, as the distance of observations from the group centroid (Clarke & Gorley 2006).

The effect of barrage releases on the biota of the Coorong and Murray Mouth: A synthesis Report prepared for DENR
Page 15 of 36
Graphical representations of differences were constructed using non-metric multidimensional scaling (MDS ordination plots). MDS plots were based on Bray-Curtis similarity coefficient matrices of appropriately-transformed abundance data using 25 restarts.
Water quality data used throughout the following analyses of environmental variables was obtained from Aldridge & Brookes (2011). Although spot-measured, these data covered broader spatial and temporal scales compared to the limited data available through the Department of Water (2011) website.
Principal component analysis (PCA) with VARIMAX rotation was used (using SYSTAT v.13) as a data-reduction technique (Norman & Streiner 1998) to reduce the 16 environmental water-quality variables. Based on their correlation structure, the software sorted highly-correlated raw variables into fewer but uncorrelated principal components (retaining only those with eigenvalues > 1). This allowed the interpretation of each principal component by the loading of their constituent variables (Norman & Streiner 1998; SYSTAT 2004). Four principal components were thus retained and the scores from those were used as independent variables in the BEST analysis.
BEST analyses (Clarke & Gorley 2006) were undertaken to compare each individual taxonomic group with the available environmental data, to identify which combination of variables was most highly correlated with the multivariate patterns observed in the biotic data.
Patterns in the response of each taxonomic group to the response of other groups were investigated using the RELATE routine in the PRIMER software package (Clarke & Gorley 2006).
All analyses were undertaken using PRIMER v.6.0 with the PERMANOVA+ add-on (Clarke and Gorley 2006; Anderson et al. 2008) or SYSTAT v.13 (SYSTAT 2004).

The effect of barrage releases on the biota of the Coorong and Murray Mouth: A synthesis Report prepared for DENR
Page 16 of 36
Results Meaningful synthesis of information across different combinations of taxonomic groups was achievable thanks to the spatial and temporal overlap amongst data sets. Data still had to be aliased across space (some nearby sites combined via avergaing) and across time (similar times combined), in order to maximise the data available. We therefore present findings from each individual taxonomic group and three separate syntheses (Table 1).
Assessing the effect of site and time on individual biotic assemblages
When investigating macroinvertebrates individually, timeframe was not a significant factor (pseudo-F = 1.70, P = 0.1171) but site was (pseudo-F = 2.13, P = 0.0039). This is illustrated in the MDS plots, where sites tended to group together more so than different times (Figures 2 & 3). This means macroinvertebrate assemblages showed substantial site-to-site variability, but that assemblages remained similar through time. There was no significant difference in the dispersion of samples between times (F = 3.35, P = 0.083) or among sites (F = 1.61, P = 0.86).
Figure 2: An MDS ordination plot showing the differences in assemblage composition for macroinvertebrates at three time periods. Each point represents a single sample (i.e. a single site per sampling event) (n = 23). The distance between points represents the relative dissimilarity of the assemblage composition between samples. A 2-D stress value of 0.17 indicates that the plot is a reasonable two-dimensional representation of the multi-dimensional raw data. The plot was based on a Bray-Curtis similarity matrix of log(x+1)-transformed abundance data.
TimeframeTime 1Time 2Time 3
2D Stress: 0.17
The effect of barrage releases on the biota of the Coorong and Murray Mouth: A synthesis Report prepared for DENR
Page 17 of 36
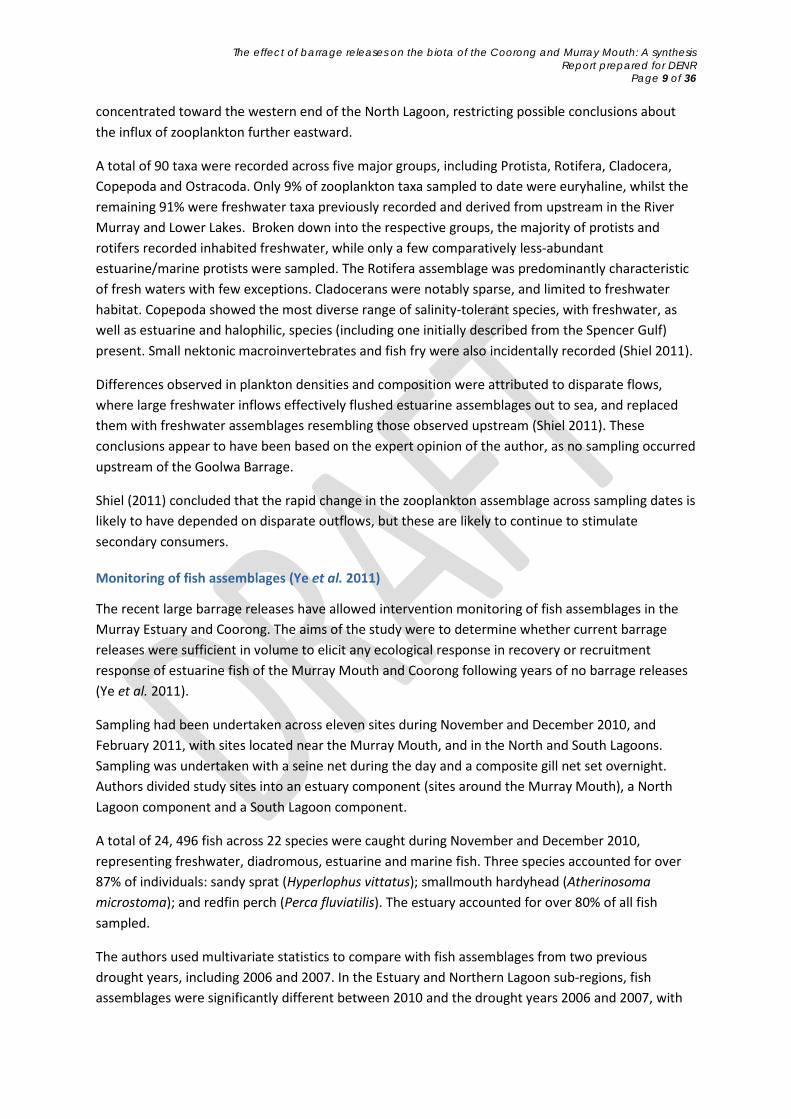
Figure 3: The same MDS plot as shown in Figure 2, with the symbols altered to illustrate site-to-site differences rather than temporal differences.
Phytoplankton assemblages were best explained by the factor of time (pseudo-F = 29.631, P = 0.0001), as evident by the clear separation of points into the three time periods in the MDS plot (Figure 4). Phytoplankton assemblages were not, however, significantly different across sites (pseudo-F = 1.253, P = 0.0967). No significant difference in dispersion was found for either time or site (F = 1.6146, P = 0.3397 and F = 0.5228, P = 0.8527, respectively).
SiteBoundary CreekGoolwa BarrageTauwitchereMark PointHalf WaySugars BeachHunters CreekEwe Island
2D Stress: 0.17
The effect of barrage releases on the biota of the Coorong and Murray Mouth: A synthesis Report prepared for DENR
Page 18 of 36
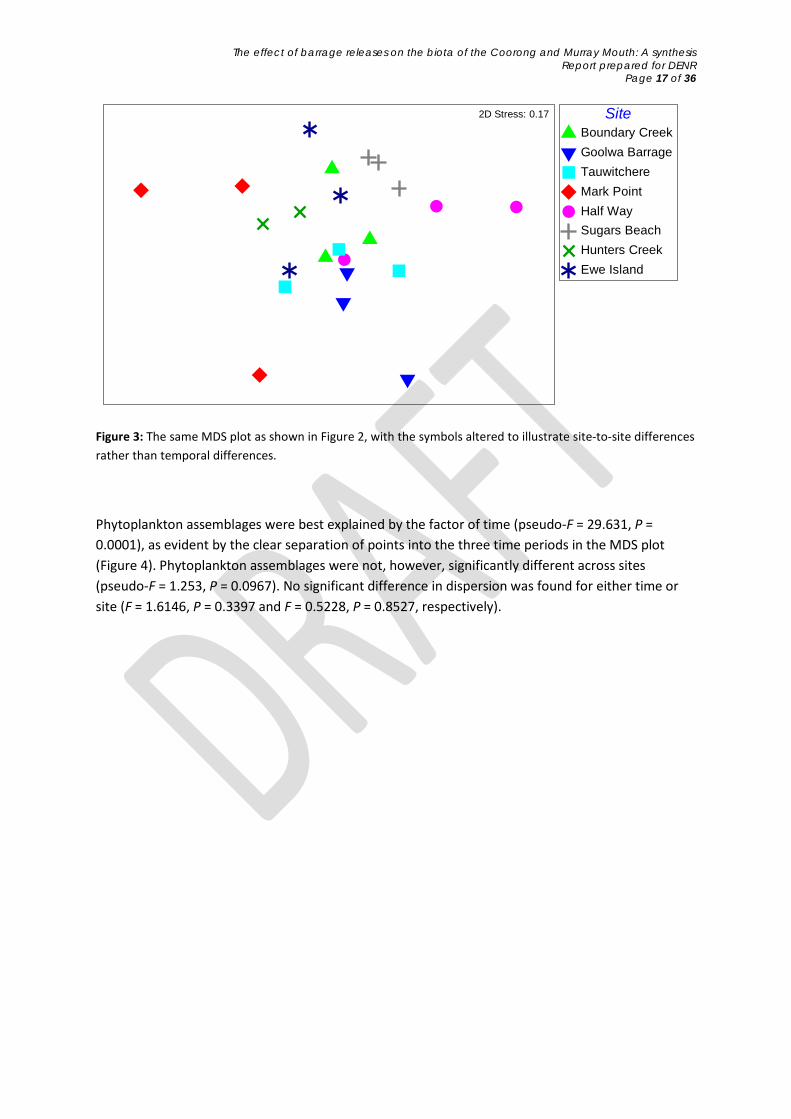
Figure 4: An MDS plot showing the difference in assemblage composition for phytoplankton at three time periods. Each point represents a single sample (i.e. a single site per sampling event) (n = 33). The distance between points represents the relative dissimilarity of the assemblage composition between samples. A 2-D stress value of 0.1 indicates that the plot is a good two-dimensional representation of the multi-dimensional data. The plot was based on a Bray-Curtis similarity matrix of fourth-root transformed abundance data.
As with phytoplankton, time was a strong factor explaining zooplankton assemblages (pseudo-F = 13.096, P = 0.0001), and groups associated with sampling time were clearly observed in the MDS plot (Figure 5). Unlike phytoplankton, however, site also helped explain differences in zooplankton assemblages (pseudo-F = 1.67, P = 0.0011, Figure 6). No significant difference in the level of dispersion among samples was found for either time or site (F = 0.80, P = 0.6623 and F = 0.83, P = 0.8688, respectively).
TimeframeTime 1Time 2Time 3
2D Stress: 0.1

The effect of barrage releases on the biota of the Coorong and Murray Mouth: A synthesis Report prepared for DENR
Page 19 of 36
Figure 5: An MDS plot showing the difference in assemblage composition for zooplankton at three time periods. Each point represents a single sample (i.e. a single site per sampling event) (n = 33). The distance between points represents the relative dissimilarity of the assemblage composition between samples. A 2-D stress value of 0.12 indicates that the plot is a good two-dimensional representation of the multi-dimensional data. The plot was based on a Bray-Curtis similarity matrix of square-root transformed abundance data.
Figure 6: The same MDS plot shown in Figure 5, with the symbols altered to illustrate site-to-site differences rather than temporal differences.
The fish assemblage, with relatively few samples, did not show significant differences over either site (pseudo-F = 1.11, P = 0.3979) or timeframe (pseudo-F = 0.3962, P = 0.3962) (Figure 7). Fish samples did not show significant differences in the level of dispersion across sites (F = 6.49, P = 0.474). There
TimeframeTime 1Time 2Time 3
2D Stress: 0.12
SiteBoundary CreekGoolwa BarrageTauwitchereMark PointHalf WaySugars BeachHunters CreekEwe IslandMundoo ChannelSouthern OceanMurray Mouth
2D Stress: 0.12

The effect of barrage releases on the biota of the Coorong and Murray Mouth: A synthesis Report prepared for DENR
Page 20 of 36
was, however, a significant difference in the dispersion of samples among times (F = 13.212, P = 0.0203), where the degree of difference among samples increased through time.
Figure 7: An MDS plot showing the difference in assemblage composition for fish at three time periods. Each point represents a single sample (i.e. a single site per sampling event) (n = 10). The distance between points represents the relative dissimilarity of the assemblage composition between samples. A 2-D stress value of 0.04 indicates that the plot is a very good two-dimensional representation of the multi-dimensional data. The plot was based on a Bray-Curtis similarity matrix of square-root transformed abundance data.
Assessing the effect of site and time on each of the synthetic data sets
Synthesis 1 contained macroinvertebrates, phytoplankton, zooplankton and fish. The time of sampling explained a significant proportion of the patterns observed among assemblages in Synthesis 1 (pseudo-F = 5.7891, P = 0.0065), with patterns between times easily observed in Figure 8. Time of sampling accounted for four times the variability associated with site, and site was not a statistically-significant factor, but there were large differences in the dispersion of samples within each site (PERMDISP; F = 11.694, P = 0.0483). Dispersion did not differ significantly with time (F = 4.4249, P = 0.1441)
TimeframeTime 1Time 2Time 3
2D Stress: 0.04

The effect of barrage releases on the biota of the Coorong and Murray Mouth: A synthesis Report prepared for DENR
Page 21 of 36
Figure 8: An MDS plot showing the difference in assemblage composition for combined Synthesis 1, containing macroinvertebrates, phytoplankton, zooplankton and fish from four sites at three time periods. Each point represents a single sample (i.e. a single site per sampling event) (n = 10). The distance between points represents the relative dissimilarity of the assemblage composition between samples. A 2-D stress value of 0.06 indicates that the plot is a very good two-dimensional representation of the multi-dimensional data. The plot was based on a Bray-Curtis similarity matrix of log (X+1)-transformed abundance data.
Synthesis 2 combined macroinvertebrates, phytoplankton and zooplankton. Whilst this synthesis did contain more replicate sampling events (n = 23 compared to Synthesis 1 with a total of n = 10), the findings were consistent with Synthesis 1, with time still being the strongest factor (pseudo-F = 18.878, P = 0.0001), explaining almost four times the observed variation compared with site, which was not a significant factor (pseudo-F = 1.5377, P = 0.0871) (Figure 9). For this synthesis, there was no significant difference in dispersion, either within sites or within times.
Synthesis 3 combined phytoplankton and zooplankton, which had the greatest sampling overlap of any combination of biotic groups. The inclusion of 10 more replicates did not change the results, which were similar to Synthesis 2. Time was still the only factor to significantly explain the observed variation in Synthesis 3 (pseudo-F = 35.217, P = 0.0001), as patterns show in Figure 10. Site-to-site variability was relatively small and non-significant (pseudo-F = 1.4243, P = 0.0814). Again, there were no significant differences in the dispersion across sample sites, but samples from different times showed significantly-different dispersions (F = 4.3545, P = 0.0417), with the degree of difference among samples increasing through time (e.g. samples from Time 3 were more variable than samples from Time 1).
TimeframeTime 1Time 2Time 3
2D Stress: 0.06

The effect of barrage releases on the biota of the Coorong and Murray Mouth: A synthesis Report prepared for DENR
Page 22 of 36
Figure 9: An MDS plot showing the difference in assemblage composition for combined Synthesis 2, containing macroinvertebrates, phytoplankton, and zooplankton at three time periods. Each point represents a single sample (i.e. a single site per sampling event) (n = 23). The distance between points represents the relative dissimilarity of the assemblage composition between samples. A 2-D stress value of 0.07 indicates that the plot is a very good two-dimensional representation of the multi-dimensional data. The plot was based on a Bray-Curtis similarity matrix of log (X+1)-transformed abundance data.
Figure 10: An MDS plot showing the difference in assemblage composition for combined Synthesis 3, containing phytoplankton and zooplankton at three time periods. Each point represents a single sample (i.e. a single site per sampling event) (n = 33). The distance between points represents the relative dissimilarity of the assemblage composition between samples. A 2-D stress value of 0.08 indicates that the plot is a very good two-dimensional representation of the multi-dimensional data. The plot was based on a Bray-Curtis similarity matrix of log (X+1)-transformed abundance data.
TimeframeTime 1Time 2Time 3
2D Stress: 0.07
TimeframeTime 1Time 2Time 3
2D Stress: 0.08

The effect of barrage releases on the biota of the Coorong and Murray Mouth: A synthesis Report prepared for DENR
Page 23 of 36
Relating environmental conditions to observed biotic patterns
A principal components analysis (PCA) was conducted on the available physico-chemical data in order to identify separate groups of factors that may have influenced biotic assemblages. PCA combines sets of individual variables into axes that represent combinations of those variables that act independently from one another (i.e. are orthogonal). We identified four principal components (PCs termed ‘syndromes’ here) acting within the physico-chemical data for the release of freshwater through the barrages (Table 2). The first syndrome (Syndrome 1) was highly correlated with temperature, turbidity, chlorophyll a, TKN (a measure of organic nitrogen), total nitrogen and total phosphorus. This may be explained as a river flow and nutrient effect. Syndrome 2 may have been related to a first flush of acidity and nutrient release, with positive correlations with filterable reactive phosphorus and reactive silica, and negative correlations with pH, and ammonia and oxidised nitrogen. Syndrome 3 was positively correlated with dissolved oxygen and negatively correlated with specific electrical conductivity (explained as an effect of dissolved oxygen and freshwater flows), while Syndrome 4 was only correlated with water depth. It should be noted that the explanations of the various syndromes require additional testing by chemical experts and should be considered preliminary at this stage, although the PCs themselves (that is the combination of individual variables) are more robust.

The effect of barrage releases on the biota of the Coorong and Murray Mouth: A synthesis Report prepared for DENR
Page 24 of 36
Table 2: Results of a PCA analysis, separating 16 independent environmental variables into four principal components. Results are indicated by a positive or negative symbol, depending on the direction of the correlation, where the correlation was strongest (i.e. a rotated loading > 0.7) across all principal components. Raw data were collected by Aldridge & Brookes (2011) and Department of Water (2011).
Each biotic assemblage was analysed separately with the physico-chemical data (using four PC scores from the results of the PCA analysis above) to determine whether any of the identified syndromes could account for patterns observed in that biotic dataset.
Macroinvertebrates were best correlated with Syndromes 2 (acid and other nutrients, Figure 11) and 3 (dissolved oxygen and freshwater, Figure 12), but these results were not statistically significant (rho = 0.42, P > 0.05), as is evident by the lack of similar macroinvertebrate samples (i.e. those close together) having similar principal component scores (i.e. bubbles of similar size) for either Syndrome 2 (Figure 11) or Syndrome 3 (Figure 12) (i.e. so there is no clustering of bubbles of similar sizes and no obvious gradient). Results may have been more conclusive with an increased sample size (which in this case was relatively small, n = 18).
Principal Component (Syndrome)
Syndrome 1 Syndrome 2 Syndrome 3 Syndrome 4
Interpretation based on rotated loadings
Nutrients & river flows
Acid & other nutrients
Dissolved oxygen &
fresh water
Depth
Raw variables Eigenvalue 6.45 3.90 2.43 1.16 Water depth + Temperature + Specific electrical conductivity - pH - Dissolved oxygen + Dissolved oxygen (as a %) + Turbidity + Chlorophyll a + Ammonia nitrogen - Oxidised nitrogen - Total Kjeldahl nitrogen (TKN) + Total nitrogen + Filterable reactive phosphorus + Total phosphorus + Reactive silica + Water level -

The effect of barrage releases on the biota of the Coorong and Murray Mouth: A synthesis Report prepared for DENR
Page 25 of 36
Figure 11: An MDS bubble plot of macroinvertebrates (n = 18) with superimposed circles representing Syndrome 2 Principal Component scores. The size of the circle indicates the Principal Component scores for Syndrome 2 for that sample. Some circles overlap where samples are similar. Larger circles indicate stronger positive values for that syndrome while smaller circles indicate stronger negative values for that syndrome. Note the correlation between macroinvertebrate assemblages and Syndrome 2 was not significant. This plot is the same as in Figure 2, but shows the values of the PC score associated with Syndrome 2 as the size of the bubble.
Figure 12: An MDS bubble plot of macroinvertebrates (n = 18) with superimposed circles representing Syndrome 3 Principal Component scores. The size of the circle indicates the Principal Component scores for Syndrome 3 for that sample. Some circles overlap where samples are similar. Larger circles indicate stronger positive values for that syndrome while smaller circles indicate stronger negative values for that syndrome. Note the correlation between macroinvertebrate assemblages and Syndrome 3 was not significant. This plot is the same as in Figure 2, but shows the values of the PC score associated with Syndrome 3 as the size of the bubble.
Syndrome 2
-1.6
-0.4
0.8
2
2D Stress: 0.16
Syndrome 3
-2.5
-1
0.5
2
2D Stress: 0.16

The effect of barrage releases on the biota of the Coorong and Murray Mouth: A synthesis Report prepared for DENR
Page 26 of 36
Phytoplankton responded best to both Syndromes 2 and 3, indicating a response to dropping salinity, acidity, dissolved oxygen concentrations and freshwater flows, illustrated in Figures 13 and 14 by the grouping of samples that had similar conditions for those two syndromes, respectively. This correlation (rho = 0.58, P < 0.05) was statistically significant.
Figure 13: An MDS bubble plot of phytoplankton (n = 21) with superimposed circles representing Syndrome 2 Principal Component scores. The size of the circle indicates the Principal Component scores for Syndrome 2 for that sample. Some circles overlap where samples are similar. Larger circles indicate stronger positive values for that syndrome while smaller circles indicate stronger negative values for that syndrome. This plot is the same as in Figure 4, but shows the values of the PC score associated with Syndrome 2 as the size of the bubble.
Syndrome 2
-1.6
-0.4
0.8
2
2D Stress: 0.09

The effect of barrage releases on the biota of the Coorong and Murray Mouth: A synthesis Report prepared for DENR
Page 27 of 36
Figure 14: An MDS bubble plot of phytoplankton (n = 21) with superimposed circles representing Syndrome 3 Principal Component scores. The size of the circle indicates the Principal Component scores for Syndrome 3 for that sample. Some circles overlap where samples are similar. Larger circles indicate stronger positive values for that syndrome while smaller circles indicate stronger negative values for that syndrome. This plot is the same as in Figure 4, but shows the values of PC score associated with Syndrome 3 as the size of the bubble.
Zooplankton showed the greatest statistically-significant correlation (rho =0.60, P < 0.05) with Syndrome 2, indicating that acid and other nutrients have either influenced the zooplankton assemblage, or that both are responding to similar factors (i.e. not captured by this analysis). Figure 15 illustrates the relationship between zooplankton assemblages and Syndrome 2, where tightly grouped (and therefore similar) zooplankton samples had similar conditions, as evident by the grouping of bubbles of similar sizes.
Syndrome 3
-2.5
-1
0.5
2
2D Stress: 0.09

The effect of barrage releases on the biota of the Coorong and Murray Mouth: A synthesis Report prepared for DENR
Page 28 of 36
Figure 15: An MDS bubble plot of zooplankton (n = 21) with superimposed circles representing Syndrome 2 Principal Component scores. The size of the circle indicates the Principal Component scores for Syndrome 2 for that sample. Some circles overlap where samples are similar. Larger circles indicate stronger positive values for that syndrome while smaller circles indicate stronger negative values for that syndrome. This plot is the same as in Figure 5, but shows the values of the best-correlated PC score as the size of the bubble.
Patterns in fish assemblages were best explained by a combination of Syndromes 1, 2 and 3 (refer to Table 3) but these results were not statistically significant (rho = 0.29, P > 0.05), with any inferences potentially limited by a small sample size (n = 10). Syndrome 2 was the best individually-correlated syndrome with fish assemblages, so has been illustrated in Figure 16, where the weak relationship between syndrome 2 and patterns in the fish assemblage is evident by a lack of grouping of bubbles of similar sizes.
Syndrome 2
-1.6
-0.4
0.8
2
2D Stress: 0.09

The effect of barrage releases on the biota of the Coorong and Murray Mouth: A synthesis Report prepared for DENR
Page 29 of 36
Figure 16: An MDS bubble plot of fish (n = 10) with superimposed circles representing Syndrome 2 Principal Component scores. The size of the circle indicates the Principal Component scores for Syndrome 2 for that sample. Some circles overlap where samples are similar. Larger circles indicate stronger positive values for that syndrome while smaller circles indicate stronger negative values for that syndrome. Note the correlation between fish assemblages and Syndrome 2 was not significant. This plot is the same as in Figure 7, but shows the values of the best-correlated PC score as the size of the bubble.
Table 3 summarises the results of the above analyses relating syndromes to individual taxonomic groups. Only zooplankton and phytoplankton were strongly correlated, with a combination of Syndrome 2 and 3.
Table 3: Results of BEST analyses of associations among four principal components (Syndromes) and each taxonomic group, showing the strongest correlated syndrome accounting for patterns observed in that dataset. Syndrome 1 was related to nutrients and river flows, syndrome 2 related to acid & other nutrients and syndrome 3 was related to dissolved oxygen and fresh water. Syndrome 4 was related to water depth, but is not correlated with any biotic assemblage. The rho value, P-value and total sample size is shown. Significant values are shown in bold.
Taxa Strongest correlated
syndrome rho value P-value Sample size
Macroinvertebrates Syndrome 2 0.42 > 0.05 18
Phytoplankton Syndrome 2 & 3 0.58 < 0.05 21
Zooplankton Syndromes 2 0.60 < 0.05 21
Fish Syndromes 1, 2 & 3 0.29 > 0.05 10
Syndrome 2
-1.6
-0.4
0.8
2
2D Stress: 0.04

The effect of barrage releases on the biota of the Coorong and Murray Mouth: A synthesis Report prepared for DENR
Page 30 of 36
Relating biotic responses to the response for other taxonomic groups
Combinations of taxonomic groups (limited to those which could be considered justified based on likely ecological links) were investigated together using the RELATE function in PRIMER (Clarke & Gorley 2006) to determine whether patterns in one assemblage were correlated with those in the other.
No statistically-significant relationship was detected between patterns in fish and macroinvertebrate assemblages (rho = -0.043, P = 0.521), or between macroinvertebrates and phytoplankton assemblages (rho = 0.047, P = 0.302). A lack of any relationship using RELATE suggests that these assemblages were responding to different ecological or environmental cues from one another, and were not directly influencing the other assemblage.
Macroinvertebrates, on the other hand, did show a statistically-significant relationship with zooplankton assemblages (rho = 0.287, P = 0.0048), suggesting that macroinvertebrates could possibly be related to the density of zooplankton, which is a potential prey source for certain filter-feeding macroinvertebrates. However, both macroinvertebrates and zooplankton were most-strongly associated with Syndrome 2 (although neither was statistically significant and macroinvertebrates also responded to Syndrome 3). This suggests that both groups may be responding to similar environmental cues.
Patterns in fish assemblages were also significantly correlated with those in phytoplankton assemblages (rho = 0.373, P = 0.001). This relationship may either be a result of responses of lower trophic-level organisms such as phytoplankton being influenced through food web interactions with fish assemblages (Vanni & Layne 1997), or because both assemblages were responding to a similar mix of environmental cues (i.e. both were correlated with Syndromes 2 & 3, although fish also were also correlated with Syndrome 1). Patterns in fish assemblages were not correlated with those in zooplankton assemblages (rho = 0.108, P = 0.22).
Patterns in phytoplankton and zooplankton assemblages showed the strongest statistically-significant correlation (rho = 0.438, P = 0.0001), which may be caused by zooplankton densities being directly influenced by the abundance of their prey source, phytoplankton (and/or vice versa, due to predation pressures) or because both were responding to similar environmental cues (i.e. both were significantly correlated with Syndrome 2, although phytoplankton was also correlated with Syndrome 3).

The effect of barrage releases on the biota of the Coorong and Murray Mouth: A synthesis Report prepared for DENR
Page 31 of 36
Discussion Here we investigated the response of four taxonomic groups (including macroinvertebrates, phytoplankton, zooplankton and fish) and various combinations of those groups (via data syntheses, see Table 1) to returning barrage flows six months after the first significant Murray River flows to go over the barrages since 2007.
Time was the major factor identified as explaining both specific (individual taxa) and ecosystem-level (synthetic) variation, which is unsurprising considering the large and rapid changes that the first fresh water to run over the barrages in four years would be likely to have on the prevailing habitat, even though the first releases were not captured by the sampling undertaken here. Of the individual taxonomic groups, macroinvertebrates and phytoplankton were explained solely by the factor time, but zooplankton was explained by site as well as time, and the fish assemblage was structured by neither. Syntheses had mixed results, with site and time explaining syntheses 1 (a site-limited combination of all taxonomic groups) and 3 (phytoplankton and zooplankton), respectively, whilst synthesis 2 (phytoplankton, zooplankton and macroinvertebrates) was explained by neither.
Significant differences in multivariate dispersion between samples did not occur for any individual assemblage other than fish, which saw an increase in the variability between samples through time. Synthesis 3 (which did not contain the fish assemblage, but rather was the combination of zooplankton and phytoplankton) showed the same increase in difference between time samples. Synthesis 1 (containing all taxonomic groups) had significant differences in dispersion between sites. It is interesting to consider the significant dispersion amongst samples in those two syntheses, which was not evident when analysing the individual datasets which contributed to the synthesis. This increased dispersion may need to be taken into consideration in the future when combining datasets.
Although the factor time best explained the taxon-specific and ecosystem-level variation observed above, the effect of the barrage release cannot be untangled from any possible natural intra-annual changes, or what may have occurred in the absence of flow. This is due to the lack of sampling conducted before the start of the release and also from control sites (i.e. those unaffected by barrage flows, should there be any) for comparison. Nonetheless, these data can be used to formulate hypotheses of the effects of returning barrage flows or act as a baseline for testing future returns to flow, but our conclusions cannot directly attribute any observed patterns to the barrage flows.
Considering the scale of the study (where sites were spread over 20 km along an inverse estuary, see Figure 1), it was surprising to see a lack of site-to-site variability. The factor of site was found to explain only the structure of zooplankton assemblages. This could indicate that the sheer volume of flow spreading throughout the region caused the lack of any important environmental gradient or variability across the 20 km that were sampled. Sites further south, which may have been under different environmental conditions, would have perhaps shown a difference, but these were not sampled. In September and October of 2003, a managed barrage release of 300 GL freshened the Murray Mouth region and spread into the North Lagoon, intruding as far as Long Point (Geddes 2005). It is therefore assumed the 9300 GL of freshwater released between November 2010 and May 2011 (with ongoing flows from that date) would have penetrated further into the North and

The effect of barrage releases on the biota of the Coorong and Murray Mouth: A synthesis Report prepared for DENR
Page 32 of 36
possibly South Lagoons of the Coorong. The southernmost site sampled during this study was Mark Point, approximately 10 km north of Long Point. Thus, the scale of the sampling may not have been sufficient to capture the full scale of influence of the barrage releases, and additional sampling of the southern end of the North Lagoon and into the South Lagoon may have been needed to see any effect of sites. The difference in the expected and actual volumes to pass through the barrages, where much greater volumes were available than anticipated during the design of the monitoring program, may not have caused this problem, but certainly exacerbated it.
Four syndromes were identified using the available environmental data. Of these, only Syndromes 2 and 3 were significantly correlated with phytoplankton and zooplankton. No other combination of syndrome and biotic data set was significantly correlated. Syndrome 2 was correlated with both phytoplankton and zooplankton assemblages (when analysed individually), whilst Syndrome 3 was correlated with phytoplankton only. Our suggested explanation for each syndrome should be further tested with water chemical experts, but it appeared that variables associated with nutrients and water flow explained the majority of variability in the environmental data set, yet it is interesting to note, based on these explanations, that no assemblage was correlated with river flow per se (Syndrome 1) or depth (Syndrome 4). Macroinvertebrate and fish assemblage structure were not correlated with any of the identified syndromes. The limited database of environmental variables could have restricted correlations driving assemblage structure, as only spot measurements of environmental variables were taken at scales spatially and temporally meaningful to this analysis. These limited correlations would seem to suggest, somewhat unexpectedly, that structure in taxon-specific and ecosystem-level interactions were not correlated with these barrage releases themselves (in contrast to previous results) but were correlated with other effects of fresh water (e.g. changes to water quality represented by Syndromes 2 & 3).
The managed release of 300 GL of fresh water into the Murray Mouth and North Lagoon in September-October 2003 had limited spatial and temporal influence on the salinity in the Coorong (Geddes 2005). Geddes (2005) noted the presence of freshwater communities (including phytoplankton and zooplankton washed into the Coorong from Lake Alexandrina) was short-lived, and did not continue long after barrage closure. The most interesting comparison between the findings reported here and Geddes (2005) is, regardless of the size of each barrage release (300 GL compared to 9300 GL, respectively) and the time frame over which each occurred (two months compared to six months), the fish assemblage structure appeared unaffected by either barrage release event. It is important to note that, the freshwater release of 2003 infiltrated to Long Point, approximately 10 km south of the lowest sampling point in our study, Mark Point. With a large disparity in flow volumes, it is presumed the 9300 GL that were actually released to the end of the sampling period would travel further into the Coorong, again indicating the need to increase spatial coverage of sampling over the entire length of the Coorong.
When investigating relationships between pairs of assemblages, several key relationships were identified. Fish were correlated with phytoplankton, and macroinvertebrates were correlated with zooplankton. These relationships could represent links in the trophic web. In this instance, a lower trophic-level organism (such as phytoplankton or zooplankton) may be influenced by the predation pressure of a higher trophic-level organism (such as fish; Vanni & Layne 1997). Predation pressure is the influence exerted from the feeding of one animal population (in this instance, fish) on the

The effect of barrage releases on the biota of the Coorong and Murray Mouth: A synthesis Report prepared for DENR
Page 33 of 36
population structure (including the diversity and abundance) of another (i.e. potentially indirectly in this instance, where the presence of fish may have reduced herbivory on phytoplankton, for example). Conversely, so-called ‘bottom-up’ control is also possible whereby the availability of a prey item (e.g. zooplankton) may limit the diversity and abundance of a predator population (e.g. fish). Either explanation is somewhat speculative, however, because both assemblages could also be responding separately to the same environmental cues, as might have been the case for the positive association observed between phytoplankton and zooplankton, whose structures both correlate with Syndrome 2 (although this does not preclude biotic interaction also).
Consistent and overlapping monitoring designs implemented by each expert group (Aldridge & Brookes 2011; Dittmann et al. 2011; Ye et al. 2011; Shiel 2011) helped provide the basis for our synthetic statistical analyses, with good spatial overlap of sites and temporal replication leading to reasonable statistical power throughout the analyses. In hindsight, it was unfortunate that a ‘before flow’ timeframe and control sites could not have been sampled also, which would have made a BACI (Before-After, Control-Impact) assessment possible. A BACI design determines if any perceived changes are due to an intervention or impact (in this instance a barrage release) at a particular time and place, by contrasting data from before versus after and control versus impact sites (Downes et al. 2002; Anderson 2009). In this instance, a BACI design would have allowed us to untangle intra-annual changes and what may have occurred in the absence of flow from the effect of the barrage release itself. Furthermore, the initial response of biota to the first release of freshwater over the barrages in winter 2010 was missed due to a late start in monitoring. Initial sampling occurred in November and December 2010 (continuing into early 2011), several months after those initial releases, but the sampling still identified strong a biotic response over time.
In conclusion, strong temporal patterns were evident in both taxon-specific and ecosystem-level analyses. It is likely that at least some of the patterns observed are due to barrage flows, but it is not possible to untangle the effects of barrage flows from natural intra-annual variability or patterns that may have occurred even in the absence of barrage flows further, without the inclusion of historical and control data.

The effect of barrage releases on the biota of the Coorong and Murray Mouth: A synthesis Report prepared for DENR
Page 34 of 36
Conclusions
- Time was the prevailing factor explaining both taxon-specific (individual) and ecosystem-level (syntheses) interactions. A lack of site-to-site variability was surprising, given the diversity of sites present throughout the study.
- No assemblage was correlated with river flow or depth syndromes, suggesting no taxon-specific or ecosystem-level effect was correlated with the environmental variables we have associated with the barrage release. Ecological change did seem to be driven by water quality, which would also be associated with addition of fresh water. Limited environmental variables available for analyses could have restricted correlations driving assemblage structure. Our explanation of each syndrome should be further tested with water chemical experts.
- Several key relationships were identified between pairs of assemblages. These relationships could represent a link through the trophic web or a response to the same environmental cues. Specific hypotheses could be formed based on these findings for testing during future monitoring and/or research.
- Consistent and overlapping monitoring designs between taxonomic groups provided a strong basis for numerous statistical analyses, with adequate spatial and temporal replication. However, a lack of unaffected sites and/or sampling times before the commencement of flows limited the inference that could be drawn from these analyses, so we cannot categorically attribute findings to the return of barrage flows.

The effect of barrage releases on the biota of the Coorong and Murray Mouth: A synthesis Report prepared for DENR
Page 35 of 36
References
Aldridge KT & Brookes JD (February 2011) The response of water quality and phytoplankton communities in the Northern Lagoon of the Coorong and Murray Mouth to barrage releases from the Lower Lakes, November 2010 – January 2011, Interim report prepared for the Department of Environment and Natural Resources and the Department for Water, Adelaide, South Australia.
Anderson MJ (2009) ‘Multivariate analysis of complex experimental designs using PERMANOVA+’, Workshop on multivariate analysis for biologists, ecologists and environmental scientists, Flinders University, Adelaide, South Australia, 9-19 December, 2009.
Anderson MJ, Gorley RN & Clarke KR (2008) PERMANOVA+ for PRIMER: Guide to Software and Statistical Methods. PRIMER-E, Plymouth UK
Brookes JD, Lamontagne S, Aldridge KT, Benger S, Bissett A, Bucater L, Cheshire AC, Cook PLM, Deegan BM, Dittmann S, Fairweather PG, Fernandes MB, Ford PW, Geddes MC, Gillanders BM, Grigg NJ, Haese RR, Krull E, Langley RA, Lester RE, Loo M, Munro AR, Noell CJ, Nayar S, Paton DC, Revill AT, Rogers DJ, Rolston A, Sharma SK, Short DA, Tanner JE, Webster IT, Wellman NR & Ye Q (2009) An Ecosystem Assessment Framework to Guide Management of the Coorong. Final Report of the CLLAMMecology Research Cluster, CSIRO Water for a Healthy Country Flagship Project. July 2009.
Clarke KR & Gorley RN (2006) PRIMER v6: User Manual/Tutorial, PRIMER-E, Plymouth
Dittmann S, Baggalley S, Brown E, Drew M & Keuning J (March 2011) Provision of benthic macroinvertebrate monitoring for the Goolwa Channel water level management project year two and barrage releases within the Coorong, Lower Lakes and Murray Mouth region, Interim report prepared for the Department of Environment and Natural Resources, Adelaide, South Australia.
Downes BJ, Barmuta LA, Fairweather PG, Faith DP, Keough MJ, Lake PS, Mapstone BD & Quinn GP (2002) Monitoring Ecological Impacts: Concepts and practice in flowing waters, Cambridge University Press, Cambridge, 446 pp., ISBN 0521771579
Department of Water (2011) River Murray Water Data, https://www.waterconnect.sa.gov.au/RMWD/Pages/default.aspx; Accessed 10/06/2011.
Geddes MC (2005) Ecological outcomes for the Murray Mouth and Coorong from the managed barrage release of September-October 2003. A report prepared for the South Australian Department of Water, Land and Biodiversity Conservation, SARDI Aquatic Sciences and the University of Adelaide, Adelaide. SARDI Publication No. RD03/0199-2.
Lester RE & Fairweather PG (2009) Suggested program for monitoring changes in biotic communities following completion of blocking bank at Clayton, A report prepared for the Department for Environment and Natural Resources, Adelaide, South Australia.
Norman GR & Streiner DL (1998) Biostatistics: The bare essentials, BC Decker Inc, Canada
Paton DC (March 2011) Provision of bird monitoring for the Goolwa water-level management project (Year 2) and barrage release, Interim report prepared for the Department of Environment and Natural Resources, Adelaide, South Australia.

The effect of barrage releases on the biota of the Coorong and Murray Mouth: A synthesis Report prepared for DENR
Page 36 of 36
Phillips B & Muller K (2006) Ecological Character Description: Coorong, Lakes Alexandrina and Albert, Wetland of International Importance, South Australian Department for Environment and Heritage, South Australian Government, Adelaide.
Shiel RJ (March 2011) The response of zooplankton communities in the North Lagoon of the Coorong and Murray Mouth to barrage releases from the Lower Lakes, November 2010 – January 2011, Interim report prepared for the Department of Environment and Natural Resources and the Department for Water, Adelaide, South Australia.
SYSTAT (2004) SYSTAT 11: Statistics 1 SYSTAT Software Inc, Richmond, California.
Vanni MJ & Layne CD (1997) Nutrient recycling and herbivory as mechanisms in the “top-down” effect of fish on algae in lakes, Ecology, 78: 21-40
Wedderburn S, Barnes T & Gillanders B (February 2011) Intervention monitoring of estuarine and diadromous fishes at Mundoo Channel and Boundary Creek, Lake Alexandrina, An interim report prepared for the Department of Environment and Natural Resources, Department for Water and the Murray-Darling Basin Authority, Adelaide, South Australia.
Ye Q, Bucater L & Short, D (February 2011) Coorong fish intervention monitoring for the barrage releases during 2010/11 – interim report, South Australian Research and Development Institute (Aquatic Sciences), Adelaide, South Australia.