the effect of bad news on reputation and shareprice: an ... · the effect of bad news on reputation...
TRANSCRIPT

The effect of bad news on reputation andshareprice: An empirical survey
Term paper in the field of Social Sciences
Julian Kölbel
Department of Management, Technology and Economics - DMTECChair of Entrepreneurial Risks - ER
Swiss Federal Institute of Technology (ETH) Zurich
Supervisors:Prof. Dr. Didier Sornette
Dr. Ryan WoodardZurich, May 5, 2008

Acknowledgements:
These are people without whom this thesis would
not have been possible and I would like to thank them
for their trust, initiative and support:
Andrea Schurter
Luca Bortolani
Patrick Vuarnoz
Philipp Aeby

Table of contents:
0. Introduction 1
1. Previous studies 2
2. Reputation and the role of news 3
3. Data specification 4
4. Methodology 5
5. Results 6
6. Discussion 9
7. Bonus chapter: Fishing for evidence 11
8. Bibliography 13
9. Appendix 14

0. Introduction
An Australian oil company shoves aside a rock monument with 30.000 year old aboriginal
art on it to build a natural gas plant (Waelterli, 2007). This is hard to believe, but it
happened. We can question the ethical beliefs of the operators, but it is unlikely that they
change. But we can also ask, if this decision is good in terms of business. Is dirty business
more efficient than ethically sound business? Or is it maybe the other way around? This is
part of the archaic question about good and evil, which will not be answered in this paper.
But it contributes its share to the quest, relating ethical conduct and financial performance.
For this investigation, two measures are needed: One measure of economic
success, and one of ethical conduct. The shareprice is widely recognised to represent the
overall value of a company and is also readily available. The measure of ethical conduct is
less clear and by far more difficult to obtain. In this paper, a commercial index is used that
builds on the news exposure of companies. The leading question is: Is there an effect of
bad news concerning ethical conduct on the shareprice.
This effect can be positive or negative, of course. Usually, companies behave
immoral only, if there is a special gain in profits connected to it. Hence it may well be that
in the aftermath of bad news, the numbers go up. On the other hand, there is reputation
that usually suffers from bad news. A loss in reputation can result in a monetary loss, but it
is difficult to quantify and probably lagged in its effect. If companies act efficiently, they
have considered this possible loss and weighed out against the profit. Due to the fact that
reputation is an intangible asset and very hard to assess, chances are that these possible
losses have not been considered. Framed in terms of risk management, the question is: Is
there a systematic underestimation of reputational risk?
This question can be discussed on the company level and the portfolio level. The
latter has been more fruitful, as timeseries of an individual shareprice are quite noisy and
difficult to explain. The aim of this survey is to fish for evidence, if there is an effect that
shows empirically and give indications on what could be the cause.
The paper is structured as follows: In the first section there is an overview of
previous research relating corporate social responsibility and financial performance. The
second section motivates the hypothesis, adressing reputation and the impact of news.
The third and fourth section describe the data and methodology of the analysis in detail.
The fifth section displays the results and section six concludes with interpretation and hints
1

for further research. The appendix includes a bonus chapter, describing first attempts for
this project that have not been followed through but should not be forgotten altogether.
1. Previous studiesThe question, how corporate social responsibility (CSR) influences the market value of a
company is old and much debated. There are two competing schools, the cost-concerned
and the value creation school. The cost-concerned school, whose most prominent
representative is Milton Friedman, claims that there is a trade-off between CSR
performance and financial performance and CSR activities would have been implemented
already, if they were profitable (Friedman, 1962). The value creation school argues that
CSR activities are a competitive advantage, spurring innovation, if they are conducted in
the right manner (Porter and van der Linde, 1995).
There have been numerous studies, trying to show and quantify this relationship and to
end this dispute. So far, there has not been a clear result. Several studies before 2000
have found evidence for the value creation hypothesis, most of them using the Fortune
Corporate Reputation index and applying muliple timeseries regression models. The use
of multisector samples and the range of lag times are the most critical points in surveys of
this kind (de la Fuente Sabate and de Quevedo Puente, 2003). Lag times ranging from
days to years have been proposed. It has been questioned, what kind of reputation the
Fortune index measures. With respect to CSR research it seems inappropriate now, as its
„usefulness is limited to measuring the extent to which a firm is perceived as striving for
financial goals“ (Fryxell, 1994).
Another methodology is the superposition of windows from shareprice timeseries, selected
on the basis of news events. It was recently indicated that the act of joining climate
leaders, clearly a CSR activity, caused an immediate sharp drop in shareprices of the
companies that did so (Thorburn, 2008). Another modern approach is to look at portfolios
that incorporate CSR measures into their trading strategy (Stenström and Thorrel, 2007 as
well as Kempf and Osthoff, 2007), which is also applied in this survey.
Results in CSR research will always greatly depend on the measure that has been used
for CSR performance. It is unfortunate that many papers fail to specify, what exact
measure of CSR performance has been used and how it was computed. This makes
comparison among studies obsolete. There is an approach to measurement called norm-
based (Stenström and Thorrel, 2007). All companies that violate some sort of norm, an
2

international treaty like the UN Global Compact for example, are said to have bad CSR
performance. The advantage is that CSR is clearly defined. Another measuring approach
builds upon reputation for CSR performance. In that case the nature of reputation and its
measuring instrument has to be defined.
2. Reputation and the role of newsThis chapter describes the line of thoughts, that make me believe that there could be an
effect of bad news concerning CSR on the shareprice. In order to do that, the concept of
reputation needs to be introduced and linked to news and shareprices. Reputation is an
intangible asset. Following Eccles, Newquist & Schatz it can be defined as the belief that a
company will fufill my expectations. As a consequence of different expectations that
stakeholders have towards a company, reputation will also be different among them. An
easy example is a company that pays very high salaries. Reputation among employees
will be good, but among investors it will be bad. The overall reputation and its value, that
makes up a part of the company's market value, is a function of these different reputations
(Eccles, Newquist & Schatz). The goal is to maximize this function. CSR activities are
directed towards employees, clients and the community and they serve their needs and
expectations. Therefore, reputation within these groups will be positively influenced.
Among investors, reputation may fall or rise, depending on if they believe that these
additional costs will pay off. If we assume that the costs are immediate and potential
investment benefits take some time and involve the risk of failing, it is fair to suppose that
the investor's reputation will first fall, and later increase.
With reputation, though, I introduce another variable that has no agreed definition and
cannot be measured in a standard way. I eventually use a news-based proxy, so here is
the rationale of what reputation has to do with news. Reputation has not much to do with
objective reality, reputation is perception (Eccles, Newquist & Schatz). We perceive most
of the world via media and this is true for the financial world as well: „Finance is about how
the continuous stream of news gets incorporated into prices. But not all news have the
same impact.“ (Sornette, Malevergne, Muzy).
My idea is that a large sample of intelligently selected news should allow to detect its
characteristic effect in economic datastreams. I assume that the news that make up the
Reputational Risk Index from ECOFACT have the common characteristic effect that they
hurt reputation among those that expect CSR activities from a company, most prominently
3

clients and employees. I further assume that this loss in reputation will result in a lagged
loss of company value.
This provides the foundation for my hypothesis: High RRI values will result in lagged, low
returns.
3. Data SpecificationThe investment universe for this study were the constituents of the MSCI World as of April
2008. The analysis was based on weekly closing prices of these securities. As a proxy for
ethical performance, the Reputational Risk Index RRI from ECOFACT AG was used. Both
of these commercial datasets were kindly provided by the respective companies for
research purposes.
The MSCI World from April 2008 comprises 2876 securities. For the experiment, all those
were used, that had no gaps in weekly prices during the observed period, resulting in 2446
securities.
The RRI is based on the global flow of news. The internet is searched automatically for
any news that contain criticism towards any company. These news are screened by a
team of analysts, to judge if the criticism is in the scope of a list of 26 defined
environmental and social issues, e. g. child labour or local pollution. If this is the case, the
news are rated on how severely they might weigh on the company's reputation, following
specific guidelines. This results in entries in a database, relating a date, a company and
measures of severity. From these discrete entries, a continouos timeseries of index values
between 0 and 100 is computed. In the calculation, several news shortly following each
other have a cumulative effect, if there is a period without news, the index value
decreases. Identical news from different sources are not taken into account. So in short,
the RRI is a measure of how often and how strongly a company has been criticized at a
given time.
This RRI exists for 4212 companies. The data is not homogenous, because ECOFACT
expanded, and nowadays a lot more news are entered as in the beginning of 2006 (see
Appendix 1). This needs to be kept in mind. Another problem is, that the RRI of many
companies is identical, which can be the case when companies are criticized together. I
decided to use a subset of all those companies, that were at least 5 times entered into the
database, to limit this problem. Hence the Matrix of RRI timeseries that was finally used,
comprised 364 companies.
4

4. MethodsThe aim of this computational experiment is to test a trading strategy that sells securities
with a high RRI. To make the effect of this strategy more visible, I play the devil's advocate
and do exactly the opposite: The strategy is to buy all companies with a high RRI. What is
precisely tested is, if there is a difference in returns between a benchmark portfolio and a
portfolio that consists only of companies that scored the maximum RRI in their sector. This
is basically the same as to exclude specific companies from a benchmark portfolio and
compare the remainders to the benchmark, but the difference is much clearer. When the
initial portfolio is large and there is only a small fraction excluded, the difference will always
be very small, even if the performance of the excluded companies is extraordinary.
Considered as a small sub-portfolio, however, extraordinary performance of the selection
can clearly be seen. A large initial portfolio, that serves in this context as an investment
universe, allows for a worldwide scope, which is necessary to match the worldwide scope
of the RRI.
Three portfolios are compared to each other: The MSCI World portfolio, the Max RRI
portfolio and a simulated benchmark portfolios. The simulation was conducted to make
sure that the difference in returns is not due to the difference in size. 10 securities were
200 times randomly selected out of the MSCI World portfolio. The mean return on these
200 simulated portfolios is, as expected, very close to the return on the MSCI world
portfolio. Additionally, the set of simulated portfolios yields quantiles, that allow to
diagnose, if the RRI portfolio performed significantly different from a randomly selected
one.
The period of observation was from 2006-01-01 to 2008-04-01. The length of the
screening interval was chosen as a variable between 11 and 52 weeks. Logarithmic
returns were calculated at the end of each interval, measuring the performance of the
portfolio for the duration of that interval.
The screening criterion was the maximum RRI. This maximum was computed per
screening interval and sector, yielding the top-criticized company in a given interval in its
sector. The ten sectors were defined according to the 10 main sectors of the NYSE sector
classification. These resulting 10 companies formed the Max RRI portfolio, that was
bought and held as an equal weighted portfolio for the following interval. Starting with the
second interval, two returns per interval were compared: Return on the Max RRI portfolio
5

and mean return on the simulated benchmark portfolios, showing 5% and 95 % quantiles.
5. ResultsThe analysis resulted in 41 plots, covering an interval length from 11 to 52 weeks. As a
selection, plots for interval lenghts of 12, 24, 32 and 40 weeks are shown in exhibits 1
through 4. Depending on how many intervals fit into the observation period, they display 1
to 8 comparisons between the returns on the Max RRI portfolio and the simulated
benchmark portfolio. In total, there are 126 evaluated intervals.
There are 8 intervals, where the Max RRI portfolio significantly underperforms the
benchmark and there are 5 intervals, where it significantly outperforms. In most intervals,
performance is within the 5% and 95% quantile of the simulated benchmark portfolios. The
results are quite sensitive to the interval length, but there are patterns that remain over a
certain range of interval length. The results are also clearly dependant on the overall
market development.
When comparing the results from different interval lengths, it needs to be kept in mind that
not only the position of portfolios in the timeline of a changing market is altered, but also
can the Max RRI portfolio have other constituents, due to a different screening interval.
Let's first have a look at the incidents, where performance of the Max RRI portfolio is
significantly different. Significant means here, that the return on the max RRI portfolio is
outside the 5% and 95% quantiles, therefore the null that the difference is a random result
can be rejected on the 10% level. By that measure, the intervals can be nicely divided in
two groups. Significant outperformance of the Max RRI portfolio is found in intervals of
length 11, 13, 15, 18 and 22 weeks. Significant underperformance is found in intervals of
length 11, 20, 24, 27, 28, 32, 33 and 35 weeks. That means in intervals longer than 22
weeks, there are only significant differences due to underperformance of the max RRI
portfolio. Another characteristic is that the Max RRI portfolio significantly outperforms the
benchmark only in times when the overall market performance is negative. The five
intervals, when this is the case, all include October to December of 2007, when the market
was suffering from the subprime crisis. But there are also two intervals of 27 and 28 weeks
length, that include this critical period and where the max RRI portfolio significantly
underperforms.
6

Exhibit 1: Returns on the Max RRI portfolio with an interval length of 12 weeks compared to themeans of return on 200 simulated portfolios of equal size including 5% and 95% quantiles.
7
Exhibit 2: Returns on the Max RRI portfolio with an interval length of 24 weeks compared to themeans of return on 200 simulated portfolios of equal size including 5% and 95% quantiles.
2006-06-24 2006-12-09 2007-05-26
Max RRI portfolioSimulated portfolios
Beginning of Holding period
an
nu
aliz
ed
log
Re
turn
s
-0.3
-0.2
-0.1
0.0
0.1
0.2
0.3
2006-04-01 2006-06-24 2006-09-16 2006-12-09 2007-03-03 2007-05-26 2007-08-18 2007-11-10
Max RRI portfolioSimulated portfolios
Beginning of Holding period
an
nu
aliz
ed
log
Re
turn
s
-0.3
-0.2
-0.1
0.0
0.1
0.2

8
Exhibit 3: Returns on the Max RRI portfolio with an interval length of 32 weeks compared to themeans of return on 200 simulated portfolios of equal size including 5% and 95% quantiles.
2006-08-19 2007-03-31
Max RRI portfolioSimulated portfolios
Beginning of Holding period
annu
aliz
ed lo
g R
etur
ns
-0.2
-0.1
0.0
0.1
0.2
0.3
Exhibit 4: Returns on the Max RRI portfolio with an interval length of 40 weeks compared to themeans of return on 200 simulated portfolios of equal size including 5% and 95% quantiles.
2006-10-14
Max RRI portfolioSimulated portfolios
Beginning of Holding period
an
nu
aliz
ed
lo
g R
etu
rns
-0.2
-0.1
0.0
0.1
0.2
0.3
0.4
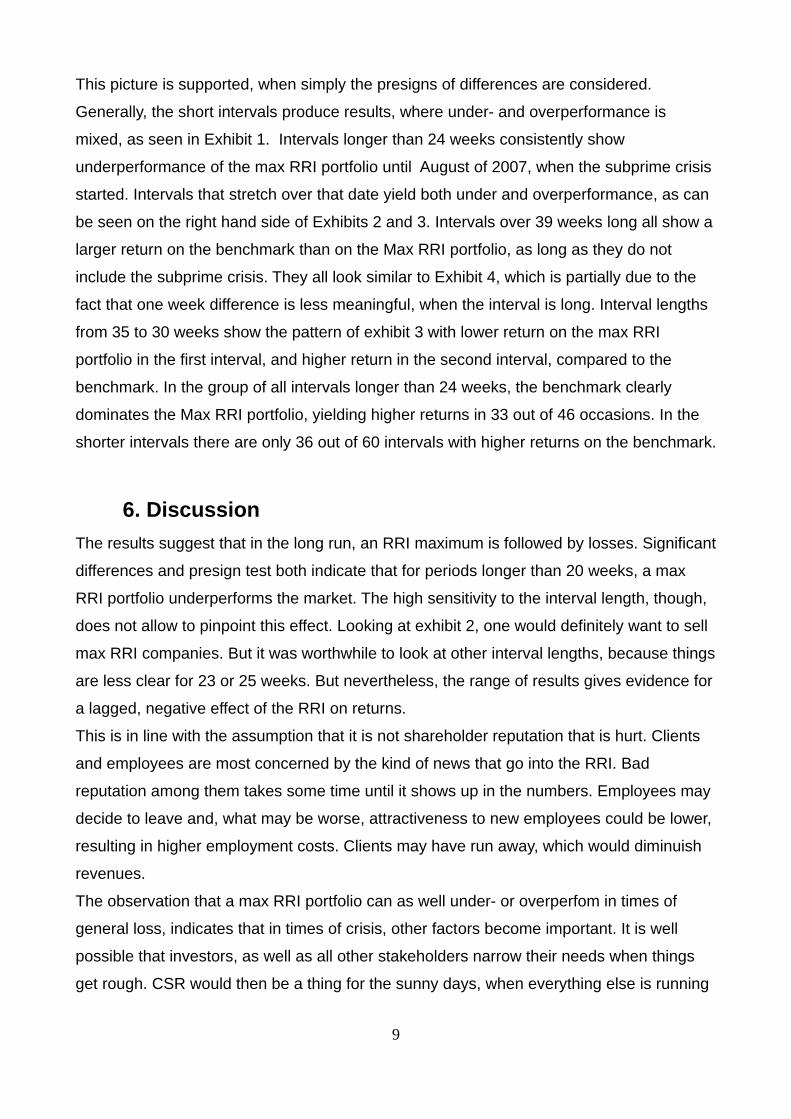
This picture is supported, when simply the presigns of differences are considered.
Generally, the short intervals produce results, where under- and overperformance is
mixed, as seen in Exhibit 1. Intervals longer than 24 weeks consistently show
underperformance of the max RRI portfolio until August of 2007, when the subprime crisis
started. Intervals that stretch over that date yield both under and overperformance, as can
be seen on the right hand side of Exhibits 2 and 3. Intervals over 39 weeks long all show a
larger return on the benchmark than on the Max RRI portfolio, as long as they do not
include the subprime crisis. They all look similar to Exhibit 4, which is partially due to the
fact that one week difference is less meaningful, when the interval is long. Interval lengths
from 35 to 30 weeks show the pattern of exhibit 3 with lower return on the max RRI
portfolio in the first interval, and higher return in the second interval, compared to the
benchmark. In the group of all intervals longer than 24 weeks, the benchmark clearly
dominates the Max RRI portfolio, yielding higher returns in 33 out of 46 occasions. In the
shorter intervals there are only 36 out of 60 intervals with higher returns on the benchmark.
6. DiscussionThe results suggest that in the long run, an RRI maximum is followed by losses. Significant
differences and presign test both indicate that for periods longer than 20 weeks, a max
RRI portfolio underperforms the market. The high sensitivity to the interval length, though,
does not allow to pinpoint this effect. Looking at exhibit 2, one would definitely want to sell
max RRI companies. But it was worthwhile to look at other interval lengths, because things
are less clear for 23 or 25 weeks. But nevertheless, the range of results gives evidence for
a lagged, negative effect of the RRI on returns.
This is in line with the assumption that it is not shareholder reputation that is hurt. Clients
and employees are most concerned by the kind of news that go into the RRI. Bad
reputation among them takes some time until it shows up in the numbers. Employees may
decide to leave and, what may be worse, attractiveness to new employees could be lower,
resulting in higher employment costs. Clients may have run away, which would diminuish
revenues.
The observation that a max RRI portfolio can as well under- or overperfom in times of
general loss, indicates that in times of crisis, other factors become important. It is well
possible that investors, as well as all other stakeholders narrow their needs when things
get rough. CSR would then be a thing for the sunny days, when everything else is running
9

smooth.
The subprime crisis was a period of considerable panic and is likely to have had a large
impact on results. It is fate that the rather short observation period contains this dominating
event. On the other hand, dependance on overall market development is an interesting
result that may stay valid for the next time the market is stable. When considering that it is
generally doubtful, if ex-post analyses survive regime shifts of the market, this conditional
approach is much less naive.
To proof the predicting power of the RRI, one would have to work on the robustness of the
results. One could apply a trading strategy that screens every week for RRI maxima with a
constant lag and restructures the portfolio. This would yield multiple results of equal
dimensions that can be exploited statistically. The most promising lag would be around 30
weeks. Additionally, one could introduce a condition on the sign of the market
development, or concentrate on observation periods with stable bull markets.
Further research questions would be to conduct case studies to see, if the proposed
reasons for the drop in shareprices can actually be found in the balance, looking at sales
numbers and and employment costs. It will also be absolutely worthwhile to repeat this
survey at a later time, when there is more data available.
10

7. Bonus chapter: Fishing for evidenceThe goal of this thesis was to find a relationship between the RRI and the shareprice.
Several approaches preceded the one presented in this paper. They were all abandoned,
because I felt the applied methods did not measure the things I wanted to find out. Looking
back on it, I think that there have been some interesting insights along the way that are
worth to be mentioned here. In this appendix I briefly describe earlier approaches and
results in order to prevent others from repeating it, or giving them a chance to do it in a
smarter way.
The first attempts were all carried out with a small sample of the RRI for 10 companies. At
the beginning I simply looked at the timeseries of RRI and shareprice, trying to find some
sort of pattern, but there was nothing to see.
Following that, I tried a multiple timeseries regression of the RRI on returns. As additional
explaining variables I used the three factors from Eugene Fama and Kenneth French's
three factor CAPM model. I wanted to find out, if this model could be improved by adding
the RRI as a fourth factor, possibly with some lag. The problem that halted me, was that
the average R-squared of the three factor model was barely above 0.1, so that it did not
make sense to improve this model with the RRI, because an R-squared of 0.2 would still
be nothing. The only candidates with an acceptable model performance of R-squared over
0.5 were two Swiss banks. But this result could be attributed to the subprime crisis, as the
RRI was good to explain the extreme drops in prices during fall 2007. That was nice for the
model, but I am convinced it is a spurious correlation. High RRI values were not the cause
and no predictor of the subprime crisis.
With crosscorrelations between returns and RRI I tried to find a useful lag time for the RRI
timeseries, but there was no lag that worked consistently for several timeseries of the RRI.
A result along the way was that the RRI is a non-stationary timeseries, which would be the
foundation to do correlations. A Phillips-Perron test for the ten RRI series clearly showed
that they have a unit root.
Worrying that I had done something wrong in my calculation for the CAPM model, I tried to
reproduce a result from a manuscript, where a new two-factor capital asset pricing model
is compared to the established three-factor model by Fama and French (Malevergne and
Sornette 2007). The reproduction comprised the calculation of alphas and betas for ten
industry portfolio timeseries that are available on the website of Kenneth R. French. The
11
original table from the referred manuscript and the reproduced table are shown in
appendix 2 and 3. Doing this I understood that the CAPM only works for diversified
portfolios, explaining the non-diversifiable risk, and that this model would never explain the
prices of an individual asset properly.
The next approach was to forget about the timeseries nature of the RRI and to focus more
on the effect of discrete news events. I selected news that were rated as having a very
high reach throughout the media and looked at windows of the returns around this date. By
superposition of these windows, I hoped to recognize some common pattern. This was
clearly not the case as can be seen in appendix 4. I failed at the time to draw the useful
conclusion that there is apparently no immediate impact from top RRI news on the
shareprice. This analysis may actually be worthwhile to be repeated with a larger sample.
One could argue that, in line with the results of the presented study, the effect of the RRI is
not an immediate one, because it is not the kind of news that would upset shareholders. It
is also a nice complement to the study of Karin S. Thorburn, showing that there is
immediate investor reaction when positive CSR news are released.
The last approach, to incorporate the RRI into a trading strategy, has been presented in
this paper. The road to it was wound, but I have learned a lot about doing research and it
does not bother me to know that the road will always be like that.
12
8. Bibliography
de la Fuente Sabate, J. M., de Quevedo Puente, E., 2003, Empirical analysis of the relationship between corporate reputation and financial Performance: A Survey of the literature, Corporate Reputation Review, 6:2, pg. 161-177
Eccles, R. G., Newquist, S. C., Schatz R., 2007, Reputation and Its Risks, Harvard Business Review, 85:2, pg. 104-114
Fama, E. F., French, K. R., 1993, Common Risk Factors in the Returns on Stocks and Bonds, Journal of Financial Economics, 33, pg. 3-56
Friedman, M., 1962, Capitalism and Freedom, University of Chicago Press
Fryxell, G. E., 1994, The Fortune Corporate 'Reputation' Index: Reputation for What?, Tennessee Journal of Management, 20:1, pg. 1-14
Kempf, A., Osthoff, P., 2007, The Effect of Socially Responsible Investing on Portfolio Performance, European Financial Management, 13:5, pg. 908–922
Porter, M. E., van der Linde, C., 1995, Green and Competitive: Ending the Stalemate, Harvard Business Review, 73:5, pg. 120-134
Sornette, D., Malevergne Y., 2007, A two-Factor Asset Pricing Model based on the Fat Tail Distribution of Firm Sizes, available at SSRN: http://ssrn.com/abstract=960002, accessed 3.05.2008
Sornette, D., Malevergne, Y., Muzy, J. F., 2006, Volatility Fingerprints of Large Shocks: Endogeneous Versus Exogeneous, available at arXiv:cond-mat/0204626v1, accessed 3.05.2008
Stenström, C. H., Thorell, J. J., 2007, Evaluating the Performance of Socially Responsible Investment Funds: A Holding Data Analysis, Stockholm School of Economics, Master thesis within Finance
Thorburn, K. S., 2008, Why the U.S. policy for climate change is flawed, available athttp://www.voxeu.org/index.php?q=node/1060, accessed 3.05.2008
Wälterlin, U., Sie zerbrechen unsere Bibel, 2.11.2007, Tagesanzeiger, Tamedia AG, Zürich
13

Appendix
Appendix 1: Histogram of RRI affecting entries in the RRI database for the 364 companiesthat have been entered at least 5 times.
14
# of RRI affecting entries
t
#
2006-01-07 2006-07-07 2007-01-07 2007-07-07 2008-01-07
050
100
150
200

Appendix 2: original Table showing R-squareds of ten industry portfolios for different factormodels (Malevergne and Sornette 2007)
15

Appendix 3: Reproduction of table showing R-squareds of linear regressions of excessreturns on ten industry portfolios for different factor models.
16
Mkt.RF +SMB +HML all 3 factors Portfolio r.squared r.squared r.squared r.squared1 NoDur 75.80% 88.30% 79.50% 91.70%2 Durbl 74.40% 87.80% 77.00% 90.20%3 Manuf 82.10% 91.90% 85.80% 95.30%4 Enrgy 58.10% 63.50% 63.10% 68.20%5 HiTec 74.30% 86.00% 74.70% 86.50%6 Telcm 62.40% 68.00% 63.70% 69.40%7 Shops 71.70% 86.60% 72.70% 87.40%8 Hlth 65.20% 75.90% 66.60% 77.40%9 Utils 58.30% 59.00% 66.00% 66.60%10 Other 71.70% 83.40% 81.40% 92.60%11 MEAN 69.40% 79.00% 73.10% 82.50%

Appendix 4: Superposition of windows of daily returns, centered at the time t=0 when anews with highly rated reach was released.
17