the effect of family structure and family capital on the ... · the effect of family structure...
TRANSCRIPT

The Effect of Family Structure and Family Capital on the
Political Behavior and Policy Preferences of Latino
Immigrants in the United States
Iffigenia BarbozaDepartment of Political Science and Statistics
Michigan State University
Rohan Lloyd WilliamsDepartment of Political Science
Michigan State University
October 3, 2004
0

1 ABSTRACT 1
1 Abstract
The assimilation model of acculturation posits that the values and customs of immigrant
groups will converge to that of the majority population with time. One consequence of
assimilation has been the institutional decline of the family among Latino immigrants. While
many have characterized the family as a political resource, especially with respect to time,
control and unequal status (Burns et. al., 1997), when discussing the political participation
of Latinos, scholarly discussion often overlooks the role that the family plays in political
socialization. This is especially surprising given the unique role of the family in determining
an individuals personal and social development and the well-established fact that most Latino
immigrants make decisions based primarily on how they will affect their family. Moreover, for
recent immigrants, the family is considered to be the dominant source of advice and support.
(Rumbaut, 1997). In Latino families, decision-making and allocation of household resources
are traditionally gender-based, but traditional family arrangements have been shown to
change with years spent in the United States. In this paper, we use the 2002 Kaiser/Pew
Latino survey to investigate how length of residence contributes to the decline of family
structure and family capital among Latino immigrants and how this decline affects political
alienation and electoral participation among Hispanics.
2 Review of the Literature
2.1 Electoral Activity and Naturalization
For Hispanics, there is substantial inter-group variation that accounts for the decision of
whether or not to become a United States citizen or to participate in politics. For example,
naturalization is an important issue for both Mexicans and Cubans. It is not, however, an

2.1 Electoral Activity and Naturalization 2
issue for Puerto Ricans because they are granted citizenship status due to their common-
wealth origins. (McClain and Garcia 1993). Puerto Ricans, however, are less politically
involved in the United States than they are in their country of origin. Explanations have
focused on lack of mobilization (Dominguez 2002) and on the relative political alienation
of Puerto Ricans in the United States as compared with Puerto Rico (McClain and Garcia
1993). More generally, the large number of noncitizens is, of course, a major reason for
low levels of registration and turnout among Latinos. Other explanations focus on the lack
of knowledge about the naturalization process, distrust of the Immigration and Naturaliza-
tion Service (INS), no perceived benefits to naturalization and distance from the political
system. (Id 1993). Organizational efforts aimed at providing Latino nationals with informa-
tion regarding the naturalization process have had some effect, however, a large number of
immigrants remain non-citizens. (Id 1993).
Other factors have been found to be significantly related to the decision to become a
United States citizen. For example, many immigrants fail to naturalize due to the conflict
they feel about joining the American political community on the one hand and on the other
feeling as if they are betraying their homeland. (Jones-Correa 1998). With respect to Cuban
refugees, strong anti-Castro sentiment coupled with a unique political status have produced
high naturalization rates. (McClain 1993). Discrimination may be causally related to one’s
decision not to acquire citizenship status. For example, Barboza (2004) finds that in addition
to income, age and satisfaction with the United States, perceived discrimination is significant
to a Cuban refugee’s decision to become a United States citizen.
Explaining low turnout among Latinos in the United States presents somewhat of a
paradox especially given that the literature suggests Hispanics to be much more concerned
about issues in the United States than they are about issues related to their country of

2.1 Electoral Activity and Naturalization 3
origin. (Dominguez 2002). There are also substantial differences in educational attainment
and income between several groups of Hispanics, most notably between Cubans and Mexican
Americans. In general, as average group income and/or education increases, so too does that
group’s voting behavior.
To further confound the analysis, a much larger percentage of Hispanics are foreign born
than are non-Hispanic whites. Highton and Burris (2002) studied the interaction effect
between nativity status and years spent in the United States. They found that nativity
status had a powerful effect on turnout, but only when considered in conjunction with how
long foreign-born citizens have lived in the United States.
The literature has also seen discussion of gender differences in participation rates among
Hispanic men and women. For example, Montoya (2002) demonstrated that Mexican men
and women are more similar than either Puerto Rican or Cuban men and women in terms
of their level of political activity. (Montoya 2002). Mexican women are more likely to
participate when they have additional monetary resources, as they grow older or as their
proficiency of English increases. (Id. 2002). In contrast, these factors are not as important
for Mexican men or Puerto Rican and Cuban women, whose voting behavior is more aptly
explained by the extent and quality of their work skills. (Id., 2002).
The traditional model of voter participation, which views participation as being condi-
tioned by education and other individual characteristics (Verba and Nie 1972; Abramson
and Aldrich 1982; Cassel and Luskin 1988), has been relied upon to explain these patterns
of Latino voting (De La Garza 2004). Early studies predict participation based on socioe-
conomic indicators such as income and education, age, gender, marital status, ethnicity and
citizenship. (Montoya 2002). Later studies have found that higher levels of political cyn-
icism, lower rates of naturalization, structural barriers to registration and voting, and low

2.2 The Family as an Agent of Political Socialization 4
levels of information and interest in the Unites States political system are largely responsi-
ble for low turnout rates. (McClain and Garcia 1993). Contemporary research has included
other variables such as organizational involvement, neighborhood composition and candidate
ethnicity. (De La Garza 2004). Organizational involvement has been found to boost levels
of electoral activity among Mexicans and Puerto Ricans but not among Cubans. (Id. 2004).
Studies have repeatedly shown that Latinos vote less than Anglos even when socioeco-
nomic status is taken into account. This finding provides a basis for questioning the empirical
accuracy of the socio-economic model as a predictor of Latino political attitudes and behav-
iors and suggests that other factors besides socioeconomic status are important. We suggest
that in order to account for the unexplained variation in these models, more emphasis should
be placed on the importance of family capital as well as on the socializing role that the family
plays in influencing the political values and attitudes of individual family members.
2.2 The Family as an Agent of Political Socialization
The role of the family in creating future citizens does not figure into the scholarship of
contemporary political scientists. (Verba, Schlozman et al. 2003). By way of contrast, during
the 1960s and 1970s, the political science literature placed more emphasis on the family as an
agent of political socialization as scholars generally assumed that family influences shaped
an individual’s political attitudes and behaviors. (Id. 2003). Nevertheless, the relative
importance of the family in shaping political attitudes and behaviors was the subject of
much dispute. For example, Robinson referred to the family as ”the most important agent
in the socialization process” (quoted in Verba 2003) whereas Torney (1973) emphasized
schooling over family as an important and effective instrument of political socialization. (Id.
2003). More recently, Jennings and Niemi (1981) argued that the role of the family in the

2.3 Family System’s Theory 5
political socialization process is strong relative to other institutions but its influence is not
as great as previously assumed.
The primary theoretical orientation in the socialization literature purporting to explain
the way that family matters in developing political orientations is a learning model. The
literature posits three primary modes of learning that take place between parent and child.
First, according to the Accumulation model, learning takes place explicitly as parents trans-
mit political attitudes to their children. The Identification model holds that parents transmit
political attitudes by example with the understanding that their children will emulate these
attitudes. Finally, the Interpersonal transfer model specifies a much more implicit learning
process (Id. 2003) in which the ”expectations formed from experience in family relationships
are later generalized to political objects.” The Interpersonal Transfer model assumes that
family dynamics pertaining to autonomy, obedience and communication have implications
for the development of political attitudes and behaviors.
2.3 Family System’s Theory
Burns et. al. (1998) theoretical model is enhanced by incorporating literature from the
field of family studies, specifically family ecosystem’s theory. Family ecosystem’s theory is
an integration of general system’s theory and ecological theory with particular emphasis on
family dynamics. The main tenets of systems theory are that systems are holistic, purposeful,
are either open of closed and are characterized by homeostasis. Holistic refers to the tenet
that the whole is greater than the sum of its parts. By purposeful, the proponents of family
systems theory meant that the system contains a structure of organized components (i.e.,
hierarchies, subsystems, boundaries). Open systems are generally social in nature as opposed
to mechanical because boundaries in open systems are more fluid than that of closed systems.

2.3 Family System’s Theory 6
Furthermore, the fact that systems are homeostatic implies that they are in constant flux
and seek balance both internally and externally. These concepts, as they are applied to
family systems, create a vision of the family as a system of interrelated parts that function
as a ”whole,” where the whole is able to adapt in response to external and internal stresses.
In Inside the Family, Kantor and Lehr (1975) have defined several theoretical concepts
that describe how physical and psychological boundaries are used to regulate the flow of
people, objects and ideas in interpersonal relationships. According to Kantor and Lehr,
bounding is a mechanism that families use to protect their family space within the larger
community by regulating both incoming and outgoing traffic. On the other hand, ”bridging”
refers to the relative facility with which individuals or items flow across family boundaries.
(id, 1975).
Family systems are also distance-regulating entities. Kantor and Lehr define ”linking” as
”the regulating of distance, that is, physical and conceptual associations and disassociation’s
of all persons within the family’s spatial interior.” (Kantor and Lehr, 1975). There are
two important sub-mechanisms associated with linking, namely bonding, or maintaining
family connections, and insulating, or the differentiation between family members or between
the family and the external environment. We argue that the importance and strength of
these family bonds provides individuals with capital, which is a political resource needed for
effectively engaging in political processes.
Robert Putnam argues that a healthy democracy demands that social and political in-
stitutions forge linkages among citizens in a political community. This problem of linkages
involves not only how citizens develop senses of interrelationships and shared interests but
also involves getting people to communicate and actively engage in their political commu-
nity. Existing research clearly establishes the role of social capital in promoting trust in

2.3 Family System’s Theory 7
political institutions (Michelson 2003). Surprisingly little of the political science literature,
however, explores the role that family capital – as a subset of social capital – has in deter-
mining political trust among individuals. Given the salient role that family life plays in the
lives of Latinos, it is surprising that scholars have not systematically examined family-based
differences in participatory rates among them or the effectiveness of political campaigns that
appeal directly to them as family oriented segments of the population.
One of the central tenets of ecological theory is that the family ecosystem interacts with
itself and with the environment through a process of adaptation, which itself incorporates
the dialectical approach of searching for change yet desiring stability. Moreover, this process
is regulated by ”strategies of maintenance” that involve the access elements of time, space
and energy. In recent years, the material world has been added to the list of resource cate-
gories. (Imig 2000). Therefore, studying families from an ecological and systemic perspective
requires an understanding of how the resource elements of time, space, energy and mate-
rial goods are used achieve family goals. We argue that one such family goal is regulating
the content and meaning of political messages. Family systems are goal-oriented because
they have a particular vision of the future with respect to, among other things, the political
content of their lives.
According to general systems theory (“GST”)(von Bertalanffy, 1968), all human sys-
tems are open information processing systems with boundaries. Taken literally, GST posits
that there are only two types of systems: closed and open. As stated above, closed sys-
tems are characterized by impervious and impermeable boundaries while open systems have
unrestricted and totally permeable boundaries. Recently, family theorists have recognized
that these labels as applied to social systems in general and family systems in particular
are too restrictive (Kantor and lehr, 1975, Constantine, 1986, Imig, 2000). Accordingly,

3 POLITICS AND FAMILY CAPITAL 8
they claim that four types of paradigmatic orientations structure family interactions: open,
closed, random, and synchronous. (Imig, 2000). Open families are characterized by the
desire to achieve ”practical consensus” (Imig, 2000) via communication. Closed families are
described in the literature as being ”traditional” (Kantor and lehr, 1975) and value stabil-
ity, security and belonging (Imig, 2000). Random families are focused on spontaneity and
emphasize strategies that facilitate change and promote conflict (Imig, 2000). Finally, syn-
chronous families are characterized by a lack of communication, instead learning about each
other through observation, listening and silence (Imig, 2000). These theoretical orientations
set the stage for understanding and interpreting family dynamics and especially for under-
standing the characteristics that are most conducive to promoting political identification and
hence participation.
3 Politics and Family Capital
3.1 The Resource Model of Participation
Many scholars as of late have begun discussing the importance of the family as a political
”resource,” especially in terms of the resource aspects of time, control and unequal status of
women as compared to their spouses. (See Burns et. al., 1997). Recognition of the existence
of a gender gap is a relatively recent phenomenon in political science. Although scholars did
narrowly examine gender differences in turnout, participation, and efficacy as early as the
mid-1960s, the general consensus prior to the 1980 election was that there was no identifiable
gender gap in voting behavior. The literature that did document the existence of a gender
gap viewed it as grounded in preference differences between males and females. There were
certain issues that were primarily identified as being issues that men or women respectively

3.1 The Resource Model of Participation 9
felt more strongly about, and these were congruent with stereotypical notions regarding men
and women. For example, the primary issue dimension on which a gender gap has long
been identified is the military dimension, with men favoring an aggressive military stance
on foreign policy and women favoring peace and military cutbacks. Some work, however,
has recognized the resource differences between men and women, specifically the resources
necessary to engage in political activity.
The influence of feminism led some to interpret the operation of the gender gap as a
function of a disparity in access to decision-making structures. Given the disproportionate
influence of men in institutions of political decision-making, the output of the policy process
is seen as decidedly ”pro-male.” Participation requires certain resources, and as Wolfinger
and Rosenstone found since women have historically been denied access to political resources
such as knowledge and money, they have not been as active as men have been in politics.
Following on work by Verba, Schlozman, Brady, and Nie (1993) that examined the effect
of resource disparity on participation between racial and ethnic groups, Schlozman, Burns,
and Verba (1994) systematically examined the effect of resource disparity on participation
by women, accounting for a significant portion of the gender gap in participation. In further
examination, Schlozman, Burns, Verba, and Donahue (1995) find that patterns of political
participation are by and large similar for men and women, reinforcing the finding that
resource disparities account for differences in amounts of participation. They find further
that education and reproductive issue areas figure more heavily into the participation of
women, adding two more gendered issue dimensions to the war-peace dimension found by
Wolfinger and Rosenstone (1980).
To examine one of the primary determinants of gender-based resource disparities, Burns,
Schlozman, and Verba (1997) examine the role of family life in determining the amount
3.1 The Resource Model of Participation 10
and type of political participation by citizens. They find that within the context of the
household, power and free time enhances political participation. Moreover, they find that
power and free time vary systematically with gender, with men being advantaged. Gender
roles differentiate between men and women with the former seen as the breadwinners and
the latter primarily viewed as caregivers. Of course, employment imposes structure on the
activities of men while a woman’s responsibilities may be more stochastic. Using their free
time and having control over household finances enhances the ability of men to participate
politically.
Verba, Burns, and Schlozman (1997) find a gender gap in political engagement, consisting
of a lower level of interest, knowledge, and efficacy among women. Faced with evidence that
the gender gap in participation cannot be wholly explained by resource disparities, the
authors contend that the participation gap results from a response to social cues received by
both men and women suggesting that politics is the domain of men alone. In emphasizing
the resource constraints that are ”imposed on women by the traditional family,” Burns et
al believe that feminist theory has overlooked the effect of ideology on political activity and
the importance that beliefs about proper gender roles have on political participation. They
argue that ideas about women’s proper roles affect women’s political behavior.
Schlozman, Burns, and Verba (1999) find evidence that factors in the workplace further
reinforce the gender gap in political engagement and political participation. Though Ander-
sen and Cook (1985) and Sapiro (1983) have found that the choice of whether or not to enter
the workplace may represent an underlying selection process which simultaneously affects
choices regarding political participation, those women who do enter the workforce also ex-
perience a systematically different workplace than men, being less likely to work full-time or
to gain higher pay, higher status positions. Returning to the social cues argument advanced

3.1 The Resource Model of Participation 11
in Verba, Burns, and Schlozman (1997), Schlozman, Burns, and Verba (1999) focus on the
workplace as the environment in which adults receive most of their socialization. Given the
realities of modern life, little of our time is spent outside both the family and workplace
environments. The combined effects of these environments seem to systematically diminish
the political engagement and political participation of women.
In a path-breaking article, Stoker and Jennings (1995) show that marital transitions
alter the modes and levels of participation in two ways. First, by forcing people to undergo
a period of substantial adjustment in their personal lives, and second through a process of
learning and interdependence, as the participation tendencies of one spouse act to effect
the other spouse’s participation. They conclude that there is a spousal ”mediation effect”
to political participation that either rises or falls depending on the new partner’s level of
political engagement.
Latinos may be more inclined to favor traditional sex roles, or those ideas that tend to
support domestic women who stay at home, and not to support those women who choose
non-traditional arrangements, both work and family-related. The assimilation process may,
however, tend to break down the traditional sex-role stereotypes, not necessarily because
that is the prevailing cultural norm but out of necessity. There is anecdotal evidence that
this is, in fact, the case. For instance, Mosley et. al. (2000) find that first generation
Mexican Americans tend to be more traditional in their attitudes towards working women
than later-generation Mexican Americans and take this as preliminary evidence of gender
role assimilation. In this paper, we extend Mosley et. al.’s (2000) hypothesis to consider
how family capital and family values change with years lived in the United States and how
this affects political participation and alienation among Latinos. Accordingly, we test the
following research hypotheses:
4 DATA AND METHODS 12
H11 : Traditional family values and family capital among Latinos decline with years lived in
the United States.
H21 : The decline in family capital and family strength is positively correlated with low levels
of electoral activity and inversely correlated with political alienation.
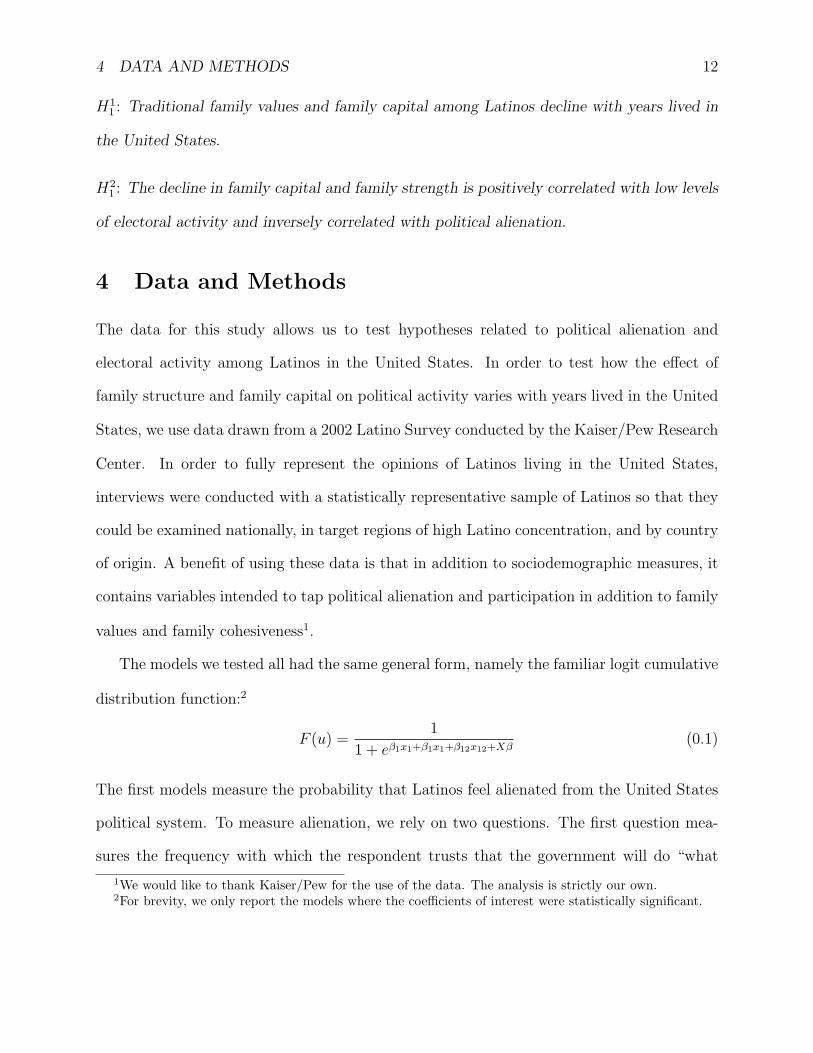
4 Data and Methods
The data for this study allows us to test hypotheses related to political alienation and
electoral activity among Latinos in the United States. In order to test how the effect of
family structure and family capital on political activity varies with years lived in the United
States, we use data drawn from a 2002 Latino Survey conducted by the Kaiser/Pew Research
Center. In order to fully represent the opinions of Latinos living in the United States,
interviews were conducted with a statistically representative sample of Latinos so that they
could be examined nationally, in target regions of high Latino concentration, and by country
of origin. A benefit of using these data is that in addition to sociodemographic measures, it
contains variables intended to tap political alienation and participation in addition to family
values and family cohesiveness1.
The models we tested all had the same general form, namely the familiar logit cumulative
distribution function:2
F (u) =1
1 + eβ1x1+β1x1+β12x12+Xβ(0.1)
The first models measure the probability that Latinos feel alienated from the United States
political system. To measure alienation, we rely on two questions. The first question mea-
sures the frequency with which the respondent trusts that the government will do “what
1We would like to thank Kaiser/Pew for the use of the data. The analysis is strictly our own.2For brevity, we only report the models where the coefficients of interest were statistically significant.

4 DATA AND METHODS 13
is right.” The second question was designed to directly assess whether the respondent be-
lieves that politicians are interested in the problems that are of particular concern to Lati-
nos/Hispanics living in the United States. Respondents who indicated that they believe the
government will do what is right all or some of the time where coded 0 as were those who
believed that politicians are interested in issues pertaining to Hispanics. Respondents who
answered otherwise were coded 1. The second models we tested measure electoral participa-
tion which we operationalized as voting behavior. Individuals who had voted in an United
States election were coded 1, respondents who had not were coded 0. Only citizens of the
United States were included in the analysis.
Both models include the same explanatory variables which fall into three categories: fam-
ily related, identity specific and sociodemographic. To negate the effects of multicollinearity,
we estimated separate models, all of which were the same with the exception of the family
variables we were interested in. We operationalized family structure using variables per-
taining to family size and composition including the respondents feelings about terminating
pregnancy, divorce and non-traditional family arrangements. A four-point scale of responses
was created, with higher values indicating stronger family ties. Our expectation was that
years lived in the United States would be inversely correlated with strong family ties and
that this would lead to higher levels of political alienation and lower levels of participatory
activities. We also coded for four other family related variables with which we had sim-
ilar expectations. Family Capital captures the importance that the respondent places on
family over friends and therefore provides us with a relative measure of the self-perceived
importance of family capital versus social capital. The coefficient on this variable should be
negative in the models predicting alienation and positive in the models measuring electoral
behavior. Two variables are designed to measure the primacy of the nuclear family unit.
Family Care measures the importance of caring for elderly parents. Family Cohesiveness

4 DATA AND METHODS 14
measure the importance of children staying at home until marriage.
Our models also include several ethnicity-related variables. Assimilation measures the
degree to which respondents favored “American” values over values that are congruent with
Hispanic culture. The survey asked questions that can be conceptualized as pertaining to
the “American Dream” and “Melting Pot” metaphors as well as those relating to Spanish
language retention and acting in one’s self-interest versus acting altruistically. A scale was
created with higher values indicating greater levels of assimilation. A second ethnicity-related
variable, Identity measures the respondent’s self-reported ethno-cultural identification. The
respondent had the opportunity to assume a Latino identity, an American identity, or an
identity that was specific to their country of birth.
Finally, we include several control variables to be more certain that our causal inferences
are valid. Democrat equals unity if the respondent self-identified as a democrat, and 0 other-
wise. Other variables include Homeowner, a dummy variable that indicates home ownership,
education and income related variables, as well as age, marital status and number of persons
under 18 living in the household.
Due to the dichotomous nature of the dependent variables in our models, our preferred
estimation technique is logit regression. Applied researchers customarily estimate interaction
terms in order to infer how the effect of one independent variable on the dependent variable
depends on the magnitude of another independent variable in the model. (Norton et. al.
2004). In nonlinear models based on logit analysis, the marginal effect of a change in both
interacted variables is not equal to the marginal effect of changing just the interaction term.
(Id. 2004). Therefore, in order to compute the magnitude of the interaction effects, we
computed the cross derivative of the expected value of the dependent variable for each
model. Consequently, our assessment of the statistical significance of the interaction term is

5 RESULTS AND ANALYSIS 15
based on the estimated cross partial derivative and not on the coefficient from the interaction
term, as Norton et. al. (2004) suggest.
5 Results and Analysis
We are primarily interested in whether the effect of several family-related variables on po-
litical behavior varies with years lived in the United States and therefore ask the following
question, “Does the effect of family structure on political participation and alienation among
Latinos of Cuban, Mexican or Puerto Rican descent vary with years lived in the United
States?”. Before turning to the interacted variables, however, we first discuss the variables
as they appear in level form. The results of the logit analysis indicate support for our first
hypothesis that family capital among Latinos significantly declines with years spent in the
United States (p < .05). Practically speaking, this means that the primacy that individu-
als place on family bonds as opposed to non-familial relationships declines the longer the
individual lives in the US. This result not only supports our intuition, it also supports the
straight-line assimilation model, which posits that immigrant attitudes and behaviors will
become more “mainstream” as length of residency increases. This finding, however, while
itself of major practical and theoretical importance, does little to inform us of the conse-
quence of decreasing family capital on electoral participation and alienation, which we now
address.
Table 1 shows the range of the predicted probabilities for the family-related variables we
are interested in. These probabilities were calculated by allowing each variable to vary from
its minimum to its maximum, while the other variables in the model remained fixed at their
means. The change over the range of the predicted probabilities is instructive. We see that
individuals who believe that children should stay with their parents until marriage are 21.2%

5 RESULTS AND ANALYSIS 16
more likely to vote than those who do not hold such beliefs. The predicted probability of
voting increases among those individuals who believe that a central authority should control
family decision-making. For those who agree in the primacy of family capital over non-
familial relationships, the probability of voting increases by 16.7% while those who disfavor
non-traditional family arrangements are less likely to vote holding other variables at their
means. Finally, the probability of being alienated from the political system is 32.4% greater
for those who believe that family decision-making should be controlled by a central authority
than among those who do not.
Table 1: Change in the Predicted Probabilities with changing values of the independent
variables, holding other variables at their means.
Variable At Min At Max ∆RangeFamily Cohesion .645 .857 0.212Authoritarian Family .783 .921 0.138Family Care .901 .814 -0.087Family Capital .689 .856 .167Family Strength .886 0.114 -0.772Authoritarian Family Pr(Alienate = 1) 0.421 .745 0.324
Table 2 below summarizes the joint significance tests for the models we estimated. With
respect to family strength, we find that the likelihood of voting is greater for those who
retain traditional Hispanic family values as opposed to those who do not as years lived in
the United States increases. Turning to authoritarianism, we find that those who believe
family decisions should be controlled by a central authority are less likely to be politically
active the longer they live in the United States. With respect to family capital, we find
that years lived in the United States combines with family capital to negatively effect the
probability of participating in politics. While this result is not in the anticipated direction,
we believe that this result does not mean that family capital is negatively correlated with

6 SUMMARY AND CONCLUSIONS 17
political participation, merely that social networks are relatively more important than family
networks in engaging Latinos in politics.
Table 2: Joint Hypothesis Tests of Estimated Model Coefficients
Hypothesis Wald Testdf W Prob > χ2
Model 1 βyearsus =βfamcohes =βyrsfamcoh = 0 3 11.64 0.0087Model 2 βyearsus =βauthfam =βyrsauthfam = 0 3 22.77 0.0000Model 3 βyearsus =βfamcare =βyrsfamcare = 0 3 10.80 0.0128Model 4 βyearsus =βfamcap =βyrsfamcap = 0 3 11.06 0.0114Model 5 βyearsus =βfamstr =βyrsfamstr = 0 3 12.75 0.0052Model 6 βyearsus =βauthfam =βyrsauthfam = 0 3 7.94 0.0472
6 Summary and Conclusions
Family capital The use of family resources as a predictor of voting behavior is not new
since there is substantial work in political science that discusses the parabolic relationship
between family and voting behavior. This paper, however, reflects an attempt to step outside
the traditional depiction of familial influence. The findings of this paper indicate quite
strongly that family capital has an inverse relationship to years lived in the United States.
This suggests that the longer an immigrant has resided in the United States the more likely
it is that their commitment to the family values of their homeland will decline. What does
it mean that family values will decline? It does not mean that this person some how no
longer sees family as important, but rather that the associations of family changes to mirror
that of the host country, in this case the United States. For example, in America, the word
on abortion or divorce tends to be liberally construed. Even in the church the attitude
toward the sanctity of marriage has undergone a change. The institution of marriage must
meet certain criteria to be sustainable, the most obvious example being that it should be

6 SUMMARY AND CONCLUSIONS 18
between a man and a woman. Latino immigrants upon arrival may believe that there are no
good reasons for ending a marriage or having an abortion. After some number of years in
residence they may express a personal attitude toward both but also a social position that
is diametrically opposed to their own; ’I would not have an abortion, but I understand that
under certain circumstances it is desirable or even necessary’.
Further findings in the area of family capital reinforce the earlier statement. We found
that the more assimilated the immigrant the more traditional family values give way to
that of the host nation. This finding while consistent is not startling; assimilation is of
course a process of transition. It is therefore reasonable to expect that as one assimilates
one transitions from old to new. Other findings while negative also are consistent with our
theory.
Years in the host nation had no effect on the power differential in the family or on the
authoritative nature of the family. We also found that years in the host nation has no effect
on the structural variable family cohesion. Both these variable exist in American culture in
a similar fashion, therefore the instrument for detecting difference would have to be more
precise to determine differences. In the area of family care we found the findings to be counter
intuitive. In the area of family care, conceptualized as the desire that children have to care
for and reside with their elderly parents, we expected that the immigrant would be less
inclined to continue the traditions of the home country as their term of residence increased.
Our findings indicated no effect. It is our belief that this finding reflects a generational effect
for this variable. By this we mean that where immigrants may hold strong to the custom
of their country of origin, their children, on the other hand, who are raised largely in the
United States, may be less inclined to have similar values.

6 SUMMARY AND CONCLUSIONS 19
Political alienation We found only one variable had an impact on political alienation,
the authoritarian family. This finding is problematic given the limits of the tool employed to
derive this measure. Our expectation was that a strongly authoritarian family will tend to
dominate the discourse within the family; family members will acquiesce. It is also possible
that the alienation that the dominant personality in the family feels will be manifested
throughout the family. This is because the rest of the family employs the dominant figure as
their queue. To our surprise, the other family-related variables – Family Cohesion, Family
care, Family capital and Family strength – had no effect.
In a test for joint significance of the family authoritarian variables, we found that they
were significantly related to both political alienation and electoral behavior. We designed
this variable to provide some measure of the control and distribution of family resources.
The authority figure has a monopoly of the resources available to the family. Members
without resources rely on the authority figure to provide the direction of political discourse
and family members grant him the right to assume that role.
Electoral Participation In the area of electoral participation our findings indicate that
family cohesion has a significant effect on electoral participation and this is consistent with
our expectations. The more closely knit the family, the more persuasive the authoritarian
head will be. In addition, family structure has a negative effect on the likelihood of voting.
However, when we combine years lived in the United States with family structure against
voting we find that there is a positive outcome. This indicates that on the whole, immigrants
who believe in a stronger family structure are more likely to vote with more years in America.
Overall, we take this to mean that number of years in America is a better indicator of voting
behavior than is family structure. The variables pertaining to family care, family capital and
family strength were all significant. The broader the issues, concerns and responsibilities of

6 SUMMARY AND CONCLUSIONS 20
the immigrant the more likely they will participate in the political process. This does not
underscore the notion that immigrants coming to America have an expectation of freedoms
and rights that they may have been denied in their home nation; this expectation may feed
a desire to participate in the political process. Even where rights were available there is a
notion that a more meaningful process fosters a greater desire to participate in American
politics.
We have clearly indicated that family capital as a harnessable resource and related to the
well-known and discussed concept of social capital should not be ignored. Further studies
should attempt to determine the levels of family capital for different social groups, deter-
mining where it starts and ends, what factor enhances it and what factors contribute to the
decline.
Families are social institutions that serve and reflect the American macrosystem, includ-
ing the polity. From a socio-cultural perspective, it is important to understand how social
networks and family structures facilitate or inhibit the construction and co-construction of
identity since these systems dictate how one sees oneself as a political actor. Since social
networks are based upon shared normative and behavioral expectations, the social role that
one assumes in both social and familial contexts is crucial for determining the level of trust
that one has in political processes. These social networks - both familial and non-familial -
play an especially salient role in the political life of Latinos.
No matter how hard the resistance to acculturation is, immigrants, especially 3rd and
4th generation immigrants, may not be able to break free from its stranglehold. The effects
of acculturation on family structure are profound because as one’s understood place in the
family becomes compromised, one’s identity is necessarily transformed. Little is known about
how this transformation impacts the political life of Latino immigrants, whose identity in
America is shaped primarily by considerations of family. This paper represents a small step

BIBLIOGRAPHY 21
towards understanding these relationships but clearly more work must be done, especially
with respect to the Latina immigrant. We have shown that lack of control over family matters
is positively correlated with electoral participation and inversely correlated with alienation
but a determination must be made as to the political resources that are most relevant and
whether disparity in these resources are gender-based.
*Bibliography

22
Bibliography
[1] Burns, Nancy, Kay Lehman Schlozman, and Sidney Verba. 1997. “The Public Conse-quences of Private Inequality: Family Life and Citizen Participation.” American PoliticalScience Review. 91(2): 373-389.
[2] Garza, Rodolfo O. de la. 2004. “Latino Politics.” Annu. Rev. Polit. Sci. 7: 91-123.
[3] Highton, B., and Burris, A., L.. 2002. “New Perspectives on Latino Voter Turnout in theUnited States.” American Politics Research 30(May): 285-306.
[4] Imig, David R. 1999. “A Conversation About Interpersonal Relationships, Family Sys-tems and Paradigms.” http://www.etext.net/etexts/Imi2849/ Venice, CA.
[5] Kantor, D., Lehr, W. 1975. “ Inside the Family: Toward a Theory of Family Process.”San Francisco: Jossey-Bass, 1975.
[6] Kingston, Paul William and Steven E. Finkel. 1987. “Is There a Marriage Gap in Poli-tics?” Journal of Marriage and the Family. 49(February): 57-64.
[7] McClain, Paula D. and John A. Garcia. 1993. “Expanding Disciplinary Boundaries:Black, Latino, and Racial Minority Group Politics in Political Science.” In Ada W.Finifter, Political Science: The State of the Discipline, II. Washington, D.C.: AmericanPolitical Science Association.
[8] Montoya, L.J. 1993. “Expanding Disciplinary Boundaries: Black, Latino, and RacialMinority Group Politics in Political Science.” In Ada W. Finifter, Political Science: TheState of the Discipline, II. Washington, D.C.: American Political Science Association.
[9] Nortin, Edward C., Wang, H. and Chunrong, A. 2004. “Computing Interaction Effectsand Standard Errors in Logit and Probit Models.” The STATA Journal 4(2): 103-116.
[10] Plutzer, Eric and McBurnett, Michael. 1991. “Family Life and American Politics: The”Marriage Gap” Reconsidered.” Public Opinion Quarterly. 55: 113-127.
[11] Portes, Alejandro and Ruben G. Rumbaut. “Legacies: The Story of the ImmigrantSecond Generation.” Berkeley: University of California Press. 2001.
[12] Sapiro, Virginia. 1983. “ The Political Integration of Women.” Urbana, IL: Universityof Illinois Press.

23
[13] Schlozman, Kay Lehman, Nancy Burns, and Sidney Verba. 1994. “Gender and thePathways to Participation: the Role of Resources.” The Journal of Politics. 56(4): 963-990.
[14] Schlozman, Kay Lehman, Nancy Burns, and Sidney Verba. 1999. “What Happened atWork Today?’: A Multistage Model of Gender, Employment, and Political Participa-tion.” The Journal of Politics. 61(1): 29-53.
[15] Schlozman, Kay Lehman, Nancy Burns, Sidney Verba, and Jesse Donahue. 1995. “Gen-der and Citizen Participation: Is There a Different Voice?” American Journal of PoliticalScience. 39(2): 267-293.
[16] Verba, Sidney and Schlozman, Kay Lehman and Burns, Nancy. 1991. “Family Ties:Understanding the Intergenerational Transmission of Participation.” 2003.

7 APPENDIX 24
7 Appendix
Table 3: Logit Estimation Results
Variable Coefficient (Std. Err.)Age 0.1025∗ (0.0441)Age-squared -0.0007 (0.0004)Education 0.1979∗∗ (0.0486)Income ($2000 and over) 0.2076 (0.5668)Income ($600-$999) 0.4998 (0.4141)Income ($1000-$1599) 1.1353∗∗ (0.4225)Income ($1600-$1999) 0.8162 (0.5514)Conservative 4.2955∗∗ (1.0700)Total Number of Children 0.0898 (0.0746)Length of Marriage 0.0071 (0.0165)Household Chores 0.0019 (0.0021)Housewife -0.6366∗ (0.2681)Gender Equality -0.0796∗ (0.0394)Control over Resources 0.0865 (0.0568)Spouse Education 0.0174† (0.0091)Discuss Politics With Spouse 0.4081 (0.2840)Respect Asymmetry 0.5045 (0.6912)Intercept -4.1222∗ (1.6353)
N 387Log-likelihood -195.1384χ2
(17) 70.0361
Significance levels : † : 10% ∗ : 5% ∗∗ : 1%

7 APPENDIX 25
YEARSUS effect plot
YEARSUS
FA
MC
AP
0.7
0.75
0.8
0.85
0.9
0.95
0 10 20 30 40 50
UNDER18 effect plot
UNDER18
FA
MC
AP
0.88
0.9
0.92
0.94
0.96
0.98
0 2 4 6 8
AGE effect plot
AGE
FA
MC
AP
0.85
0.9
0.95
20 40 60 80
ASSIM effect plot
ASSIM
FA
MC
AP
0.60.65
0.70.75
0.8
0.85
0.9
0.95
5 10 15 20 25
DESC_AM effect plot
DESC_AM
FA
MC
AP
0.88
0.89
0.9
0.91
0.92
0.93
0.94
0.0 0.2 0.4 0.6 0.8 1.0
MARRIED effect plot
MARRIED
FA
MC
AP
0.89
0.9
0.91
0.92
0.93
0.0 0.2 0.4 0.6 0.8 1.0
DIVORCED effect plot
DIVORCED
FA
MC
AP
0.780.8
0.82
0.84
0.86
0.88
0.9
0.92
0.0 0.2 0.4 0.6 0.8 1.0
FEMALE effect plot
FEMALE
FA
MC
AP
0.89
0.9
0.91
0.92
0.93
0.0 0.2 0.4 0.6 0.8 1.0
LOWINC effect plot
LOWINC
FA
MC
AP
0.9
0.91
0.92
0.93
0.0 0.2 0.4 0.6 0.8 1.0
HS effect plot
HS
FA
MC
AP
0.89
0.9
0.91
0.92
0.93
0.94
0.95
0.0 0.2 0.4 0.6 0.8 1.0
Figure 1: Probability Plots of Estimated Coefficients From Regression of Family Capital on
Predictor Variables

7 APPENDIX 26
YEARSUS effect plot
YEARSUS
VO
TE
D
0.40.50.60.70.8
0.9
0 10 20 30 40 50
FAMSTR effect plot
FAMSTR
VO
TE
D
0.20.40.60.8
5 10 15 20 25 30
YRSFAMST effect plot
YRSFAMST
VO
TE
D
0.20.40.60.8
0 200 400 600 800 1000
UNDER18 effect plot
UNDER18
VO
TE
D
0.4
0.5
0.6
0.7
0.8
0.9
0 1 2 3 4 5
AGE effect plot
AGE
VO
TE
D
0.50.60.70.8
0.9
20 40 60 80
ASSIM effect plot
ASSIM
VO
TE
D
0.50.60.70.8
0.9
5 10 15 20
DEMOCRAT effect plot
DEMOCRAT
VO
TE
D
0.650.7
0.750.8
0.85
0.9
0.0 0.2 0.4 0.6 0.8 1.0
HOMEOWN effect plot
HOMEOWN
VO
TE
D
0.760.78
0.8
0.82
0.84
0.86
0.0 0.2 0.4 0.6 0.8 1.0
DESC_AM effect plot
DESC_AM
VO
TE
D
0.650.7
0.75
0.8
0.85
0.9
0.0 0.2 0.4 0.6 0.8 1.0
DESC_CO effect plot
DESC_CO
VO
TE
D
0.50.55
0.60.65
0.70.75
0.8
0.85
0.0 0.2 0.4 0.6 0.8 1.0
DESC_LAT effect plot
DESC_LAT
VO
TE
D
0.75
0.8
0.85
0.0 0.2 0.4 0.6 0.8 1.0
MARRIED effect plot
MARRIED
VO
TE
D
0.650.7
0.75
0.8
0.85
0.9
0.0 0.2 0.4 0.6 0.8 1.0
DIVORCED effect plot
DIVORCED
VO
TE
D
0.75
0.8
0.85
0.9
0.0 0.2 0.4 0.6 0.8 1.0
FEMALE effect plot
FEMALE
VO
TE
D
0.740.760.78
0.8
0.82
0.84
0.86
0.0 0.2 0.4 0.6 0.8 1.0
LOWINC effect plot
LOWINC
VO
TE
D
0.7
0.75
0.8
0.85
0.0 0.2 0.4 0.6 0.8 1.0
MEDINC effect plot
MEDINC
VO
TE
D
0.65
0.7
0.75
0.8
0.85
0.0 0.2 0.4 0.6 0.8 1.0
ENG_DOM effect plot
ENG_DOM
VO
TE
D
0.650.7
0.75
0.8
0.85
0.9
0.0 0.2 0.4 0.6 0.8 1.0
LESSHS effect plot
LESSHS
VO
TE
D
0.60.65
0.7
0.75
0.8
0.85
0.0 0.2 0.4 0.6 0.8 1.0
HS effect plot
HS
VO
TE
D
0.7
0.75
0.8
0.85
0.0 0.2 0.4 0.6 0.8 1.0
Figure 2: Probability Plots of Estimated Coefficients From Regression of Voted on Family
Strength

7 APPENDIX 27
YEARSUS effect plot
YEARSUS
VO
TE
D
0.20.40.60.8
0 10 20 30 40 50
AUTHFAM effect plot
AUTHFAM
VO
TE
D
0.70.75
0.80.85
0.9
0.95
0.0 0.2 0.4 0.6 0.8 1.0
YRSAUTHF effect plot
YRSAUTHF
VO
TE
D
0.20.40.60.8
0 10 20 30 40 50
UNDER18 effect plot
UNDER18
VO
TE
D
0.40.50.6
0.7
0.8
0.9
0 1 2 3 4 5
AGE effect plot
AGE
VO
TE
D
0.50.60.70.8
0.9
20 40 60 80
ASSIM effect plot
ASSIM
VO
TE
D
0.40.50.60.70.8
0.9
5 10 15 20
DEMOCRAT effect plot
DEMOCRAT
VO
TE
D
0.70.75
0.8
0.85
0.9
0.0 0.2 0.4 0.6 0.8 1.0
HOMEOWN effect plot
HOMEOWN
VO
TE
D
0.780.8
0.82
0.84
0.86
0.88
0.0 0.2 0.4 0.6 0.8 1.0
DESC_AM effect plot
DESC_AM
VO
TE
D
0.650.7
0.75
0.8
0.85
0.9
0.0 0.2 0.4 0.6 0.8 1.0
DESC_CO effect plot
DESC_CO
VO
TE
D
0.50.55
0.60.65
0.70.75
0.8
0.85
0.0 0.2 0.4 0.6 0.8 1.0
DESC_LAT effect plot
DESC_LAT
VO
TE
D
0.75
0.8
0.85
0.9
0.0 0.2 0.4 0.6 0.8 1.0
MARRIED effect plot
MARRIED
VO
TE
D
0.650.7
0.75
0.8
0.85
0.9
0.0 0.2 0.4 0.6 0.8 1.0
DIVORCED effect plot
DIVORCED
VO
TE
D
0.8
0.85
0.9
0.95
0.0 0.2 0.4 0.6 0.8 1.0
FEMALE effect plot
FEMALE
VO
TE
D
0.760.78
0.80.82
0.84
0.86
0.88
0.0 0.2 0.4 0.6 0.8 1.0
LOWINC effect plot
LOWINC
VO
TE
D
0.7
0.75
0.8
0.85
0.9
0.0 0.2 0.4 0.6 0.8 1.0
MEDINC effect plot
MEDINC
VO
TE
D
0.650.7
0.75
0.8
0.85
0.9
0.0 0.2 0.4 0.6 0.8 1.0
ENG_DOM effect plot
ENG_DOM
VO
TE
D
0.650.7
0.75
0.8
0.85
0.9
0.0 0.2 0.4 0.6 0.8 1.0
LESSHS effect plot
LESSHS
VO
TE
D
0.650.7
0.75
0.8
0.85
0.9
0.0 0.2 0.4 0.6 0.8 1.0
HS effect plot
HS
VO
TE
D
0.75
0.8
0.85
0.0 0.2 0.4 0.6 0.8 1.0
Figure 3: Probability Plots of Estimated Coefficients From Regression of of Voted on Family
Authority

7 APPENDIX 28
−5
0
5
10
z−st
atis
tic
0 .2 .4 .6 .8 1Predicted Probability that y = 1
z−statistics of Interaction Effects after Logit
Figure 4: Z Statistics of Pr(V oted == 1) Effect After Logit
−.0005
0
.0005
.001
.0015
.002
Inte
ract
ion
Effe
ct (
perc
enta
ge p
oint
s)
0 .2 .4 .6 .8 1Predicted Probability that y = 1
Correct interaction effect Incorrect marginal effect
Interaction Effects after Logit
Figure 5: Interaction Term Effect Logit

7 APPENDIX 29
Estimate Std. Error z value Pr(>|z|)(Intercept) −3.2520 1.2793 −2.54 0.0110
Years In United States 0.0810 0.0430 1.88 0.0595Cohesion 1.1909 0.9251 1.29 0.1980
Years × Family Cohesion −0.0314 0.0448 −0.70 0.4828Individuals under 18 in HH −0.2815 0.1145 −2.46 0.0139
Age 0.0273 0.0119 2.29 0.0219Assimilation Index −0.0033 0.0734 −0.04 0.9644
Democrat 1.2533 0.2729 4.59 0.0000Homeowner −0.0101 0.2842 −0.04 0.9717
Identity: American 0.8918 0.2646 3.37 0.0008Identity: Country of Origin 0.6441 0.4716 1.37 0.1720
Identity: Latino −0.0112 0.3342 −0.03 0.9733Married 0.7201 0.2992 2.41 0.0161
Divorced 0.4580 0.4946 0.93 0.3545Female 0.0506 0.2659 0.19 0.8490
Low Income −0.5552 0.3270 −1.70 0.0896Medium Income −0.6805 0.3261 −2.09 0.0369
English Dominant 0.0499 0.4898 0.10 0.9189Less Than High School −0.6426 0.3566 −1.80 0.0716
High School −0.3016 0.3161 −0.95 0.3400
N 492Log-likelihood -207.2
χ2(19) 96.02
Significance levels : † : 10% ∗ : 5% ∗∗ : 1%
Table 4: Logit Regression Results of Voted on Family Cohesion

7 APPENDIX 30
Estimate Std. Error z value Pr(>|z|)(Intercept) −1.6998 1.1431 −1.49 0.1370
Years In United States 0.0278 0.0288 0.97 0.3336Family Care −0.7333 0.6810 −1.08 0.2816
Years × Family Care 0.0320 0.0314 1.02 0.3081Individuals under 18 in HH −0.2559 0.1141 −2.24 0.0250
Age 0.0307 0.0119 2.59 0.0096Assimilation Index −0.0198 0.0763 −0.26 0.7954
Democrat 1.2044 0.2743 4.39 0.0000Homeowner 0.0757 0.2867 0.26 0.7917
Identity: American 0.9010 0.2692 3.35 0.0008Identity: Country of Origin 0.5637 0.4874 1.16 0.2474
Identity: Latino 0.1025 0.3320 0.31 0.7575Married 0.8023 0.3029 2.65 0.0081
Divorced 0.4017 0.4932 0.81 0.4153Female 0.1033 0.2718 0.38 0.7040
Low Income −0.5592 0.3266 −1.71 0.0868Medium Income −0.7271 0.3314 −2.19 0.0283
English Dominant −0.1906 0.4718 −0.40 0.6863Less Than High School −0.7291 0.3584 −2.03 0.0419
High School −0.3646 0.3212 −1.14 0.2562
N 481Log-likelihood -201.38
χ2(19) 85.64
Significance levels : † : 10% ∗ : 5% ∗∗ : 1%
Table 5: Logit Regression Results of Voted on Family Care

7 APPENDIX 31
Estimate Std. Error z value Pr(>|z|)(Intercept) −1.6277 1.2541 −1.30 0.1943
Years In United States 0.0141 0.0370 0.38 0.7044Family Strength −0.1464 0.1154 −1.27 0.2048
Years × Family Strength 0.0055 0.0049 1.12 0.2624Individuals under 18 in HH −0.2485 0.1140 −2.18 0.0294
Age 0.0318 0.0116 2.73 0.0063Assimilation Index 0.0117 0.0744 0.16 0.8751
Democrat 1.2479 0.2730 4.57 0.0000Homeowner −0.0343 0.2851 −0.12 0.9043
Identity: American 0.8596 0.2638 3.26 0.0011Identity: Country of Origin 0.6866 0.4669 1.47 0.1414
Identity: Latino −0.0061 0.3332 −0.02 0.9854Married 0.8301 0.2986 2.78 0.0054
Divorced 0.4909 0.4941 0.99 0.3205Female 0.0636 0.2660 0.24 0.8112
Low Income −0.4684 0.3239 −1.45 0.1482Medium Income −0.6651 0.3252 −2.05 0.0409
English Dominant −0.1156 0.4676 −0.25 0.8048Less Than High School −0.7188 0.3554 −2.02 0.0431
High School −0.3555 0.3145 −1.13 0.2584
N 486Log-likelihood -206.93
χ2(19) 86.06
Significance levels : † : 10% ∗ : 5% ∗∗ : 1%
Table 6: Logit Regression Results of Voted on Family Strength

7 APPENDIX 32
Estimate Std. Error z value Pr(>|z|)(Intercept) −3.4665 1.8103 −1.91 0.0555
Years In United States 0.1230 0.0757 1.63 0.1041Family Capital 0.9874 1.5793 0.63 0.5318
Years × Family Capital −0.0779 0.0763 −1.02 0.3071Individuals under 18 in HH −0.2812 0.1154 −2.44 0.0148
Age 0.0312 0.0119 2.62 0.0089Assimilation Index 0.0205 0.0756 0.27 0.7859
Democrat 1.3059 0.2779 4.70 0.0000Homeowner 0.0692 0.2840 0.24 0.8076
Identity: American 0.8804 0.2658 3.31 0.0009Identity: Country of Origin 0.4322 0.4878 0.89 0.3757
Identity: Latino 0.0940 0.3327 0.28 0.7774Married 0.7858 0.3039 2.59 0.0097
Divorced 0.3574 0.4980 0.72 0.4730Female 0.0802 0.2701 0.30 0.7666
Low Income −0.5206 0.3304 −1.58 0.1151Medium Income −0.6953 0.3335 −2.08 0.0371
English Dominant 0.0720 0.4851 0.15 0.8819Less Than High School −0.5893 0.3548 −1.66 0.0967
High School −0.2398 0.3186 −0.75 0.4515
N 487Log-likelihood -202.45
χ2(19) 90.17
Significance levels : † : 10% ∗ : 5% ∗∗ : 1%
Table 7: Logit Regression Results of Voted on Family Capital

7 APPENDIX 33
Estimate Std. Error z value Pr(>|z|)(Intercept) −3.0999 1.0937 −2.83 0.0046
Years In United States 0.0956 0.0232 4.13 0.0000Authoritarian Family 1.1706 0.6415 1.82 0.0680
Years × Authoritarian −0.0892 0.0287 −3.10 0.0019Individuals under 18 in HH −0.2886 0.1143 −2.53 0.0116
Age 0.0337 0.0120 2.80 0.0052Assimilation Index −0.0242 0.0760 −0.32 0.7502
Democrat 1.2051 0.2749 4.38 0.0000Homeowner 0.0138 0.2891 0.05 0.9618
Identity: American 0.8878 0.2691 3.30 0.0010Identity: Country of Origin 0.6989 0.5006 1.40 0.1627
Identity: Latino 0.0044 0.3338 0.01 0.9895Married 0.9714 0.3147 3.09 0.0020
Divorced 0.5636 0.5066 1.11 0.2659Female 0.0849 0.2731 0.31 0.7558
Low Income −0.5444 0.3306 −1.65 0.0996Medium Income −0.7317 0.3296 −2.22 0.0264
English Dominant −0.1650 0.4759 −0.35 0.7287Less Than High School −0.6935 0.3651 −1.90 0.0575
High School −0.2055 0.3217 −0.64 0.5230
N 486Log-likelihood -199.27
χ2(19) 95.75
Significance levels : † : 10% ∗ : 5% ∗∗ : 1%
Table 8: Logit Regression Results of Voted on Authoritarian Family Type

7 APPENDIX 34
Estimate Std. Error z value Pr(>|z|)(Intercept) −0.3588 0.4751 −0.76 0.4502
Years In United States −0.0111 0.0083 −1.34 0.1790Authoritarian Family 0.3782 0.2035 1.86 0.0632
Years × Authoritarian −0.0029 0.0110 −0.27 0.7908Individuals under 18 in HH −0.0874 0.0483 −1.81 0.0706
Age 0.0153 0.0057 2.69 0.0071Assimilation Index −0.0119 0.0329 −0.36 0.7183
Democrat −0.3491 0.1310 −2.66 0.0077Homeowner −0.0310 0.1377 −0.23 0.8219
Identity: American 0.4841 0.1332 3.63 0.0003Identity: Country of Origin −0.3559 0.2742 −1.30 0.1944
Identity: Latino −0.0168 0.1671 −0.10 0.9198Married −0.2700 0.1325 −2.04 0.0416
Divorced −0.3820 0.2631 −1.45 0.1465Female 0.1229 0.1178 1.04 0.2968
Low Income 0.1146 0.1397 0.82 0.4124Medium Income 0.1535 0.1630 0.94 0.3464
English Dominant 0.0155 0.2651 0.06 0.9535Less Than High School 0.2100 0.1515 1.39 0.1657
High School 0.0538 0.1520 0.35 0.7232
N 433Log-likelihood -279.69
χ2(19) 37.24
Significance levels : † : 10% ∗ : 5% ∗∗ : 1%
Table 9: Logit Regression Results of Political Alienation on Family Authority