the educational impact of broadband sudsidies for schools under erate
TRANSCRIPT

Electronic copy available at: http://ssrn.com/abstract=2796048
THE EDUCATIONAL IMPACT OF BROADBAND SUBSIDIES
FOR SCHOOLS UNDER E-RATE
Thomas W. Hazlett,1 Ben Schwall
2 & Scott Wallsten
3,4
May 17, 2016
Abstract: The U.S. has spent over $25 billion to subsidize computer access in schools since the
1996 Telecommunications Act on the rationale that broadband Internet usage improves learning.
In 2013, President Barack Obama directed that, based on the successful experience of a school
district in North Carolina, annual E-Rate subsidies (as the program is called) be nearly doubled,
to about $4 billion. In this paper, we evaluate how federal expenditures correlate with students’
academic performance. Examining data from all North Carolina public high schools, 2000-2013,
we find no gain in student test results associated with Internet subsidy levels.
Key Words: E-Rate, broadband subsidies, educational policy, Internet access
1 H.H. Macaulay Endowed Professor of Economics, John E. Walker Department of Economics,
Clemson University. Contact: [email protected].
2 Graduate Student, John E. Walker Department of Economics, Clemson University. Contact:
3 Senior Fellow and Vice President for Research, Technology Policy Institute and Senior Fellow,
Georgetown Center for Business and Public Policy
4 The authors thank Katie Holba for outstanding research assistance.

Electronic copy available at: http://ssrn.com/abstract=2796048
Hazlett, Schwall & Wallsten Educational Impact of Broadband E-Rate Subsidies page | 2
Introduction
In 2013, President Obama cited a school district in Mooresville, North Carolina as
evidence that computers in the classroom could dramatically improve educational outcomes.5
Specifically, the district had issued each student a computer and saw higher test scores and
graduation rates. Assuming a causal relationship, the President used this as one of three examples
when promoting ConnectED—a policy initiative that would increase funding for school
connectivity by $1.5 billion annually to $3.9 billion. The proposal was adopted in 2014.6
ConnectED is only the most recent addition to federal funding for computers and
Internet in schools. The Telecommunications Act of 1996 required the FCC to establish the
Schools and Libraries Program, also known as E-Rate. The program has committed over $25
billion to public and non-profit private schools (See Figure 1), subsidizing broadband
connections, internal wiring, and networking equipment.7 Its funding comes from the Universal
5 ConnectED: President Obama’s Plan for Connecting All Schools to the Digital Age, White
House (June 6, 2013);
https://www.whitehouse.gov/sites/default/files/docs/connected_fact_sheet.pdf.
6 From 1998 through 2010, the program was capped at $2.25 billion annually. It was then
bumped up to $2.4 billion to adjust for inflation. See FCC (2014). For an explanation of how
the spending levels were originally set, pursuant to the 1996 Telecommunications Act, see
Furchtgott-Roth (2006).
7 Libraries also receive subsidies, but these constitute only a small fraction of the total
disbursements.

Hazlett, Schwall & Wallsten Educational Impact of Broadband E-Rate Subsidies page | 3
Service Fund (USF) tax, equal to 18.2% of telephone charges (in first quarter, 2016) identified as
“long distance.”
This spending represents one side of a longstanding public policy debate over the effect
of technology on education. While well-known politicians, from President Bill Clinton to former
Speaker of the House Newt Gingrich, have issued broad pronouncements about the importance
of digitizing classrooms, many educational experts have taken a less enthusiastic view.8 The
benefits of the subsidies may not be worth the costs, even ignoring the economic distortions
incurred to raise the funds, due to counter-productive results and competing opportunities for
educational resources.
Sometimes large expenditures on technology for education face problems typical of
public procurement. For example, recently, the Los Angeles public school system undertook a
$1.3 billion effort to give each teacher, administrator and 640,000 pupils an Apple iPad, pre-
loaded with educational software. The program almost instantly turned into what a Wired article
described as a “debacle,” an “ambitious plan [that] now looks like a spectacularly foolish one.”9
Assuming scalable initiatives could be done without that kind of logistical and planning
failure, the question remains as to whether network access at school can improve student
8 See the interesting historical review in Angrist & Lavy (2002).
9 Issie Lapowsky, What Schools Must Learn from LA’s iPad Debacle, WIRED (May 8, 2015);
http://www.wired.com/2015/05/los-angeles-edtech/; Lauren C. Williams, Big Settlement For
Los Angeles School District Over iPad Controversy, THINK PROGRESS (Sept. 30, 2015);
http://thinkprogress.org/education/2015/09/30/3707494/to-avoid-lawsuit-apple-opts-to-pay-los-
angeles-schools-4-million-for-ipad-controversy/.

Hazlett, Schwall & Wallsten Educational Impact of Broadband E-Rate Subsidies page | 4
performance. Existing research has yielded mixed results. Some studies find a positive effect on
learning outcomes,10
others a negative effect,11
and still others no effect.12
The seminal study evaluating the impact of technology in the classroom is probably
Angrist and Lavy (2002). They found that an Israeli initiative to install computers in elementary
and middle schools increased “computer-aided instruction,” but that increase did not translate
into higher test scores.13
Similarly, Goolsbee and Guryan (2006) found that E-Rate spending in
California increased the number of connected classrooms, but that connectivity did not translate
into higher test scores.14
10
For example, see Machin, S. McNally & O. Silva (2007); Barrow, Markman & Rouse (2009);
Li, Atkins & Stanton (2006); and Silva, Milkman & Badasyan (2014),
11 For example, Belo, Ferreria, and Telang (2014); Leuven, Lindahl,Oosterbeek, and Webbink
(2007).
12 Goolsbee & Guryan (2006).
13 Angrist and Levy (2002) were also among the first to address endogeneity by exploiting the
random nature the subsidies were distributed among schools and a two-stage regression model.
14 They examined the relationship between E-Rate subsidies and the number of classrooms that
were connected to the Internet, and the relationship between connected classrooms and
educational achievement increases. The study yielded a positive relationship between the
subsidies and connections—that is, E-Rate grants appeared to increase classroom broadband
penetration. At the same time, it found that the Internet deployment gains had no visible effect
on educational results as measured by the Stanford Achievement Test, which is administered to
every public school student in California.

Hazlett, Schwall & Wallsten Educational Impact of Broadband E-Rate Subsidies page | 5
Studies of programs in other countries found similarly discouraging results. Leuven, et
al (2007) found that a program in the Netherlands that subsidized computers, software, and
“language materials” had a negative effect on standardized test scores.15
They conclude that their
results, as well as other similar findings, suggest that “the robustness of this result suggests that
computer-aided instruction may after all be an inferior mode of teaching.” Belo, Ferreira, and
Telang (2014) found that higher levels of Internet usage are associated with lower scores on a
ninth-grade national exam in Portugal.
Contrarily, Machin, McNally, and Silva (2007) find that public spending on
Information and Communication Technology (ICT) in middle schools had a robustly positive
effect on English scores, a less robust positive effect on science scores, and no effect on math
scores.16
Barrow, Markman, and Rouse (2009), however, found that “a popular instructional
15
Leuven, et al (2007) explain that the program provided technology subsidies to schools in
which at least 70 percent of the students were “disadvantaged.” based on the number of students
classified as disadvantaged. The program provided a one-time subsidy of $90 per student in the
school to purchase computers, software, and language materials. They used a regression
discontinuity design to test the effects of the subsidies.
16 The authors used an instrumental variable method that exploits a policy change. The authors
argue that the positive effects they identified is the result of certain institutional foundations at
the school that allowed schools to make better use of the funding. In particular, they find larger
effects on English scores at schools with lower overall spending per student but “better
educational standards as measured by exam pass rates and truancy rates).”

Hazlett, Schwall & Wallsten Educational Impact of Broadband E-Rate Subsidies page | 6
computer program…is designed to improve pre-algebra and algebra skills”17
had a positive effect
on students’ performance.18
This paper analyzes the impact of E-Rate funding on educational achievement by
students in public high schools in North Carolina using data from 1999-2013. Our study most
closely follows Goolsbee & Guryan’s (2006) evaluation of E-Rate in California schools, but
differs in several ways. First, we do not track changes in classroom connectivity. This would not
prove so interesting, given that during our sample most of the schools began and finished the
period at 100% connectivity.19
Instead, we look at how E-Rate funding affected the ratio of
students per Internet-connected computer. Second, we use SAT scores (college entrance exams)
to gauge learning performance rather than the Stanford Achievement Test, which is not required
in North Carolina.20
Third, we examine how dollars per student affects test scores whereas
Goolsbee & Guryan focused on the discount schools received since subsidies pay a percentage of
the school’s computer and Internet expenditures.
17
Barrow and Rouse (2009), p.54.
18 Barrow, et al (2009) used a randomize study in which some classrooms used the program and
others used traditional teaching methods. They “hypothesize this effectiveness arises from
increased individualized instruction as the effects appear larger for students in larger classes and
in classes with high student absentee rate” (52).
19 More than 85% of our observations report that 100% of their classrooms are connected to the
internet.
20 North Carolina uses an end of year exam based for certain subjects that students are required
to take if they took the class. The number of classes that require such an exam vary year-to-year
throughout our data set.

Hazlett, Schwall & Wallsten Educational Impact of Broadband E-Rate Subsidies page | 7
After adjusting for demographic differences, we find that an additional dollar of E-Rate
subsidies has virtually no economic effect on average SAT test scores. And, where correlations
do exist, they are as likely to be negative as positive. These results support a skeptical view of
government E-rate subsidies.
How E-Rate Works
Schools receive E-Rate subsidies in the form of a discount on expenditures made by
educational institutions. As described by the Government Accountability Office, schools (or
districts) can apply annually for grants and, when they are awarded, the organizations “will
qualify for a discount of 20 to 90 percent on the cost of eligible service, based on indicators of
need.”21
Two categories of services are eligible. The first category includes telecommunications
services, such as wired and wireless data links, and Internet Service Provider (ISP) connections.
These funds are intended to bring Internet access to the school. The second category includes
costs associated with internal wiring, including “cabling, components, routers, switches, and
network servers” to distribute connections to classrooms and other facilities within the school.
The ConnectED program approved by the FCC in 2014 expanded this category to include
wireless local area network services such as Wi-Fi.22
21
Government Accountability Office, Telecommunications: FCC Should Assess the Design of
the E-Rate Program’s Internal Control Structure, GAO 10-908 (Sept. 2010), 4 (footnote
omitted).
22 Some school districts appear to interpret these categories broadly. The Montgomery County
(Maryland) Public School system has used E-Rate funds to purchase interactive whiteboards. As
the district noted in a 2012 memo, “Promethean Boards are the primary whiteboard components

Hazlett, Schwall & Wallsten Educational Impact of Broadband E-Rate Subsidies page | 8
In order to receive E-Rate funding, a school can apply to the USAC either by itself or it
can make the request as part of a district. When a district applies for funding, it must list the
schools that are receiving funding for the project on the application.23
The discount rate is then
calculated as a weighted average of the schools listed on the application. It is then strategic for
the district to include the poorer schools on its application. Furthermore, we expect that poorer
schools would be more likely to request more money in order to upgrade their technology. Since
the poorer schools are also more likely to perform poorly on the SAT exam, we will need to find
instrument for dollars per student.
Data
This study focuses on how E-Rate funding affects student's performance on SAT scores
for public high school students in North Carolina. North Carolina provides an ideal setting to
of interactive classroom technology systems which include other elements such as student
response units. MCPS began implementing an interactive technology initiative in school year
2008-2009, acquiring 2,600 board systems and installing them in about two-thirds of all
secondary classrooms. This initial phase was funded primarily by Federal E-rate reimbursement
and financed over several years. MCPS made the final payment on the secondary classroom
Promethean Boards in FYI2.” McGuire, Essie (Senior Legislative Analyst), “Memo to Education
Committee, Subject: Worksession – Special Appropriate to the FY13 Capital Budget….”
http://www.montgomerycountymd.gov/COUNCIL/Resources/Files/agenda/cm/2012/121105/201
21105_ED1.pdf (last accessed March 2, 2016).
23We primarily observe the districts filing the application. We do not observe which schools are
part any particular application for a district.

Hazlett, Schwall & Wallsten Educational Impact of Broadband E-Rate Subsidies page | 9
test the effects of E-Rate because of the copious data the state collects and makes publicly
available. North Carolina’s Department of Public Instruction (DPI), Public Schools of North
Carolina web page reports, by school, teacher characteristics, school characteristics such as the
percent of students eligible for the federal lunch program and the ratio of students per computer,
and SAT scores. We obtained data from the 2000-2001 school year through the 2012-2013
school year.
Specifically, we have data for all public North Carolina high schools and their student
performance from the 2000-2001 to the 2012-2013 school year. The data include 374 high
schools24
on average, during the sample period across 119 school districts. Table 1 shows
summary statistics for the relevant variables included in the data.
DPI also provides detailed school-level data on SAT scores, including the average
score for each SAT section,25
the number of students that took the exam, and the percentage of
eligible students that took the exam based on the student’s graduation date. Thus, the 2002 report
includes the most recent score of any student scheduled to graduate in 2002 regardless of when
the student took the exam. Table 2 shows summary statistics for SAT scores.
Meanwhile, data on E-Rate expenditures are available from the Universal Service
Administrative Company (USAC), which administers the USF, including E-Rate. While either a
school or a school district can receive funding, USAC generally reports data at the school district
24
There are 310 schools during the 2001-02 school year and the number increases to 435 for the
2012-13 school year.
25 The SAT consists of three sections: a math section, a comprehensive reading section, and a
written section (the written section was added in 2005). Each section is graded out of a possible
800 points.

Hazlett, Schwall & Wallsten Educational Impact of Broadband E-Rate Subsidies page | 10
level because it is nearly always the districts, rather than the individual schools, that apply for
and receive the funds. Thus, the school district becomes our smallest common unit of
aggregation and we aggregate the North Carolina data to the school district level in order to
combine it with the E-Rate data.
Figure 2 plots the mean of the SAT sections and E-Rate funding over time for
Mooresville, and Figure 3 plots the same information for North Carolina overall, excluding
Mooresville. The figures show that increasing E-Rate expenditures do not appear correlated with
changes in test scores in Mooresville or North Carolina more broadly. Nevertheless, to truly
determine whether E-Rate funds are correlated with performance requires controlling for school-
specific factors, like the level of poverty among the students that might also affect scores. We
discuss that analysis in the following section.
Empirical Analysis
We use the following model to estimate the relationship between E-Rate funding per
student and SAT scores:
ln(SATjt)=β0 + β1 Dollar/Studentdt + β2 needjt + β3 needjt2 + βXjt + γt +εjt, (1)
where ln(SATjt) takes the natural log of the various SAT scores (Math, CR, Written, MCR) for
school j in year t, Dollar/Studentdt is the E-Rate funding for district d divided by the total number
of student in the district, needjt is the percent of students at school j in year t that are eligible for
federal lunch program, Xjt is a vector of school characteristics that vary over time, and γt
accounts for time fixed effects.
One concern is that Dollars/Student might be endogenous because the district chooses
which schools to include on the application for funding. That is, if the district included only
poorly-performing schools on its application then we might find a negative correlation between

Hazlett, Schwall & Wallsten Educational Impact of Broadband E-Rate Subsidies page | 11
E-Rate funding and test scores, but the correlation would be due to selection bias, not the
subsidy. To correct this endogeneity, we follow Goolsbee and Guryan and construct an
instrument by calculating what the district's subsidy rate would have been if it had included all
schools within the district on application. That is, using all schools within the district to calculate
the subsidy rate should eliminate bias resulting from school self-selection.
We test whether Subsidy Rate for the district is a relevant instrument by regressing
Dollars Per Student on the Subsidy Rate while including our other regressors. Table 4 shows the
results for this test. We find that the Subsidy Rate is a relevant instrument.
Table 3 shows our econometric results. The estimated coefficient of primary interest is
that associated with the variable Dollars per Student. Column 1 presents the results for Math
Scores regression, Column 2 presents the results for Comprehensive Reading, Column 3 presents
those for the Written Section, and Column 4 for the Composition Score (Math + Comprehensive
Reading). We note that, as seen in Table 3, the estimated coefficient on Dollars/Student is
statistically significant for all four equations. When we interpret our coefficient for column 1, it
tells that holding all else constant, a one dollar increase in E-Rate spending per student in the
district decreases the average Math Score for a school by .0548% on average.26
While
statistically significant, the estimated effects are small: a twenty dollar increase per student (a
jump of about a third for the average school district in 2013) is associated with a decrease in the
average Math Score by about 1%.
Using the natural log of dollar per student as the policy variable of interest and
instrument for it still using the subsidy rate for the entire district, we find similar results (Table
26
We also run these specifications where the observations is at the district level. Our results are
similar with a slightly stronger effect on dollars/student.

Hazlett, Schwall & Wallsten Educational Impact of Broadband E-Rate Subsidies page | 12
4). The results are, again, statistically significant but tiny in magnitude. The interpretation for
our coefficient of interest for Column 1 would be that holding all else constant, a one percent
increase in E-Rate spending per student in the district decreases the average Math Score for a
school by .0291% on average
Table 5 uses the same empirical strategy except that we add a control for a time trend in
addition to the year fixed effects. Our results remain statistically significant but economically
modest. The interpretation for our coefficient of interest for Column 1 would be that holding all
else constant, a one percent increase in E-Rate spending per student in the district decreases the
average Math Score for a school by .0278% on average.
Finally, we take the analysis a step further to test an additional route through which E-
Rate might affect test scores. Although E-Rate funds cannot be used to purchase computers, it is
conceivable that better Internet access brought about by E-Rate funding could increase the
demand for computers by the school. If more computer use can improve test scores, then perhaps
E-Rate could indirectly improve scores if it induces the school to increase its student computer
usage. To test this hypothesis, we use an additional variable from the North Carolina school
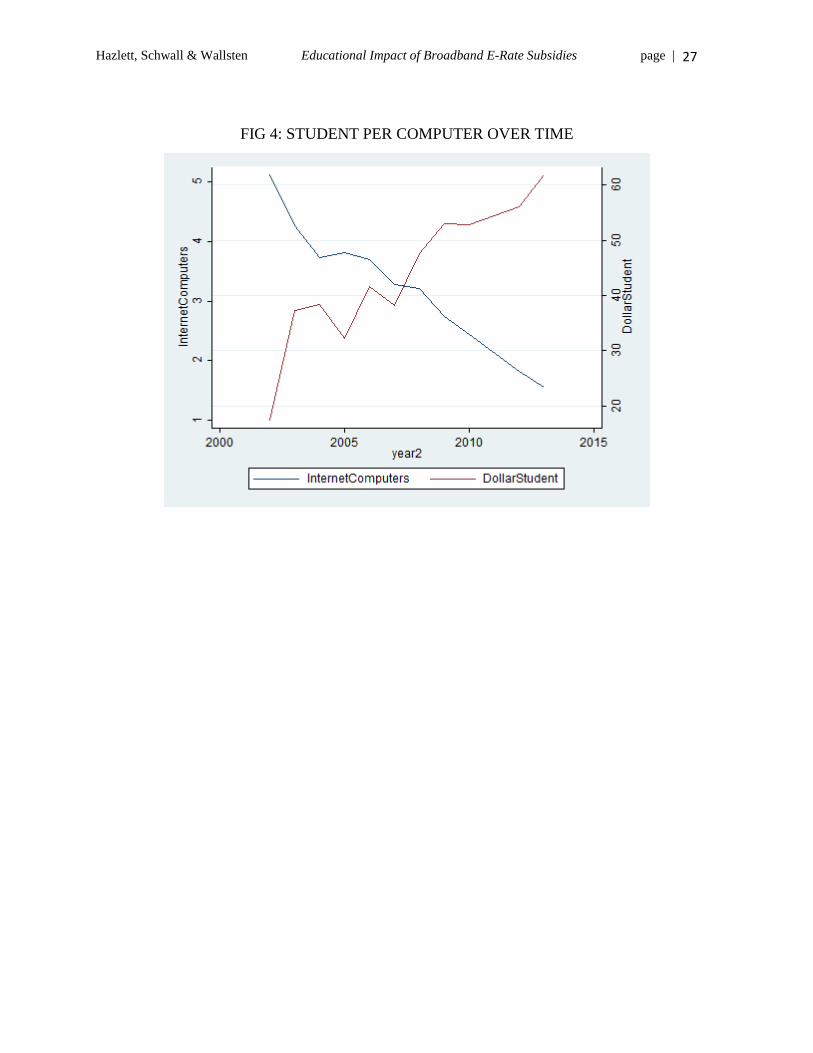
dataset: the number of Internet-connected computers per student. See Figure 4 which shows how
the mean number of students per Internet-connected computer changes over time.
In this case we have a two-stage model in which the first stage is the effect of E-Rate
spending on Internet-connected computers per student, and the second stage is the effect of the
number of Internet-connected computers per student on test scores:
(Stage 1) Students/InternetComputerjt=β0 + β1 Dollar/Studentdt + β4 needjt + β3 needjt2 + γt +εjt,
(Stage 2) ln(SATdt)=β0 + β1 𝑠𝑡𝑢𝑑𝑒𝑛𝑡𝑠/𝑖𝑛𝑡𝑒𝑟𝑛𝑒𝑡𝑐𝑜𝑚𝑝𝑢𝑡𝑒𝑟̂ dt + β2 needjt + β3 needjt
2 + βXjt + γt
+εjt,

Hazlett, Schwall & Wallsten Educational Impact of Broadband E-Rate Subsidies page | 13
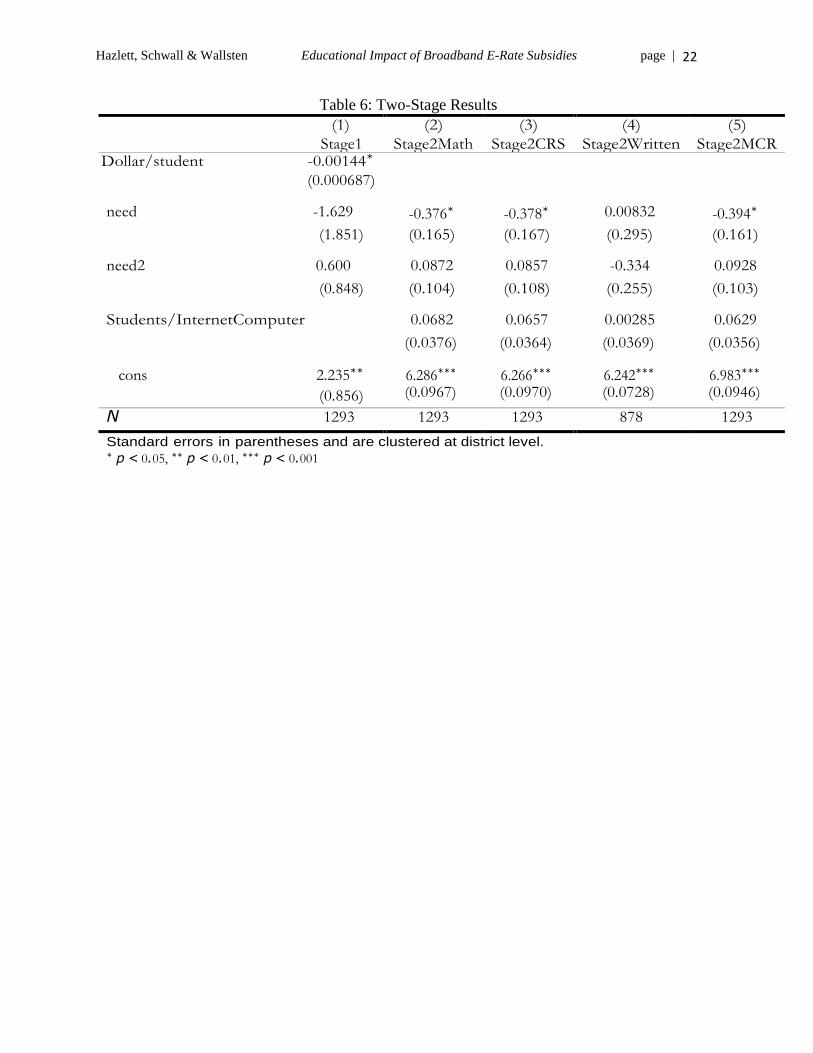
Table 6 presents the results for our two-stage model which examines how Students per
Internet-Connected Computer might affect outcomes. Column 1 presents the first stage results
which looks at how dollars per student affects the Students per Internet-Connected Computers.
Holding all else constant, a $100 increase in E-Rate funding per student in the district will
decrease the expected average number of students per Internet-Connect Computer by .144 (this is
about a 4% reduction compared to the mean). Stage 2 then looks at how the number of students
per Internet-Connected Computers affects the mean SAT school for the district by test section.
For the Math, Composite Reading, and the combined score, we find results that are significant at
about the 8% level. The results in Column 2 can be interpreted as holding all else constant, if the
number of students per Internet-Connect Computer increases by 1 student, then the expected
mean SAT Math score for the district will increase by 6.82 percent. In other words, if we hold
constant the number of students, then decreasing the number of computers connected to the
Internet will improve Math scores.
Table 7 shows the results if we instrument for Dollars per Student in the first stage using
the same instrumental variable as we did previously, the subsidy rate for the whole district. We
lose significance in the first stage as to whether an additional dollar per student in the district
affects the number of students per Internet-Connected computer. However, the results in the
second stage are marginally significant. The signs and magnitudes are similar.
CONCLUSION
Our results suggest that, contrary to the President’s claim, E-Rate has not improved
student performance, at least in North Carolina. We find that, after controlling for endogeneity,
increasing the amount of E-Rate funding that schools receive has no real impact on SAT test
scores.

Hazlett, Schwall & Wallsten Educational Impact of Broadband E-Rate Subsidies page | 14
The results are disappointing given that the $25 billion investment does not appear to
have paid off. The disappointment in the lack of a return is intensified by two additional reasons.
First, the subsidies are the result of 18.2% tax on certain telephone charges. In addition to the
economic distortion created by the tax, this tax is worse than most due to its regressive nature—
everyone pays the same percentage regardless of their means.27
Given that our results show that
increasing E-Rate funding has no impact on SAT scores, it seems logical that the money could
be better spent on other educational reforms that might improve student performance.
Second, President Obama’s ConnectED program is expanding the E-Rate program. The
ConnectED program calls to almost double the $2 billion the FCC spends on connecting schools
and libraries to the internet along with substantial investment in teacher training and software
development. The expansion of the E-Rate program seems to contradict the “evidence-based
policy” bill that President Obama signed into law28
as there is no evidence that E-Rate spending
improves any performance measure for students. It seems prudent that the government would
develop a program that evaluates performance to ensure that the money delivers on what is being
promised. Otherwise, the government will continue to spend billions of dollars without receiving
anything in return. The Government Accountability Office has been making this point for years.
(See GAO report in 2005, 2009, and 2010.)
27
Jerry Hausman, Efficiency Effects on the U.S. Economy from Wireless Taxation, 53
NATIONAL TAX JOURNAL 733 (2000), p. 735.
28 H.R. Bill 1831, signed March 30, 2016.
Hazlett, Schwall & Wallsten Educational Impact of Broadband E-Rate Subsidies page | 15
References
Angrist, J. and Levy, V., 2002. New evidence on classroom computers and pupil learning. The
Economic Journal. 112, 735-765.
Barrow, L., L. Markman, and C. E. Rouse. Technology’s Edge: The Educational Benefits of
Computer-Aided Instruction. American Economic Journal: Economic Policy, 1, 2009,
52-74.
Belo, R., Ferreira, P. and Telang, R., 2014. Broadband in School: Impact on Student
Performance. Management Science. 60: 265-282.
FCC. 2014. Federal Communications Commission, FCC Continues E-Rate Reboot to Meet the
Needs of 21st Century Digital Learning: Funding Boost Will Enable Schools, Libraries
Nationwide to Reach Connectivity Goals over the Next Five Years, Press Release (Dec.
11).
Furchtgott-Roth, Harold. 2006. A TOUGH ACT TO FOLLOW: THE TELECOMMUNICATIONS ACT OF
1996 AND THE SEPARATION OF POWERS (Washington, D.C.: AEI Press).
Goolsbee, A. and Guryan, J., 2006. The impact of internet subsidies in public schools. Review of
Economics and Statistics. 88, 336-347.
Hausman, J. Efficiency Effects on the U.S. Economy from Wireless Taxation, 53 NATIONAL
TAX JOURNAL 733 (2000).
Leuven, E., Lindahl, M., Oosterbeek, H. and Webbink, D. The Effect of Extra Funding for
Disadvantaged Pupils on Achievement. Review of Economics and Statistics 2007 89:
721-736.

Hazlett, Schwall & Wallsten Educational Impact of Broadband E-Rate Subsidies page | 16
Li, X., M. S. Atkins, and B. Stanton. Effects of Home and School Computer Use on School
Readiness and Cognitive Development among Head Start Children: A Randomized
Controlled Pilot Trial. Merrill-Palmer Quarterly, 52, 2006, 239-263.
Machin, S., McNally, S., and Silva, O., 2007. New technology in schools: Is there a payoff?. The
Economic Journal. 117: 1145-1167.
Silva, S, Milkman, M. and Badasyan, N., The Impact of Brazils 'Broadband at School Program'
on Student Achievement (March 24, 2014). 2014 TPRC Conference Paper. Available at
SSRN: http://ssrn.com/abstract=2413976.
Telecommunications: Greater Involvement Needed by FCC in the Management and Oversight of
the E-Rate Program. GAO-05-151: Published: Feb 9, 2005. Publicly Released: Mar 16,
2005.
Telecommunications: Long-Term Strategic Vision Would Help Ensure Targeting of E-rate
Funds to Highest-Priority Uses. GAO-09-253: Published: Mar 27, 2009. Publicly
Released: Apr 27, 2009.
Telecommunications: FCC Should Assess the Design of the E-rate Program's Internal Control
Structure. GAO-10-908: Published: Sep 29, 2010. Publicly Released: Oct 29, 2010.

Hazlett, Schwall & Wallsten Educational Impact of Broadband E-Rate Subsidies page | 17
Table 1: Basic School Summary Statistics
Variable Obs Mean Std Dev.
Size 4634 973.81 552.10
Graduation Rate 4048 82.79 11.40
Crime (Incident per 100 students) 4315 1.4 1.18
Attendance 4632 94.3 2.56
Books Per Student 4574 12.39 37.45
Student Per Computer 4602 3.27 29.29
Student Per Internet Computer 4583 3.34 12.22
Classroom Connected (Percent) 4310 97.36 13.41
Fully Licensed 4630 88.66 9.07
Fraction of White Students* 1737 .61 .23
Fraction of Black Students* 1737 .29 .22
Fraction of Hispanic Students* 1737 .074 .072
Fraction of Asian Students* 1737 .013 .018
Note: * indicates that the variable was only available at the district level.

Hazlett, Schwall & Wallsten Educational Impact of Broadband E-Rate Subsidies page | 18
Table 2: SAT Summary Statistics
*Percent tells us the percentage of seniors who took the SAT.
Variable Obs Mean Std Dev
Number Tested 4342 123.2736 110.3148
Percent* 4330 56.02993 16.14301
Math 4298 494.859 39.30289
CR Score 4298 478.8623 38.84394
Written 3040 459.4217 38.61251
M+CR 4293 973.1263 76.48818
M+CR+W 2361 1427.678 117.9723

Hazlett, Schwall & Wallsten Educational Impact of Broadband E-Rate Subsidies page | 19
Table 3: Main Regression Result
(1) IVMath4
(2) IVCRS4
(3) IVWritten4
(4) IVMCR4
E-Rate Dollars per student
-0.000548∗∗∗ (0.000147)
-0.000420∗∗ (0.000132)
-0.000436∗∗ (0.000139)
-0.000491∗∗∗ (0.000136)
Need -0.000300 -0.000329 -0.0000471 -0.000257
(0.000549) (0.000492) (0.000591) (0.000505)
Need2 -0.0000231∗∗∗
(0.00000561) -0.0000242∗∗∗
(0.00000543) -0.0000264∗∗∗
(0.00000608) -0.0000240∗∗∗
(0.00000536)
Percent 0.000516∗∗
(0.000179) 0.000812∗∗∗
(0.000168) 0.000932∗∗∗
(0.000179) 0.000677∗∗∗
(0.000166)
Cons 6.211∗∗∗
(0.0163) 6.163∗∗∗
(0.0151) 6.174∗∗∗
(0.0198) 6.878∗∗∗
(0.0151)
Year FE Y Y Y Y
N 3753 3753 2576 3749
Standard errors in parentheses and are clustered at the school level.
∗ p < 0.05, ∗∗ p < 0.01, ∗∗∗ p < 0.001

Hazlett, Schwall & Wallsten Educational Impact of Broadband E-Rate Subsidies page | 20
Table 4: Regression Results-Log Dollars Per Student
(1)
IVMath4
(2)
IVCRS4
(3)
IVWritten4
(4)
IVMCR4 log(E-Rate Dollars per
Student) -0.0291∗∗∗
(0.00761)
-0.0223∗∗
(0.00692)
-0.0248∗∗
(0.00773)
-0.0261∗∗∗
(0.00709)
Need -0.000106 -0.000180 0.0000308 -0.0000811
(0.000556) (0.000499) (0.000595) (0.000512)
Need2 -0.0000259∗∗∗
(0.00000553)
-0.0000263∗∗∗
(0.00000538)
-0.0000275∗∗∗
(0.00000604)
-0.0000266∗∗∗
(0.00000529)
Percent 0.000535∗∗
(0.000177)
0.000827∗∗∗
(0.000168)
0.000924∗∗∗
(0.000180)
0.000694∗∗∗
(0.000165)
Cons 6.269∗∗∗
(0.0220)
6.208∗∗∗
(0.0209)
6.241∗∗∗
(0.0317)
6.931∗∗∗
(0.0206)
Year FE Y Y Y Y
N 3753 3753 2576 3749
Standard errors in parentheses and are clustered at the school level.
∗ p < 0.05, ∗∗ p < 0.01, ∗∗∗ p < 0.001

Hazlett, Schwall & Wallsten Educational Impact of Broadband E-Rate Subsidies page | 21
Table 5: Regression Results with Time Trends
(1)
IVMath4
(2)
IVCRS4
(3)
IVWritten4
(4)
IVMCR4 Need -0.00278∗∗∗
(0.000173)
-0.00277∗∗∗
(0.000168)
-0.00270∗∗∗
(0.000175)
-0.00275∗∗∗
(0.000166)
Percent 0.000438∗
(0.000182)
0.000714∗∗∗
(0.000173)
0.000840∗∗∗
(0.000184)
0.000588∗∗∗
(0.000171)
Time 0.00478∗∗∗
(0.000494)
0.00562∗∗∗
(0.000484)
0.00134∗
(0.000599)
0.00520∗∗∗
(0.000469)
logDollar -0.00653∗∗
(0.00217)
-0.00689∗∗∗
(0.00201)
-0.00826∗∗∗
(0.00245)
-0.00703∗∗∗
(0.00200)
Cons 6.270∗∗∗
(0.0138)
6.224∗∗∗
(0.0131)
6.226∗∗∗
(0.0155)
6.940∗∗∗
(0.0129)
Year FE Y Y Y Y
N 3753 3753 2576 3749
Standard errors in parentheses and are clustered at school level.
∗ p < 0.05, ∗∗ p < 0.01, ∗∗∗ p < 0.001
Hazlett, Schwall & Wallsten Educational Impact of Broadband E-Rate Subsidies page | 22
Table 6: Two-Stage Results
(1)
Stage1
(2)
Stage2Math
(3)
Stage2CRS
(4)
Stage2Written
(5)
Stage2MCR Dollar/student -0.00144∗
(0.000687)
need -1.629 -0.376∗ -0.378∗ 0.00832 -0.394∗
(1.851) (0.165) (0.167) (0.295) (0.161)
need2 0.600 0.0872 0.0857 -0.334 0.0928
(0.848) (0.104) (0.108) (0.255) (0.103)
Students/InternetComputer 0.0682 0.0657 0.00285 0.0629
(0.0376) (0.0364) (0.0369) (0.0356)
cons 2.235∗∗
(0.856)
6.286∗∗∗
(0.0967) 6.266∗∗∗
(0.0970) 6.242∗∗∗
(0.0728) 6.983∗∗∗
(0.0946)
N 1293 1293 1293 878 1293
Standard errors in parentheses and are clustered at district level.
At the district
level
∗ p < 0.05, ∗∗ p < 0.01, ∗∗∗ p < 0.001

Hazlett, Schwall & Wallsten Educational Impact of Broadband E-Rate Subsidies page | 23
Table 7: Two-Stage Regression Results with IV
(1)
Stage1
(2)
Stage2Math
(3)
Stage2CR
S
(4)
Stage2Written
(5)
Stage2MCR
Dollarperstudent -0.0242
(0.0136)
need 5.535 -0.472 -0.465 0.0451 -0.474
(4.384) (0.297) (0.304) (0.0981) (0.317)
Need2 -0.948 0.103 0.0952 -0.372∗∗∗ 0.101
(2.162) (0.270) (0.277) (0.0788) (0.288)
Students/InternetComputer 0.00464∗∗ 0.00473∗ 0.0000753 0.00458∗∗
(0.00165) (0.00202) (0.000650) (0.00166)
cons 0.112 6.426∗∗∗ 6.399∗∗∗ 6.239∗∗∗ 7.109∗∗∗
(1.349) (0.0723) (0.0736) (0.0293) (0.0782)
N 1293 1524 1524 898 1524
Standard errors in parenthesis. Standard errors were bootstrapped. ∗ p < 0.05, ∗∗ p < 0.01, ∗∗∗ p < 0.001

Hazlett, Schwall & Wallsten Educational Impact of Broadband E-Rate Subsidies page | 24
FIG. 1: E-RATE FUNDING BY YEAR
Source: USAC annual reports 1999-2014.
Note: The first column provides the total amount that was committed for the first two years.
The report did not provide specific breakdown of payments for those years.

Hazlett, Schwall & Wallsten Educational Impact of Broadband E-Rate Subsidies page | 25
FIG 2: MOORESVILLE SAT SCORES AND E-RATE FUNDING

Hazlett, Schwall & Wallsten Educational Impact of Broadband E-Rate Subsidies page | 26
FIG 3: NORTH CAROLINA AVG. SAT AND E-RATE FUNDING (EXCLUDING
MOORESVILLE)
Hazlett, Schwall & Wallsten Educational Impact of Broadband E-Rate Subsidies page | 27
FIG 4: STUDENT PER COMPUTER OVER TIME