the education of pre-service primary school … education of pre-service primary school teachers for...
TRANSCRIPT

The education of pre-service primary school teachers for teaching physics as part of the science curriculum in Slovenia
Jerneja Pavlin and Mojca Čepič University of Ljubljana, Faculty of Education
Abstract The curriculum of primary education in Slovenia includes a substantial part of science topics, which are being taught already in the nursery school. Therefore, teaching science in primary schools is very important. The primary school teachers in Slovenia are required to finish a 5-year study programme at the Faculty of Education. In the course of study, they take some science classes (separate subjects: physics, chemistry and biology) intertwining with a didactics of science. The science subjects are considered difficult by the Slovenian pre-service primary teachers. The science curricula for pupils of age 6–10 in Slovenia prescribe that pupils should assimilate the following physics concepts: heat, temperature, density, viscosity, electricity, shadows, weather, movement of liquids, and several other concepts. It is evident that in order to teach the gifted knowledge-seeking pupils and weak pupils, a primary school teacher should obtain substantial knowledge in physics. The article focuses on the teaching module related to the concepts of heat and temperature for the pre-service primary teachers and its evaluation. The results of the pilot pre-post study without a control group performed in spring 2014 demonstrated the impact of the teaching module and confirmed the findings of several authors regarding the difficulties in understanding the content delivered in the module. The results also suggested guidelines for further research. Keywords Primary school teaching, heat and temperature, experiments, conceptual understanding The education of Slovenian primary school teachers A child is enrolled in a compulsory primary school at age of 6 in Slovenia. The compulsory primary school has 9 grades (Figure 1), which correspond to the primary level (grades 1–5) and lower secondary level (grades 6–9) in other countries. The Council of Experts for General Education in Slovenia approves the national curricula and determines the subjects and syllabuses. The teaching methods and textbooks are freely chosen by the teachers. After they finish primary school, the students enter vocational secondary schools, specialized technical schools or high schools. A high school in Slovenia is called gimnazija (Eng. gymnasium), which is similar to countries influenced by the German and Russian education system. The secondary school students gain their qualification after they pass the final exam successfully: the master craftsmen examination, the vocational matura (an English equivalent would be the A-level exams), or the general matura exam. The students who pass the general matura are eligible to enter higher education programmes. There are four universities in Slovenia. The higher education in Slovenia comprises three levels. The first level includes higher professional

programmes (polytechnics) and academic (university) programmes, the second level includes master’s programmes, and the third level includes doctoral programmes. The teachers in Slovenia generally finish a 5-year study programme. The Slovenian primary school teachers finish the programme called Primary school teaching at Faculty of Education. The primary school teachers in Slovenia can teach all subjects from the 1st to the 5th grade in primary school. The knowledge spectrum of the primary school teachers is considered wide, because it covers Slovenian, mathematics, natural and social sciences, music, physical education, arts, home economics, and English. On some occasions, schools may decide that sports, arts, music, and English are taught by teachers who are specialists in these subjects. The pupils’ first encounter with science, i.e. physics, is in the course of two subjects: Environmental Studies (grade 1–3) and Science and Technology (grade 4–5). The quality of teaching depends on the teachers that are required to possess good understanding of scientific concepts and the didactics of science. They have to be skilled in experimental work appropriate for younger students. Thus, the lecturer is responsible to ensure the adequate level of skills.
Figure 1. The education system in Slovenia. The primary school teachers in Slovenia finish 5 years study programme at the Faculty of Education. They are eligible to teach in primary schools from the 1st to the 5th
grade. The physics contents are included in the subjects Environmental Studies and Science and Technology (Edufile, 2014).
In the course of study, the pre-service primary school teachers in Slovenia take science classes (separate subjects: physics, chemistry, and biology) intertwining with the didactics of science. Each science subject has 30 hours of lectures, 21 hours of laboratory work, 5 hours of seminars and 4 hours of field work. The intertwined didactics of science includes 8 hours of lectures and 7 hours of laboratory exercises are planned for the physics part.

The Environmental Studies and Science and Technology curricula prescribe a lot of practical work and skills development. The aim of the physics classes in the Primary school teaching programme is to ensure that students are able to understand and apply knowledge to achieve the curricular goals in the first five years of primary school. The students should also understand the basic laws of physics and be able to develop and implement experimental and other activities. This suggests that the teachers need to demonstrate these competencies and develop them at practical experimental work in the course of study. The students require time to comprehend the physics concepts and their understanding of physics is enhanced by experimental experience. For this reason, we developed a set of simple hands-on experiments that support the basic physics concepts studied at the university level, which may also be adapted for future work in primary schools. In physics classes, the students attending the Primary school teaching programme are acquainted with the following contents in line with the physics part of the syllabus for Environmental Studies subject and subject Science and Technology: scientific method, basic operational procedures, measurements, mechanics, liquids, sound, thermodynamics, electricity and magnetism, light and colours, astronomy, and weather. The topics are explained at a qualitative and semi-quantitative level. Several laboratory experiments are prepared for the following topics: basic operational procedures, measurements, heat and temperature, light, electricity and magnetism, and weather. This paper discusses the activities related to thermodynamics and their evaluation. The most common misconceptions are examined as well. Understanding heat and temperature Several studies reported that the concepts of heat and temperature are still considered difficult to understand at all levels of education (Carlton, 2000; Erickson, 1979; Jara-Guerrero et al., 1993; Jasien and Oberem, 2002; Nottis et al., 2009). Our practical experience confirms this finding as well. Thomaz et al. (1995) summarize five common misconceptions related to heat and temperature: (i) heat is a kind of a substance stored in the objects and it can move; (ii) students are not able to differentiate between heat and temperature (temperature is considered a measure of heat); (iii) the confusion between temperature and the feeling of warmth for an object and students are not aware of the concept of thermal equilibrium; (iv) the application of heat to a body always results in a rise in temperature, and (v) the temperature of a phase transition is the highest temperature of the substance when it is heated. Albert (1978) reports that eight-year pupils describe heat as something dynamical that flows. The concept of treating heat as a flux between bodies appears at a later stage. The monograph entitled The Kind of Motion We Call Heat Brush (1986) presents misconceptions related to heat as a substance, something like air or stream, which could be added or removed from an object, similar to the caloric theory of heat held by scientists in 8th century. Most students are not able to differentiate between heat and temperature and they tend to use the terms heat and temperature as synonyms (Başer, 2006; Pathare and Pradham, 2005). This was also confirmed by the study of Prince and Vigeant (2006) suggesting that many undergraduate students of mechanical engineering treat heat and temperature as equivalent entities. While describing heat

and temperature student descriptions contain phrases such as “Heat is the energy of a hot substance” and “Temperature is a measure of heat”. Furthermore, many of them describe temperature as a measure of how hot or cold an object feels (Carlton, 2000). A number of students believe that heating up an object always increases the temperature of the object (Yeo and Zadnik, 2001). At this point, the experiments involving phase transitions are to be conducted in order to raise awareness that the heating results in an increase of temperature or in phase transition. However, it is very difficult to rift many of the robust misconceptions during traditional lecturing approach (Nottis et al., 2009). Teaching module related to the concepts of heat and temperature Considering the curriculum for the physics part of science classes for pre-service primary school teachers in Slovenia and previously described misconceptions, a teaching module related to the concepts of heat and temperature was designed. The module includes 4 hours of lectures and 4 hours of experimental work in the course of laboratory exercises. The contents and activities of the module were carefully chosen. They also encompass the aims of the primary school curricula for Environmental Studies and Science and Technology (Kolar et al., 2011; Vodopivec et al., 2011). The aims are as follows: (i) primary school students describe the properties of substances before and after heating; (ii) they predict a change in the properties after heating and re-cooling of certain substances; (iii) they find out that metals conduct heat well; (iv) they know that heat flows from hot to cold objects; (v) they start to distinguish between heat and temperature: when a thermometer is heated, it receives heat, the liquid level in the thermometer rises until the thermal equilibrium is reached and the temperature of the thermometer is equal to the temperature of the substance; (vi) they measure the temperature; (vii) they use the thermometer; (viii) they learn that different substances conduct heat differently; and, (ix) they are familiar with the importance of thermal isolators (Kolar et al., 2011; Vodopivec et al., 2011). For this reason, the following contents are discussed and demonstrated with the experiments during the lectures for the pre-service primary school teachers in Slovenia: the meaning of terms hot and cold; temperature as a property; reasons for temperature changes, e.g. heating, cooling, and mechanical work; thermal conductivity; and phase transitions. During the laboratory exercises, the pre-service primary school teachers gain practical experimental experience they can relate to the concepts explained. They attempt to: a) measure the temperature of the water with fingers and thermometers; b) explore the necessary conditions required to measure the temperature; c) explore the operating principle of various thermometers; d) familiarise themselves with heat conductors and isolators as well as with heat flow; e) draw the graphs of the temperature as a function of time and read the data from them. The experiments covering the aims listed are shortly described below. In the introductory experiment, the students explore the process of measuring the temperature by using their fingers (Figure 2). The aim of the experiment is to demonstrate why senses are not appropriate instruments for measuring temperature. Then the students carry out an experiment where they put their left forefinger in the glass with cold water and the right forefinger in the glass with hot water and wait for about 20–30 seconds. Afterwards, they simultaneously put both fingers in a glass with lukewarm water. They discuss the feelings (senses) and the results of the estimation of the temperature.

Figure 2. Measuring the temperature of hot (right), cold (left), and lukewarm (middle) water using fingers. The following experiment is the next logical step in the laboratory exercises, because it leads the students to the knowledge about the thermometers and conditions required to measure the temperature. At this point, the students need to learn how to differentiate between heat and temperature. A thermometer relies on the variation of the thermometric property, e.g. length, colour, resistance (Figure 3). The variation of the property is monitored and the measurement of this property (length for instance) is related to the temperature. The students attempt to use different thermometers as well as describe and explain what happens while measuring the temperature using the laws of thermodynamics. They learn when and how to read the temperature from the thermometer and explore the conditions required to measure the temperature of an object.
Figure 3. Various example thermometers: resistance, alcohol, and liquid crystal thermometers. The approach of teaching the students that different substances conduct heat differently and helping them understand the importance of thermal isolators is covered in the activity related to the following experiment. In the experiment, the students are required to arrange plates of different materials from the coldest to the warmest (Figure 4). In this regard, we intentionally avoided using the term temperature. Then the temperature of the plates is discussed and, finally, it is measured by an IR thermometer. The students once again realize that senses are not reliable when measuring temperature. Finger sensors for temperature are relatively correct, but finger temperatures vary if the finger is in contact with a good cold thermal conductor compared to contact with an insulator. To illustrate that this phenomenon is related to thermal conductivity, ice cubes are placed on the plates and the melting process is observed and compared. At this point, the concepts of heat flow and thermal conductivity are discussed in detail.
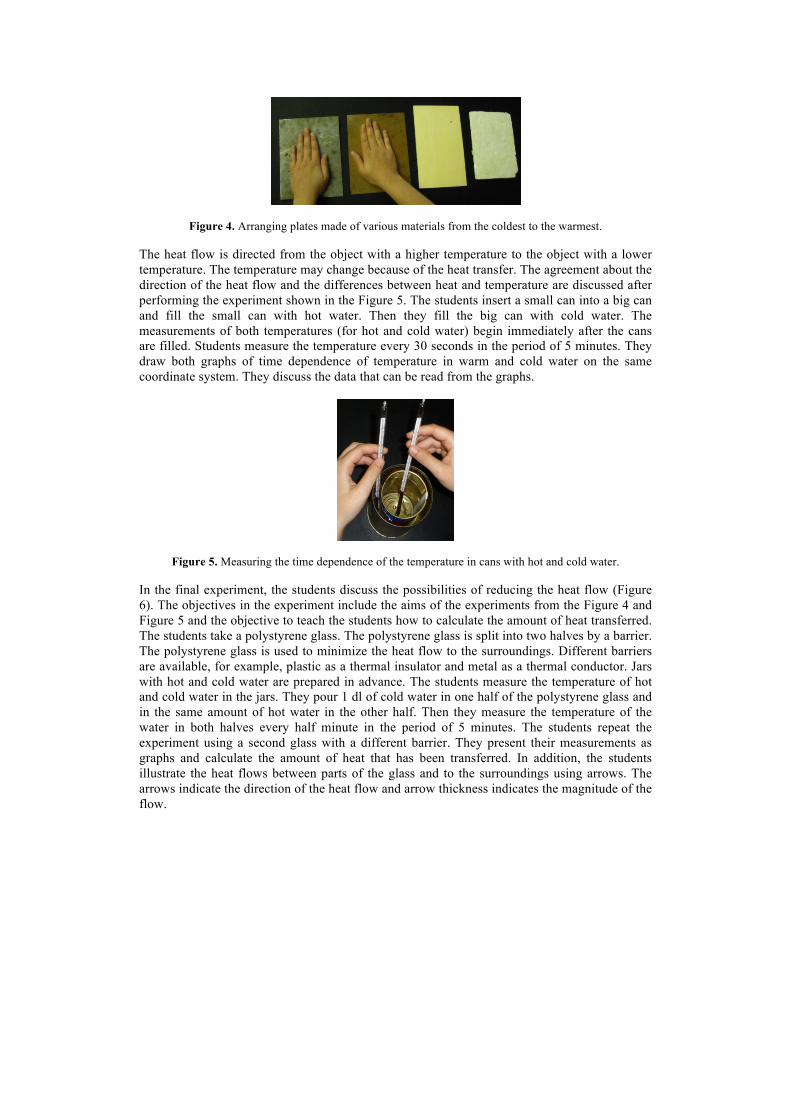
Figure 4. Arranging plates made of various materials from the coldest to the warmest. The heat flow is directed from the object with a higher temperature to the object with a lower temperature. The temperature may change because of the heat transfer. The agreement about the direction of the heat flow and the differences between heat and temperature are discussed after performing the experiment shown in the Figure 5. The students insert a small can into a big can and fill the small can with hot water. Then they fill the big can with cold water. The measurements of both temperatures (for hot and cold water) begin immediately after the cans are filled. Students measure the temperature every 30 seconds in the period of 5 minutes. They draw both graphs of time dependence of temperature in warm and cold water on the same coordinate system. They discuss the data that can be read from the graphs.
Figure 5. Measuring the time dependence of the temperature in cans with hot and cold water. In the final experiment, the students discuss the possibilities of reducing the heat flow (Figure 6). The objectives in the experiment include the aims of the experiments from the Figure 4 and Figure 5 and the objective to teach the students how to calculate the amount of heat transferred. The students take a polystyrene glass. The polystyrene glass is split into two halves by a barrier. The polystyrene glass is used to minimize the heat flow to the surroundings. Different barriers are available, for example, plastic as a thermal insulator and metal as a thermal conductor. Jars with hot and cold water are prepared in advance. The students measure the temperature of hot and cold water in the jars. They pour 1 dl of cold water in one half of the polystyrene glass and in the same amount of hot water in the other half. Then they measure the temperature of the water in both halves every half minute in the period of 5 minutes. The students repeat the experiment using a second glass with a different barrier. They present their measurements as graphs and calculate the amount of heat that has been transferred. In addition, the students illustrate the heat flows between parts of the glass and to the surroundings using arrows. The arrows indicate the direction of the heat flow and arrow thickness indicates the magnitude of the flow.
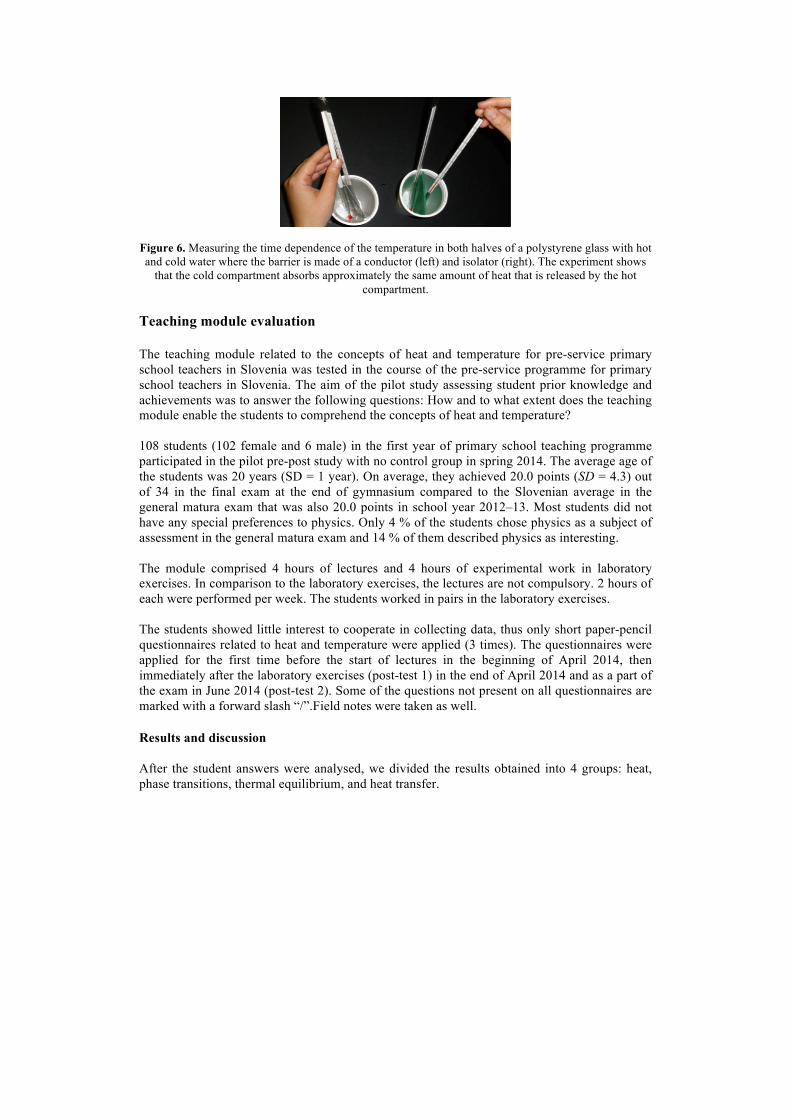
Figure 6. Measuring the time dependence of the temperature in both halves of a polystyrene glass with hot and cold water where the barrier is made of a conductor (left) and isolator (right). The experiment shows
that the cold compartment absorbs approximately the same amount of heat that is released by the hot compartment.
Teaching module evaluation The teaching module related to the concepts of heat and temperature for pre-service primary school teachers in Slovenia was tested in the course of the pre-service programme for primary school teachers in Slovenia. The aim of the pilot study assessing student prior knowledge and achievements was to answer the following questions: How and to what extent does the teaching module enable the students to comprehend the concepts of heat and temperature? 108 students (102 female and 6 male) in the first year of primary school teaching programme participated in the pilot pre-post study with no control group in spring 2014. The average age of the students was 20 years (SD = 1 year). On average, they achieved 20.0 points (SD = 4.3) out of 34 in the final exam at the end of gymnasium compared to the Slovenian average in the general matura exam that was also 20.0 points in school year 2012–13. Most students did not have any special preferences to physics. Only 4 % of the students chose physics as a subject of assessment in the general matura exam and 14 % of them described physics as interesting. The module comprised 4 hours of lectures and 4 hours of experimental work in laboratory exercises. In comparison to the laboratory exercises, the lectures are not compulsory. 2 hours of each were performed per week. The students worked in pairs in the laboratory exercises. The students showed little interest to cooperate in collecting data, thus only short paper-pencil questionnaires related to heat and temperature were applied (3 times). The questionnaires were applied for the first time before the start of lectures in the beginning of April 2014, then immediately after the laboratory exercises (post-test 1) in the end of April 2014 and as a part of the exam in June 2014 (post-test 2). Some of the questions not present on all questionnaires are marked with a forward slash “/”.Field notes were taken as well. Results and discussion After the student answers were analysed, we divided the results obtained into 4 groups: heat, phase transitions, thermal equilibrium, and heat transfer.

The first task the students were required to perform was to describe the concept of heat. The most common student answers related to heat are presented in Table 1. In the pre-test, 40 % of students wrote that heat is a type of energy and 13 % of students wrote that heat tells us how hot or cold the object is. In the post-test 1, the percentage of students who related heat to hot and cold object was lower (5 %), while the percentage of students who wrote that the heat is a type of energy increased to 44 %. Heat is energy, which was transferred from an object with higher temperature to an object with lower temperature, wrote 29 % of the students in the post-test 1 compared to only 7 % in the pre-test. The second set of tasks was related to the temperature of the phase transitions and graphs. The two tasks were very similar, because the students were required to draw a graph illustrating the time dependence of temperature for the experiment described. The experiments conducted were as follows: (i) a student puts a thermometer in 1 l of tap water in the bowl and heat it for an hour; (ii) the student puts the thermometer in bowl with a mixture of ice and water for one hour. The percentage of students who drew the graphs correctly for the experiment (ii) was higher in the pre-test compared to the post-test 1 (Table 2),. In part, this may be attributed to the fact that students were not willing to fill in the questionnaires. However, the percentage of students who draw the graphs correctly in the exam was the highest (about 50 %). The most common mistakes were an unmarked axis and straight line drawn without realizing that phase transition appears at a certain temperature and it is determined by the substance. The straight line as a graph partly confirms the findings of Thomaz et al. (1995) that the application of heat to a body always results in a rise in temperature. These results correlate to Carlton’s study (2000) reporting that many students are unwilling to accept that solid ice, melting ice, and liquid water can all exist at the same well-defined temperature. The opposite task where students are required to read the melting point of the mixture seems easier for students, because 87 % of them read the information from the graph correctly.
Table 1. Percentage of students who described heat as: a) something related to how hot or cold objects are; b) as energy; and c) as energy that spontaneously flows from a higher temperature to a lower.
Description
of heat Hot and cold
objects Energy Energy +
transfer Th à Tl
Pre-test 13 % 40 % 7 % Post-test 1 5 % 44 % 29 %
Table 2. Percentage of students who correctly drew the temperature shown on a thermometer, put it in
melting water and boiling water and read the melting point of the substance from the graph.
Graphs Melting ice Heating of water
Reading the melting point
Pre-test 22 % 38 % / Post-test 1 22 % 31 % / Post-test 2 49 % 46 % 87 %

When do objects achieve thermal equilibrium? Thermodynamic equilibrium is achieved when there is no heat flow. This helps define the temperature. Laypersons usually relate thermodynamic equilibrium to the equal temperature of the objects. Table 3 shows that 44 % of students in the post-test 1 wrote that 2 objects are in the thermal equilibrium if they have equal temperature, while 28 % of students also added that there is no transfer of heat. While the thermometer is in the room, it maintains thermal equilibrium with the surroundings. The sketch of the graph time dependence of the temperature in this case was an easy task for students, because 98 % of students draw it correctly in the post-test 2. Carlton (2000) found out as well that most often students are able to recognize that if two bodies are left in a room at a constant temperature for long enough, they will eventually reach the same temperature as each other and the room. 73 % of students correctly marked the area on the graph time dependence of the temperature for the mixture where it is in thermal equilibrium with the surroundings. In the next version of the teaching module, we will add two simple experiments to the laboratory work: the melting of ice and heating of water accompanied by the measurements of temperature which will clearly show that the temperature during the phase transitions is constant.
Table 3. Percentage of students who: a) described the thermal equilibrium with temperature and heat; b) correctly represented thermal equilibrium with the graph T(t); and c) identified the thermal equilibrium
from the graph.
Q, equal T equal T T of thermometer in room
Reading the graph
Pre-test 3 % 38 % 80 % / Post-test 1 28 % 44 % 86 % / Post-test 2 / / 98 % 73 %
In the fourth group of results, we sought answers to the questions When does heat flow?” and How much heat is transferred? Table 4 indicates that 15 % of students in the pre-test and 51 % in the post-test 1 thought that heat flows from higher temperatures to lower temperatures, while 22 % of students in the post-test 1 still wrote that the difference in temperature does not cause the heat flux. The students were also required to draw a sketch of heat flows between parts of the cup with hot tea and its surroundings using arrows. A wide arrow represents a large heat flow. 24 % of students draw it correctly in the pre-test and 74 % in the exam (post-test 2). The percentage of students who draw it correctly was the highest immediately after a similar activity during the laboratory exercises (in the post-test 2). One third of the students encountered difficulties in the exam when reading a data about the area where there is no heat transfer between the mixture and the surrounding from graph T(t) . Table 3. Percentage of students who: a) described the spontaneous heat flow without and with difference
in temperature of the 2 objects; b) drew the sketch of heat flows for hot tea correctly; and c) recognized the area on graph T(t) where there is no spontaneous heat flow between the mixture and its surroundings.
no dT dT Sketch cup Reading the graph
Pre-test 36 % 15 % 24 % / Post-test 1 22 % 51 % 82 % 38 % Post-test 2 / / 74 % 67 %

The results clearly indicate that the students were on average more familiar with the concepts related to heat and temperature, such as phase transition, heat transfer and thermal equilibrium after the application of the module. However, we also observed that some students regarded the experimental work only as a recipe showing how to conduct an experiment without trying to explain the physics behind it. In the new version of the module, we will add questions that would encourage student consideration from this point of view. The pre-service primary school teachers observed showed little interest to cooperate in collecting of data (except in the exams), therefore the questionnaires were very short. This is the main reason why we failed to gain the full impression of student knowledge, which partly limits the conclusions. The data was collected only by means of very short paper-pencil questionnaires with a few questions. Most questions were structured in a manner challenging only the lower cognitive level. However, to evaluate the real understanding of the concepts it is necessary to perform semi-structured interviews which can provide insights into student reasoning. For this reason, we have to schedule the preparation and implementation of semi-structured interviews before, in between and after the implementation of the teaching module. The prior study was conducted without a control group, therefore limiting the results. This might lead to a wrong conclusion regarding the influence of the experimental module related to the concepts of heat and temperature on achievements on test of knowledge. In the study, many suggestions for improvement of the module as well as some instruments for collecting data were put forward. As many of these suggestions as possible will be considered when preparing the classes related to heat and temperature in the new school year. In this way, the impact of the module on understanding basic concepts related to heat and temperature might be described to a greater extent. Conclusions This paper describes the educational process of primary school teachers in the Slovenian school system. Primary school teachers teach all subjects, including physics contents in the subjects Environmental Studies and Science and Technology, from the 1st to the 5th grade. The concepts of heat and temperature are difficult to understand for pupils and students. For this reason, a teaching module related to heat and temperature for the first-year students of primary school teaching programme in Slovenia was designed and evaluated. The module leads the students through 8 hours of theoretical discussion on heat and temperature as well as experimental laboratory exercises that bring the concepts closer to students. The results show that the percentage of students who are able to discuss the meaning of thermal equilibrium, heat, and temperature increased after the application of the module. However, some gaps in their knowledge remain. Considering these results, a new version of the module will be prepared, the questionnaires will be updated and a pre-post study with a control group will be conducted in the school year 2014–15. References Albert, E. (1978). Development of the concept heat in children. Science Education, 62(3), 389-399. Başer, M. (2006). Fostering conceptual change by cognitive conflict based instruction on students' understanding of heat and temperature concepts. Eurasia 2(2). Brush, S. G.(1986). The kinf of motion we call heat: A history of the kinetic theory of gases in the 19th century. New York: North-Holland. Carlton, K. (2000). Teaching about heat and temperature. Physics Education, 35, 101-105.

Edufile (2014). Education country file - Slovenia. Retrieved from http://www.edufile.info/index.php?view=school_systems&topic=topic_general_infos&country=22 (1.11.2014) Erickson, G. L. (1979). Children's conceptions of heat and temperature. Science Education, 63(2), 221-230. Jara-Guerrero S. (1993). Misconceptions on heat and temperature in The Proceedings of the Third International Seminar on Misconceptions and Educational Strategies in Science and Mathematics, Misconceptions Trust: Ithaca, NY (1993). Jasien, P. G., and Oberem, G. E. (2002). Understanding of Elementary Concepts in Heat and Temperature among College Students and K-12 Teachers. Journal of Chemical Education, 79(7), 889-895. Kolar, M. et al. (2011). Učni načrt. Program osnovna šola. Spoznavanje okolja. Ljubljana: Ministrstvo za šolstvo in šport: Zavod RS za šolstvo. Nottis, K., Prince, M., and Vigenat, M. (2009). Undergraduate engineering students’ understanding of heat, temperature, and radiation. Northeast educational research association. Pathare, S. R.,and Pradhan, H. C. (2005). Students alternative conception in pressure, heat and temperature Physics Education, 21(), 213-218. Prince, M., and Vigeant, M. (2006). Using Inquiry-based Activities to Promote Understanding of Critical Engineering Concepts. Paper presented at the ASEE National Conference, Chicago, IL. Thomaz, M. F., Malaquias, I. M., Valente, M. C., and Antunes, M. J. (1995). An attempt to overcome alternative conceptions related to heat and temperature. Physics Education, 30 (1), 19-26. Vodopivec, M. et al. (2011). Učni načrt. Program osnovna šola. Naravoslovje in tehnika. Ljubljana: Ministrstvo za šolstvo in šport: Zavod RS za šolstvo. Yeo, S., and Zadnik, M. (2001). Introductory Thermal Concept Evaluation: Assessing Students’ Understanding. The Physics Teacher, 39, 495-504. Jerneja Pavlin University of Ljubljana Faculty of Education Department of Physics and Technical Studies Kardeljeva ploščad 16 1000 Ljubljana Slovenia E-mail: [email protected]