the economy - yearbook
TRANSCRIPT

33
The Hong Kong economy picked up to register a moderate growth in 2013 after expanding only slowly in 2012, despite the still challenging external environment amid the sub-par performance of the advanced economies and the negative spillovers to the emerging market economies. Of particular note was the acceleration of exports of services on the back of vibrant inbound tourism and faster growth of cross-border financial activities. Domestic demand displayed resilience, with both consumption and investment registering further growth.
In 2013, the Gross Domestic Product (GDP) expanded by 2.9 per cent in real terms, improving from the 1.5 per cent growth in 2012, but still below the annual average growth of 4.5 per cent in the past decade. In terms of the quarterly profile, real GDP growth hovered at around 3 per cent throughout the four quarters, at 2.9 per cent, 3.1 per cent, 2.8 per cent and 3 per cent respectively.
On a seasonally adjusted quarter-to-quarter comparison, real GDP growth picked up successively during the year, at 0.5 per cent, 0.6 per cent, 0.7 per cent and 1.1 per cent respectively in the first, second, third and fourth quarters (Chart 1).
Total exports of goods grew only modestly during most of 2013, mainly reflecting the still unsteady demand conditions in the advanced economies, slower expansion in emerging markets amid concerns about the US Federal Reserve’s asset purchase tapering, and their adverse impacts on intra-regional trade in Asia. Nevertheless, merchandise exports showed some relative improvements in the latter part of the year as the advanced economies gained more traction.
Exports of services attained solid growth in 2013. Exports of travel services, buttressed by the brisk expansion of inbound tourism, accelerated and rendered the key impetus, while exports of financial and other business services also picked up amid the faster expansion of cross-
Chapter 3
The Economy
The Hong Kong economy expanded moderately in 2013, improving from the weak performance in 2012. While the
solid expansion in domestic demand and exports of services provided the key growth momentum and helped keep the
economy in full employment, lacklustre demand in advanced economies continued to drag on Hong Kong’s merchandise exports. Inflation was largely contained in 2013, thanks to
subdued import prices and receding domestic cost pressures.

34
The Economy
3
border financial and commercial activities, especially in the second half of the year when global business sentiment improved somewhat. Yet exports of transportation and trade-related services remained rather subdued alongside the weak international and regional trade flows.
Chart 1 Quarterly Gross Domestic Product (year-on-year rate of change)
0
2
4
6
8
10
12
14
16
18
20
-2
-4
-6
-8
-102009 2010 2011 2012 2013200820072005 200620042003200220011999 2000199819971995 19961994
Per cent
Nominal GDPReal GDP
Chart 1 Quarterly Gross Domestic Product(year-on-year rate of change)
The Hong Kong economy grew moderately in 2013, mainly held back by weak external demand.
The domestic sector maintained steady growth. Private consumption expenditure grew further, thanks largely to the favourable job and income conditions. Investment rose only moderately, due to relapse in private sector construction activities. Yet infrastructure construction works remained hectic, while investment in machinery and equipment attained another year of double-digit growth.
The labour market was tight, with job vacancies rising to record highs and total employment sustaining notable growth. The seasonally adjusted unemployment rate edged down to 3.2 per cent in the fourth quarter, indicating a tight labour market. Against this background, wages and earnings registered further gains, with those of the lower-skilled workers benefitting further from the extra boost from the upward adjustment of the Statutory Minimum Wage rate in May.
The residential property market has cooled off visibly since March 2013. While the government’s various counter-cyclical measures have helped manage short-term demand, market sentiment was also dented by expectations of the US Federal Reserve tapering its asset purchases. Trading activities fell significantly, with 50,676 sale and purchase agreements for residential property in 2013, the lowest on record. With the uptrend decelerating noticeably, overall flat prices rose by 8 per cent during 2013, the smallest annual increase since the current property market boom started in 2009.

35
The Economy
3
Raising flat supply through increasing land supply is the government’s top policy priority in ensuring the healthy and stable development of the property market. Reflecting the government’s sustained efforts, projected total flat supply for the coming three to four years increased from 67,000 units at end-2012 to 71,000 units at end-2013.
The local stock market remained volatile in 2013 and finished the year slightly higher. Spooked by the US Federal Reserve’s asset purchase tapering discussion and the attendant stock and foreign exchange market gyrations in some emerging market economies, the local stock market came under sharp sell-off pressure during May and June. The Hang Seng Index (HSI) hit a low of 19,814 on 24 June. The stock market recovered ground in the ensuing months following the Federal Reserve’s indications of its continued accommodative stance, faster Mainland growth in the third quarter, and improved economic sentiment in Europe and the US. The HSI closed the year at 23,306, up 2.9 per cent from end-2012. The average daily turnover also rebounded modestly to $62.6 billion in 2013. Fund-raising activity picked up in 2013, particularly in the fourth quarter. For the year as a whole, total IPO funds raised amounted to $169 billion in 2013, up from $90 billion in 2012, making Hong Kong the world’s second largest IPO centre in 2013.
Inflation was largely contained in 2013, as domestic cost pressures tended to stabilise and import prices remained benign. In 2013, underlying inflation averaged 4 per cent, down from 4.7 per cent in 2012.
Structure and Development of the Economy
Hong Kong is a global centre for world trade, finance, business and telecommunications, strategically located at the doorstep of the Mainland’s huge and vibrant economy. Hong Kong is currently the world’s eighth largest trading entity. It operates one of the world’s busiest container ports in terms of container throughput, as well as one of the world’s busiest airports in terms of number of international passengers and volume of international air cargo handled. Hong Kong is also the world’s eighth largest banking centre in terms of gross external positions of banks, and the fifth largest foreign exchange trading centre. Its stock market is the second largest in Asia in terms of market capitalisation.
As an international business hub, Hong Kong has a business-friendly environment with the rule of law, free trade and free flow of information, open and fair competition, a well-established and comprehensive financial network, superb transport and communications infrastructure, sophisticated support services, and a flexible labour market with a well-educated workforce and a pool of efficient and innovative entrepreneurs. Moreover, it has a sizeable amount of foreign exchange reserves, a fully convertible and stable currency, prudent fiscal management and a simple tax system with low tax rates. In view of these virtues, Hong Kong has been ranked by the US Heritage Foundation as the freest economy in the world for 20 consecutive years. Similarly, the Fraser Institute of Canada has also consistently ranked Hong Kong Number 1 in the world in terms of economic freedom. In 2013, Hong Kong was ranked the world’s third most competitive economy by the International Institute for Management Development and the first in Asia, and remained the second easiest place to do business in the world according to

36
The Economy
3
the World Bank’s Doing Business 2014 Report. Hong Kong has also been conferred the top triple-A credit rating by Standard and Poor’s.
The size of the Hong Kong economy more than doubled over the past two decades, expanding at an average annual rate of 3.6 per cent in real terms, on par with that of the world economy and consistently faster than most high-income economies. Over the same period, Hong Kong’s per capita GDP rose by about 70 per cent in real terms, posting an average annual growth rate of 2.6 per cent. Hong Kong’s per capita GDP at current market prices reached US$38,100 in 2013, one of the highest in Asia (Chart 2).
Chart 2 Gross Domestic Product
1993 1995 1997 1999 2001 2003 2005 2007 2009 2011 201350
100
150
200
250
0
5,000
10,000
15,000
20,000
25,000
30,000
40,000
35,000
Index (1993 = 100) US$
Real GDP (left scale)
Per capita GDP at current market prices (right scale)
Chart 2 Gross Domestic Product
Over the past two decades, the Hong Kong economy grew by an average of 3.6 per cent in real terms, on par with the world’s economic growth and consistently faster than most high-income economies.
Thanks to continued globalisation, the further deepening of regional trade integration and the government’s sustained efforts in exploring new markets, Hong Kong’s trade linkages with other parts of the world have grown appreciably. Trade in goods and services more than tripled in real terms over the past two decades. In 2013, the total value of visible trade (comprising re-exports, domestic exports and imports of goods) reached $8,211 billion, equivalent to 387 per cent of GDP. This was considerably higher than the ratios of 225 per cent in 1993 and 282 per cent in 2003. Including the value of exports and imports of services, the ratio of total trade to GDP was even higher, at 459 per cent in 2013, up significantly from 263 per cent in 1993 and 327 per cent in 2003.
The stock of inward direct investment in Hong Kong was enormous, at $11,196 billion in market value at the end of 2013, equivalent to 527 per cent of GDP. It served as another vivid manifestation of Hong Kong’s increasing international focus. Hong Kong is among the most preferred destinations for inward direct investment, ranked third in the world and second in Asia, only after the Mainland, by the United Nations’ World Investment Report 2013.

37
The Economy
3
The corresponding figures for Hong Kong’s stock of outward direct investment were likewise huge, at $10,485 billion or 494 per cent of GDP. As an international financial centre with huge cross-territory fund flows, Hong Kong’s external financial assets and liabilities were also substantial, at $29,087 billion and $23,136 billion respectively at the end of 2013. The corresponding ratios to GDP in 2013 were 1,370 per cent and 1,090 per cent. Reflecting Hong Kong’s robust international investment position, its net external financial assets amounted to $5,951 billion at the end of 2013, equivalent to 280 per cent of GDP.
The Gross National Income (GNI), comprising GDP and net external primary income flows, stood at $2,165 billion in 2013. This was higher than the corresponding GDP by 2 per cent. The difference represented a net inflow of external primary income. In gross terms, inflows and outflows of external primary income remained substantial in 2013, at $1,128 billion and $1,086 billion respectively, equivalent to 53 per cent and 51 per cent of GDP respectively. This was attributable to the huge volumes of Hong Kong’s inward and outward investment.
Contributions of the Various Economic Sectors
Primary production (including agriculture, fisheries, mining and quarrying) is insignificant in Hong Kong in terms of both value-added contribution to GDP and share in total employment, as Hong Kong is a predominantly city economy.
Secondary production (comprising manufacturing, construction, and supply of electricity, gas and water), which had a significant direct value-added contribution to the economy in the early 1980s, has since diminished in relative importance. Within this broad sector, the value-added contribution from manufacturing shrank from 13 per cent in 1992 to 4 per cent in 2002 and to less than 2 per cent in 2012. The construction sector’s contribution to GDP stayed at around 5 per cent between 1990 and 2000, and then fell to about 3 per cent in the late 2000s, before edging up to 4 per cent in 2012. The supply of electricity, gas and water held relatively stable, with a share of around 2-3 per cent of GDP over the past two decades.
The Hong Kong economy has become increasingly service-oriented since the 1980s. The Mainland’s open-door policy and economic reforms have not only provided a vast production hinterland and market outlet for Hong Kong’s manufacturers but, more importantly, also unleashed ample business opportunities for a wide range of service providers. Hong Kong has thus leveraged its geographical proximity and cultural ties with the Mainland as well as its strong market institutions to re-orientate itself towards service activities and move up the value chain.
As a result, the share in GDP of the tertiary sector (comprising the import/export, wholesale and retail trades; accommodation and food services; transportation, storage, postal and courier services; information and communications; financing and insurance; real estate, professional and business services; public administration, social and personal services; and ownership of premises) rose progressively over the years, to 93 per cent in 2012 (Chart 3). Development on the employment front was similar, with the tertiary sector’s share of employment increasing visibly while that in secondary production continued to shrink over the past two decades (Chart 4).

38
The Economy
3
Chart 3 Gross Domestic Product by Broad Economic Sector
1992 2012
Primary production 0.1%
Tertiary production 93%
Secondary production 6.9%
Primary production 0.2%
Tertiary production 79.9%
Secondary production 19.8%
Chart 3 Gross Domestic Product by Broad Economic Sector
Over the past two decades, the economy became increasingly service-oriented.
Note: Due to adoption of the Hong Kong Standard Industrial Classification Version 2.0, the series from 2000 onwards are not strictly comparable with those of the earlier years.
Chart 4 Employment by Broad Economic Sector
1993 2013
Primary production 0.1%
Tertiary production 88.3%
Secondary production 11.6%
Primary production 0.8%
Tertiary production 72.5%
Secondary production 26.7%
Chart 4 Employment by Broad Economic Sector
Over the past two decades, the services sector’s share of total employment increased markedly, while the industrial sector’s share kept shrinking.
Notes: The compilation methodology of composite employment estimates was reviewed in June 2005. Employment figures from 1996 onwards have thus been revised accordingly. They are not strictly comparable with those of the earlier years.
Starting from the first quarter of 2009, industrial classification of employment has adopted the Hong Kong Standard Industr ial Classification Version 2.0 while that in the previous years is based on Version 1.1.

39
The Economy
3
The Services Sector
The services sector is where Hong Kong’s competitive advantage lies. Over the past five years between 2008 and 2013, the value-added part of the services sector grew by a cumulative 16 per cent in real terms, outpacing the corresponding 14 per cent growth of the overall economy. Among the constituent service sectors, wholesale and retail trades showed the fastest cumulative growth of almost 70 per cent. This, coupled with the 11 per cent growth in accommodation and food services, reflected the solid domestic demand and vibrant inbound tourism. Notwithstanding the global financial crisis and euro debt crisis during this period, financing and insurance recorded solid growth of 25 per cent, a testament to Hong Kong’s competitive edge as an international financial centre. Import and export trade saw a 13 per cent increase over the period, while transport and storage services grew steadily by 10 per cent, underlining the competitiveness of Hong Kong’s trading and logistics sector.
In 2012, the services sector directly contributed 93 per cent to GDP. Import/export, wholesale and retail trades, and accommodation and food services remained the largest service sectors, together accounting for 29 per cent of GDP. This was followed by financing and insurance, real estate, professional and business services (27 per cent), public administration, social and personal services (17 per cent), transportation, storage, postal and courier services, and information and communications (10 per cent) (Chart 5).
Chart 5 Gross Domestic Product by Major Service Sector
1992 2012
Transport, storage and communications 9.1%
Finance, insurance, real estate and business services 22.6%
Public administration,social and personal services 16.8%
Wholesale, retail and import/export trades, restaurants and hotels 24.2%
Community, social and personal services 14.5%
Import/export, wholesaleand retail trades,accommodation andfood services29%
Transportation, storage, postal and courier services,information and communications 9.5%
Other sectors 17.3%
Other sectors 29.5%
Financingand insurance,real estate,professional and business services 27.4%
Chart 5 Gross Domestic Product by Major Service Sector
The import/export, wholesale and retail trades, accommodation and food services sector, and the financing and insurance, real estate, professional and business services sector remained the two largest service sectors in terms of net output in 2012.
Note: Due to adoption of the Hong Kong Standard Industrial Classification Version 2.0, the series from 2000 onwards are not strictly comparable with those of the earlier years.

40
The Economy
3
The increasing service orientation of the economy was also borne out by a shift in the sectoral composition of employment. Over the past two decades, the share of the services sector in total employment increased from 73 per cent in 1993 to 86 per cent in 2003 and 88 per cent in 2013. As for individual service segments, import/export trade and wholesale, retail, accommodation and food services accounted for 32 per cent of the total in 2013. This was followed by public administration, social and personal services with a share of 26 per cent; financing and insurance, real estate, professional and business services, 19 per cent; and transportation, storage, postal and courier services, information and communications, 12 per cent (Chart 6).
Chart 6 Employment by Major Service Sector
20131993
Wholesale, retail and import/export trades, restaurants and hotels 32.8%
Transport, storage and communications10.9%
Import/export, wholesale and retail trades,accommodation andfood services 31.6%
Transportation, storage, postal and courier services,information andcommunications 11.5%
Finance, insurance, real estate and business services 10%
Other sectors 11.7%
Financing and insurance, real estate, professional and business services 19.3%
Public administration, social and personal services 25.9%
Community, social and personal services 18.9%
Other sectors 27.5%
Chart 6 Employment by Major Service Sector
Import/export trade and wholesale, retail, accommodation and food services employed the most people in 2013.
Notes: The compilation methodology of composite employment estimates was reviewed in June 2005. Employment figures from 1996 onwards have thus been revised accordingly. They are not strictly comparable with those of earlier years.
Starting from the first quarter of 2009, industrial classification of employment has adopted the Hong Kong Standard Industr ial Classification Version 2.0 while that in the previous years is based on Version 1.1.
The Manufacturing Sector
Hong Kong’s manufacturing sector continues to be versatile and resilient in coping with the changing global and regional economic landscapes. Thanks to the increased manufacturing arrangements in the Mainland and other neighbouring economies with lower land and labour costs, not only has Hong Kong’s productive capacity been effectively expanded, its overall productive efficiency and product quality have also seen significant upgrading along with technological advancement and a shift towards production with a more knowledge-based and higher value-added content. It is also worth noting that although the direct value-added

41
The Economy
3
contribution of the manufacturing sector to the economy is not large relative to the services sector, its well-established linkages with the Mainland economy have underpinned the growth of Hong Kong’s services sector, especially by driving the rapid development of trading and other supporting services.
Economic Links between Hong Kong and the MainlandSince the Mainland launched its economic reform and open-door policy in 1978, the economic relationship between the Mainland and Hong Kong has grown steadily closer. Over the years, the massive flows of goods, services, people and capital between Hong Kong and the Mainland and between the Mainland and the world through Hong Kong have yielded enormous mutual benefits and contributed to the remarkable income and employment growth in the two places.
The Mainland plays an increasingly important role in the world arena and its total trade has surged 20-fold in the past two decades. Hong Kong has benefited substantially from the Mainland’s phenomenal trade growth. Visible trade between Hong Kong and the Mainland in 2013 was about five times that in 1993, representing growth of 9 per cent per annum in value terms (Chart 7). In 2013, Hong Kong and the Mainland were ranked the world’s eighth and second largest trading entities respectively.
Chart 7 Visible Trade between Hong Kong and the Mainland
500
1,000
1,500
2,000
2,500
3,000
3,500
4,000
0
5
10
15
20
25
30
35
-5
-10
-15
-20
-251993 1995 1997 1999 2001 2003 2005 2007 2009 2011 2013
HK$ Billion Per cent
Total trade value (left scale)
Year-on-year rate of change (right scale)
Chart 7 Visible Trade between Hong Kong and the Mainland
Merchandise trade between Hong Kong and the Mainland registered notable cumulative growth in the past two decades.
The Mainland has long been Hong Kong’s largest trading partner, accounting for slightly more than half of Hong Kong’s total trade value in 2013. Reciprocally, Hong Kong was the Mainland’s third largest trading partner (after the European Union and the US), accounting for about 10 per cent of the Mainland’s total trade value in 2013. Nearly half of Hong Kong’s exports to the Mainland (mainly re-exports) in 2013 involved raw materials, reflecting the latter’s role as a production hinterland and the highly integrated production network within Asia. Meanwhile, Hong Kong’s exports of consumer goods (mainly re-exports) to the Mainland increased by a

42
The Economy
3
cumulative 77 per cent over the past decade. With a population of over 1.3 billion (over 100 million in Guangdong Province alone) and the Central Government’s goal to rebalance economic growth towards domestic consumption, the Mainland market provides huge business potential for Hong Kong’s exporters.
Hong Kong is a principal gateway to and from the Mainland for business and tourism. In 2013, foreign visitors to the Mainland made 3.9 million trips through Hong Kong. The number of trips made by Mainland residents to or through Hong Kong grew 17 per cent to 40.7 million in 2013.
Hong Kong continues to be the largest external investor in the Mainland. According to the Mainland’s statistics, the cumulative value of Hong Kong’s realised direct investment in the Mainland reached US$671 billion at the end of 2013, accounting for about 48 per cent of the total inward direct investment there.
Reciprocally, Hong Kong is the first port of call for the Mainland’s outward direct investment. Based on the Mainland’s statistics, the Mainland’s stock of outward direct investment to Hong Kong accounted for 58 per cent of its total outward direct investment as at the end of 2012, reflecting Hong Kong’s role as a platform for Mainland companies to reach out and go global. Likewise, based on Hong Kong’s statistics, the Mainland is also Hong Kong’s largest source of foreign direct investment. At the end of 2012, the market value of direct investment from the Mainland to Hong Kong amounted to US$460 billion, accounting for 37 per cent of Hong Kong’s total inward direct investment. Mainland companies have also maintained a strong presence in Hong Kong. As at mid-2013, Mainland companies had established a total of 901 regional headquarters, or regional or local offices in Hong Kong, up from 539 ten years ago.
Amongst the provinces in the Mainland, Guangdong’s economic links with Hong Kong are the closest. Based on the Mainland’s statistics, at the end of 2013, the cumulative value of Hong Kong’s realised direct investment in Guangdong was US$201 billion, accounting for 62 per cent of its total inward direct investment. Hong Kong’s huge direct investment in the Mainland has contributed to the latter’s industrialisation, while at the same time also propelling the rapid structural transformation in the Hong Kong economy over the past three decades.
Financial links between Hong Kong and the Mainland have also strengthened substantially over the years, on the back of the surge in cross-boundary economic activities and the Central Government’s policy to enhance the global influence of Hong Kong as an international financial centre. Hong Kong is a major funding centre for Mainland enterprises, and 797 Mainland enterprises were listed on the Hong Kong stock market as at the end of 2013, with 78 of these listed in 2013. Mainland enterprises raised $312.2 billion of equity funds in Hong Kong in 2013. These activities in turn reinforced Hong Kong’s position as a major international fund-raising centre.
Offshore RMB business in Hong Kong developed further in 2013. The value of RMB trade settlement handled by banks in Hong Kong surged by 46 per cent in 2013 to reach RMB3,841 billion, while the amount of RMB customer deposits and outstanding RMB certificates of deposit issued also jumped to a high of RMB1,053 billion as at the end of 2013, representing a 46 per cent increase from a year earlier. RMB financing activities also remained buoyant, with

43
The Economy
3
the outstanding amount of RMB loans leaping from RMB79 billion at the end of 2012 to RMB116 billion at the end of 2013. RMB bond issuance fetched a total of RMB117 billion during 2013, pushing up the outstanding RMB bonds by more than 30 per cent to RMB310 billion as at the end of 2013. The Central Government announced it would regularise its sovereign bond issuance programme in Hong Kong, and retail investors in Hong Kong were for the first time able to subscribe for sovereign bonds. In June, Hong Kong launched the CNH Hong Kong Interbank Offered Rate fixing, providing a reliable benchmark for pricing loan facilities and helping facilitate the development of the RMB financing market.
Hong Kong’s offshore RMB investment product market also broadened considerably in 2013 to reinforce the city’s role as the leading offshore RMB centre. Apart from the already wide range of RMB products available in the market, the RMB Qualified Foreign Institutional Investors (RQFII) scheme was enhanced further in March to relax the application criteria for RQFII status as well as the investment restrictions on RQFII funds. In addition, the RMB investment product range in Hong Kong was widened by developments such as the addition of RMB-denominated money market funds to the investment choices available within mandatory provident fund schemes, the listing of dual-counter RMB ‘dim sum’ bond index exchange traded funds and equity-linked investments with RMB features, and an RMB share class offered by a fund authorised by the Securities and Futures Commission with underlying investments mostly in non-RMB denominated assets.
Hong Kong’s role as a platform to support global RMB payments has been deepening. In December 2013, the average daily turnover of Hong Kong’s RMB Real Time Gross Settlement system amounted to RMB500 billion. As at the end of 2013, there were 216 banks participating in the RMB clearing platform in Hong Kong, of which 191 were the overseas presence of Mainland banks or branches and subsidiaries of foreign banks, forming a global RMB payment network covering some 40 countries and regions. According to the statistics from the Society for Worldwide Interbank Financial Telecommunication (SWIFT), banks in Hong Kong handled around 80 per cent of global RMB payments.
Economic co-operation with the Mainland has been continuously enhanced through the broadening of the Mainland and Hong Kong Closer Economic Partnership Arrangement (CEPA). In August, Supplement X to CEPA was signed, providing 73 services liberalisation and trade and investment facilitation measures, including 65 liberalisation measures in trade in services and eight measures to strengthen co-operation in areas of finance and trade and investment facilitation. Under these measures, Hong Kong service suppliers enjoy preferential treatment in entering the Mainland’s service industries.
The construction of the Hong Kong-Zhuhai-Macao Bridge (HZMB) and related local projects continued apace in 2013. When completed in 2016, the HZMB will significantly reduce commuting time and transportation costs between Hong Kong and the western Pearl River Delta (PRD) region and help the flow of people and goods within the PRD. Construction of the Hong Kong Section of the Guangzhou-Shenzhen-Hong Kong Express Rail Link also progressed. Upon completion, it will reduce the journey time between Guangzhou and Hong Kong to 48 minutes, and give passengers easy access to the Mainland’s 16,000 kilometres high-speed railway network to all the major cities.

44
The Economy
3
The Economy in 2013External trade
The still challenging international trading environment continued to restrain Hong Kong’s external trade in 2013. Total exports of goods, compiled under the GDP accounts, expanded by 6.7 per cent in real terms in 2013. Yet, on the basis of external merchandise trade statistics, after excluding the substantial increase in exports of non-monetary gold, merchandise exports only grew modestly by 2.8 per cent in real terms. Despite the relative improvement in growth in the advanced economies in the latter half of 2013, exports to the US and the European Union both fell for the year as a whole, and those to Japan were further dented by the slackened import demand due to the much weakened yen. The tepid import demand in the advanced economies also weighed on the production and trading activities in Asia, leading to the generally weak performance in exports to many Asian economies. Nonetheless, thanks to the resilience of the Mainland economy, exports to the Mainland accelerated in growth and lent important support to Hong Kong’s overall export performance. In terms of the quarterly profile, merchandise exports maintained modest growth throughout the year, expanding by 4 per cent, 2.4 per cent, 2 per cent and 3.1 per cent respectively in the four quarters (Chart 8). On a seasonally adjusted quarter-to-quarter comparison, merchandise exports shrank mildly in the first two quarters, and then rebounded in the last two quarters.
Chart 8 Hong Kong’s Visible Trade (year-on-year rate of change in volume terms)
Q1 Q2 Q3 Q4 Q1 Q2 Q3 Q4 Q1 Q2 Q3 Q4 Q1 Q2 Q3 Q4 Q1 Q2 Q3 Q4
Per cent
Total exports ofgoods
Imports of goods
Chart 8 Hong Kong’s Visible Trade(year-on-year rate of change in volume terms)
2009 2010 2011 2012 2013
0
5
10
15
20
30
25
35
-5
-10
-15
-20
-25
Merchandise exports rose modestly in 2013 amid sub-par global economic growth.
Imports of goods, on merchandise trade statistics basis, rose moderately by 3.9 per cent in volume terms in 2013, up from 1 per cent in 2012, driven by faster growth in both retained imports and import intake related to re-exports. Retained imports, which accounted for over one-quarter of total imports, grew by 6.3 per cent in real terms in 2013, up from the 3.5 per cent increase in the preceding year. Analysed by end-use category, retained imports of foodstuffs expanded visibly while those of consumer goods also saw further increase, largely bolstered by the resilient local consumption market. Meanwhile, retained imports of capital goods
45
The Economy
3
maintained an appreciable growth pace, reflecting the largely positive business sentiment and intensive public works. On the other hand, retained imports of fuels increased only slightly, conceivably reflecting in part continued energy-saving efforts. Retained imports of raw materials and semi-manufactures dropped for the third consecutive year, largely in tandem with the general sluggishness in production activity.
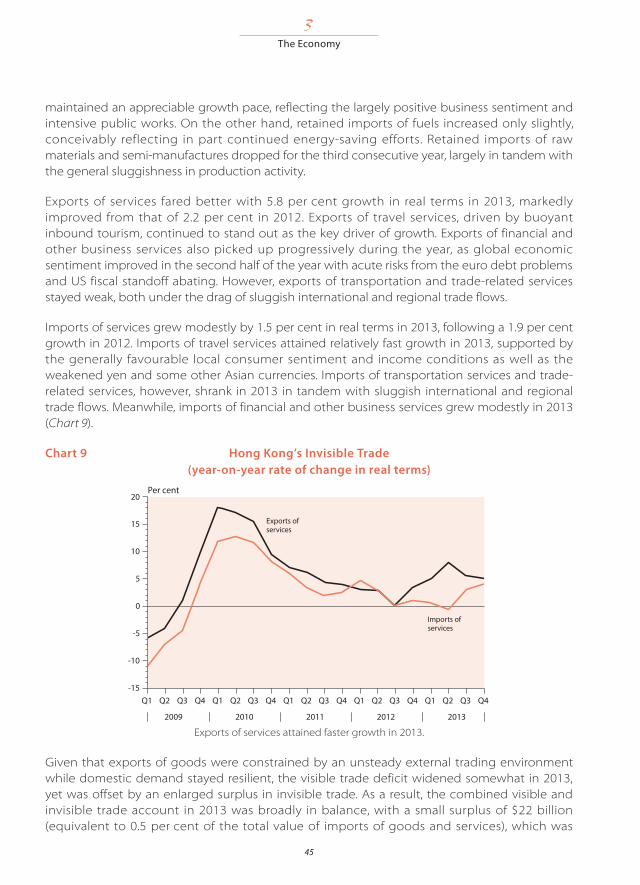
Exports of services fared better with 5.8 per cent growth in real terms in 2013, markedly improved from that of 2.2 per cent in 2012. Exports of travel services, driven by buoyant inbound tourism, continued to stand out as the key driver of growth. Exports of financial and other business services also picked up progressively during the year, as global economic sentiment improved in the second half of the year with acute risks from the euro debt problems and US fiscal standoff abating. However, exports of transportation and trade-related services stayed weak, both under the drag of sluggish international and regional trade flows.
Imports of services grew modestly by 1.5 per cent in real terms in 2013, following a 1.9 per cent growth in 2012. Imports of travel services attained relatively fast growth in 2013, supported by the generally favourable local consumer sentiment and income conditions as well as the weakened yen and some other Asian currencies. Imports of transportation services and trade-related services, however, shrank in 2013 in tandem with sluggish international and regional trade flows. Meanwhile, imports of financial and other business services grew modestly in 2013 (Chart 9).
Chart 9 Hong Kong’s Invisible Trade (year-on-year rate of change in real terms)
Q1 Q2 Q3 Q4 Q1 Q2 Q3 Q4 Q1 Q2 Q3 Q4 Q1 Q2 Q3 Q4 Q1 Q2 Q3 Q4
Per cent
Exports of services
Imports of services
Chart 9 Hong Kong’s Invisible Trade(year-on-year rate of change in real terms)
2009 2010 2011 2012 2013
0
5
10
15
20
-5
-15
-10
Exports of services attained faster growth in 2013.
Given that exports of goods were constrained by an unsteady external trading environment while domestic demand stayed resilient, the visible trade deficit widened somewhat in 2013, yet was offset by an enlarged surplus in invisible trade. As a result, the combined visible and invisible trade account in 2013 was broadly in balance, with a small surplus of $22 billion (equivalent to 0.5 per cent of the total value of imports of goods and services), which was

46
The Economy
3
similar to the combined trade surplus of $23 billion in 2012 (or 0.5 per cent of the total value of imports of goods and services).
Domestic demand
The domestic sector held firm in 2013. Thanks to the favourable labour market conditions, private consumption expenditure (PCE) grew by 4.2 per cent in real terms in 2013, similar to the 4.1 per cent growth in the previous year. On a seasonally adjusted quarter-to-quarter comparison, PCE expanded strongly in the first quarter, then fell back in the second and third quarters, before picking up in the fourth quarter. Government consumption expenditure increased by 2.7 per cent in real terms in 2013, following the 3.6 per cent growth in 2012.
Overall investment spending, in terms of gross domestic fixed capital formation, posted a modest growth of 3.3 per cent in real terms in 2013, moderating from the 6.8 per cent growth in 2012. Machinery and equipment acquisition grew notably by 10.5 per cent in 2013, largely in line with the positive business sentiment. Public sector construction works also grew solidly further, on the back of continued hectic infrastructure works. Yet, private sector building activity fell back, thereby leading to a slight decline of 1.2 per cent in overall building and construction expenditure in real terms (Chart 10).
Chart 10 Main Components of Domestic Demand (year-on-year rate of change in real terms)
Q1 Q2 Q3 Q4 Q1 Q2 Q3 Q4 Q1 Q2 Q3 Q4 Q1 Q2 Q3 Q4 Q1 Q2 Q3 Q4
Per cent
Investment expenditurein terms of gross domestic�xed capital formation
Governmentconsumptionexpenditure
Privateconsumptionexpenditure
Chart 10 Main Components of Domestic Demand(year-on-year rate of change in real terms)
2009 2010 2011 2012 2013
0
5
10
15
20
-5
-20
-10
-15
Domestic demand maintained solid growth on the back of favourable job conditions and positive business sentiment.
The Labour Market
The labour market remained tight in 2013, thanks to sustained moderate economic growth and vibrant job creation in the private sector. Total employment grew strongly for the third straight year to a record high of 3,728,000 in 2013. The unemployment rate remained at a low level of 3.4 per cent in 2013, broadly on par with the 3.3 per cent in 2012, signifying another year of full employment. Meanwhile, the underemployment situation was generally stable, with the underemployment rate averaging 1.5 per cent in 2013, unchanged from 2012 (Chart 11).

47
The Economy
3
Chart 11 The Unemployment and Underemployment Rates
Q1 Q2 Q3 Q4 Q1 Q2 Q3 Q4 Q1 Q2 Q3 Q4 Q1 Q2 Q3 Q4 Q1 Q2 Q3 Q4
Per cent
Seasonally adjusted unemployment rate
Underemployment rate
Chart 11 The Unemployment and Underemployment Rates
2009 2010 2011 2012 2013
0
1
2
3
4
5
6
The unemployment rate remained low throughout 2013, signifying another year of full employment.
There was employment growth in almost all sectors, with more apparent job gains in construction and some domestically-oriented services sectors, such as warehousing and support activities for transportation, professional and business services, and accommodation services. There was an expansion of 1.8 per cent in total employment in 2013, after a 2.4 per cent increase in 2012. On the supply side, the labour force expanded by 1.9 per cent in 2013, following a growth of 2.2 per cent in 2012. The abundant job opportunities stemming from sturdy labour demand, as well as better income prospects due in part to the upward adjustment of the Statutory Minimum Wage in May, caused more people to enter the labour market, especially women and persons aged 15-24 and 50-59 (Chart 12).
Chart 12 Total Labour Force and Total Employment (year-on-year rate of change)
Chart 12 Total Labour Force and Total Employment(year-on-year rate of change)
Q1 Q2 Q3 Q4 Q1 Q2 Q3 Q4 Q1 Q2 Q3 Q4 Q1 Q2 Q3 Q4 Q1 Q2 Q3 Q4
Per cent
Total labour force
Totalemployment
2009 2010 2011 2012 2013
-2
0
1
2
3
5
4
-1
Both employment and the labour force grew further in 2013.

48
The Economy
3
Job vacancies continued to increase strongly in all major economic sectors in 2013, reflecting a general tightening of the manpower situation. The number of private sector vacancies climbed by 12.1 per cent to 77,180. The private sector vacancy rate rose further to 2.8 per cent in 2013, the highest since 1994. In 2013, the ratio of job vacancies per 100 job-seekers was 59, up from the 55 recorded in 2012. In terms of skill segment, the ratio for higher-skilled jobs declined slightly from 85 to 81 over the same period, while that for lower-skilled jobs increased from 57 to 64. The increase in the ratio for lower-skilled jobs was particularly apparent among service and sales workers, and plant and machine operators and assemblers. Analysed by economic sector, manpower shortages were particularly evident in the human health services, and residential care and social work services sectors, with their corresponding ratios far exceeding 100.
On the back of favourable labour market conditions, wages and earnings sustained solid growth in 2013. Labour earnings in the private sector increased by 5.4 per cent in 2013. After adjusting for inflation, there was a real improvement of 1.1 per cent (Chart 13). Analysed by economic sector, nominal payroll rose in all major sectors in 2013, and more prominently in professional and business services, accommodation and food service activities, and the retail trade. Separately, data from the General Household Survey, though not strictly comparable to those from the business establishment surveys, showed that the average monthly employment earnings of full-time employees (excluding foreign domestic helpers) in the lowest decile group continued to enjoy above-average income gain at 6.1 per cent in nominal terms and 1 per cent in real terms for 2013 as a whole. As regards the overall income situation, median household income (excluding foreign domestic helpers) rose by 8.2 per cent to $22,200 in 2013 from $20,500 in 2012, translating into an improvement of 3.7 per cent in real terms.
Chart 13 Labour Earnings (year-on-year rate of change)Chart 13 Labour Earnings
(year-on-year rate of change)
In real terms
In money terms
Q1 Q3 Q1 Q3 Q1 Q3 Q1 Q3 Q1 Q3 Q1 Q3 Q1 Q3 Q1 Q3 Q1 Q3 Q1 Q3
Per cent
2004 20072005 2006 2008 20112009 2010 2012 2013
-6
-4
0
2
4
6
10
8
-2
Labour earnings sustained solid increases in 2013.

49
The Economy
3
The Property Market
The residential property market has cooled off noticeably since March. While the government’s various counter-cyclical measures (the latest round introduced in February 2013) have helped manage short-term demand, expectations of the US Federal Reserve tapering asset purchases also dented market sentiment in the second half of the year. Trading activity fell significantly, and the upward momentum in flat prices decelerated noticeably.
In 2013, the total number of sale and purchase agreements for residential property received by the Land Registry dropped by 38 per cent to 50,676 (the lowest on record) and total consideration by 34 per cent to $298.9 billion. Transactions fell across all consideration ranges (Chart 14).
Chart 14 Sale and Purchase Agreements by Broad Type of Property
Chart 14 Sale and Purchase Agreements by Broad Type of Property
Q1 Q2 Q3 Q4 Q1 Q2 Q3 Q4 Q1 Q2 Q3 Q4 Q1 Q2 Q3 Q4 Q1 Q2 Q3 Q4
Number ('000)
Residential property
Non-residential property
2009 2010 2011 2012 2013
0
10
20
30
40
50
Trading activities were quiet in most of 2013.
As buyers turned increasingly cautious, the monthly increase in flat prices moderated noticeably from an average of 2.7 per cent in January and February to 0.2 per cent during March to December. Comparing December 2013 with December 2012, overall flat prices rose by 8 per cent, the smallest annual increase in the current property market boom started in 2009. The rise in rentals also moderated to a modest 3 per cent during 2013. Nonetheless, following the rally in the past few years, overall flat prices and rentals in December 2013 still surpassed the 1997 peak by 42 per cent and 12 per cent respectively (Chart 15).

50
The Economy
3
Chart 15 Prices and Rentals of Residential Property (Jan 2012=100)
105
100
110
115
120
130
135
125
140
2012 2013Jan Mar May Jul Sep Nov Jan Mar May Jul Sep Nov
Index
Price index
Feb 2013
Rental index
Chart 15 Prices and Rentals of Residential Property(Jan 2012=100)
Uptrend of both flat prices and rentals moderated during 2013.
Raising flat supply through increasing land supply is the government’s top policy priority to ensure the property market’s healthy and stable development. The government has abolished the Application Mechanism since 2013-14 to fully resume the lead in selling government land. The government has also been carrying out various land use reviews, including reviews of government land currently vacant, under Short Term Tenancies or different short-term or government uses, as well as Green Belt and industrial land. The government identified about 80 new sites in 2013 that can be rezoned for residential use. Together with sites identified earlier, these could be made available in the coming five years for providing about 210,000 flats.
The total supply of flats in the coming three to four years (comprising unsold flats of completed projects, flats under construction but not yet sold and flats on disposed sites where construction can start any time) continued to increase, from 67,000 units as estimated at end-2012 to 71,000 units as estimated at end-2013. Yet the demand-supply balance of the property market remains tight in the short term. The vacancy rate for private flats declined from 4.3 per cent at end-2012 to 4.1 per cent at end-2013, the lowest level since 1997 and well below the long-term average of 5 per cent over 1993-2012.
As it takes time to increase supply, the government has also put in significant efforts to manage demand and reduce the possible risks to financial stability arising from an exuberant property market. These measures have yielded notable results.
However, the risks of a property market bubble remained elevated. Home purchase affordability (ie the ratio of mortgage payments for a 45-square metre flat to median household income, excluding those living in public housing) stayed high at around 54 per cent in the fourth quarter of 2013, exceeding the long-term average of 47.9 per cent over 1993-2012. Should

51
The Economy
3
interest rates rise by three percentage points to a more normal level, the ratio would soar to 71 per cent.
The non-residential property market has also cooled off since March 2013. The number of sale and purchase agreements for non-residential property dropped by 42 per cent to 19,800, and total consideration by 22 per cent to $157.3 billion.
Amid the slowing growth in retail sales, prices of retail shop space rose moderately by 3 per cent and rentals by 6 per cent between December 2012 and December 2013, with the monthly gains decelerating over the course of the year and reverting to small declines in the latter part of 2013 (Chart 16).
Chart 16 Prices and Rentals of Retail Shop Space (Jan 2012=100)
150
140
130
120
110
100
2012 2013Jan Mar May Jul Sep Nov Jan Mar May Jul Sep Nov
Index
Price index
Feb 2013
Rental index
Chart 16 Prices and Rentals of Retail Shop Space(Jan 2012=100)
Prices and rentals of retail shop space moderated and reverted to small declines in late 2013.
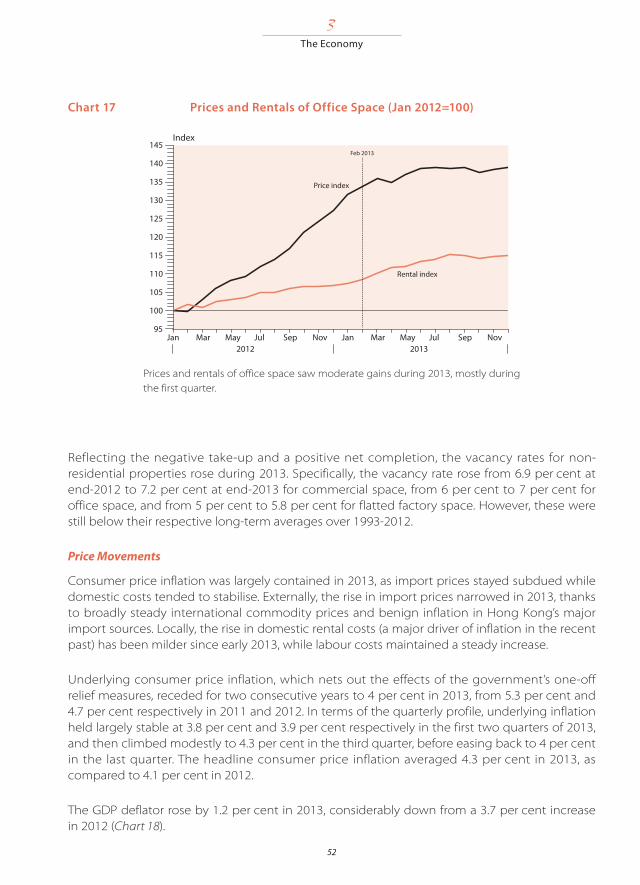
For office space, overall prices rose by 9 per cent, yet most of the gain occurred during the first quarter. Prices of Grade A, B and C office space went up by 4 per cent, 11 per cent and 14 per cent respectively. Over the same period, overall office rentals rose by 7 per cent, with Grade A, B and C office space recording gains of 6 per cent, 8 per cent and 11 per cent respectively (Chart 17). Meanwhile, prices and rentals of flatted factory space both jumped by 10 per cent, yet the increase for rentals tapered towards the end of the year and that for prices even showed a moderate decline.
52
The Economy
3
Chart 17 Prices and Rentals of Office Space (Jan 2012=100)
145
140
135
130
125
120
115
110
105
100
95
2012 2013Jan Mar May Jul Sep Nov Jan Mar May Jul Sep Nov
Index
Price index
Feb 2013
Rental index
Chart 17 Prices and Rentals of Office Space(Jan 2012=100)
Prices and rentals of office space saw moderate gains during 2013, mostly during the first quarter.
Reflecting the negative take-up and a positive net completion, the vacancy rates for non-residential properties rose during 2013. Specifically, the vacancy rate rose from 6.9 per cent at end-2012 to 7.2 per cent at end-2013 for commercial space, from 6 per cent to 7 per cent for office space, and from 5 per cent to 5.8 per cent for flatted factory space. However, these were still below their respective long-term averages over 1993-2012.
Price Movements
Consumer price inflation was largely contained in 2013, as import prices stayed subdued while domestic costs tended to stabilise. Externally, the rise in import prices narrowed in 2013, thanks to broadly steady international commodity prices and benign inflation in Hong Kong’s major import sources. Locally, the rise in domestic rental costs (a major driver of inflation in the recent past) has been milder since early 2013, while labour costs maintained a steady increase.
Underlying consumer price inflation, which nets out the effects of the government’s one-off relief measures, receded for two consecutive years to 4 per cent in 2013, from 5.3 per cent and 4.7 per cent respectively in 2011 and 2012. In terms of the quarterly profile, underlying inflation held largely stable at 3.8 per cent and 3.9 per cent respectively in the first two quarters of 2013, and then climbed modestly to 4.3 per cent in the third quarter, before easing back to 4 per cent in the last quarter. The headline consumer price inflation averaged 4.3 per cent in 2013, as compared to 4.1 per cent in 2012.
The GDP deflator rose by 1.2 per cent in 2013, considerably down from a 3.7 per cent increase in 2012 (Chart 18).

53
The Economy
3
Chart 18 Main Inflation Indicators (year-on-year rate of change)
Q1 Q2 Q3 Q4 Q1 Q2 Q3 Q4 Q1 Q2 Q3 Q4 Q1 Q2 Q3 Q4 Q1 Q2 Q3 Q4
Per cent
GDP de�ator
Composite CPI
Chart 18 Main In�ation Indicators(year-on-year rate of change)
2009 2010 2011 2012 2013
0
2
4
6
8
-4
-2
Inflation was largely contained in 2013, alongside subdued import prices and receding domestic cost pressures.
Public Finance
Management of Public Finance
The principles underlying the government’s management of public finances are enshrined in the Basic Law which stipulates that:
• The Hong Kong Special Administrative Region (HKSAR) shall have independent finances, and shall use its revenues exclusively for its own purposes.
• The HKSAR shall practise an independent taxation system, taking the low tax policy previously pursued in Hong Kong as reference.
• The HKSAR shall follow the principle of keeping expenditure within the limits of revenues in drawing up its budget, and strive to achieve a fiscal balance, avoid deficits and keep the budget commensurate with the growth rate of its Gross Domestic Product.
• The Legislative Council of the HKSAR shall exercise the power to approve taxation and public expenditure.
The government implements these constitutional provisions in its management of public finances by maintaining a low and simple tax regime and exercising fiscal prudence. Hong Kong’s Public Finance Ordinance (PFO) stipulates a system for the control and management of Hong Kong’s public finances and defines the respective powers and functions of the legislature and the executive. Pursuant to the PFO, the Financial Secretary submits to the Legislative Council an annual set of estimates of revenue and expenditure. The estimates are developed

54
The Economy
3
against the background of a medium-range forecast to ensure that full regard is given to the longer-term trends in the economy.
A government department can only incur expenditure up to the amounts stated in the expenditure estimates and for the purposes approved by the Legislative Council. If during the financial year (which runs from 1 April to 31 March) a department needs to change the expenditure estimates and spend more money, it must obtain authorisation from the Legislative Council.
The government controls its finances through the General Revenue Account (GRA) and various funds established under the PFO. The GRA is the main account for day-to-day departmental expenditure and revenue collection. Funds established under the PFO are the Bond Fund, the Capital Investment Fund, the Capital Works Reserve Fund, the Civil Service Pension Reserve Fund, the Disaster Relief Fund, the Innovation and Technology Fund, the Land Fund, the Loan Fund and the Lotteries Fund. The total revenue and expenditure of the GRA and all these funds except the Bond Fund represent government revenue and government expenditure respectively, and the total balance of the GRA and the funds except the Bond Fund constitutes government fiscal reserves.
Financial Results
For 2012-13, the government recorded a surplus of $64.8 billion. Fiscal reserves at the end of March 2013 stood at $733.9 billion. Government revenue in 2012-13 amounted to $442.1 billion and expenditure $377.3 billion. For details of revenue by source and of expenditure by component for 2012-13 and 2013-14 (Revised Estimate) see Appendix 6, Table 6.
Public expenditure comprises government expenditure and expenditure by other public bodies. In 2012-13, public expenditure totalled $400.2 billion, an increase of 3.8 per cent over the previous year, within which some $277.2 billion (or 69.3 per cent) was of a recurrent nature. Table 7 gives an analysis of public expenditure by policy area group and Table 8, the growth rate of public expenditure as compared with the rate of economic growth.
Revenue Sources
Hong Kong’s tax system is simple and tax rates and the cost of administration are low. To protect tax revenue, the government takes vigorous measures to combat tax evasion and prevent tax avoidance. The major sources of revenue include profits tax (28 per cent), land premium (16 per cent), salaries tax (11 per cent) and stamp duties (10 per cent). All major sources of revenue are presented at Appendix 6, Chart 1.
The Inland Revenue Department collects about 55 per cent of total government revenue, including profits tax, salaries tax, property tax, stamp duties and betting and sweeps tax. Profits, salaries and property taxes (including tax under personal assessment) are levied under the Inland Revenue Ordinance and together accounted for about 41 per cent of the total government revenue in 2012-13.
Profits tax is charged only on profits arising in, or derived from, Hong Kong from a trade, profession or business carried on in Hong Kong. In 2012-13, profits of unincorporated

55
The Economy
3
businesses were taxed at 15 per cent and profits of corporations at 16.5 per cent. Profits tax is charged provisionally on the basis of profits made in the year preceding the year of assessment and is subsequently adjusted according to the profits actually made in the assessment year. Generally, all expenses incurred in the production of assessable profits are deductible. There is no withholding tax on dividends paid by corporations. Interest income from deposits placed with banks or deposit-taking companies, other than that received by financial institutions, and dividends received from corporations are exempt from profits tax. In 2012-13, the total profits tax collected was about $125.6 billion (about 28 per cent of total government revenue).
Salaries tax is charged on emoluments arising in, or derived from, Hong Kong. As with profits tax, a provisional tax mechanism is in place. Salaries tax is calculated at progressive rates on the net chargeable income (ie income less deductions and allowances). In 2012-13, the first, second and third segments of net chargeable income of $40,000 each were taxed at 2 per cent, 7 per cent and 12 per cent respectively, and the remainder at 17 per cent. No one, however, needed to pay more than the standard rate of 15 per cent of his or her total income after deductions.
The earnings of husbands and wives are reported and assessed separately. However, where the deductions and allowances of either spouse exceed his or her income, or when separate assessments would result in an increase in their total salaries tax payable, the couple may elect to be assessed jointly. Salaries tax contributed some $50.5 billion (about 11 per cent of total government revenue) in 2012-13. Due to the generous personal allowances under the Hong Kong tax law, only about 1.6 million people, or 45 per cent of the workforce, were liable to salaries tax for the year of assessment 2011-12.
Owners of land and buildings in Hong Kong are charged property tax at the standard rate (15 per cent in 2012-13) on the actual rent received after an allowance of 20 per cent for repairs and maintenance. There is a system of provisional payment of tax similar to that for profits tax and salaries tax. Properties owned by a corporation carrying on a business in Hong Kong are exempt from property tax, but the profits it derived from the properties are chargeable to profits tax. Property tax contributed some $2.3 billion (about 0.5 per cent of total government revenue) in 2012-13.
Stamp duty is imposed on different classes of documents relating to transfers of immovable property, leases and transfers of shares under the Stamp Duty Ordinance. In 2012-13, the revenue from stamp duties was some $42.9 billion, or about 10 per cent of total government revenue.
Betting duty is charged on the net stake receipts from betting on horse races and football matches and on the proceeds of Mark Six lotteries, all administrated by the Hong Kong Jockey Club. Betting duty on horse races is charged at progressive rates. In 2012-13, the rates of betting duty on horse races were 72.5 per cent on the first $11 billion of net stake receipts, 73 per cent, 73.5 per cent, 74 per cent and 74.5 per cent for each segment of $1 billion thereafter; and 75 per cent on the remaining net stake receipts. The betting duty on football matches was 50 per cent of the net stake receipts. The betting duty on Mark Six lotteries was 25 per cent of the

56
The Economy
3
proceeds. The yield from betting duty in 2012-13 totalled some $16.6 billion, about 4 per cent of total government revenue.
Under the Dutiable Commodities Ordinance, excise duties are levied on only four types of commodities to be consumed locally (hydrocarbon oil, liquor, methyl alcohol and tobacco), irrespective of whether they are manufactured locally or imported. The Customs and Excise Department collects these duties, which totalled $8.98 billion in 2012-13 (about 2 per cent of total government revenue).
The Rating and Valuation Department is responsible for the billing and collection of rates, which are levied on landed properties at a specified percentage of their rateable values. The rates percentage charge in 2013-14 was 5 per cent. The rateable value of a property is an estimate of its annual open market rent at a designated date. Rateable values are reviewed each year to better reflect prevailing market rents. The current Valuation List took effect on 1 April 2013, with rateable values reflecting the rental values on 1 October 2012. The Valuation List contained about 2.4 million assessments on 1 April 2013. The revenue from rates in 2012-13 was $11.2 billion, accounting for about 2.5 per cent of total government revenue.
Having regard to the uncertain external outlook and the risk of rising inflation, the government waived rates for 2013-14, subject to a ceiling of $1,500 per quarter for each rateable property. As a result, about 75 per cent of properties were subject to no rates in the year, while the rates payable for the remaining 25 per cent of properties were reduced by the full concession amount of $1,500, costing the government about $11.6 billion.
The Rating and Valuation Department is also responsible for the billing and collection of government rent for properties held under land leases granted on or after 27 May 1985, or on the extension of non-renewable land leases. Government rent is levied at 3 per cent of the rateable value of the property and is adjusted in step with any subsequent changes in the rateable value. There were about 1.9 million assessments in the Government Rent Roll on 1 April 2013. Total government rent collected in 2012-13 was $7.9 billion, or about 1.8 per cent of total government revenue.
Fees and charges for services provided by government departments generated about $11.6 billion, or about 3 per cent of total revenue, in 2012-13. It is government policy that fees should in general be set at levels sufficient to recover the full cost of providing the services. Certain essential services are, however, subsidised by the government or provided free of charge. Government-operated public utilities generated about $3.7 billion, which accounted for about 1 per cent of total revenue; the most important of these, in revenue terms, is provision of water supplies.
The government also collected $38 billion from investments and interest income on its fiscal reserves in 2012-13, amounting to about 9 per cent of the total government revenue.
Lastly, some $69.6 billion, or about 16 per cent of the total government revenue in 2012-13, was generated from land transactions. All revenue from land transactions is credited to the Capital Works Reserve Fund to help finance the Public Works Programme.

57
The Economy
3
Network of Tax Treaties
Comprehensive agreements for the avoidance of double taxation (CDTAs) with major economies help improve the business environment and facilitate flows of trade, investment and talent between Hong Kong and the rest of the world. They help reduce tax burdens on individuals and enterprises and eliminate uncertainties over tax liabilities. They also enhance Hong Kong’s position as an international business and financial centre. Up to the end of 2013, Hong Kong has signed 29 CDTAs.
With effect from 19 July 2013, the government further enhanced the exchange of information arrangements under CDTAs and put in place a legal framework to enter into tax information exchange agreements with other jurisdictions when necessary.
Government Procurement
Hong Kong, China is a signatory to the Agreement on Government Procurement of the World Trade Organisation (WTO GPA). Government procurement is undertaken in accordance with the principles of openness, transparency, fairness, public accountability, value for money and non-discrimination. Open tender procedures are widely used. Restricted or single tender procedures may be used under exceptional circumstances where open competitive tendering would not be appropriate, such as in cases involving patent products.
The Government Logistics Department (GLD) is the government’s central procurement agent. Purchases of goods and related services are normally made by competitive tendering to ensure that user departments’ needs are met at the best possible price, having regard to the life-time cost and reliability of supply. Consideration is given to purchasing environmentally friendly products where available and appropriate. In 2013, the GLD awarded contracts amounting to $5.54 billion. The goods and related services were procured from 25 different countries or territories (including Hong Kong).
To facilitate sourcing and market research, the GLD maintains supplier lists comprising suppliers both in and outside Hong Kong for different categories of goods and services.
Notices for open tenders are published on the internet and suppliers on the relevant supplier lists will be notified. For procurements covered by the WTO GPA, tender notices will also be published in the Government Gazette and consulates and overseas trade commissions will be informed where appropriate. Tender documents may be downloaded and tender offers may also be submitted through the prescribed internet system.
Websites
Economic Analysis and Business Facilitation Unit, Financial Secretary’s Office:www.eabfu.gov.hkFinancial Services and the Treasury Bureau: www.fstb.gov.hkGovernment Logistics Department: www.gld.gov.hk