the economic value of the city college of new york
TRANSCRIPT
The Economic Value of the City College of New York
EXECUTIVE SUMMARY
N O V E M B E R 2 0 1 9

2Introduction
TH E City College of New York (CCNY) creates value in many ways. The college plays a key role in helping students increase their employability
and achieve their individual potential. The college facilitates new research developments and draws visitors and students to the 10-county region,* gen-erating new dollars and opportunities for the CCNY Service Region. CCNY provides students with the education, training, and skills they need to have fulfilling and prosperous careers. Furthermore, CCNY is a place for students to meet new people, increase their self-confidence, and promote their overall health and well-being.
CCNY influences both the lives of its students and the regional economy. The college supports a variety of industries in the CCNY Service Region, serves regional businesses, and benefits society as a whole in New York from an expanded economy and improved quality of life. The benefits created by CCNY even extend to the state and local government through increased tax revenues and public sector savings.
This study measures the economic impacts created by CCNY on the business community and the benefits the college generates in return for the investments made by its key stakeholder groups—students, taxpayers, and society. The fol-lowing two analyses are presented:
All results reflect employee, student, and financial data, provided by the college, for fiscal year (FY) 2017-18. Impacts on the CCNY Service Region economy are reported under the economic impact analysis and are measured in terms of added income. The returns on investment to students, taxpayers, and society in New York are reported under the investment analysis.
* For the purposes of this analysis, the CCNY Service Region is comprised of Bronx, Kings, Nassau, New York, Putnam, Queens, Richmond, Rockland, Suffolk, and Westchester Counties.
CCNY influences both the lives of its students and the regional economy.
Economic impact analysis
Investment analysis

3Economic impact analysis
Economic impact analysis
CCNY promotes economic growth in the CCNY Service Region through its direct expenditures and the resulting expenditures of visitors, students, and regional businesses. The college serves as an employer and buyer of goods and services for its day-to-day and research operations. The college’s reputa-tion and activities attract visitors and students from outside the CCNY Service Region, whose expenditures benefit regional vendors. In addition, CCNY is a primary source of higher education to the CCNY Service Region residents and a supplier of trained workers to regional industries, enhancing overall produc-tivity in the regional workforce.
Operations spending impact
CCNY adds economic value to the CCNY Service Region as an employer of regional residents and a large-scale buyer of goods and services. In FY 2017-18, the college employed 2,518 full-time and
part-time faculty and staff (not including research employees), 87% of whom lived in the CCNY Service Region. Total payroll at CCNY was $249.3 million (excluding payroll from research employees), much of which was spent in the region for groceries, mortgage and rent payments, dining out, and other household expenses. In addition, the college spent $63.1 million on day-to-day expenses related to facilities, supplies, and professional services (excluding research expenditures).
CCNY’s day-to-day operations spending added $288.3 million in income to the region during the analysis year. This figure represents the college’s payroll, the multiplier effects generated by the in-region spending of the college and its employees, and a downward adjustment to account for funding that the college received from regional sources. The $288.3 million in added income is equivalent to supporting 2,839 jobs in the region.
Research spending impact
Research activities impact the economy by employing people and requiring the purchase of equipment and other supplies and ser-vices. In FY 2017-18, CCNY spent $22.5 million on payroll to support
research activities. This, along with $30 million in other research spending, created a net total of $31.9 million in added income for the regional economy. This added income is equivalent to supporting 314 jobs.
I M PAC T S C R E AT E D BY C C N Y I N F Y 2017-18
$288.3 million Operations Spending Impact
$18.3 millionConstruction Spending Impact
$31.9 millionResearch Spending Impact
$50.9 millionStudent Spending Impact
$57.4 millionVisitor Spending Impact
$1.5 billionAlumni Impact
$1.9 billionTOTAL IMPACT
16,760JOBS SUPPORTED
– O R –

4Economic impact analysis
Construction spending impact
CCNY invests in construction each year to maintain its facilities, create additional capacities, and meet its growing educational demands. While the amount varies from year to year, these quick
infusions of income and jobs have a substantial impact on the regional economy. In FY 2017-18, CCNY’s construction spending generated $18.3 million in added income, which is equivalent to supporting 220 jobs.
Visitor spending impact
Thousands of visitors from outside the region were attracted to CCNY during the analysis year to attend commencement, sports events, and other activities sponsored by the college. While in the
region, visitors spent money for lodging, food, transportation, and other per-sonal expenses. The off-campus expenditures of the college’s out-of-region visitors generated a net impact of $57.4 million in added income for the regional economy in FY 2017-18. This $57.4 million in added income is equivalent to supporting 770 jobs.
Student spending impact
Around 6% of credit students attend-ing CCNY originated from outside the region in FY 2017-18, and some of these
students relocated to the CCNY Service Region to attend CCNY. These students may not have come to the region if the college did not exist. In addition, some in-region students, referred to as retained students, would have left the CCNY Service Region if not for the existence of CCNY. While attending the college, these relocated and retained students spent money on groceries, accommodation, transporta-tion, and other household expenses. This spending generated $50.9 million in added income for the regional economy in FY 2017-18, which supported 712 jobs in the CCNY Service Region.
Alumni impact
The education and training CCNY provides for regional residents has the greatest impact. Since its establishment, students have studied at CCNY and entered the workforce with greater knowledge and new
skills. In fact, CCNY is ranked #1 by the Harvard-based Opportunity Insights. The college was selected out of 369 selective public colleges in the U.S. on the overall mobility index. This measure reflects both access and outcomes, representing the likelihood that a student at CCNY can move up two or more income quintiles.
CCNY is ranked #1 by the Harvard-based Opportunity Insights.

5Economic impact analysis
Today, thousands of former CCNY students are employed in the CCNY Service Region. As a result of their CCNY educations, the students receive higher earn-ings and increase the productivity of the businesses that employ them. In FY 2017-18, CCNY alumni generated $1.5 billion in added income for the regional economy, which is equivalent to supporting 11,906 jobs.
Total impact
CCNY added $1.9 billion in income to the CCNY Service Region economy during the analysis year, equal to the sum of the operations, research, and construction spending impacts, the visitor and student spending impacts, and the alumni impact.
CCNY’s total impact can also be expressed in terms of jobs supported. The $1.9 billion impact supported 16,760 regional jobs, using the jobs-to-sales ratios specific to each industry in the region. The 1.9 billion, or 16,760 supported jobs, stemmed from different industry sectors. Among non-education industry sec-tors, CCNY’s spending and alumni in the Professional & Technical Services industry sector supported 2,234 jobs in FY 2017-18. These are impacts that would not have been generated without the college’s presence in the CCNY Service Region.
C C N Y I M PAC T S BY I N D U S T R Y ( J O B S S U P P O RT E D)
Professional & Technical Services
Health Care & Social Assistance
Arts, Entertainment, & Recreation
Accommodation & Food Services
Retail Trade
2,234
2,084
1,009
923
756
100+93+45+41+34CCNY added $1.9 billion in income to the CCNY Service Region economy.

6Investment analysis
Investment analysis
An investment analysis evaluates the costs associated with a proposed ven-ture against its expected benefits. If the benefits outweigh the costs, then the investment is financially worthwhile. The analysis presented here considers CCNY as an investment from the perspectives of students, taxpayers, and society in New York.
Student perspective
In FY 2017-18, CCNY served 18,169 credit and 7,340 non-credit stu-dents. In order to attend the college, the students paid for tuition, fees, books, and supplies. They also took out loans and will incur
interest on those loans. Additionally, students gave up money they would have otherwise earned had they been working instead of attending college. The total investment made by CCNY’s students in FY 2017-18 amounted to a pres-ent value of $209.6 million, equal to $60.5 million in out-of-pocket expenses (including future principal and interest on student loans) and $149.1 million in forgone time and money.
In return for their investment, CCNY’s students will receive a stream of higher future earnings that will continue to grow throughout their working lives. For example, the average CCNY bachelor’s degree graduate from FY 2017-18 will see annual earnings that are $33,700 higher than a person with a high school diploma or equivalent working in New York. Over a working lifetime, the ben-efits of the bachelor’s degree over a high school diploma will amount to an undiscounted value of $1.4 million in higher earnings per graduate. The present value of the cumulative higher future earnings that CCNY’s FY 2017-18 students will receive over their working careers is $1.4 billion.
Source: Emsi employment data.
25+33+42+62+80+100< High school
High school
Associate
Bachelor’s
Master’s
Doctorate
The average bachelor’s degree graduate from CCNY will see an increase in earnings of $33,700 each year compared to a person
with a high school diploma or equivalent working in New York.
$37,200$37,200$47,800$47,800
$90,700$90,700$70,900$70,900
$28,300$28,300
$113,600$113,600
S T U D E N T S S E E A H I G H R AT E O F R E T U R N F O R T H E I R
I N V E S T M E N T I N C C N Y
Source: Forbes’ S&P 500, 1989-2018. FDIC.gov, 6-2019.
22.2%
9.9%
0.8%
44+20+2Average annual return for CCNY students
Stock market 30-year average annual return
Interest earned on savings account (National Rate Cap)

7Investment analysis
The students’ benefit-cost ratio is 6.7. In other words, for every dollar students invest in CCNY, in the form of out-of-pocket expenses and forgone time and money, they will receive a cumulative value of $6.70 in higher future earnings. Annually, the students’ investment in CCNY has an average annual internal rate of return of 22.2%, which is impressive compared to the U.S. stock market’s 30-year average rate of return of 9.9%.
Taxpayer perspective
CCNY generates more in tax revenue than it takes. These benefits to taxpayers consist primarily of taxes that the state and local govern-ment will collect from the added revenue created in the state. As
CCNY students will earn more, they will make higher tax payments throughout their working lives. Students’ employers will also make higher tax payments as they increase their output and purchases of goods and services. By the end of the FY 2017-18 students’ work-ing lives, the state and local government will have collected a present value of $521.8 million in added taxes.
Benefits to taxpayers will also consist of savings generated by the improved lifestyles of CCNY students and the corre-sponding reduced government services. Education is statisti-cally correlated with a variety of lifestyle changes. Students’ CCNY educations will generate savings in three main categories: 1) health-care, 2) crime, and 3) income assistance. Improved health will lower students’ demand for national health care services. In addition, students will be less likely to interact with the criminal justice system, resulting in a reduced demand for law enforcement and victim costs. CCNY students will be more employable, so their reduced demand for income assistance such as welfare and unem-ployment benefits will benefit taxpayers. For a list of study references, contact the college for a copy of the main report. Altogether, the present value of the benefits associated with a CCNY education will generate $110.8 million in sav-ings to state and local taxpayers.
Total taxpayer benefits amount to $632.5 million, the present value sum of the added taxes and public sector savings. Taxpayer costs are $210.4 million, equal to the amount of state and local government funding CCNY received in FY 2017-18. These benefits and costs yield a benefit-cost ratio of 3.0. This
STUDENT PERSPECTIVE
Benefit-cost Ratio Rate of Return
6.7 22.2%
TAXPAYER PERSPECTIVE
Benefit-cost Ratio Rate of Return
3.0 8.7%
SOCIAL PERSPECTIVE
Benefit-cost Ratio Rate of Return
9.3 n/a*
* The rate of return is not reported for the social per-
spective because the beneficiaries of the investment
are not necessarily the same as the original investors.
For every dollar of public money invested in CCNY, taxpayers will receive a cumulative value of $3.00 over the course of the students’ working lives.
Present value benefits$1.4 billion
$209.6 million
$1.2 billion
Present value costs
Net present value
Present value benefits$632.5 million
$210.4 million
$422.1 million
Present value costs
Net present value
Present value benefits$5.4 billion
$575.6 million
$4.8 billion
Present value costs
Net present value
8Investment analysis
means that for every dollar of public money invested in CCNY in FY 2017-18, taxpayers will receive a cumulative value of $3.00 over the course of the stu-dents’ working lives. The average annual internal rate of return for taxpayers is 8.7%, which compares favorably to other long-term investments in the public and private sectors.
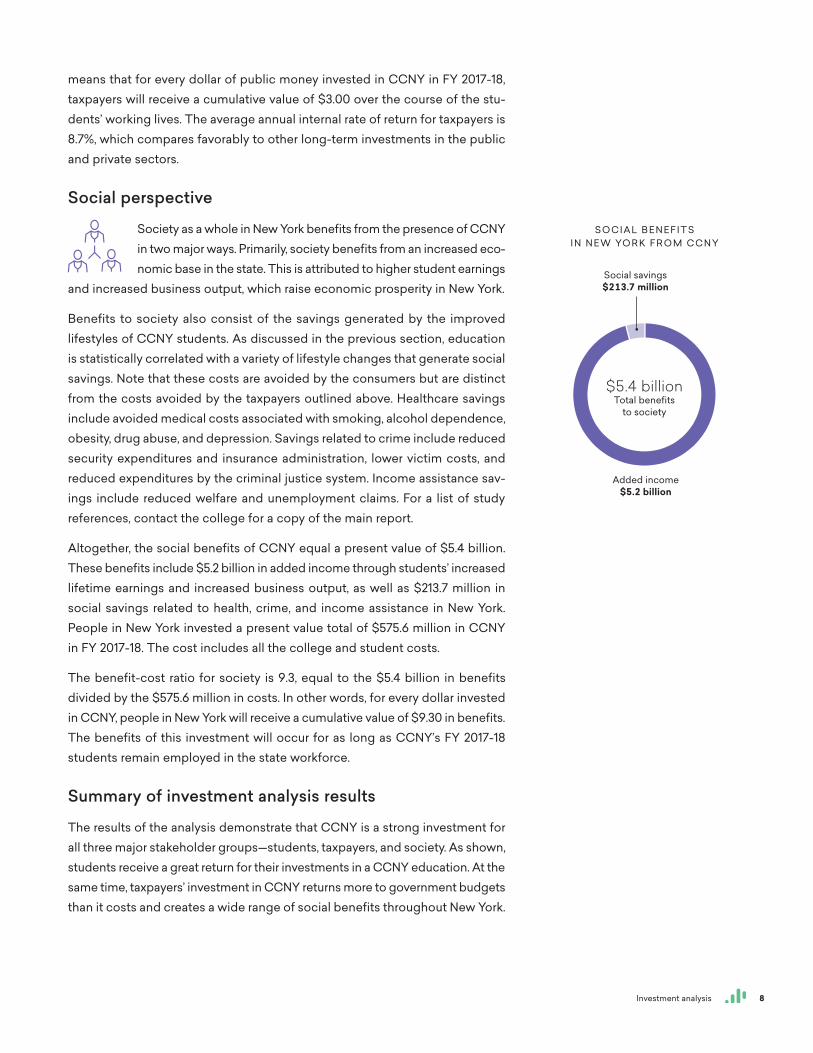
Social perspective
Society as a whole in New York benefits from the presence of CCNY in two major ways. Primarily, society benefits from an increased eco-nomic base in the state. This is attributed to higher student earnings
and increased business output, which raise economic prosperity in New York.
Benefits to society also consist of the savings generated by the improved lifestyles of CCNY students. As discussed in the previous section, education is statistically correlated with a variety of lifestyle changes that generate social savings. Note that these costs are avoided by the consumers but are distinct from the costs avoided by the taxpayers outlined above. Healthcare savings include avoided medical costs associated with smoking, alcohol dependence, obesity, drug abuse, and depression. Savings related to crime include reduced security expenditures and insurance administration, lower victim costs, and reduced expenditures by the criminal justice system. Income assistance sav-ings include reduced welfare and unemployment claims. For a list of study references, contact the college for a copy of the main report.
Altogether, the social benefits of CCNY equal a present value of $5.4 billion. These benefits include $5.2 billion in added income through students’ increased lifetime earnings and increased business output, as well as $213.7 million in social savings related to health, crime, and income assistance in New York. People in New York invested a present value total of $575.6 million in CCNY in FY 2017-18. The cost includes all the college and student costs.
The benefit-cost ratio for society is 9.3, equal to the $5.4 billion in benefits divided by the $575.6 million in costs. In other words, for every dollar invested in CCNY, people in New York will receive a cumulative value of $9.30 in benefits. The benefits of this investment will occur for as long as CCNY’s FY 2017-18 students remain employed in the state workforce.
Summary of investment analysis results
The results of the analysis demonstrate that CCNY is a strong investment for all three major stakeholder groups—students, taxpayers, and society. As shown, students receive a great return for their investments in a CCNY education. At the same time, taxpayers’ investment in CCNY returns more to government budgets than it costs and creates a wide range of social benefits throughout New York.
S O C I A L B E N E F I T S I N N E W YO R K F R O M C C N Y
9696+44+P$5.4 billionTotal benefits
to society
Added income $5.2 billion
Social savings $213.7 million

Introduction 9
Conclusion
The results of this study demonstrate that CCNY creates value from multiple perspectives. The college benefits regional businesses by increasing consumer spend-ing in the region and supplying a steady flow of quali-fied, trained workers to the workforce. CCNY enriches the lives of students by raising their lifetime earnings and helping them achieve their individual potential. The college benefits state and local taxpayers through increased tax receipts and a reduced demand for government-supported social services. Finally, CCNY benefits society as a whole in New York by creating a more prosperous economy and generating a variety of savings through the improved lifestyles of students.
About the study
Data and assumptions used in the study are based on several sources, includ-ing the FY 2017-18 academic and financial reports from CCNY, industry and employment data from the U.S. Bureau of Labor Statistics and U.S. Census Bureau, outputs of Emsi’s Multi-Regional Social Accounting Matrix model, and a variety of studies and surveys relating education to social behavior. The study applies a conservative methodology and follows standard practice using only the most recognized indicators of economic impact and investment effective-ness. For a full description of the data and approach used in the study, please contact the college for a copy of the main report.
The results of this study demonstrate that CCNY creates value from multiple perspectives.
Emsi is a labor market analytics firm that integrates data from a wide variety of sources to serve professionals in higher education, economic development, workforce development, talent acquisition, and site selection. Emsi is a leading provider of economic impact studies and labor market data to educational institutions in the U.S. and internationally. Since 2000, Emsi has completed over 2,000 economic impact studies for institutions across three countries. For more information about Emsi’s products and services, visit www.economicmodeling.com.