the economic licenses report-2015 - ajman ded · web viewthe economic licenses report-2015ajman...
TRANSCRIPT
The Economic Licenses Report-2015
Ajman DED
Planning & Development Dept 3/15/16 Ver:1.0
The contentsIntroduction1- Growth of issued licenses:-
New trade licenses New professional licenses New industrial licenses New Bidayat licenses
2- Growth of renewed licenses Renewed trade licenses Renewed professional licenses Renewed industrial licenses
3- Growth of cancelled licenses4- New licenses according to legal entity5- New licenses according to nationality6- Concentration of trade activities by sector 7- Concentration of professional activities by sector 8- Concentration of industrial activities by sector
Page 1 of 24
Introduction
Licenses of different types are considered as the most important
indicator for the business sector in the emirate of Ajman.
In the context of the quest to monitor the development of economic
activities, the Directorate of Planning and Development is publishing
the licenses report for 2015 which will be issued periodically (annually
and quarterly) to follow the growth of the business sector in the emirate
and to contribute to the process of setting economic policies that
strengthens the development of business activities ..
The report reviews the types of licenses (new , renewed and cancelled )
by economic activity , legal entity and nationality wise, further the
report addresses the sectoral concentration of economic activities.
Newly issued licenses:-
The total number of newly issued licenses in the emirate of Ajman increased slightly, registering a rate of (0.4%), rising from (3259) license in 2014 to (3273) license in 2015.This was due to the positive growth achieved in the professional licenses at a rate of (18.6%) in 2015 compared to 2014, while
Page 2 of 24
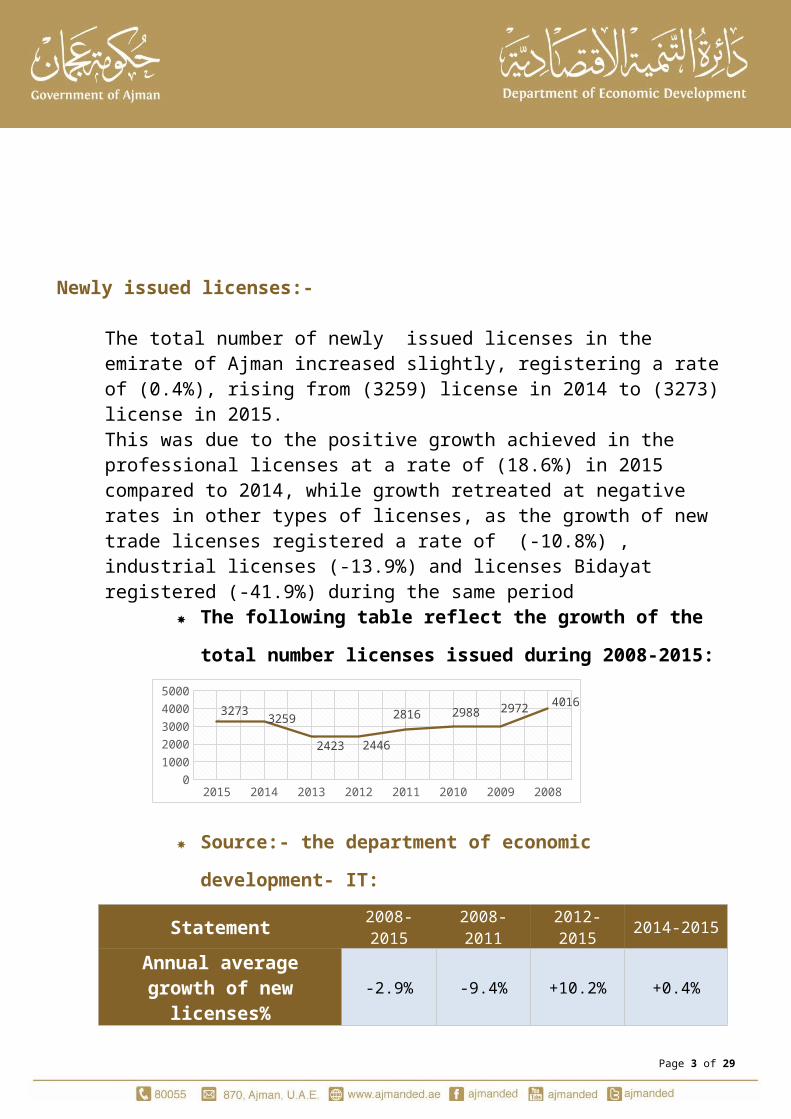
growth retreated at negative rates in other types of licenses, as the growth of new trade licenses registered a rate of (-10.8%) , industrial licenses (-13.9%) and licenses Bidayat registered (-41.9%) during the same period
The following table reflect the growth of the total number licenses issued during 2008-2015:
2015 2014 2013 2012 2011 2010 2009 20080
1000
2000
3000
4000
5000
32733259
2423 2446
2816 2988 29724016
Source:- the department of economic development- IT:
Statement 2008-2015
2008-2011
2012-2015 2014-2015
Annual average growth of new
licenses%-2.9% -9.4% +10.2% +0.4%
The total number of newly issued licenses decreased at an average annual growth rate of (-2.9%) from (4016) license in 2008 to (3273) license in 2015.The total newly issued licenses has grown at a negative average annual rate of (-9.4%) during the period from 2008 to 2011, which coincided with the global economic crisis. . The total number of newly issued licenses increased during the period that followed the global economic crisis, registered a significant rise from (2446) license in 2012 to (3273) in 2015, at an annual average rate of (10.2%).Quarterly indicators showed a remarkable growth in the total number of newly issued professional licenses, which increased from (817) license in the last quarter of 2014 to (890) license in the last quarter of 2015, at an average annual rate of (8.3%).
Page 3 of 24
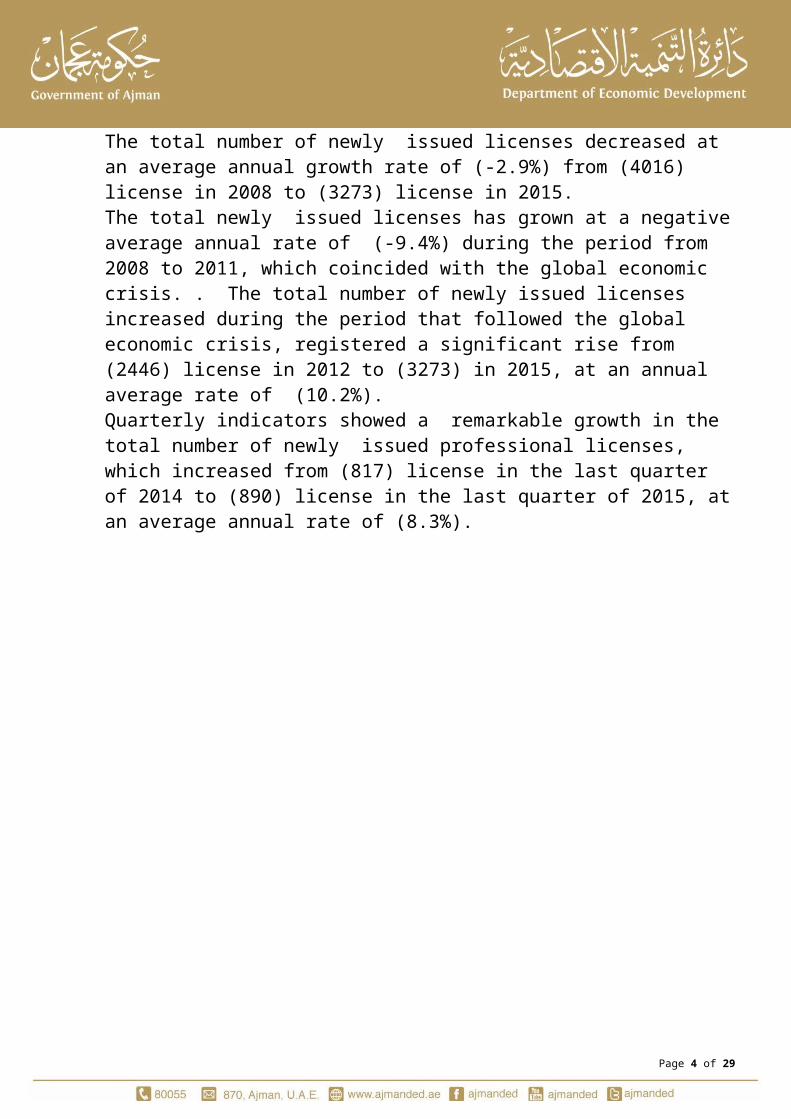
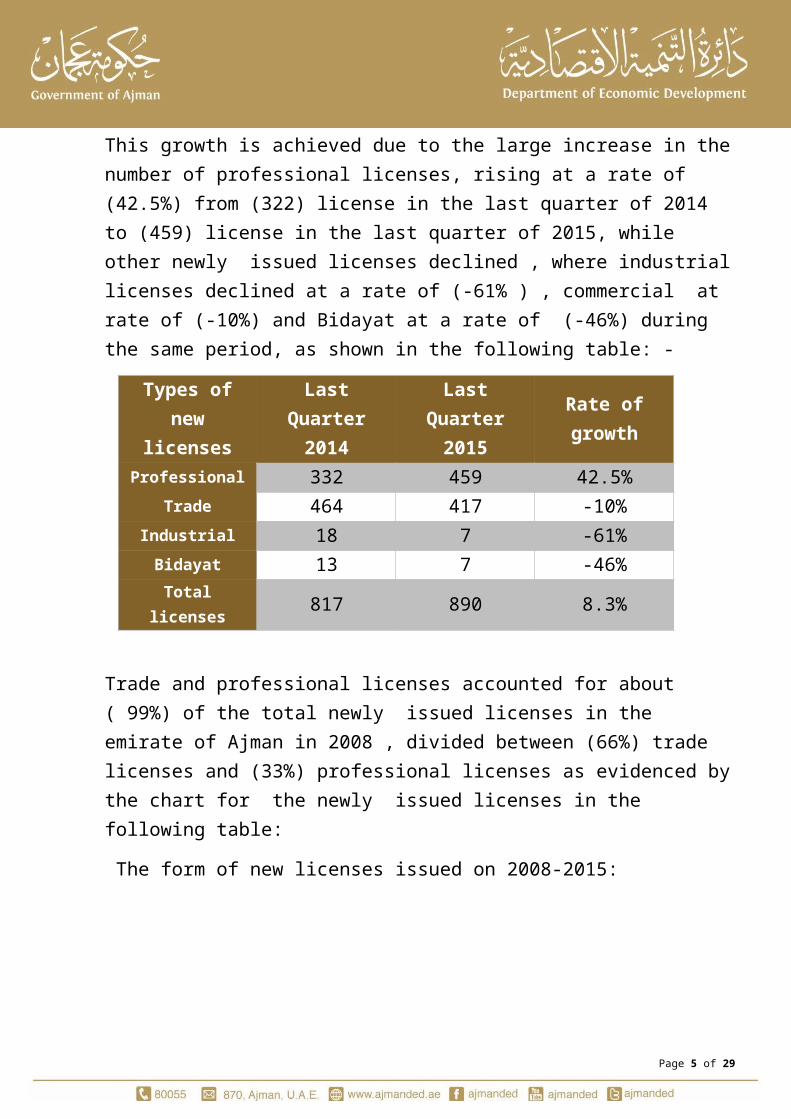
This growth is achieved due to the large increase in the number of professional licenses, rising at a rate of (42.5%) from (322) license in the last quarter of 2014 to (459) license in the last quarter of 2015, while other newly issued licenses declined , where industrial licenses declined at a rate of (-61% ) , commercial at rate of (-10%) and Bidayat at a rate of (-46%) during the same period, as shown in the following table: -
Types of new
licenses
Last Quarter
2014
Last Quarter
2015
Rate of growth
Professional 332 459 42.5%Trade 464 417 -10%
Industrial 18 7 -61%Bidayat 13 7 -46%
Total licenses 817 890 8.3%
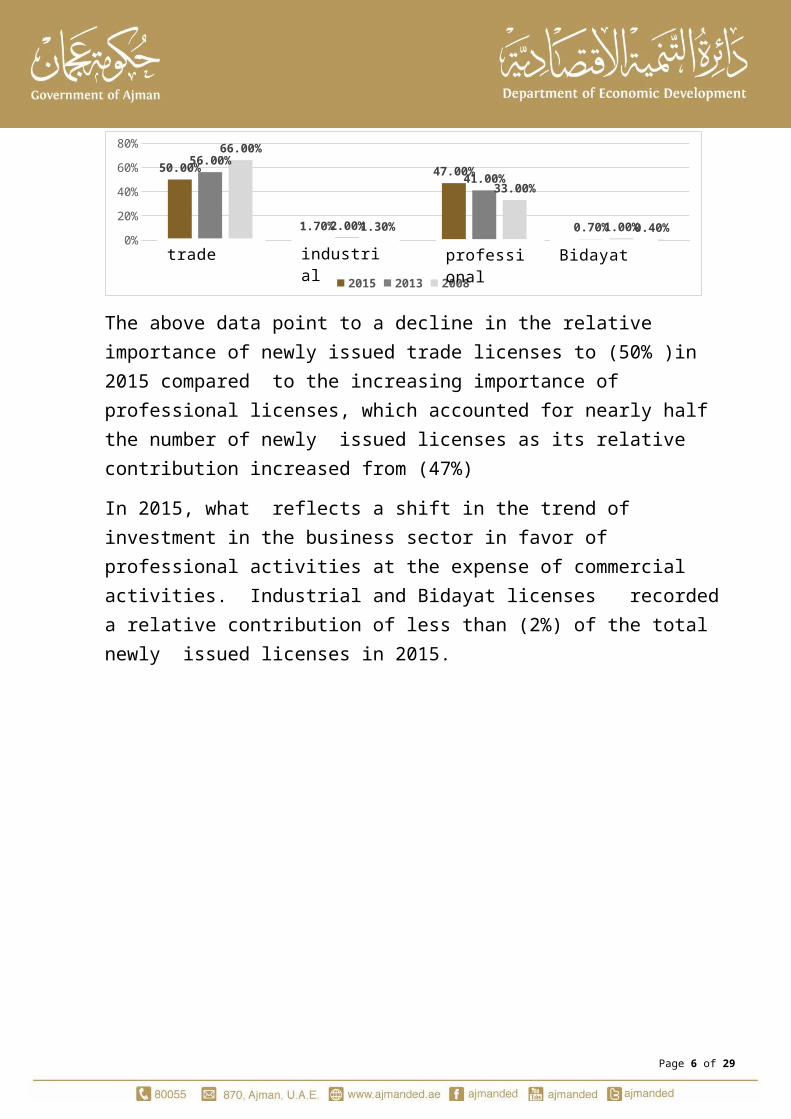
Trade and professional licenses accounted for about ( 99%) of the total newly issued licenses in the emirate of Ajman in 2008 , divided between (66%) trade licenses and (33%) professional licenses as evidenced by the chart for the newly issued licenses in the following table: The form of new licenses issued on 2008-2015:
تج;ا;ر;ية صن;ا;عي;ة مه;ن;ي;;;;;ة بداي;;;;;;ا;ت0%
10%20%30%40%50%60%70%
50.00%
1.70%
47.00%
0.70%
56.00%
2.00%
41.00%
1.00%
66.00%
1.30%
33.00%
0.40%
2015 2013 2008
Bidayatprofessionalindustrialtrade
The above data point to a decline in the relative importance of newly issued trade licenses to (50% )in 2015 compared to the increasing importance of professional licenses, which accounted for nearly half the number of newly issued licenses as its relative contribution increased from (47%)
Page 4 of 24
In 2015, what reflects a shift in the trend of investment in the business sector in favor of professional activities at the expense of commercial activities. Industrial and Bidayat licenses recorded a relative contribution of less than (2%) of the total newly issued licenses in 2015.
Page 5 of 24
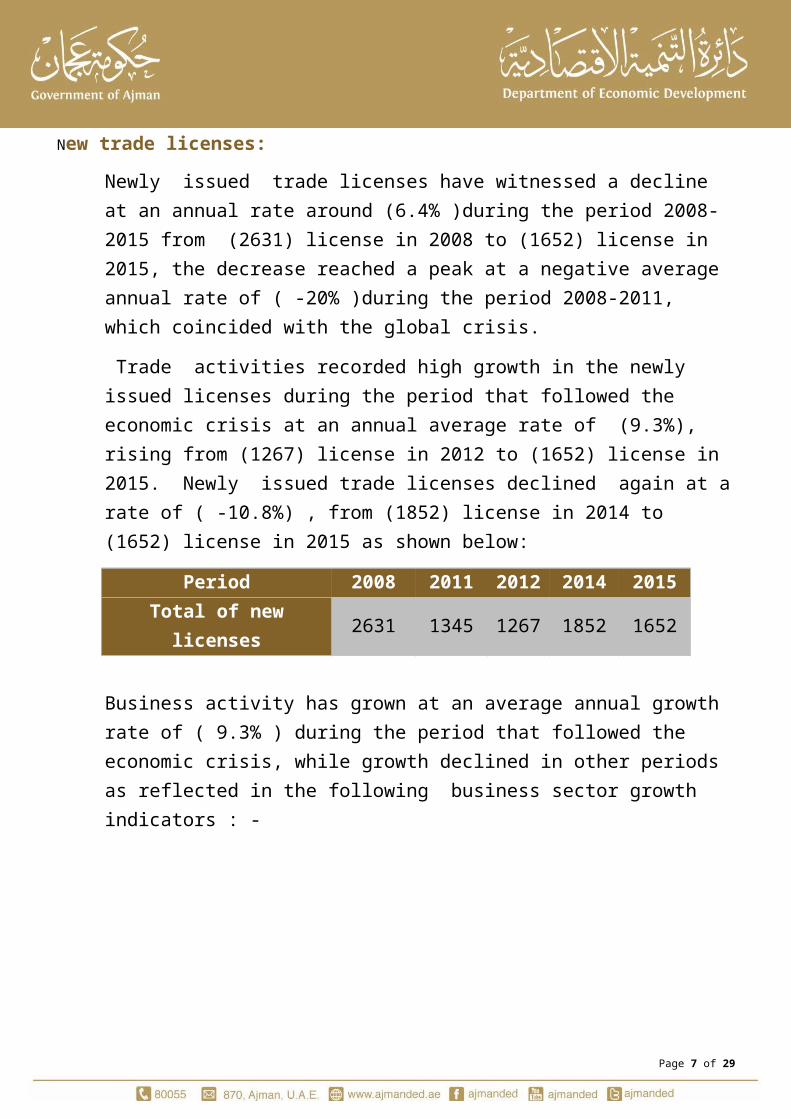
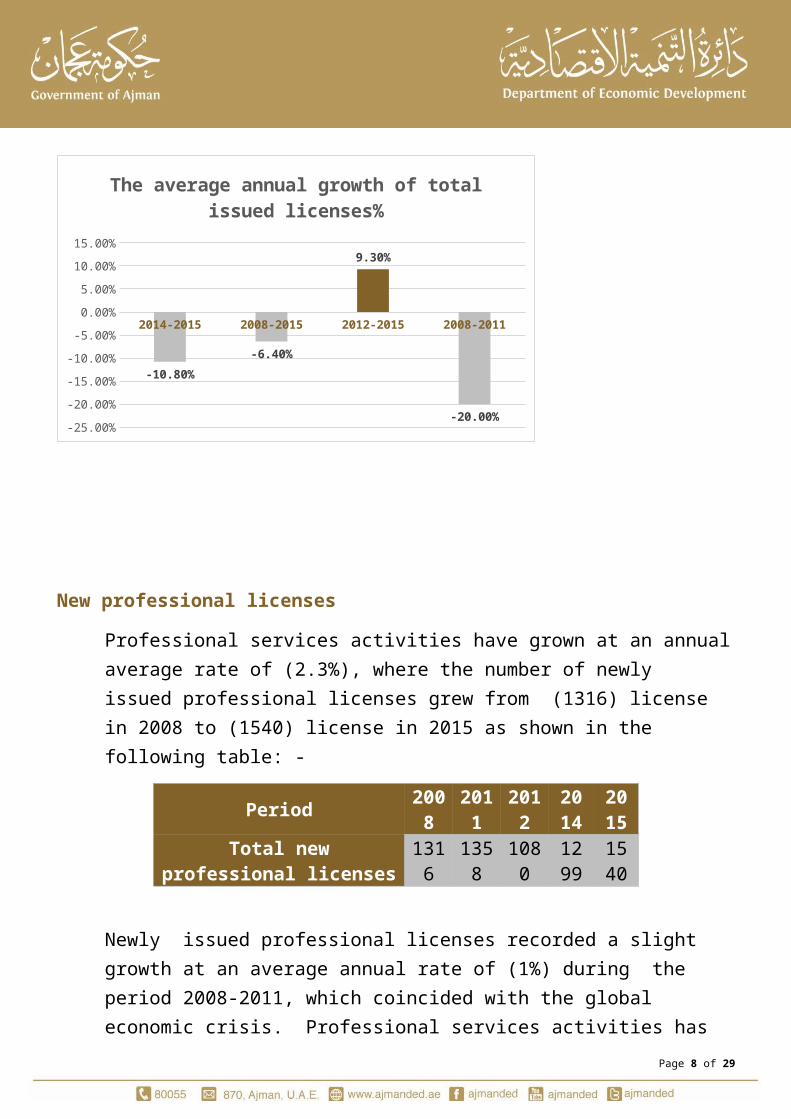
New trade licenses:Newly issued trade licenses have witnessed a decline at an annual rate around (6.4% )during the period 2008-2015 from (2631) license in 2008 to (1652) license in 2015, the decrease reached a peak at a negative average annual rate of ( -20% )during the period 2008-2011, which coincided with the global crisis. Trade activities recorded high growth in the newly issued licenses during the period that followed the economic crisis at an annual average rate of (9.3%), rising from (1267) license in 2012 to (1652) license in 2015. Newly issued trade licenses declined again at a rate of ( -10.8%) , from (1852) license in 2014 to (1652) license in 2015 as shown below:
20152014201220112008Period
16521852126713452631Total of new licenses
Business activity has grown at an average annual growth rate of ( 9.3% ) during the period that followed the economic crisis, while growth declined in other periods as reflected in the following business sector growth indicators : -
2014-2015 2008-2015 2012-2015 2008-2011
-25.00%
-20.00%
-15.00%
-10.00%
-5.00%
0.00%
5.00%
10.00%
15.00%
-10.80%
-6.40%
9.30%
-20.00%
The average annual growth of total issued licenses%
Page 6 of 24
New professional licensesProfessional services activities have grown at an annual average rate of (2.3%), where the number of newly issued professional licenses grew from (1316) license in 2008 to (1540) license in 2015 as shown in the following table: -
Period 2008
2011
2012
2014
2015
Total new professional licenses
1316
1358
1080
1299
1540
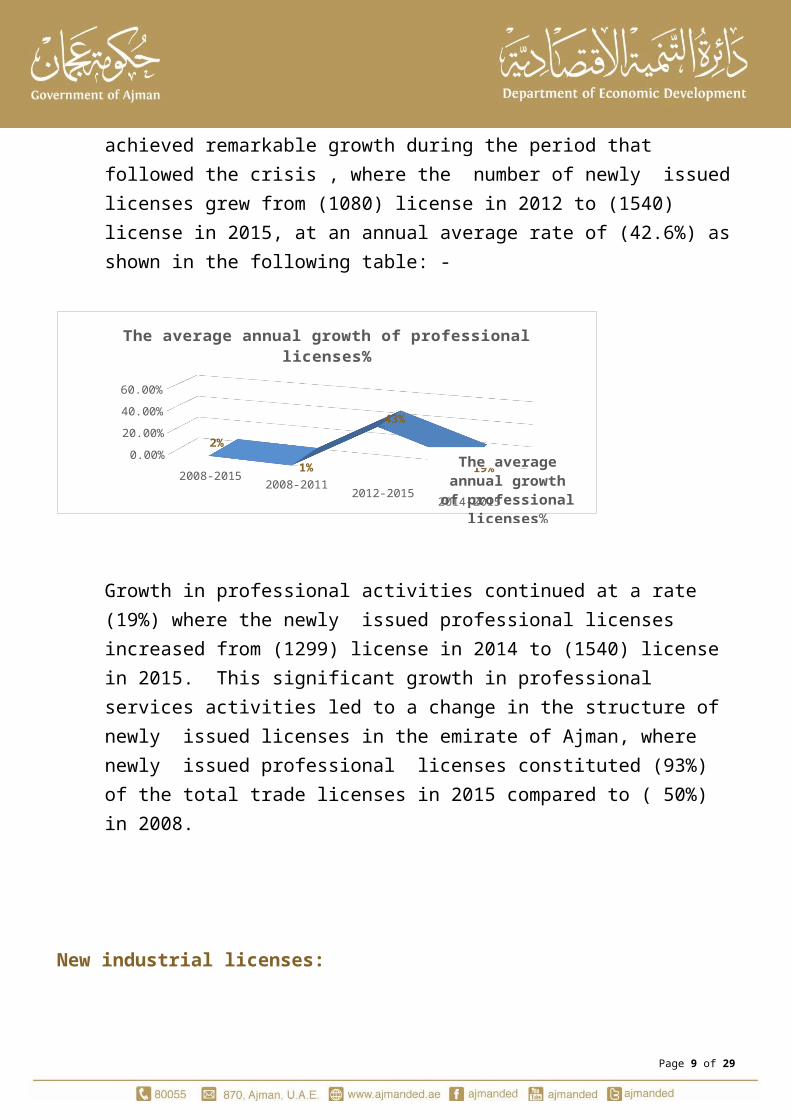
Newly issued professional licenses recorded a slight growth at an average annual rate of (1%) during the period 2008-2011, which coincided with the global economic crisis. Professional services activities has achieved remarkable growth during the period that followed the crisis , where the number of newly issued licenses grew from (1080) license in 2012 to (1540) license in 2015, at an annual average rate of (42.6%) as shown in the following table: -
2008-20152008-2011
2012-20152014-2015
0.00%10.00%20.00%30.00%40.00%50.00%
2%
1%
43%
19%
The average annual growth of professional licenses%
The average annual growth of professional
licenses%
Growth in professional activities continued at a rate (19%) where the newly issued professional licenses increased from (1299) license in 2014 to (1540) license in 2015. This significant growth
Page 7 of 24
in professional services activities led to a change in the structure of newly issued licenses in the emirate of Ajman, where newly issued professional licenses constituted (93%) of the total trade licenses in 2015 compared to ( 50%) in 2008.
New industrial licenses:Newly issued Industrial licenses witnessed a slight growth at an average annual rate of (0.8%) during the period 2008-2015. Newly issued Industrial licenses increased from (53) license in 2008 to (56) license in 2015 and with the exception of last year , the period that followed the economic crisis, witnessed a rise in industrial licenses, as reflected in the following table:
Period 2008
2011
2012
2014
2015
New industrial licenses 53 48 59 65 56
Industrial licenses decreased by (-13.9%) in 2015 compared to 2014, as shown below: -
2008-2015
2008-2011
2012-2015
2014-2015
-16.00% -14.00% -12.00% -10.00% -8.00% -6.00% -4.00% -2.00% 0.00% 2.00%
0.80%
-3.30%
-1.70%
-13.90%
The average annual growth of industrial licenses%
Page 8 of 24
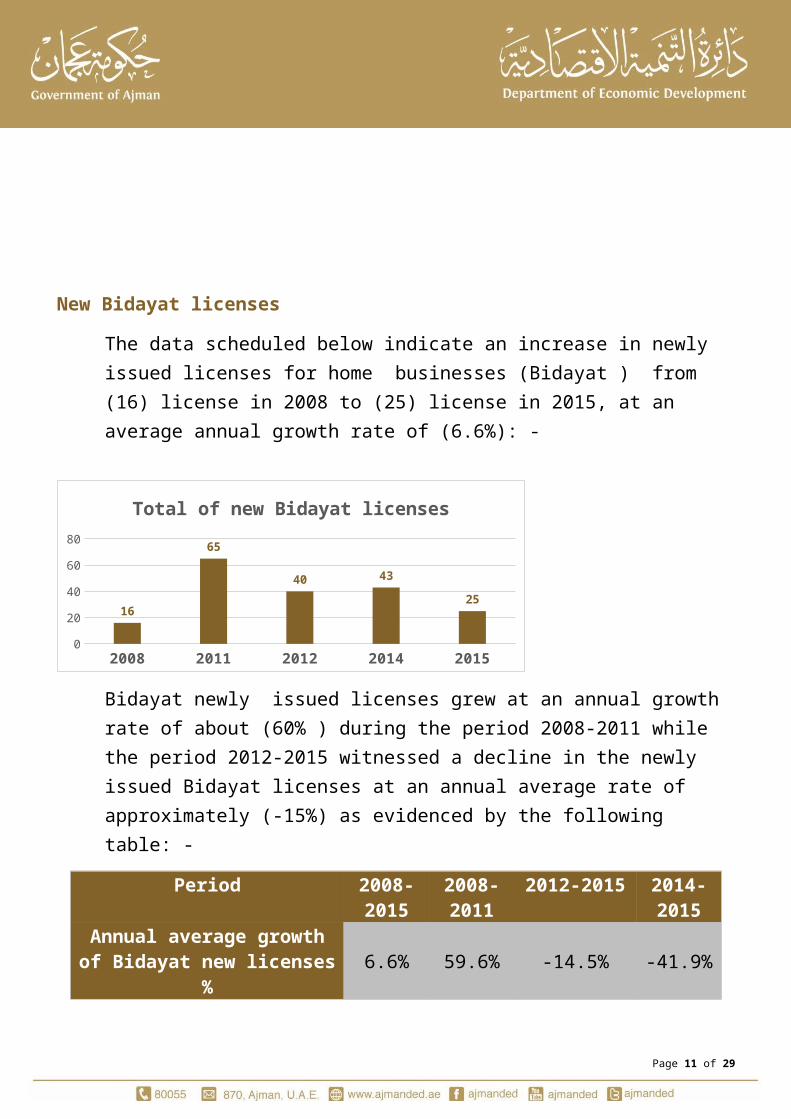
New Bidayat licensesThe data scheduled below indicate an increase in newly issued licenses for home businesses (Bidayat ) from (16) license in 2008 to (25) license in 2015, at an average annual growth rate of (6.6%): -
2008 2011 2012 2014 20150
10203040506070
16
65
40 43
25
Total of new Bidayat licenses
Bidayat newly issued licenses grew at an annual growth rate of about (60% ) during the period 2008-2011 while the period 2012-2015 witnessed a decline in the newly issued Bidayat licenses at an annual average rate of approximately (-15%) as evidenced by the following table: -
Period 2008-2015
2008-2011
2012-2015
2014-2015
Annual average growth of Bidayat new licenses
%6.6% 59.6% -14.5% -41.9%
Page 9 of 24

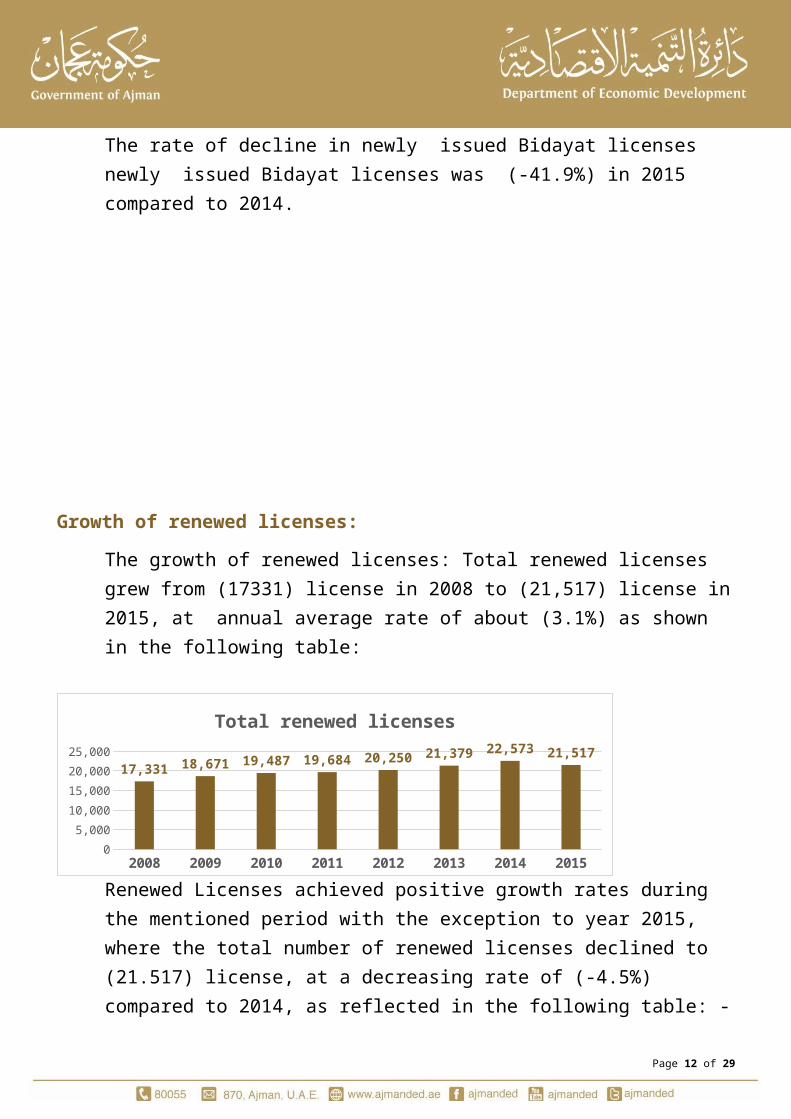
The rate of decline in newly issued Bidayat licenses newly issued Bidayat licenses was (-41.9%) in 2015 compared to 2014.
Growth of renewed licenses:The growth of renewed licenses: Total renewed licenses grew from (17331) license in 2008 to (21,517) license in 2015, at annual average rate of about (3.1%) as shown in the following table:
2008 2009 2010 2011 2012 2013 2014 20150
5,000
10,000
15,000
20,000
25,000
17,331 18,671 19,487 19,684 20,250 21,379 22,573 21,517
Total renewed licenses
Renewed Licenses achieved positive growth rates during the mentioned period with the exception to year 2015, where the total number of renewed licenses declined to (21.517) license, at a decreasing rate of (-4.5%) compared to 2014, as reflected in the following table: -
Period 2008-2015
2008-2011
2012-2015
2014-2015
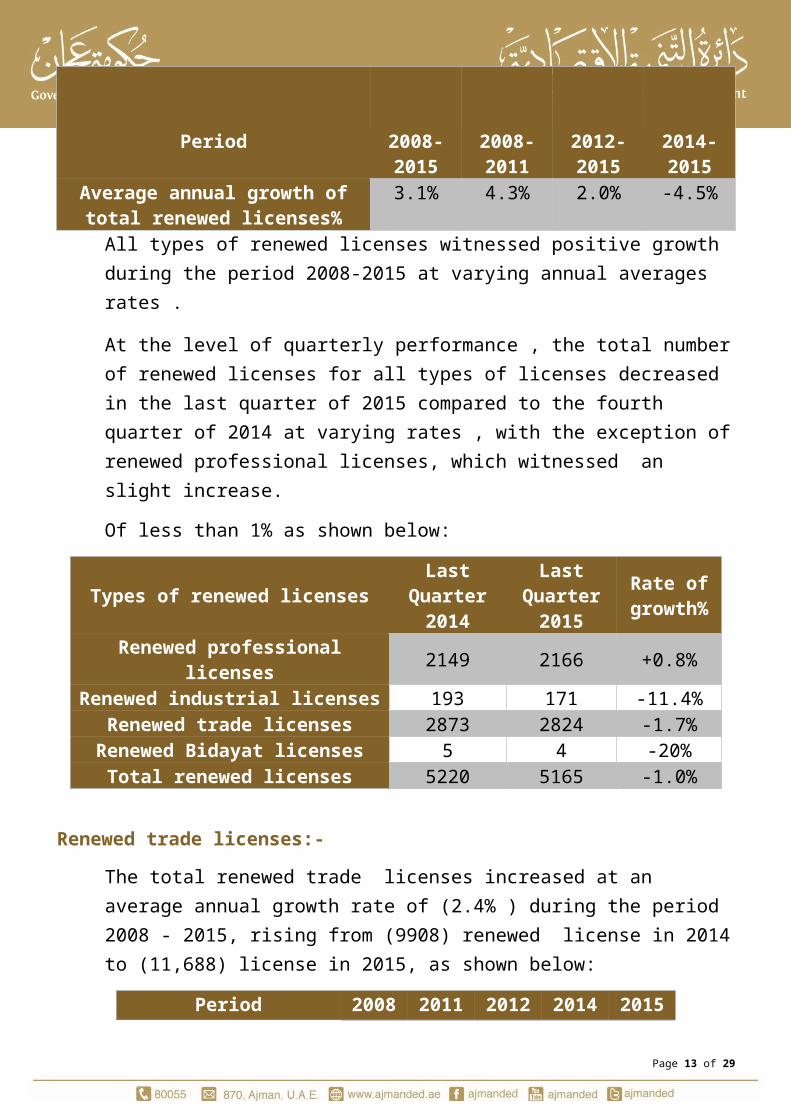
Average annual growth of total renewed licenses%
3.1% 4.3% 2.0% -4.5%
All types of renewed licenses witnessed positive growth during the period 2008-2015 at varying annual averages rates .
Page 10 of 24
At the level of quarterly performance , the total number of renewed licenses for all types of licenses decreased in the last quarter of 2015 compared to the fourth quarter of 2014 at varying rates , with the exception of renewed professional licenses, which witnessed an slight increase. Of less than 1% as shown below:
Types of renewed licensesLast
Quarter 2014
Last Quarter
2015
Rate of growth
%Renewed professional
licenses 2149 2166 +0.8%Renewed industrial licenses 193 171 -11.4%
Renewed trade licenses 2873 2824 -1.7%Renewed Bidayat licenses 5 4 -20%
Total renewed licenses 5220 5165 -1.0%
Renewed trade licenses:-The total renewed trade licenses increased at an average annual growth rate of (2.4% ) during the period 2008 - 2015, rising from (9908) renewed license in 2014 to (11,688) license in 2015, as shown below:
Period 2008 2011 2012 2014 2015total renewed trade licenses 9908 1070
81091
71229
61168
8
Renewed trade licenses renewed grown at an annual average rate of (2.6% )during the period 2008-2011 and (2.3%) during the period 2012-2015 to decline by (5%) in 2015 to (11688) renewed license . The following table reflects the positive growth in renewed trade licenses during the period 2008-2015 with the exception of last year:
Period 2008-2015
2008-2011
2012-2015
2014-2015
The average annual rate 2.4% 2.6% 2.3% -5.0%
Page 11 of 24
of growth for renewed trade licenses
Renewed trade license constituted about (54%) of the total renewed licenses in 2015 compared to (57%).
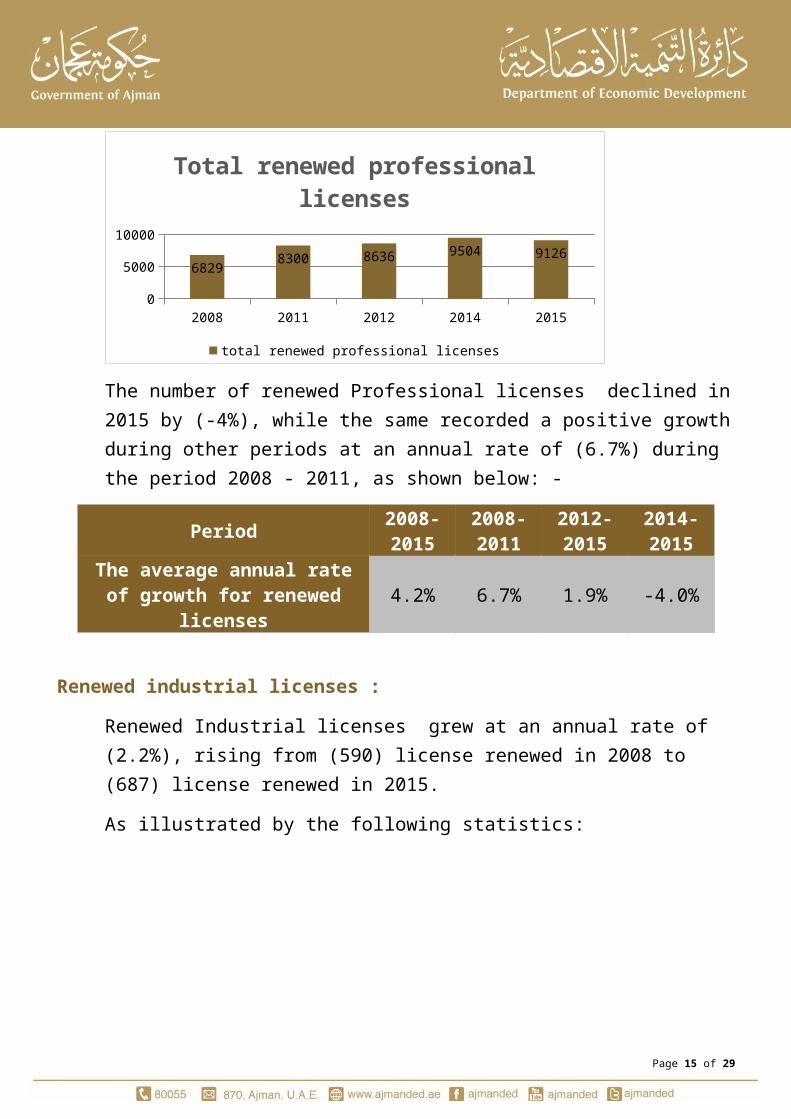
Renewed professional licenses:Renewed Professional licenses grown at an annual average of (4.2%) during the period 2008 - 2015 from (6829) renewed Professional licenses at a rate of (39%) of the total licenses renewed in 2008 to (9126) License , constituting a rate of (42%) of the total licenses renewed in 2015. the following table reflects the growth of renewed Professional licenses during the period 2008 - 2015:
2008 2011 2012 2014 20150
2000
4000
6000
8000
10000
68298300 8636
9504 9126
Total renewed professional licenses
total renewed professional licenses
The number of renewed Professional licenses declined in 2015 by (-4%), while the same recorded a positive growth during other periods at an annual rate of (6.7%) during the period 2008 - 2011, as shown below: -
Period 2008-2015
2008-2011
2012-2015
2014-2015
The average annual rate of growth for renewed
licenses4.2% 6.7% 1.9% -4.0%
Renewed industrial licenses :
Page 12 of 24
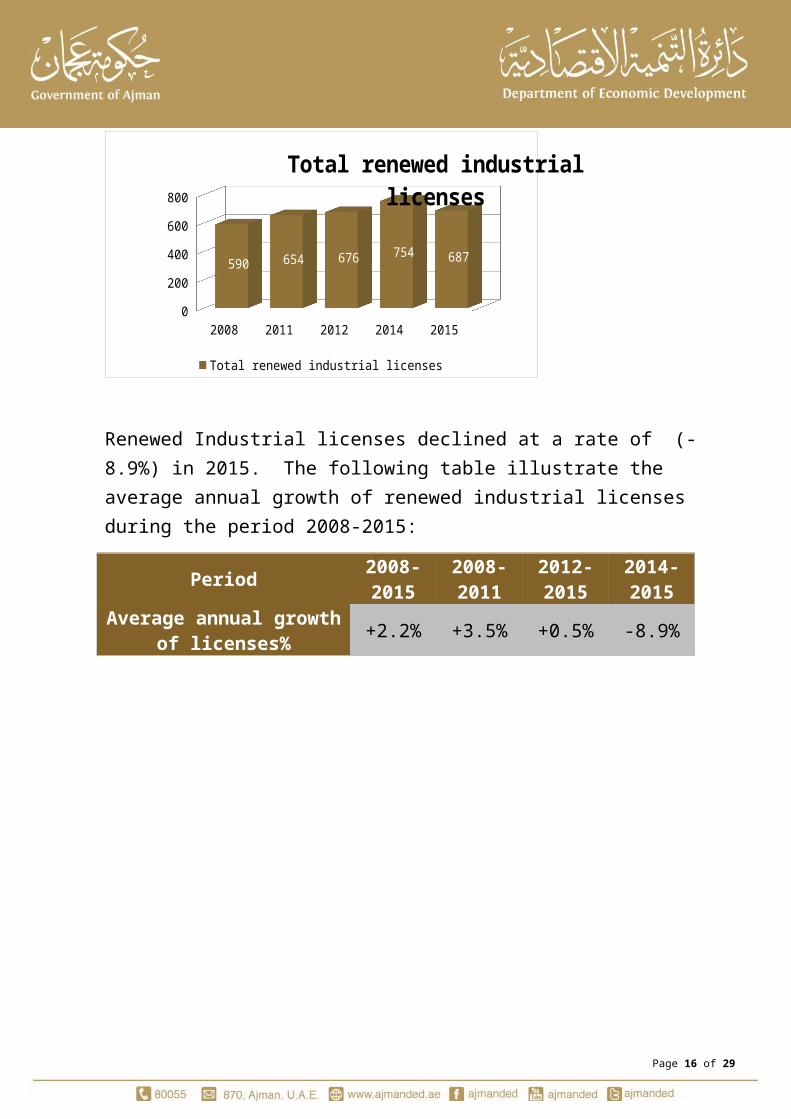
Renewed Industrial licenses grew at an annual rate of (2.2%), rising from (590) license renewed in 2008 to (687) license renewed in 2015. As illustrated by the following statistics:
2008 2011 2012 2014 20150
100200300400500600700800
590 654 676 754 687
Total renewed industrial licenses
Total renewed industrial licenses
Renewed Industrial licenses declined at a rate of (-8.9%) in 2015. The following table illustrate the average annual growth of renewed industrial licenses during the period 2008-2015:
Period 2008-2015
2008-2011
2012-2015
2014-2015
Average annual growth of licenses% +2.2% +3.5% +0.5% -8.9%
Page 13 of 24

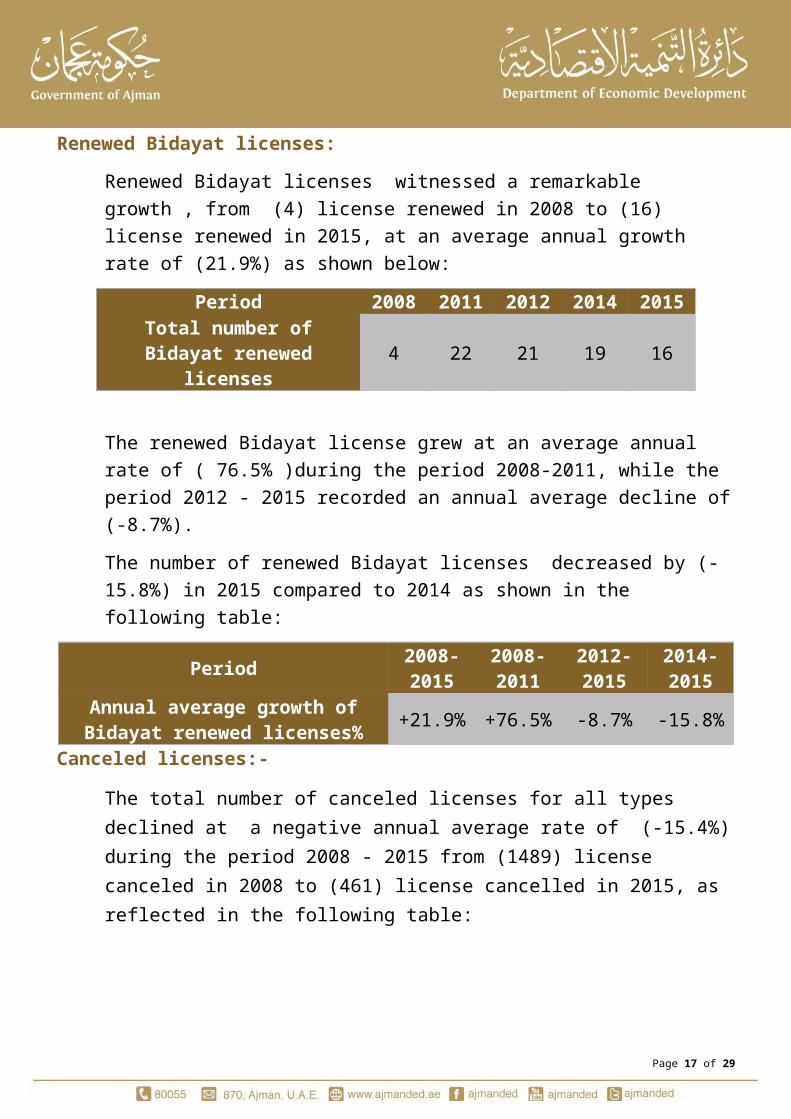
Renewed Bidayat licenses:Renewed Bidayat licenses witnessed a remarkable growth , from (4) license renewed in 2008 to (16) license renewed in 2015, at an average annual growth rate of (21.9%) as shown below:
Period 2008 2011 2012 2014 2015Total number of Bidayat renewed
licenses4 22 21 19 16
The renewed Bidayat license grew at an average annual rate of ( 76.5% )during the period 2008-2011, while the period 2012 - 2015 recorded an annual average decline of (-8.7%).The number of renewed Bidayat licenses decreased by (-15.8%) in 2015 compared to 2014 as shown in the following table:
Period 2008-2015
2008-2011
2012-2015
2014-2015
Annual average growth of Bidayat renewed licenses%
+21.9%
+76.5% -8.7% -15.8%
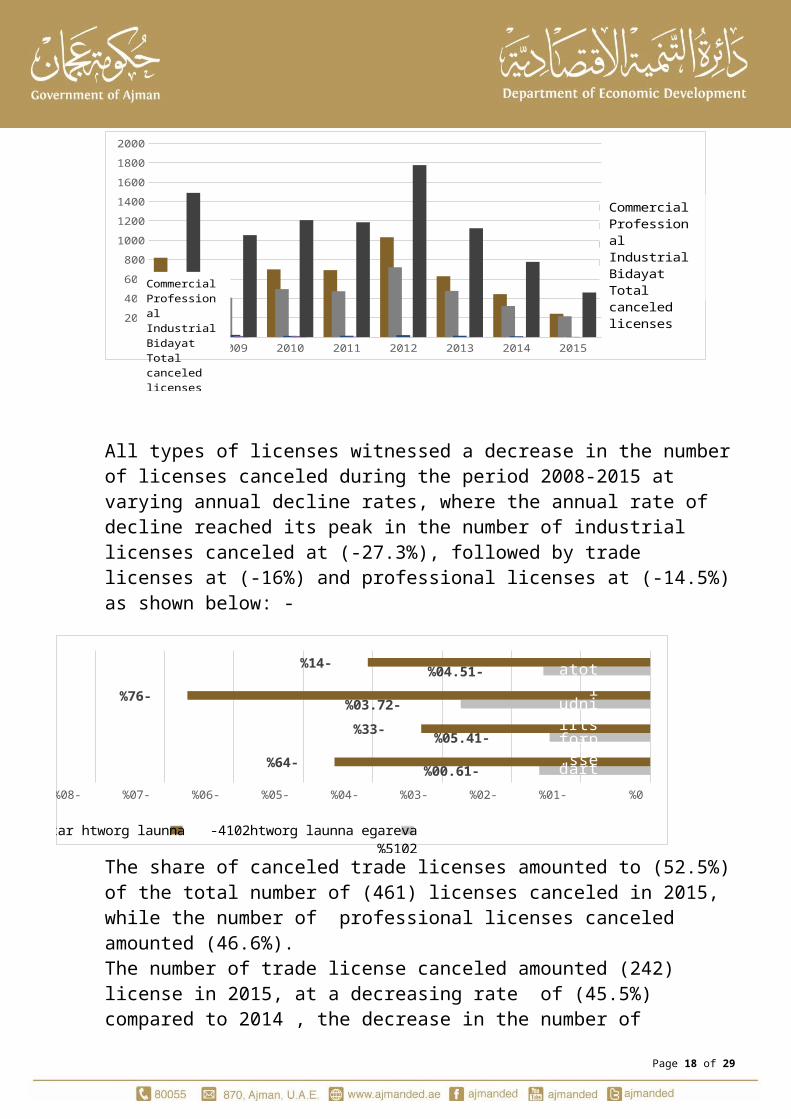
Canceled licenses:-The total number of canceled licenses for all types declined at a negative annual average rate of (-15.4%) during the period 2008 - 2015 from (1489) license canceled in 2008 to (461) license cancelled in 2015, as reflected in the following table:
2008 2009 2010 2011 2012 2013 2014 20150
200
400
600
800
1000
1200
1400
1600
1800
2000
1489
1053
1208
1186
1776
1124
777
461
تج;ا;ر;يةمه;ن;ي;ةصن;ا;عي;ةبدايا;ت
CommercialProfessionalIndustrialBidayatTotal canceled licenses
CommercialProfessionalIndustrialBidayatTotal canceled licenses
Page 14 of 24
All types of licenses witnessed a decrease in the number of licenses canceled during the period 2008-2015 at varying annual decline rates, where the annual rate of decline reached its peak in the number of industrial licenses canceled at (-27.3%), followed by trade licenses at (-16%) and professional licenses at (-14.5%) as shown below: -
%08- %07- %06- %05- %04- %03- %02- %01- %0
%00.61-
%05.41-
%03.72-
%04.51-
%64-
%33-
%76-
%14- latot
sudni -lairtorp -
.ssefedart
a%5102-4102etar htworg launna %5102-4102htworg launna egareva
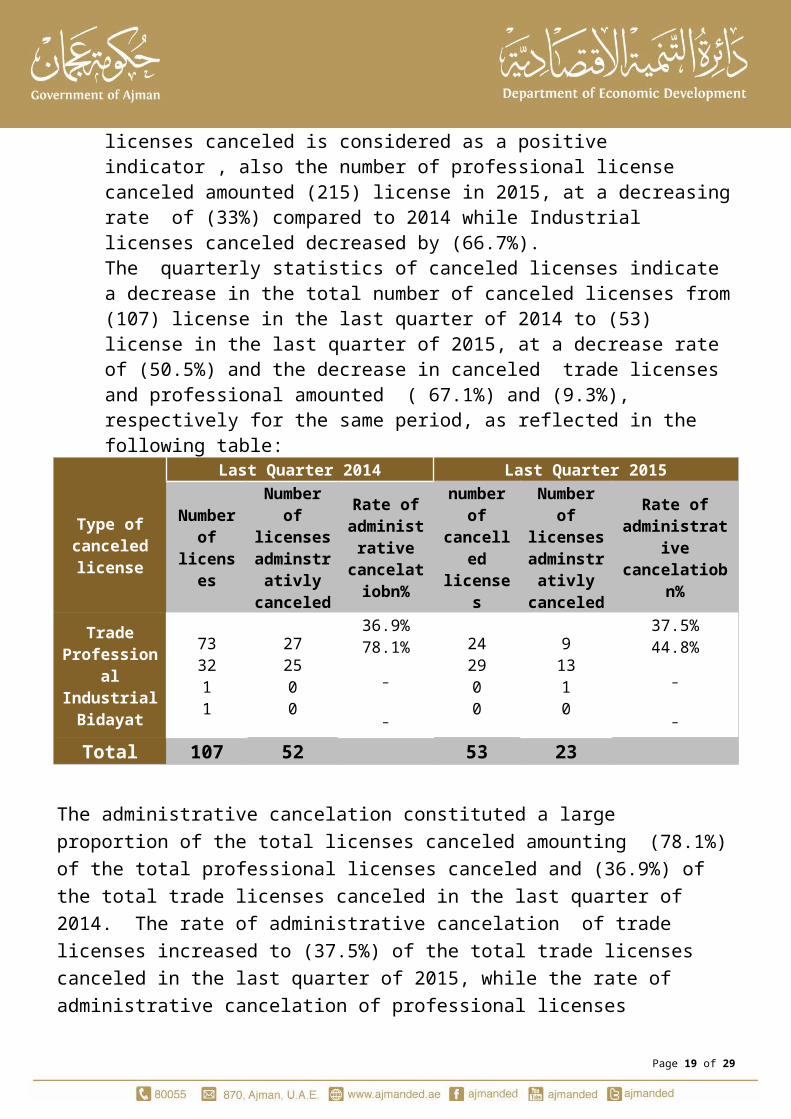
The share of canceled trade licenses amounted to (52.5%) of the total number of (461) licenses canceled in 2015, while the number of professional licenses canceled amounted (46.6%). The number of trade license canceled amounted (242) license in 2015, at a decreasing rate of (45.5%) compared to 2014 , the decrease in the number of licenses canceled is considered as a positive indicator , also the number of professional license canceled amounted (215) license in 2015, at a decreasing rate of (33%) compared to 2014 while Industrial licenses canceled decreased by (66.7%). The quarterly statistics of canceled licenses indicate a decrease in the total number of canceled licenses from (107) license in the last quarter of 2014 to (53) license in the last quarter of 2015, at a decrease rate of (50.5%) and the decrease in canceled trade licenses and professional amounted ( 67.1%) and (9.3%), respectively for the same period, as reflected in the following table:
Type of canceled license
Last Quarter 2014 Last Quarter 2015
Number of
licenses
Number of
licenses adminstrativly cancele
d
Rate of administ
rative cancelatiobn%
number of
cancelled
licenses
Number of
licenses adminstrativly cancele
d
Rate of administrati
ve cancelatiob
n%
Trade 73 27 36.9% 24 9 37.5%Page 15 of 24
Professional
IndustrialBidayat
3211
2500
78.1%--
2900
1310
44.8%--
Total 107 52 53 23
The administrative cancelation constituted a large proportion of the total licenses canceled amounting (78.1%) of the total professional licenses canceled and (36.9%) of the total trade licenses canceled in the last quarter of 2014. The rate of administrative cancelation of trade licenses increased to (37.5%) of the total trade licenses canceled in the last quarter of 2015, while the rate of administrative cancelation of professional licenses decreased to (44.8%) of the total professional licenses canceled. Classifying newly issued licenses by legal entity :
Legal enity2013 2014 2015
Number
Rate%
Number Rate% Numb
er Rate%Single owned establishment 1131 49% 1538 47.7% 1413 42%
A limited liability
company 584 25.3
% 804 24.9% 804 23.9%
Partnership company 4 0.17
% 3 0.09% 6 0.17%Public
shareholding company
1 0.04% - - 2 0.05%
Joint venture 2 0.08% 2 0.06% 1 0.02%
Services agent 570 24.7% 858 26.6% 1076 32%
Business company 4 0.17
% 4 0.12% 8 0.23%Foreign
company branch
- - 1 0.03% - -
Page 16 of 24
Newly issued licenses were classified at (98%) covering three main legal forms , on the top appear the single owned establishments, followed by limited liability companies then service agent as shown below:
The number of licenses for single owned establishments increased from (1131) license in 2013 to (1413) license in 2015, at an average annual growth rate of (11.7% )during this period. Licenses for single owned establishments occupied the first rank constituting for about half of the number of newly issued licenses at a rate (49%) of the total number of newly issued licenses in 2013 then dropped to (42% ) in 2015.
Limited liability companies appear in second place in terms of the relative importance constituting for about (25%) and (24%) of the total newly issued licenses in 2013 and 2015 respectively, the licenses for limited liability companies increased from (584) license in 2013 to (804) license in 2015, at an average annual growth rate of (17.3%). Service agent licenses Increased significantly at an annual average rate of approximately (37.3%) from (570) license in 2013 to (1076) license in 2015 and its relative importance increased from (24.7%) in 2013 to (32%) of the total newly issued licenses in 2015.
Page 17 of 24
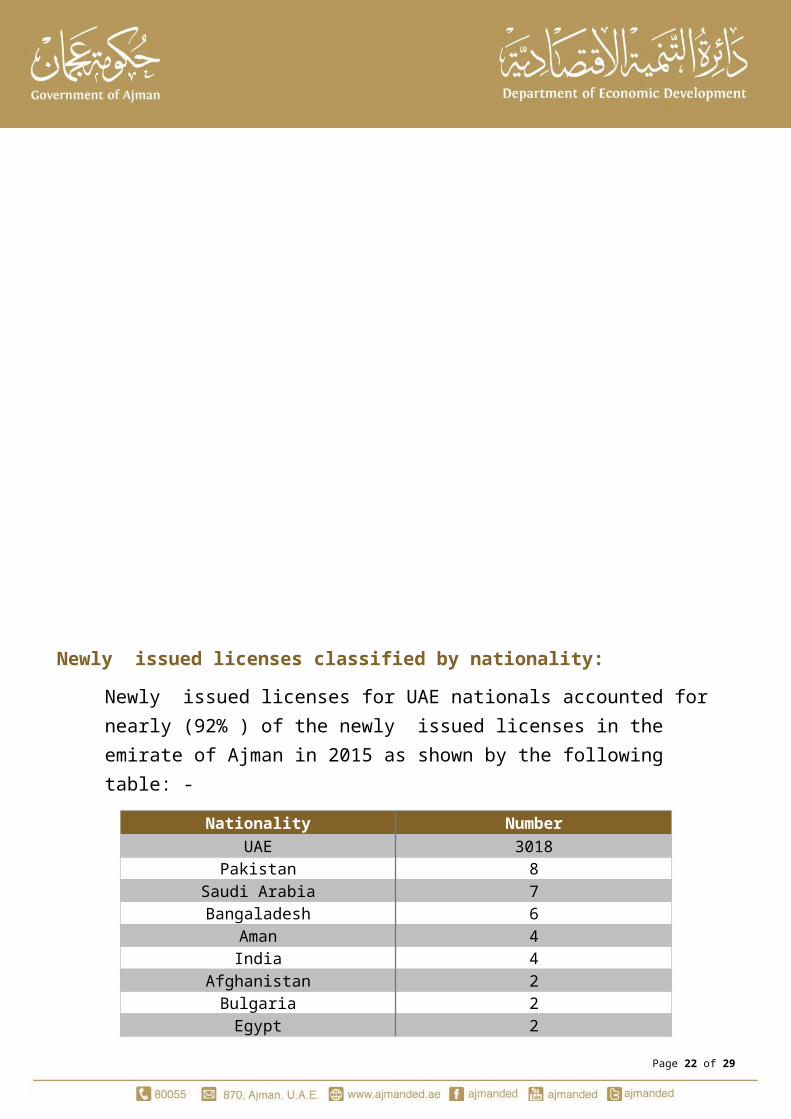
Newly issued licenses classified by nationality:Newly issued licenses for UAE nationals accounted for nearly (92% ) of the newly issued licenses in the emirate of Ajman in 2015 as shown by the following table: -
Nationality NumberUAE 3018
Pakistan 8Saudi Arabia 7Bangaladesh 6
Aman 4India 4
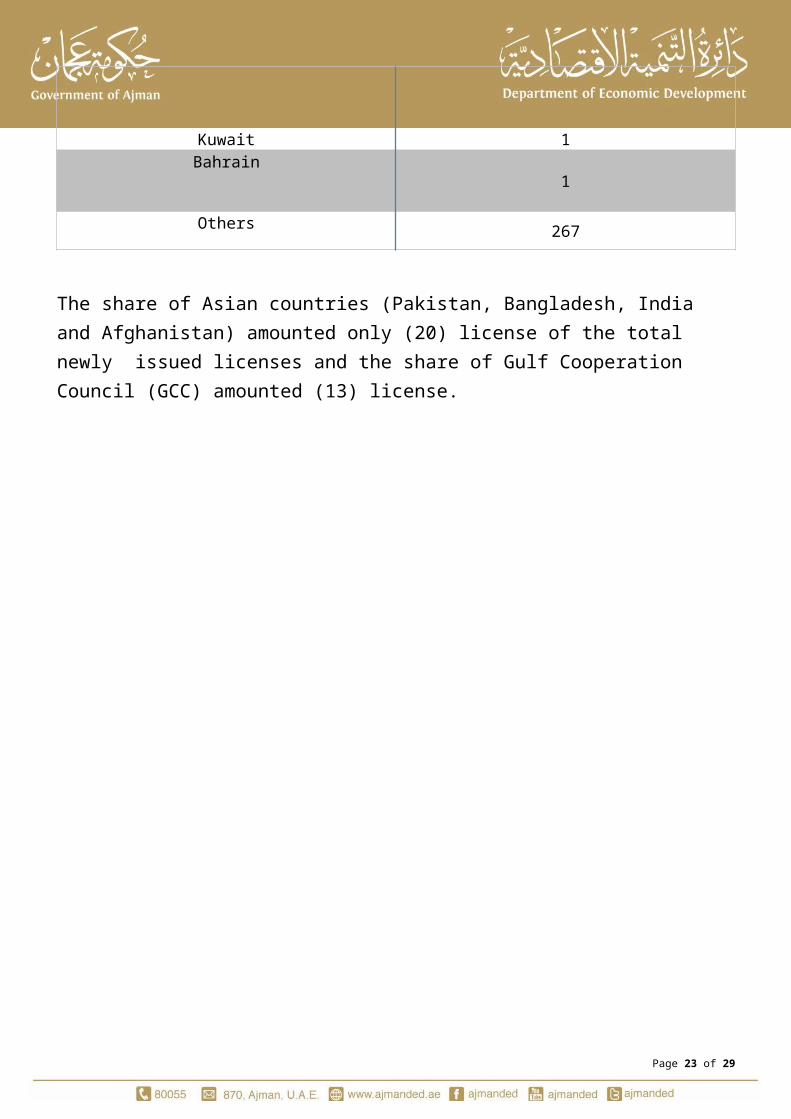
Afghanistan 2Bulgaria 2Egypt 2Kuwait 1Bahrain 1Others 267
The share of Asian countries (Pakistan, Bangladesh, India and Afghanistan) amounted only (20) license of the total newly issued licenses and the share of Gulf Cooperation Council (GCC) amounted (13) license.
Page 18 of 24
The Sectoral Concentration of commercial activities:The newly issued trade licenses to the top ten activities in 2015:The total number of newly issued licenses to the top ten business activities amounted (1391) license distributed as shown in the table below: -
Activitynumber
of issued
licenses
Percentage of licenses to the
top ten business activities
General maintenance contracting 461 33%
Readymade garments trading 173 12%General trading 156 11%
Snack food selling 136 10%Contracting for installing
electromechanical equipment 131 9%Foods and beverage trading 89 6%Building contracting(G+1) 71 5%
Mobile phones and accesories 60 4%Perfumes and cosmotics 57 4%
Selling and buying lands and real estates 57 4%
The newly issued trade licenses to the top ten commercial
activities 1391
Total licenses issued for commercial activities 1652
Trade licenses concentrated by (33%) of the total newly issued licenses to the top ten activities , where general maintenance Contracting topped the list constituting (461) license in 2015. The activity of trading in readymade garments is the second in the list with (173) license at a rate of (11%) of the total ten activities, followed by general trade having (156) license at a rate of (10%) and selling snacks followed by (136) license at a rate of (8%)and contracting for installation of electromechanical equipment having (131) license at a rate of ( 8%). It should be noted that the
Page 19 of 24

import and export operations acquired (310) license taking a rate of (22%) of the total number of licenses for the top ten activities , knowing that the import and export is not an activity in itself. The five activities mentioned above , which topped the list at a rate of (64%) of the total newly issued trade licenses in 2015.
The Sectoral concentration of professional activities:The newly issued professional licenses for the top ten activities amounting for (873) constituted for (57%) of the total newly issued professional licenses in 2015, distributed among the following activities: - Newly issued professional licenses to the top ten activities in 2015:
Activity
number of
issued license
s
Percentage of new licenses to total
issued for top ten activities %
Building maintenance 123 14%Building cleaning services 105 12%
Resturant 103 11.8%Tile, marble and ceramic
installing 102 11.7%Entrior decorations 101 11.6%Ladies dress sewing 99 11.3%
embroidery 71 8.1%Mens hair cutting 57 6.5%
Real estate management 57 6.5%Sewing and embroidery of
women's abaya 55 6.3%Newly issued professional
licenses to the top ten activities :
873
Total new professional licenses 1540
Page 20 of 24

building maintenance activity topped the list of the top ten professional acitivities with (123) license at a rate of (14%) of the e total number of newly issued professional licenses in 2015. in the second rank came the activity for Building Cleaning Services with (105) license at a rate of ( 12%), followed by restaurants activity with (103) license at a rate of (11.8%) , then installing tile , marble , ceramics and interior design. The top five professional activities covered (61%) of the total newly issued professional licenses of the top ten professional activities at a rate of (35%) of the total newly issued professional licenses in 2015.
Page 21 of 24
The Sectoral concentration for industrial activities:The newly issued industrial licenses amounted (33) licenses covering (59%) of the total number of newly issued industrial licenses in 2015 concentrated in ten activities detailed as follows: - Newly issued industrial licenses to the top ten activities in 2015:
Activitynumber
of issued
licenses
Percentage of new licenses
to total issued for top ten activities %
Metal works imndustry 6 18%Drinking water purification 5 15%
Perfumes 4 12%Automatic bakery 4 12%Furniture industry 3 9%Scafolding industry 3 9%
Aggergates 2 6%Sweets 2 6%
Household sheets 2 6%Building chemicals 2 6%
total newly issued industrial licenses to the top ten activities
in 2015:
33
total newly issued industrial licenses in 2015:
56
Metal manufacturing activity is in the top of list of the top ten industrial activities covering (18%), followed by activity of drinking water purification and filtering at a rate of (15%) and perfume industry and automatic bakeries covering (12% )each, then house furniture industry and scaffolding by (9% ) of the total number of newly issued licenses for the top ten industrial activities, where the above table refers to the concentration of licenses in the top five activities at a rate of (67%) of the total newly issued industrial licenses to the top ten industrial activities.
Page 22 of 24
Page 23 of 24