the economic impact of tourism in new york key trends in 2015 new york state’s tourism economy...
TRANSCRIPT

2015 Calendar Year
The Economic Impact of Tourism in New York

2
State Summary
3
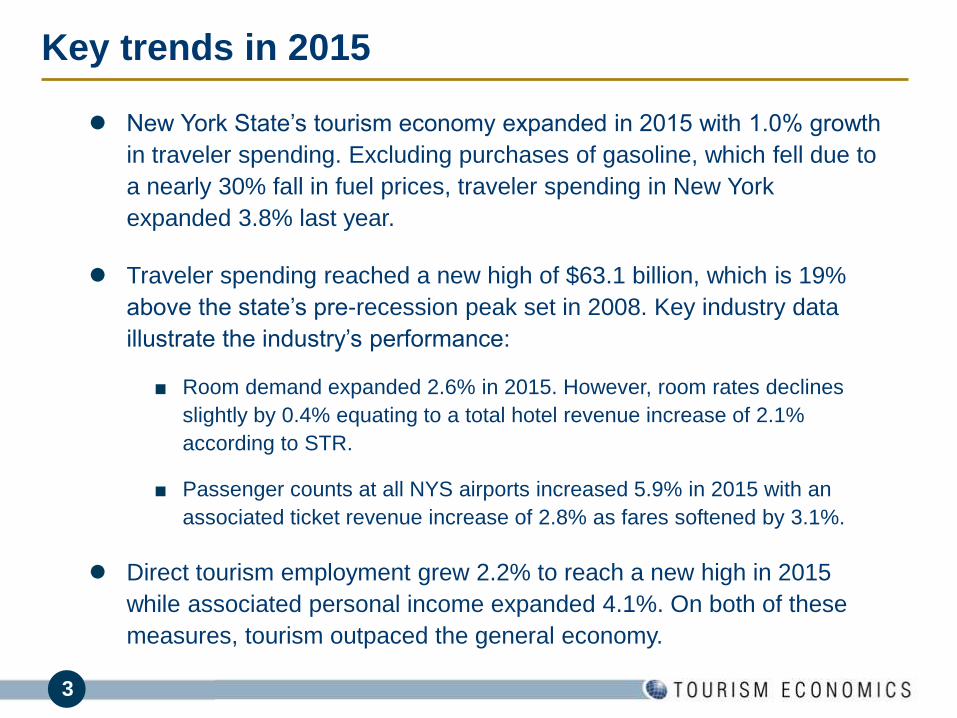
Key trends in 2015
New York State’s tourism economy expanded in 2015 with 1.0% growth
in traveler spending. Excluding purchases of gasoline, which fell due to
a nearly 30% fall in fuel prices, traveler spending in New York
expanded 3.8% last year.
Traveler spending reached a new high of $63.1 billion, which is 19%
above the state’s pre-recession peak set in 2008. Key industry data
illustrate the industry’s performance:
■ Room demand expanded 2.6% in 2015. However, room rates declines
slightly by 0.4% equating to a total hotel revenue increase of 2.1%
according to STR.
■ Passenger counts at all NYS airports increased 5.9% in 2015 with an
associated ticket revenue increase of 2.8% as fares softened by 3.1%.
Direct tourism employment grew 2.2% to reach a new high in 2015
while associated personal income expanded 4.1%. On both of these
measures, tourism outpaced the general economy.

4
Headline results
Travel & tourism is a substantial and growing component of the New
York State economy.
New York traveler spending grew 1.0% in 2014 to $63.1 billion.
This spending generated $102 billion in total business sales
including indirect and induced impacts.
764,000 jobs were sustained by tourism activity last year with total
income of $33.1 billion.
8.3% (1-in-12) of all New York state employment is sustained by
tourism, either directly or indirectly.
New York State tourism generated $8.0 billion in state and local
taxes in 2015, saving each NYS household an average of $1,100 in
taxes.

5
Tourism is vital to the NYS labor market
The unemployment rate in New York State was 5.3% in 2015. If the jobs
sustained by travelers were eliminated, the unemployment rate would rise to
13.2%.
5.3%
13.2%
0.0%
2.0%
4.0%
6.0%
8.0%
10.0%
12.0%
14.0%
Unemployment rate Unemployment rate withouttourism
Unemployment Rate in New York State
Source: BLS, Tourism Economics
2015

6
Traveler spending growth
Traveler spending continued
to expand in 2015, growing
1.0% after a 5.4% rebound in
2014. Excluding purchases of
gasoline, traveler spending in
expanded 3.8% last year.
As a result, the tourism
economy reached another
high in 2015, with $63.1 billion
in traveler spending.
Traveler spending growth has
averaged 4.9% per year since
the recovery began in 2010
(compound annual growth).
-15%
-10%
-5%
0%
5%
10%
$-
$10
$20
$30
$40
$50
$60
$70
2008 2009 2010 2011 2012 2013 2014 2015
TOTAL % change
T
A
New York Traveler Spending
$ billions
Source: Tourism Economics
% change

7
New York State tourism markets
US domestic markets
supplied 70% ($44 bn) of
the New York State’s
traveler spending base in
2015.
International markets
represented 30% ($19 bn)
of the spending base.
Domestic70%
Canada2%
Overseas28%
Traveler Spending by Market, 2015
Source: Tourism Economics
8
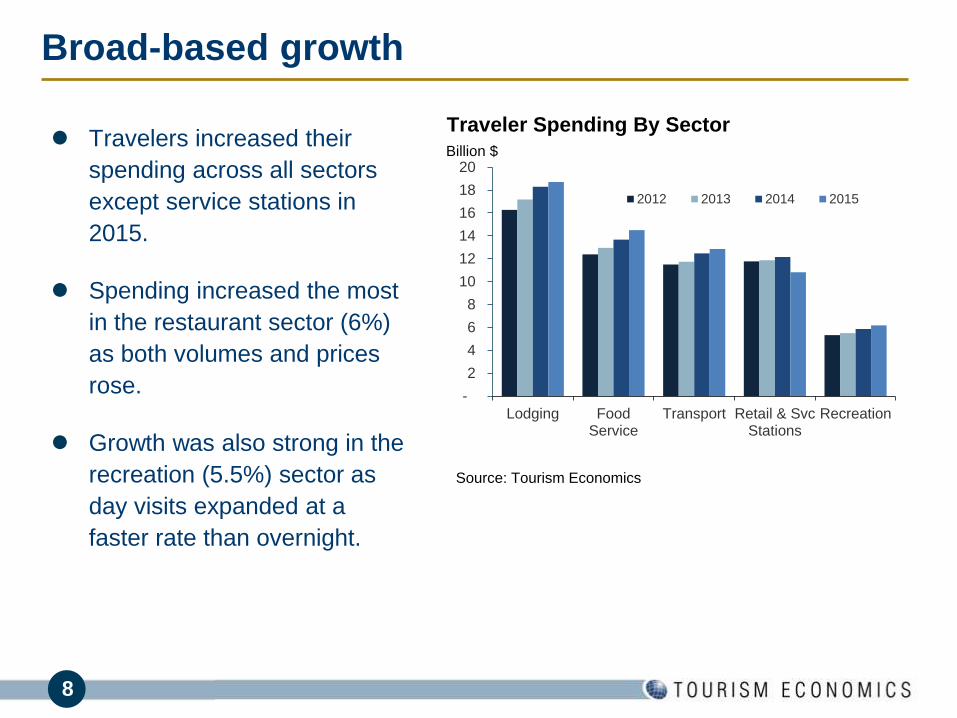
Broad-based growth
Travelers increased their
spending across all sectors
except service stations in
2015.
Spending increased the most
in the restaurant sector (6%)
as both volumes and prices
rose.
Growth was also strong in the
recreation (5.5%) sector as
day visits expanded at a
faster rate than overnight.
-
2
4
6
8
10
12
14
16
18
20
Lodging FoodService
Transport Retail & SvcStations
Recreation
2012 2013 2014 2015
Traveler Spending By Sector
Billion $
Source: Tourism Economics

9
Traveler spending distribution
Traveler spending is diverse and well-distributed across multiple sectors of the economy.
Lower fuel prices shifted visitor spending toward the recreation, restaurant, and lodging
industries in 2015.
Transport20%
Lodging29%Food Service
22%
Recreation9%
Retail & Svc Stations
20%
Traveler Spending by Sector, 2014
Source: Tourism Economics
Transport20%
Lodging30%
Food Service23%
Recreation10%
Retail & Svc Stations
17%
Traveler Spending by Sector, 2015
Source: Tourism Economics

10
Historic traveler spending by sector
Transport Lodging Food
Service
Recreation Retail & Svc
Stations
TOTAL % change
2005 6,453$ 11,575$ 9,663$ 4,259$ 4,615$ 43,431$ 8.6%
2006 6,587$ 12,832$ 10,565$ 4,668$ 4,950$ 46,574$ 7.2%
2007 7,361$ 14,301$ 11,357$ 5,191$ 5,360$ 51,081$ 9.7%
2008 7,610$ 14,710$ 11,492$ 5,336$ 5,462$ 53,108$ 4.0%
2009 6,626$ 12,208$ 10,511$ 4,668$ 4,471$ 45,777$ -13.8%
2010 10,108$ 13,873$ 11,313$ 4,817$ 9,664$ 49,775$ 8.7%
2011 10,875$ 15,155$ 11,806$ 5,019$ 11,055$ 53,910$ 8.3%
2012 11,504$ 16,267$ 12,379$ 5,332$ 11,775$ 57,257$ 6.2%
2013 11,740$ 17,180$ 12,953$ 5,498$ 11,874$ 59,245$ 3.5%
2014 12,473$ 18,292$ 13,676$ 5,863$ 12,152$ 62,456$ 5.4%
2015 12,853$ 18,714$ 14,502$ 6,183$ 10,825$ 63,077$ 1.0%
2015 % change 3.1% 2.3% 6.0% 5.5% -10.9% 1.0%
NYS Traveler Spending, millions

11
Traveler spending by market
Domestic Canada Overseas Total
2010 35,075$ 1,304$ 13,396$ 49,775$
2011 37,579$ 1,395$ 14,937$ 53,910$
2012 40,050$ 1,495$ 15,711$ 57,257$
2013 41,030$ 1,554$ 16,661$ 59,245$
2014 43,533$ 1,638$ 17,285$ 62,456$
2015 44,045$ 1,540$ 17,493$ 63,077$
2010 Growth 5.8% 15.2% 16.7% 8.7%
2011 Growth 7.1% 7.0% 11.5% 8.3%
2012 Growth 6.6% 7.2% 5.2% 6.2%
2013 Growth 2.4% 3.9% 6.0% 6.2%
2014 Growth 6.1% 5.4% 3.7% 5.4%
2015 Growth 1.2% -6.0% 1.2% 1.0%
NYS Traveler Spending by Market
While spending from domestic and overseas markets both grew
1.2%, the Canadian market declined 6% as demand was deterred
by the stronger US dollar.

12
How traveler spending generates impact
• Lastly, the induced impact is
generated when employees
whose incomes are
generated either directly or
indirectly by tourism, spend
those incomes in the city
economy.
• Travelers create direct economic value within a discreet group of sectors (e.g. recreation,
transportation). This supports a relative proportion of jobs, wages, taxes, and GDP within
each sector.
• Each directly affected sector also purchases goods and services as inputs (e.g. food
wholesalers, utilities) into production. These impacts are called indirect impacts.

13
Traveler-generated sales
Including the indirect and induced impacts, traveler spending
generated $102 billion in business sales in 2015, up 1.9%.
Direct* Indirect Induced Total % change
Agriculture, Fishing, Mining - 420 179 600 3.4%
Construction and Utilities - 1,214 578 1,792 3.4%
Manufacturing - 2,021 1,673 3,694 3.3%
Wholesale Trade - 1,263 1,180 2,443 3.3%
Air Transport 8,832 52 66 8,950 2.8%
Other Transport 4,021 1,171 404 5,597 3.5%
Retail Trade 6,187 321 1,993 8,501 3.8%
Gasoline Stations 4,638 12 69 4,719 -24.9%
Communications - 1,297 737 2,033 3.4%
Finance, Insurance and Real Estate 2,274 3,403 2,787 8,465 3.4%
Business Services - 6,291 1,680 7,971 3.4%
Education and Health Care - 22 3,631 3,653 3.1%
Recreation and Entertainment 6,183 312 251 6,746 5.3%
Lodging 16,440 113 134 16,687 2.1%
Food & Beverage 14,502 425 834 15,762 5.8%
Personal Services - 348 790 1,138 3.2%
Government - 483 2,784 3,267 3.2%
TOTAL 63,077 19,168 19,772 102,017 1.9%
% change 1.0% 3.5% 3.1% 1.9%
Note: Direct Sales include cost of goods sold for retail and gasoline stations
Tourism Sales (Output)
(US$ Million, 2015)

14
0
2,000
4,000
6,000
8,000
10,000
12,000
14,000
16,000
18,000
Lodg
ing
Re
sta
ura
nts
Air T
ransport
Re
tail
Trd
FIR
E
Busin
ess S
vc
Re
cre
atio
n
Gas s
tations
Oth
er
Tra
nsp
Manufa
ctu
ring
Edu
c, H
ealth
Govern
men
t
Whole
sale
Trd
Induced
Indirect
Direct
$ million
Traveler-Generated Sales by Industry
Traveler-generated sales
* Direct sales include cost of goods sold for retail
** Air transport includes local airline and airport operations, including sales generated by inbound visitors,
plus outbound and transit passengers
*** FIRE = Finance, Insurance, and Real Estate
Significant indirect benefits
15
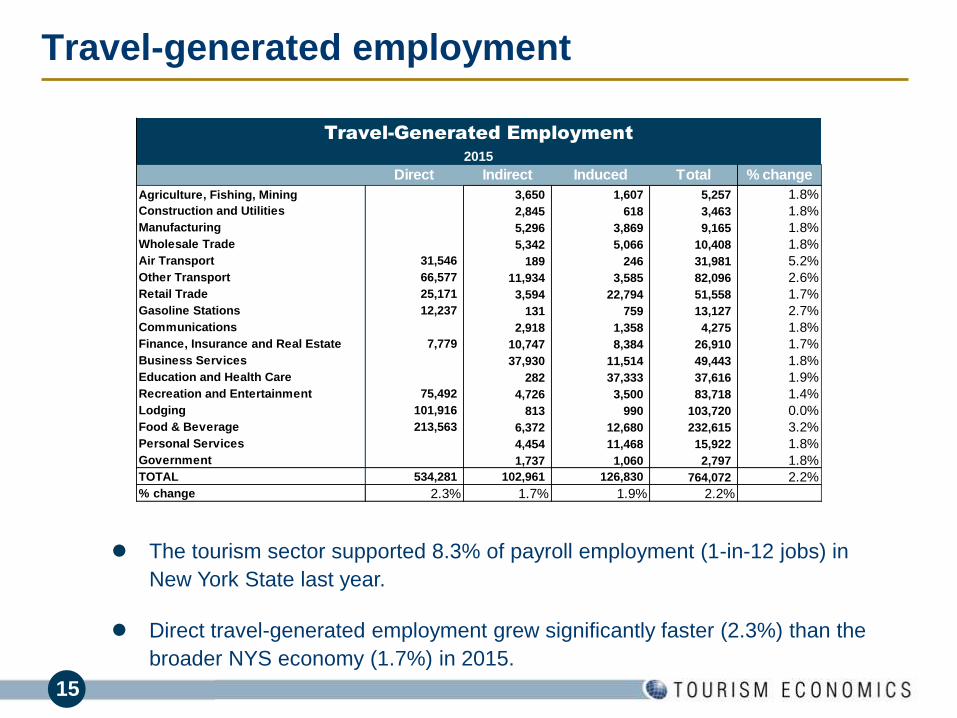
Travel-generated employment
The tourism sector supported 8.3% of payroll employment (1-in-12 jobs) in
New York State last year.
Direct travel-generated employment grew significantly faster (2.3%) than the
broader NYS economy (1.7%) in 2015.
Direct Indirect Induced Total % change
Agriculture, Fishing, Mining 3,650 1,607 5,257 1.8%
Construction and Utilities 2,845 618 3,463 1.8%
Manufacturing 5,296 3,869 9,165 1.8%
Wholesale Trade 5,342 5,066 10,408 1.8%
Air Transport 31,546 189 246 31,981 5.2%
Other Transport 66,577 11,934 3,585 82,096 2.6%
Retail Trade 25,171 3,594 22,794 51,558 1.7%
Gasoline Stations 12,237 131 759 13,127 2.7%
Communications 2,918 1,358 4,275 1.8%
Finance, Insurance and Real Estate 7,779 10,747 8,384 26,910 1.7%
Business Services 37,930 11,514 49,443 1.8%
Education and Health Care 282 37,333 37,616 1.9%
Recreation and Entertainment 75,492 4,726 3,500 83,718 1.4%
Lodging 101,916 813 990 103,720 0.0%
Food & Beverage 213,563 6,372 12,680 232,615 3.2%
Personal Services 4,454 11,468 15,922 1.8%
Government 1,737 1,060 2,797 1.8%
TOTAL 534,281 102,961 126,830 764,072 2.2%
% change 2.3% 1.7% 1.9% 2.2%
Travel-Generated Employment
2015

16
Tourism employment
In 2007, the tourism sector supported 7.7% of payroll employment and now
stands at 8.3% of payroll employment as measured by the US Bureau of
Labor Statistics.
Since 2009, travel-sustained employment has expanded 15.6%.
0
100
200
300
400
500
600
700
800
2010 2011 2012 2013 2014 2015
Direct Indirect InducedThousands
Traveler-Generated Employment

17
Tourism employment is leading growth
Direct tourism employment growth outpaced the overall NYS economy with
growth of 2.3%.
1.7%
2.3%
1.0%
1.2%
1.4%
1.6%
1.8%
2.0%
2.2%
2.4%
Total nonfarm Direct tourism employment
Employment Growth in 2015
Source: BLS, Tourism Economics

18
Tourism is outpacing economy
Direct tourism employment has outpaced the overall NYS labor market
consistently since 2010, with tourism employment growing a cumulative
17.3% compared to just 8% for total non-farm employment.
85
90
95
100
105
110
115
120
2007 2008 2009 2010 2011 2012 2013 2014 2015
Direct tourism employment
Total non-farm employment
T
A
New York State Employment
2007=100
Source: Tourism Economics, BLS

19
Tourism employment
As a labor intensive
collection of services,
tourism-related sectors
represent significant
employment to New
York State.
The 764,072 jobs
sustained by traveler
activity span every
sector of the economy,
either directly or
indirectly.
FIRE = Finance, Insurance, and Real Estate
020406080
100120140160180200220240
Resta
ura
nts
Lodgin
g
Recre
ation
Oth
er
Tra
nsp
Reta
il T
rd
Busin
ess S
vc
Educ, H
ealth
Air T
ransport
FIR
E
Pers
onal…
Gas s
tatio
ns
Whole
sale
Trd
Manufa
ctu
ring
Agriculture
Com
munic
ations
Constr
uction
Induced
Indirect
Direct
Thousands
Traveler-Generated Employment by Industry

20
Tourism employment ranking
Tourism is now the 4th largest employer in New York State on the basis of
direct tourism employment.
The above table compares our estimates of tourism-generated employment
with total employment by sector.
Source: Bureau of Labor Statistics, State and Area Employment
Rank Industry 2015 BLS
1 Health care and social assistance 1,409
2 Professional and business services 1,264
3 Retail trade 945
4 Tourism 534
5 Finance and insurance 515
8 Educational services 478
7 Administrative and waste services 471
6 Manufacturing 455
9 Food services and drinking places* 425
11 Construction 361
10 Wholesale trade 341
12 Transportation and utilities 285
13 Information 266
14 Real estate and rental and leasing 191
* net of direct tourism-generated employment
Employment Ranking (Private Sector)
000s

21
Tourism-generated income grew 4.1% as a function of both
employment growth and pay increases, reaching $33.1 billion
in 2015.
Traveler-generated income
Direct Indirect Induced Total % change
Agriculture, Fishing, Mining 78 43 122 4.1%
Construction and Utilities 343 141 484 4.1%
Manufacturing 340 286 627 4.1%
Wholesale Trade 463 439 902 4.1%
Air Transport 2,679 16 21 2,715 4.6%
Other Transport 1,489 624 172 2,285 4.4%
Retail Trade 849 127 800 1,775 3.8%
Gasoline Stations 377.12 4 21 402 4.7%
Communications 387 181 568 4.1%
Finance, Insurance and Real Estate 323 925 901 2,148 4.0%
Business Services 2,739 821 3,560 4.0%
Education and Health Care 12 1,974 1,986 4.1%
Recreation and Entertainment 2,154 170 115 2,439 4.9%
Lodging 6,351 41 47 6,439 2.6%
Food & Beverage 5,515 152 303 5,970 5.0%
Personal Services 146 357 504 4.1%
Government - 124 73 197 4.1%
TOTAL 19,736 6,692 6,696 33,124 4.1%
% change 4.1% 4.0% 4.1% 4.1%
Tourism Income (Compensation)
(US$ Million, 2015)

22
Traveler-generated income
FIRE = Finance, Insurance, and Real Estate
0
1,000
2,000
3,000
4,000
5,000
6,000
7,000Lodg
ing
Resta
ura
nts
Busin
ess S
vc
Air T
ran
sport
Recre
ation
Oth
er
Tra
nsp
FIR
E
Educ, H
ealth
Reta
il T
rd
Wh
ole
sale
Trd
Ma
nufa
ctu
ring
Com
munic
ations
Pers
onal…
Constr
uction
Gas s
tation
s
Govern
ment
Agriculture
Induced
Indirect
Direct
$ million
Traveler-Generated Income by Industry

23
Tourism tax generation
Tourism generated $16.5
billion in taxes in 2015,
growing 2.9%.
Total state and local tax
proceeds of $8 billion saved
the state’s households an
average of $1,100 in tax
burden.
Total
Federal Taxes 8,543.8
Corporate 1,474.4
Indirect Business 662.1
Personal Income 3,026.1
Social Security 3,381.3
State and Local Taxes 8,001.4
Corporate 1,570.3
Personal Income 1,308.5
Sales 2,399.4
Property 2,285.4
Excise and Fees 315.8
State Unemployment 122.1
TOTAL 16,545.2
% change 2.9%
Travel-Generated Taxes
(US$ Million, 2015)

24
Tourism tax generation: State vs. Local
Tourism generated $3.5 billion in state taxes in 2015.
Tourism generated $4.5 billion in local taxes in 2015.
Tax Type 2010 2011 2012 2013 2014 2015
State Tax Subtotal 2,784.3 2,974.8 3,142.3 3,247.5 3,409.4 3,498.1
Corporate 535.2 574.3 609.0 630.1 661.8 674.1
Personal Income 857.38 908.6 950.7 980.2 1,028.3 1,070.1
Sales 1,143.09 1,226.5 1,300.6 1,345.7 1,413.3 1,439.6
Property 0.0 0.0 0.0 0.0 0.0 0.0
Excise and Fees 150.83 161.8 173.6 179.7 188.7 192.2
State Unemployment 97.8 103.6 108.4 111.8 117.3 122.1
Local Tax Subtotal 3,710.9 3,905.1 4,095.6 4,222.4 4,419.3 4,503.3
Corporate 711.6 763.5 809.6 837.7 879.8 896.2
Personal Income 191.0 202.4 211.8 218.4 229.1 238.4
Sales 762.1 817.6 867.0 897.1 942.2 959.8
Property 1,949.2 2,017.5 2,095.5 2,153.6 2,246.8 2,285.4
Excise and Fees 97.0 104.1 111.7 115.6 121.4 123.6
State Unemployment 0.0 0.0 0.0 0.0 0.0 0.0
Travel-Generated Taxes
(US$ Million)

25
• Household surveys from the US Travel Association and Longwoods International have provided
key inputs in establishing traveler spending figures.
• Industry data on lodging, airports, Amtrak, and attractions contribute to year-over-year growth
analysis.
• Employment definitions. The basis of our data and modeling is the Regional Economic Information
System (REIS), Bureau of Economic Analysis, U.S. Department of Commerce. This is different
than the NYS Department of Labor data source (ES202/QCEW). The main definitional difference
is that sole-proprietors, which do not require unemployment insurance and are not counted in the
ES202 data. BEA data shows (for example) state accommodations employment at 89,124,
compared with QCEW at 82,190. For total employment (across all sectors), the difference is 20%.
• International methodology. Our approach (through Travel Industry Association calculations) is
based the estimates on direct survey responses to the Department of Commerce in-flight survey
and Statistics Canada data – constrained to BEA international balance of payments data. The NY
data are consistent with TIA’s state-by-state distribution which ensures against overestimation.
• All employment and income results are constrained to known industry measurements for key
tourism sectors.
Methods and data sources

26
• Local taxes are a build-up of individual categories (sales, occupancy, property). The model is
not equipped to deal with individual exemptions such as Indian gaming.
• Second home expenditures are based on the stock of seasonal second home inventory.
Annual average expenditures for housing are pro-rated to the season length to account for
various levels of expenditures not accounted in visitor surveys.
• Lodging sector. Our models use survey information and constrains this to the value of the
hotel sector in each county. This can vary from certain bed tax estimates of total revenue for
several reasons. One is that the bed tax may only be based on room revenue while total sales
for the industry may include other revenue sources (room service, phone, etc.). Another is
that certain smaller establishments may not fully report or be required to report their revenue.
Methods and data sources

27
Tourism Economics utilized the IMPLAN input-output model for New York State to
track the flow of sales through the economy to the generation of GDP, employment,
wages, and taxes.
The impacts are measured on three levels:
■ Direct impact: The immediate benefit to persons and companies directly
providing goods or services to travelers.
■ Indirect impact: The secondary benefit to suppliers of goods and services to the
directly-involved companies. For example, a food wholesaler providing goods to
a restaurant. The model is careful to exclude imports from the impact
calculations.
■ Induced impact: The tertiary benefit to the local economy as incomes in the prior
two levels of impact are spent on goods and services. For example, a restaurant
employee spends his wages at a grocery store, generating addition economic
output.
Methods and data sources

28
About Tourism Economics
Tourism Economics, headquartered in Philadelphia, is an Oxford Economics company
dedicated to providing high value, robust, and relevant analyses of the tourism sector
that reflects the dynamics of local and global economies. By combining quantitative
methods with industry knowledge, Tourism Economics designs custom market
strategies, project feasibility analysis, tourism forecasting models, tourism policy
analysis, and economic impact studies.
Our staff have worked with over 100 destinations to quantify the economic value of
tourism, forecast demand, guide strategy, or evaluate tourism policies.
Oxford Economics is one of the world’s leading providers of economic analysis,
forecasts and consulting advice. Founded in 1981 as a joint venture with Oxford
University’s business college, Oxford Economics is founded on a reputation for high
quality, quantitative analysis and evidence-based advice. For this, it draws on its own
staff of 130 highly-experienced professional economists; a dedicated data analysis
team; global modeling tools; close links with Oxford University, and a range of partner
institutions in Europe, the US and in the United Nations Project Link.
For more information: [email protected].
