the economic impact of hiv/aids in uganda a workshop on economic epidemiology, makerere university 3...
TRANSCRIPT

The economic Impact of HIV/AIDS in Uganda
A Workshop on Economic Epidemiology, Makerere University 3rd -5th August 2009
Fred Matovu, Ph.D

Overview: HIV/AIDS in Uganda
One of the hardest hit countries in SSA HIV/AIDS cases increased from 2 in 1982 to
2m HIV infections by 2000 HIV prevalence rates reduced from 19%
1990s to 6.4% by 2005 (against 5% target) Wide regional variations in prevalence rates:
8.5% in Central compared to 2.3% in west Nile

HIV/AIDS in Uganda cont.
About 1.4m people living with HIV/AIDS Of whom 100000 are children below 15 years Over 800000 have died of AIDS Over 1.7 m children orphaned by AIDS Risk of M-T.C.T estimated at 15-25% in 2004 Impact of HIV/AIDS greatest at household
level

Distribution of HIV prevalence
HIV prevalence is high in urban (10%) than in rural areas (5.6%)
Prevalence higher amongst working population
Prevalence increases with education level Prevalence is higher in wealthier quintiles Prevalence is higher on women than men

Prevalence rates by Location, 2004/05
Prevalence is higher in urban areas and among women
0
2
4
6
8
10
12
14
Urban Rural
Pre
vale
nce r
ate
Women 15-49
Men 15-49
Total
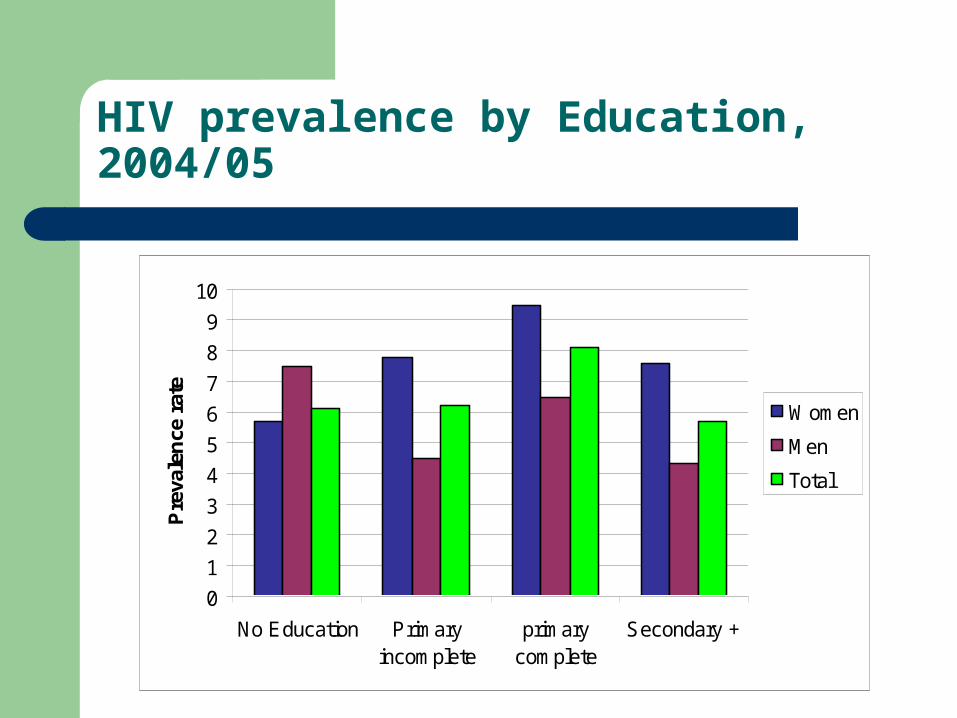
HIV prevalence by Education, 2004/05
0
1
2
3
4
5
6
7
8
9
10
No Education Primaryincomplete
primarycomplete
Secondary +
Pre
vale
nce
rat
e
Women
Men
Total

HIV Prevalence by work status
0
1
2
3
4
5
6
7
8
9
Currently Working Not working
Pre
vale
nce
rat
e (%
)
Women 15-49
Men 15-49
Total

HIV Prevalence by Occupation
0
2
4
6
8
10
12
Pre
vale
nce
rat
e (%
)
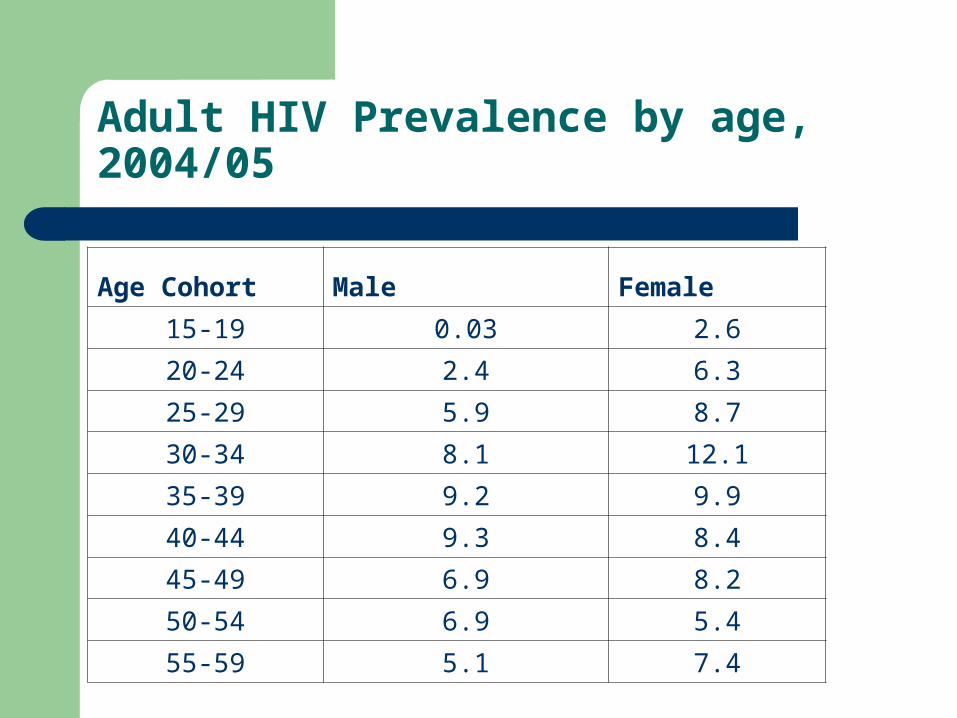
Adult HIV Prevalence by age, 2004/05
Age Cohort Male Female
15-19 0.03 2.6
20-24 2.4 6.3
25-29 5.9 8.7
30-34 8.1 12.1
35-39 9.2 9.9
40-44 9.3 8.4
45-49 6.9 8.2
50-54 6.9 5.4
55-59 5.1 7.4
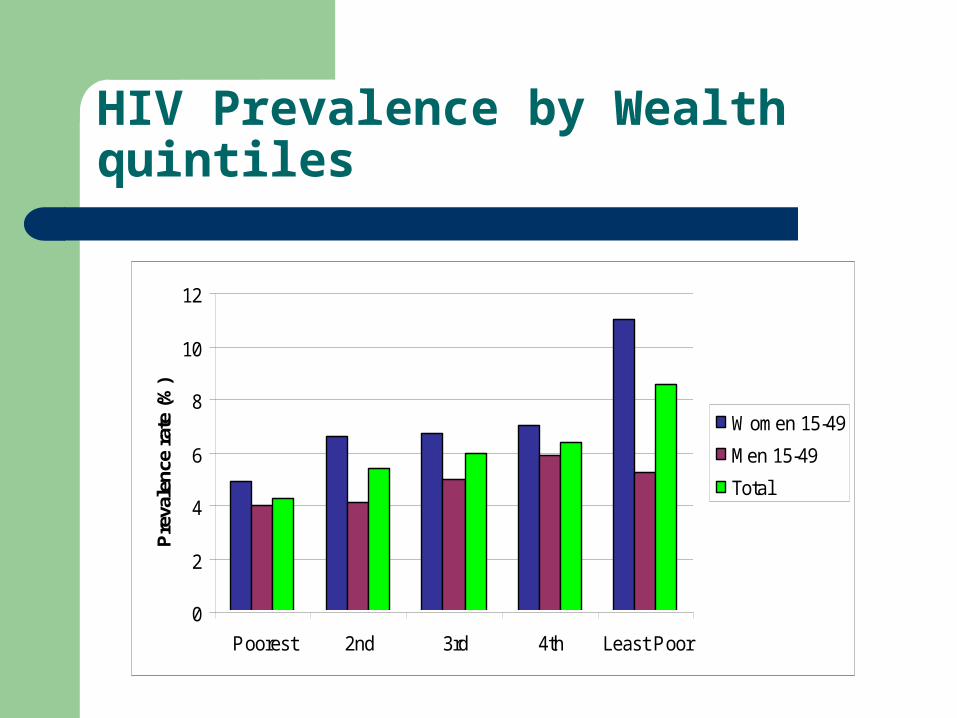
HIV Prevalence by Wealth quintiles
0
2
4
6
8
10
12
Poorest 2nd 3rd 4th Least Poor
Pre
vale
nce
rat
e (%
)
Women 15-49
Men 15-49
Total

Impact of HIV/AIDS at household level
Loss of available income as working adults fall ill or die or stop work to look after children and/or the ill
Additional expenditure on health care and funeral costs (e.g. ARV cost per year per person -$500)
Depletion of household assets to finance the health care
Lower productivity - reduced availability of food. Decrease in school enrolment as children are forced
to dedicate time to farm labour and/or care-giving

Impact of HIV/AIDS at household level
Distorts family structure and gender roles– Increase in female-head, child-headed and
grand parents-headed households
Depletes the asset base households leading to inadequate resources for production - affecting household income and nutrition.
Increases dependency ratio - of children orphaned by AIDS
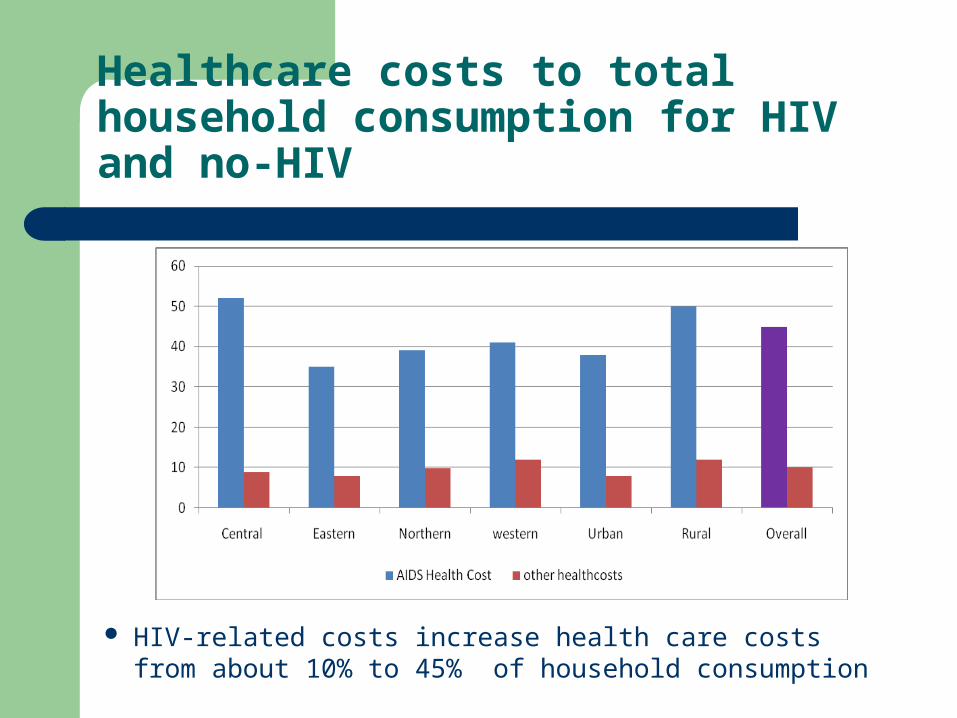
Healthcare costs to total household consumption for HIV and no-HIV
HIV-related costs increase health care costs from about 10% to 45% of household consumption

Impact at firm level
Increased morbidity and death of skilled staff, Reduced staff performance and increased
medical bills Depletes productive workforce leading to
loss of knowledge and skills and slow adoption of technologies.

Loss of productive labor force
8.4% of labour force lost by 2025

Impact at macro-level
Impacts on macroeconomic variables: GDP ,average income ,savings and investment, employment and wages
Loss in GDP growth (over 1% points) Increase incidence and depth of poverty
– 1% point increase in household poverty overall
Reduction in savings and investment ratio

Macroeconomic Impact cont..
Decline in life expectancy– 55 years in 2010 with high ART compared to 57
years in the NO AIDS scenario
Reduction in labor-force– 8.4% loss by 2025
Higher spending on health care – crowding out fiscal space for other sectors

Expenditure on HIV/AIDS programmes as %age of GDP
HIV/AIDS Expenditure/GDP increased by 2.5% points between 2003/04 and 2008/09

Impact on macro-economy cont..
Exchange rate : Donor aid inflows affect exchange rates – export and investment competitiveness
inflationary pressures

Challenges
Inadequate supply of ARVs Increasing cases of discordant couples Heavy reliance on donor-funding A wide range interventions currently exist but
coverage and sustainability issues remain critical

Summary
Prevalence rate stagnating at 6.4% and feared to be increasing
Prevalence vary by socio-demographic characteristics
Economic and social impact higher at household level
Serious deficit in coverage of ARVs Most Interventions are donor-funded: sustainability??