the economic effects of carbon pollution pricing in ... · the economic effects of . carbon...
TRANSCRIPT
The Economic Effects of Carbon Pollution Pricing in Washington State
OFM Office of Forecasting and Research December 23, 2014
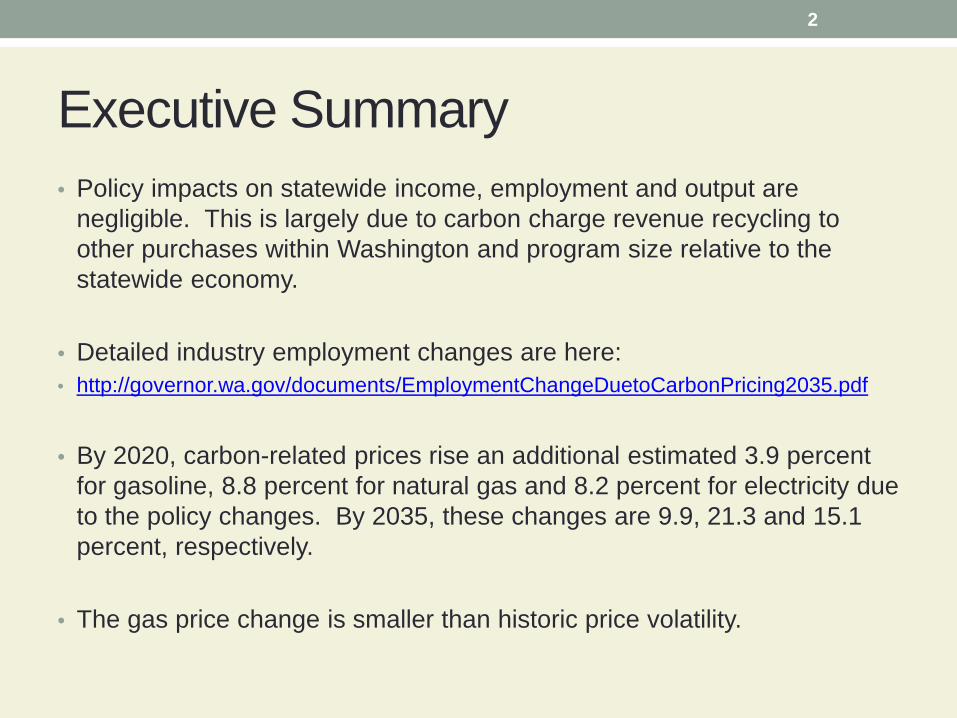
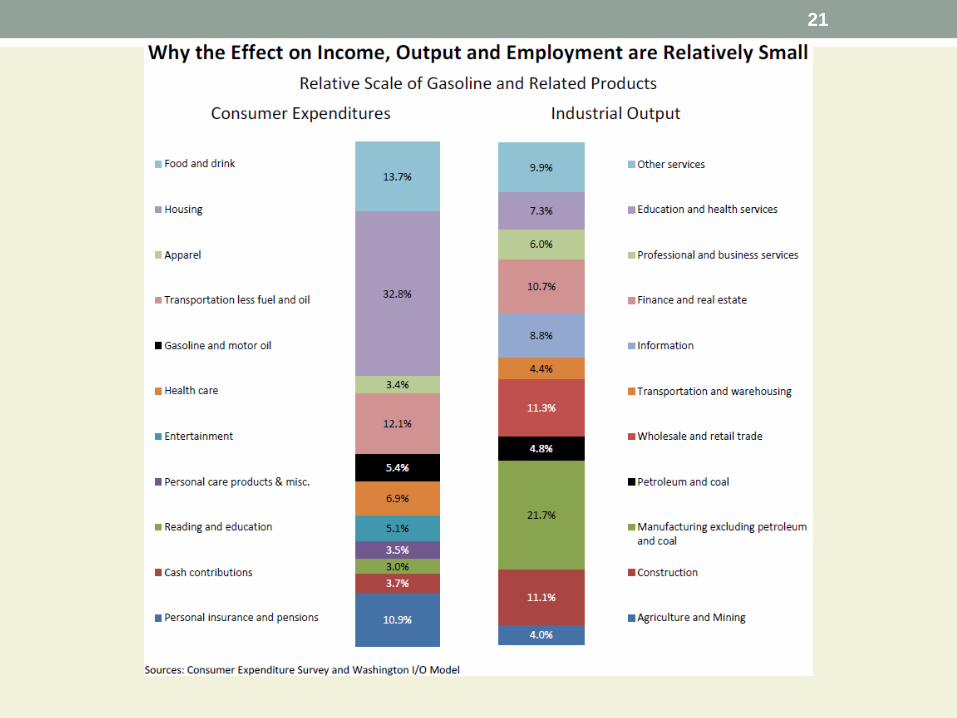
Executive Summary • Policy impacts on statewide income, employment and output are
negligible. This is largely due to carbon charge revenue recycling to other purchases within Washington and program size relative to the statewide economy.
• Detailed industry employment changes are here: • http://governor.wa.gov/documents/EmploymentChangeDuetoCarbonPricing2035.pdf
• By 2020, carbon-related prices rise an additional estimated 3.9 percent
for gasoline, 8.8 percent for natural gas and 8.2 percent for electricity due to the policy changes. By 2035, these changes are 9.9, 21.3 and 15.1 percent, respectively.
• The gas price change is smaller than historic price volatility.
2

Overview of the Modeling Process
Overall Assumptions
Inside the Carbon Tax Analysis Model (CTAM)
CTAM Output Into Regional Economic Models Incorporated (REMI) Model
Inside REMI
Output from CTAM and REMI:
FINDINGS
3
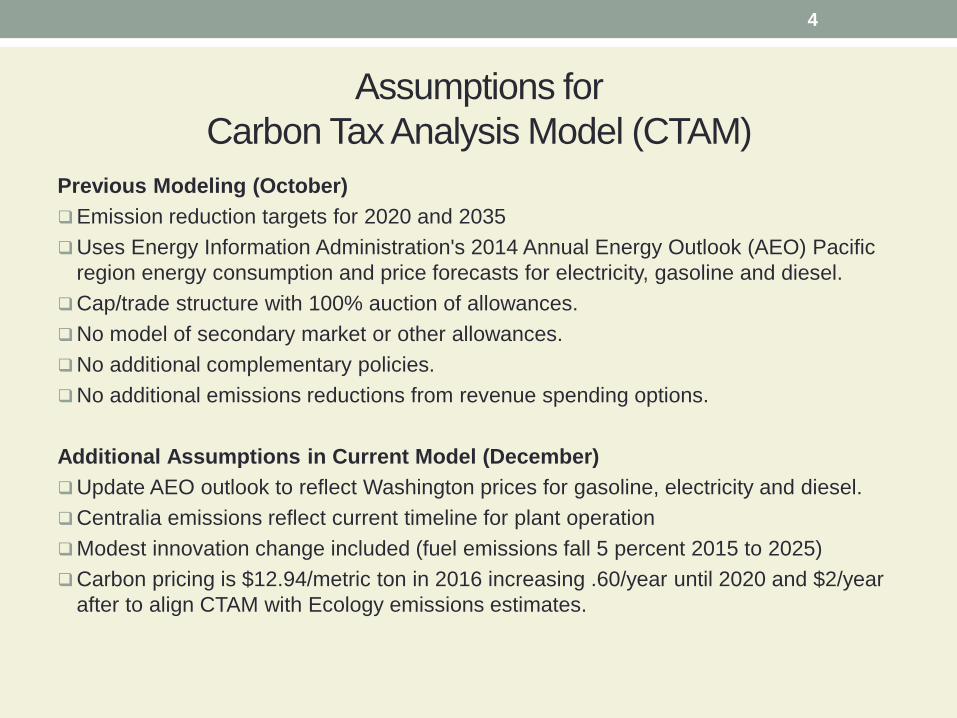
Assumptions for Carbon Tax Analysis Model (CTAM)
Previous Modeling (October) Emission reduction targets for 2020 and 2035 Uses Energy Information Administration's 2014 Annual Energy Outlook (AEO) Pacific
region energy consumption and price forecasts for electricity, gasoline and diesel. Cap/trade structure with 100% auction of allowances. No model of secondary market or other allowances. No additional complementary policies. No additional emissions reductions from revenue spending options. Additional Assumptions in Current Model (December) Update AEO outlook to reflect Washington prices for gasoline, electricity and diesel. Centralia emissions reflect current timeline for plant operation Modest innovation change included (fuel emissions fall 5 percent 2015 to 2025) Carbon pricing is $12.94/metric ton in 2016 increasing .60/year until 2020 and $2/year
after to align CTAM with Ecology emissions estimates.
4
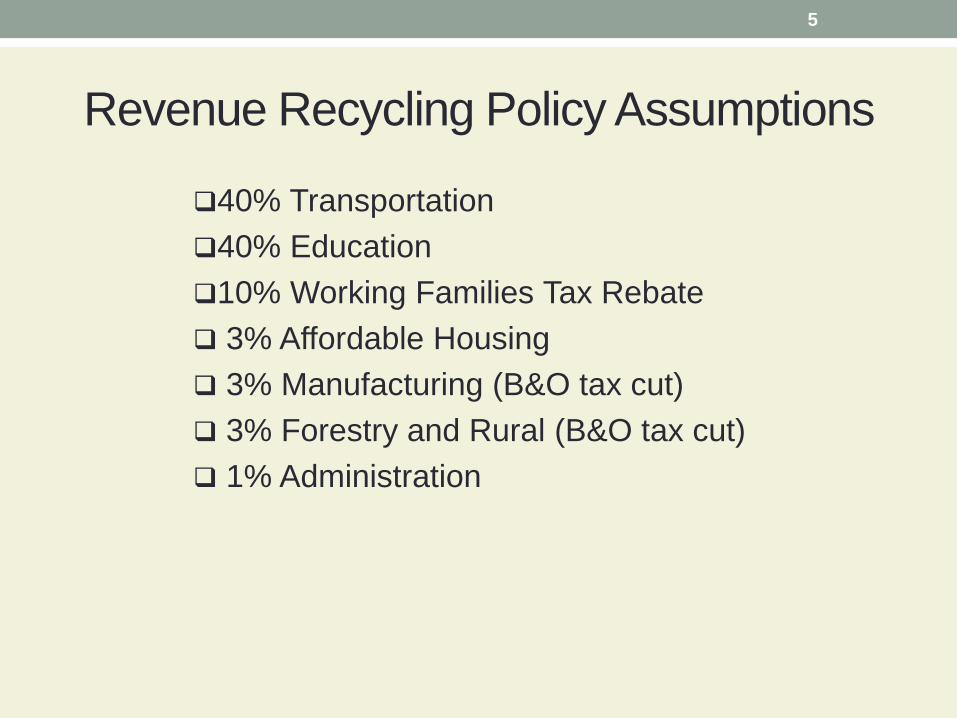
Revenue Recycling Policy Assumptions
40% Transportation 40% Education 10% Working Families Tax Rebate 3% Affordable Housing 3% Manufacturing (B&O tax cut) 3% Forestry and Rural (B&O tax cut) 1% Administration
5

Inside the CTAM Model CTAM translates emission levels into consumption and prices using… • Relationship between prices and consumption (called elasticities) • Energy price and demand forecasts from US Energy Information Administration 2014 Energy
Outlook and Washington adjustments
Allocate energy consumption across industries
Determine carbon emissions per industry
Distribute cost of these emissions per industry
Integrate “Revenue Recycling” into costs and prices
Calculate net revenue and cost due to emissions (used in REMI)
6

A More Complete View into the Carbon Tax Analysis Model
Source: Nystrom and Zaidi, “Environmental Tax Reform in California,” March 3, 2014.
7

Inside the Regional Economic Models Incorporated (REMI) Model
• REMI is an industry-standard econometric model used by many state agencies, private companies, and researchers
• Revenue changes by industry (160 sectors) for baseline and policy scenarios
• REMI combines spending equations with the input/output table of industry sales and purchases
CTAM Revenue Output Including B&O Reductions and Household Tax Credits
Changes in Industry and Household Purchases
Resulting Output, Income, and Employment Impacts
8

A More Complete View into REMI Model
Source: Nystrom and Zaidi, “Environmental Tax Reform in California,” March 3, 2014.
9

Results: Economic Impact
10

Private Non-Farm Employment: Jobs Gained Over Baseline
Year Net Jobs Gained Over Baseline
2016 4,045 (.12%)
2020 2,521 (.07%)
2026 5,510 (.14%)
2035 10,633 (.26%)
11
Note: Jobs created per year in REMI cannot be added across years.

12
Additional industry-level detail at: http://governor.wa.gov/documents/EmploymentChangeDuetoCarbonPricing2035.pdf
Jobs Gained / Lost Relative to Baseline
-500 0 500 1000 1500 2000 2500 3000
Transportation and WarehousingManufacturing - inc petroleum refining
Management of Companies and EnterprisesUtilities
InformationMining
Retail TradeWholesale Trade
Arts, Entertainment, and RecreationEducational Services
Finance and InsuranceForestry, Fishing, and Related Activities
Accommodation and Food ServicesOther Services, except Public Administration
Real Estate and Rental and LeasingAdministrative and Waste Management Services
Health Care and Social AssistanceProfessional, Scientific, and Technical Services
Construction
Two-Digit NAICS Industry Code, Average Change 2016 to 2035

Gasoline, Natural Gas and Electricity Prices Baseline vs. Policy Scenario
13
• Source: Commerce CTAM Model • Actual prices include 10 digits. Calculations vary due to rounding.
Gasoline: 2012 $/gal
Natural gas: 2012$/therm
Electricity: 2012 cents/Kwh
Baseline Scenario Baseline Scenario Baseline Scenario 2016 3.27 3.39 0.77 0.84 7.14 7.73 2017 3.23 3.35 0.80 0.87 7.09 7.67 2018 3.23 3.35 0.85 0.93 7.04 7.60 2019 3.24 3.37 0.88 0.95 6.97 7.53 2020 3.30 3.43 0.87 0.95 6.88 7.44 2021 3.35 3.50 0.89 0.97 6.80 7.35 2022 3.40 3.57 0.89 0.99 6.75 7.34 2023 3.46 3.64 0.91 1.01 6.69 7.32 2024 3.50 3.69 0.92 1.03 6.64 7.30 2025 3.54 3.75 0.93 1.05 6.63 7.33 2026 3.57 3.79 0.92 1.05 6.60 7.33 2027 3.61 3.87 0.92 1.07 6.60 7.45 2028 3.62 3.90 0.92 1.09 6.61 7.50 2029 3.66 3.96 0.95 1.12 6.61 7.52 2030 3.69 4.01 0.97 1.16 6.64 7.57 2031 3.73 4.06 0.99 1.19 6.78 7.75 2032 3.77 4.13 1.00 1.21 6.83 7.83 2033 3.81 4.19 1.03 1.25 6.80 7.81 2034 4.06 4.45 1.11 1.34 6.85 7.88 2035 4.10 4.51 1.14 1.38 6.93 7.98
Percent Change Scenario 2035 to baseline 2035 9.96 21.31 15.10

14
Gasoline Price Trajectories Baseline Vs. Policy Scenario
Gasoline: 2012 $/gal Baseline Scenario
2016 3.27 3.39 2017 3.23 3.35 2018 3.23 3.35 2019 3.24 3.37 2020 3.30 3.43 2021 3.35 3.50 2022 3.40 3.57 2023 3.46 3.64 2024 3.50 3.69 2025 3.54 3.75 2026 3.57 3.79 2027 3.61 3.87 2028 3.62 3.90 2029 3.66 3.96 2030 3.69 4.01 2031 3.73 4.06 2032 3.77 4.13 2033 3.81 4.19 2034 4.06 4.45 2035 4.10 4.51
0.00
0.50
1.00
1.50
2.00
2.50
3.00
3.50
4.00
4.50
5.00
Baseline
Dollars Gasoline price in dollars per gallon,
baseline and scenario
• Source: Commerce CTAM Model • Actual prices include 10 digits. Calculations vary due to rounding.

15
Natural Gas Price Trajectories Baseline Vs. Policy Scenario
Natural gas: 2012$/therm Baseline Scenario
2016 0.77 0.84 2017 0.80 0.87 2018 0.85 0.93 2019 0.88 0.95 2020 0.87 0.95 2021 0.89 0.97 2022 0.89 0.99 2023 0.91 1.01 2024 0.92 1.03 2025 0.93 1.05 2026 0.92 1.05 2027 0.92 1.07 2028 0.92 1.09 2029 0.95 1.12 2030 0.97 1.16 2031 0.99 1.19 2032 1.00 1.21 2033 1.03 1.25 2034 1.11 1.34 2035 1.14 1.38
0.00
0.20
0.40
0.60
0.80
1.00
1.20
1.40
1.60Baseline
Scenario
Dollars
Natural gas prices in dollars per therm, baseline and scenario
• Source: Commerce CTAM Model • Actual prices include 10 digits. Calculations vary due to rounding.
16
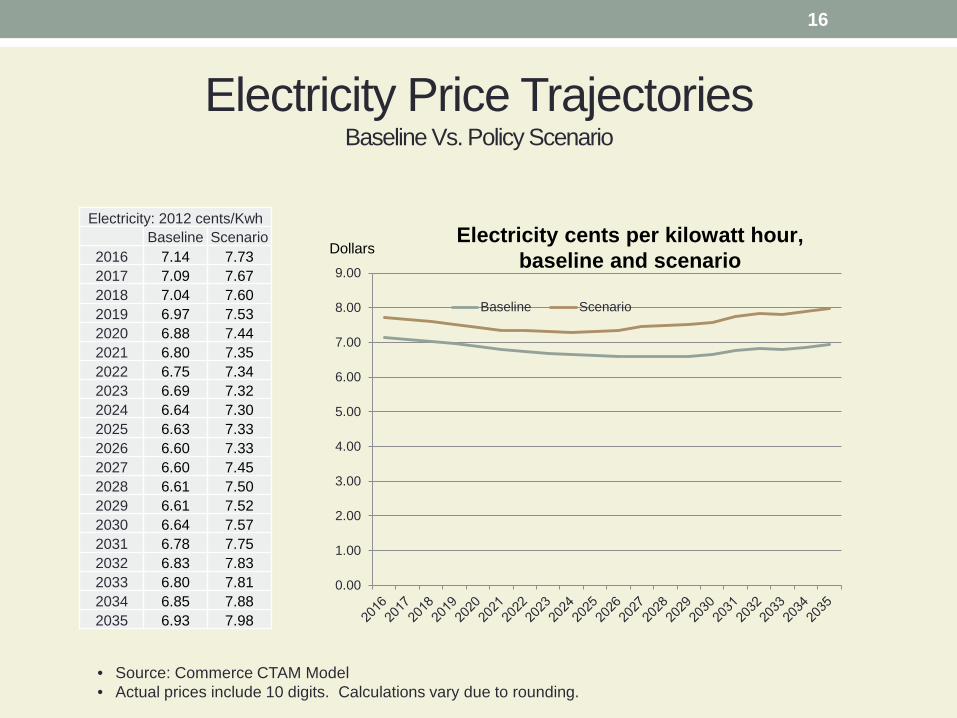
Electricity Price Trajectories Baseline Vs. Policy Scenario
Electricity: 2012 cents/Kwh Baseline Scenario
2016 7.14 7.73 2017 7.09 7.67 2018 7.04 7.60 2019 6.97 7.53 2020 6.88 7.44 2021 6.80 7.35 2022 6.75 7.34 2023 6.69 7.32 2024 6.64 7.30 2025 6.63 7.33 2026 6.60 7.33 2027 6.60 7.45 2028 6.61 7.50 2029 6.61 7.52 2030 6.64 7.57 2031 6.78 7.75 2032 6.83 7.83 2033 6.80 7.81 2034 6.85 7.88 2035 6.93 7.98
0.00
1.00
2.00
3.00
4.00
5.00
6.00
7.00
8.00
9.00
Baseline Scenario
Dollars Electricity cents per kilowatt hour,
baseline and scenario
• Source: Commerce CTAM Model • Actual prices include 10 digits. Calculations vary due to rounding.
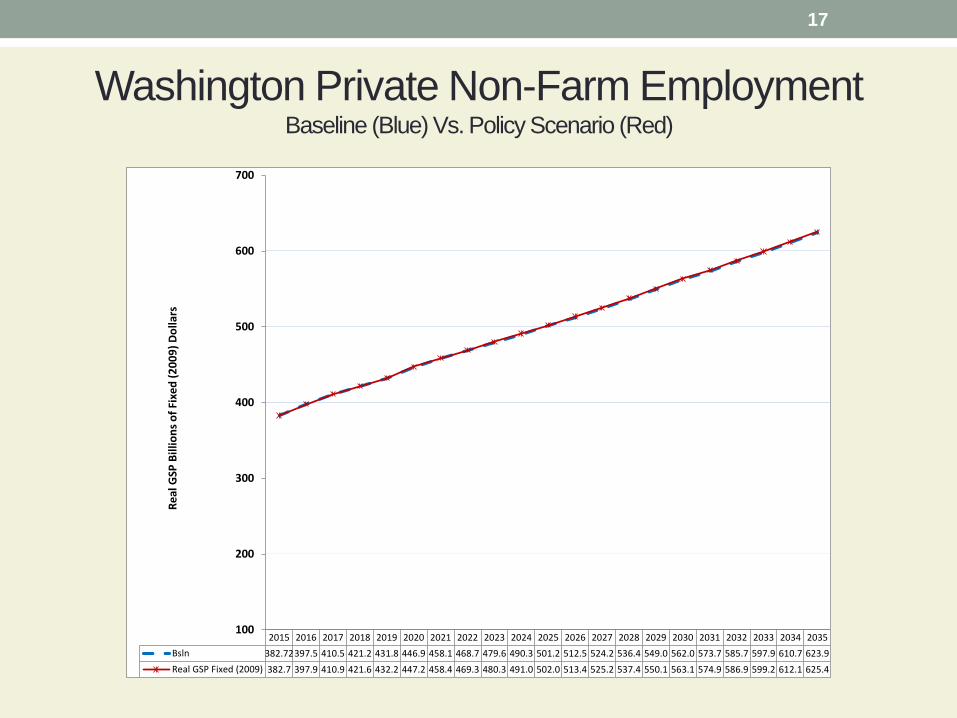
Washington Private Non-Farm Employment Baseline (Blue) Vs. Policy Scenario (Red)
17
2015 2016 2017 2018 2019 2020 2021 2022 2023 2024 2025 2026 2027 2028 2029 2030 2031 2032 2033 2034 2035Bsln 382.72397.5 410.5 421.2 431.8 446.9 458.1 468.7 479.6 490.3 501.2 512.5 524.2 536.4 549.0 562.0 573.7 585.7 597.9 610.7 623.9Real GSP Fixed (2009) 382.7 397.9 410.9 421.6 432.2 447.2 458.4 469.3 480.3 491.0 502.0 513.4 525.2 537.4 550.1 563.1 574.9 586.9 599.2 612.1 625.4
100
200
300
400
500
600
700Re
alG
SP B
illio
ns o
f Fix
ed (2
009)
Dol
lars
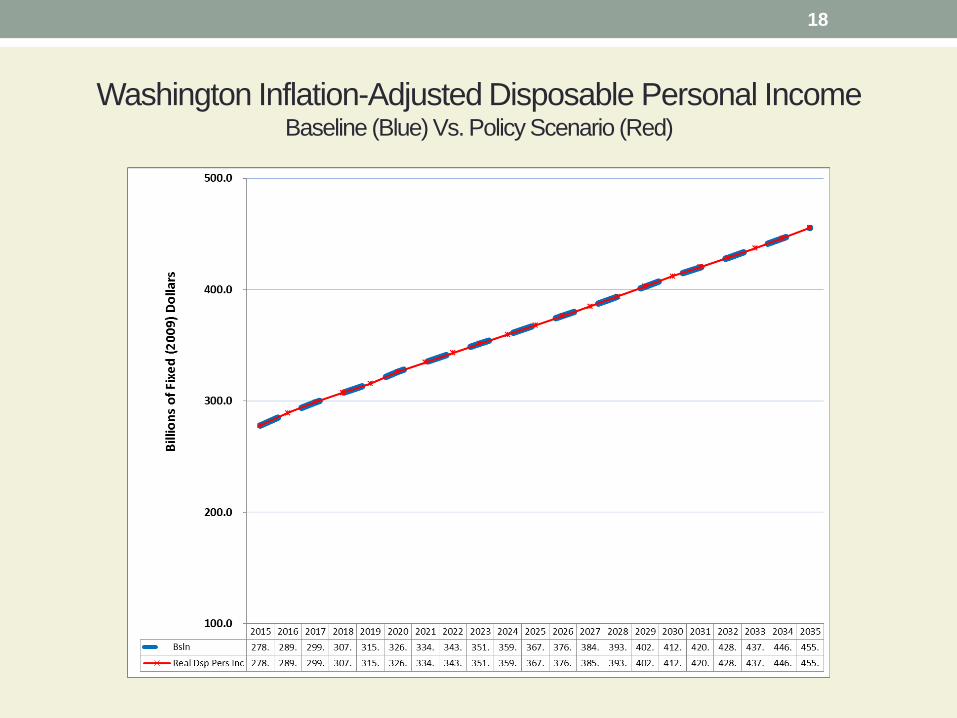
Washington Inflation-Adjusted Disposable Personal Income Baseline (Blue) Vs. Policy Scenario (Red)
18

Washington Real Gross State Product Baseline (Blue) Vs. Policy Scenario (Red)
19
2015 2016 2017 2018 2019 2020 2021 2022 2023 2024 2025 2026 2027 2028 2029 2030 2031 2032 2033 2034 2035Bsln 382.72397.5 410.5 421.2 431.8 446.9 458.1 468.7 479.6 490.3 501.2 512.5 524.2 536.4 549.0 562.0 573.7 585.7 597.9 610.7 623.9Real GSP Fixed (2009) 382.7 397.9 410.9 421.6 432.2 447.2 458.4 469.3 480.3 491.0 502.0 513.4 525.2 537.4 550.1 563.1 574.9 586.9 599.2 612.1 625.4
100
200
300
400
500
600
700
Real
GSP
Billi
ons o
f Fixe
d (2
009)
Dol
lars

20
21