the economic benets rom the eelopment o bioenergy in ... · pdf filecompleted by dkm economic...
TRANSCRIPT
Completed by DKM Economic Consultants and RPS Consulting Engineers
The Economic Benefitsfrom the Development of
BioEnergy in Irelandto meet 2020 Targets

Foreword
by Tom Bruton, President, Irish Bioenergy
Association
I am pleased to introduce this, the first study of its kind, with a mandate to assess the
socioeconomic benefits of developing the Bioenergy sector in Ireland over the coming
years to 2020.
For some time there has been a need for a credible independent analysis of the investment
required to develop the Bioenergy sector, the potential for job creation and the many
positive socioeconomic benefits that accrue from switching from fossil fuels to indigenous
sources of Bioenergy.
A key tenet of this work has been to use conservative, cautious and credible estimates. The
Government 2020 projections were used as the baseline for the size of the various
renewable energy sub-sectors, not-withstanding the fact there is potential to exceed these
projections. Although agriculture will play a key role in delivering energy crops and farm
residues for Bioenergy production, no net new employment is assumed in agriculture. The
importation of a sizable part of the transport biofuels amount is built into the estimates.
Also co-firing at a significant scale is only projected to happen at one of the three power
plants presently fired with peat by 2020.
The study has confirmed the substantial economic benefits that can accrue by meeting the
2020 bioenergy targets, including:
Over 3,600 new permanent jobs in the Bioenergy sector
1.5 billion direct investment in the sector
8,300 work years during construction and installation
Sustain family farm incomes in Irish agriculture
Reduce Ireland’s energy import bill by 7.5%
Provide a secure and competitive energy source for Irish homes and business
A static policy environment has not been assumed. It is clear that there are still regulatory
and policy barriers to overcome before the 2020 targets can be met, or indeed exceeded.
There are also further opportunities which should not be missed, such as:
To source more of our Bioenergy resources within Ireland and accrue the associated economic benefits.
To develop export-led markets for Bioenergy resources and conversion technologies

To create additional value-added products and industries based around biomass resources
I look forward to working with fellow members of IrBEA and other stakeholders in creating
an environment where these projected jobs become real ones and where the Bioenergy
sector supports a robust and sustainable economic growth in Ireland over the coming
decades.
I would like to thank the independent consultants DKM and RPS Group for a professional
service and completing the challenging project in the absence of good baseline economic
data. The development of additional statistical reporting at national and regional level
would be welcome to better understand the impact of policy initiatives to support
Bioenergy.
I would especially like to thank my fellow steering group members (Joe O’Carroll, Noel
Gavigan and Pearse Buckley) as well as the many members of IrBEA who contributed to
this report. I gratefully acknowledge the funding received by Sustainable Energy Authority
of Ireland to complete the project.
About the Irish Bioenergy Association
IrBEA (www.irbea.org) was founded in 1999. Its role is to promote the bioenergy industry
and to develop this important sector on the Island of Ireland. The overall aim of IrBEA is to
promote biomass as an environmentally, economically and socially sustainable indigenous
energy resource, and also to promote its non-energy related benefits. The organisation is a
self-governing association of voluntary members and is affiliated to Aebiom, the European
Biomass Association. The geographical coverage of IrBEA is Northern Ireland and the
Republic of Ireland.
IrBEA (www.irbea.org) was founded in 1999. Its role is to promote the bioenergy industry
and to develop this important sector on the Island of Ireland.

DKM Economic Consultants 6 Grand Canal Wharf South Dock Road Ringsend, Dublin 4. Telephone: 01 6670372 Fax: 01 6144499 E-mail: [email protected] Website: www.dkm.ie
RPS Consulting Engineers West Pier Business Campus Dun Laoghaire County Dublin. Telephone: 353 1 2884900 E-mail: [email protected]
Website:www.rpsgroup.com/Ireland
Final Report January 2012
The Economic Benefits of the Development of
Bioenergy in Ireland

The Economic Benefits of the Development of Bioenergy in
Ireland
Table of Contents
Executive Summary ............................................................................................................... i
Section 1 Introduction ...................................................................................................... 1
1.1 Approach and Methodology .................................................................................... 1
Section 2 Meeting the 2020 targets ................................................................................. 4
2.1 Introduction ............................................................................................................. 4
2.2 Meeting the 2020 Targets – The Contribution of the Bioenergy Sector ................... 5
2.3 Modelling the Potential of the Bioenergy Sector ...................................................... 7
2.4 Technical Model Assumptions ................................................................................ 7
2.5 Facilities .................................................................................................................. 8
2.6 Feedstocks ........................................................................................................... 10
Section 3 Economic Benefits of Bioenergy .................................................................... 13
3.1 Introduction ........................................................................................................... 13
3.2 Direct Combustion ................................................................................................ 13
3.3 Biomass Heat in 2020 ........................................................................................... 14
3.4 Biomass Combined Heat and Power (CHP) and Biomass Power in 2020 ............. 20
3.5 Power Generation: Co-firing ................................................................................. 24
3.6 Waste to Energy ................................................................................................... 27
3.7 Anaerobic Digestion (AD)...................................................................................... 31
3.8 Landfill Gas ........................................................................................................... 38
3.9 Municipal Sewage Gas ......................................................................................... 42
3.10 Biofuels ................................................................................................................. 44
Section 4 Economic Impacts ......................................................................................... 48
Appendix 1 Policy and Legislative Background ............................................................. 57

The Economic Benefits of the Development of Bioenergy in
Ireland
Appendix 2 Feedstock types ......................................................................................... 61
Appendix 3 Input-Output Model .................................................................................... 75
Appendix 4 Glossary of Terms & Energy Conversion Factors ....................................... 83
The Economic Benefits of the Development of
Bioenergy in Ireland
i
Executive Summary
This report, commissioned by the Irish BioEnergy Association (IrBEA) and the Sustainable Energy
Authority of Ireland (SEAI), focuses on the potential economic benefits of developing the
bioenergy sector in terms of employment creation, investment, trade and competitiveness.
A two-stage approach has been adopted in undertaking this study. The first involved the
development of a “technical” model of the sector to establish a baseline scenario of how the
various targets under the EU’s Renewable Energy Directive might be achieved and what this
might mean in terms of the number and type of bioenergy facilities operating in Ireland by 2020.
The technical model does exceed the various targets set; more detail can be found in Chapter 2.
The industry has achieved a level of maturity through various policy supports. The technical model
is based on the Government continuing to support the industry.
The second stage involved the quantification of potential economic impacts. This was based on a
combination of desk-top research of previous studies into the sector, information on facilities and
projects that are already in place or planned nationally, and also from consultation with, and
feedback from, market participants and industry experts. This approach was necessary because of
the lack of comprehensive published information and statistics on the bioenergy sector.
Key Economic Indicators
This study has confirmed that there are significant economic benefits that could be delivered as a
result of the development of the bioenergy sector in Ireland.
In total, it is estimated that almost €1.5 billion in direct investment in biomass processing
infrastructure and equipment will be required over the period from 2011 to 2020 to deliver the
output needed to meet the targets under RES-E, RES-H and RES-T.
Of this, approximately 55% would be spent in the Irish economy (the balance being imported plant
and equipment).
In addition, once fully operational, almost €430 million (2011 money) would be spent annually on
operating these facilities.
In terms of employment, almost 8,300 work years would be generated throughout the domestic
economy during the construction and installation of the various facilities required to deliver on the
targets.
Permanent ongoing employment generated by the sector would grow to over 3,600 FTEs by 2020.
This includes employment in the facilities themselves, in supply industries and in the wider
economy.
These figures record the net or incremental employment impacts across the different sectors only.
In some instances, for example, the net impacts may be relatively modest as they are to a large
degree securing the employment associated with existing activities.
Impact on the Rural Economy
A very significant proportion of the employment generated in the both the construction and
operation of the bioenergy facilities and infrastructure will be in rural Ireland. Most of the facilities
themselves will be based in rural areas, and most of the feedstock will be grown or produced
there.

The Economic Benefits of the Development of
Bioenergy in Ireland
ii
The bioenergy sector can, therefore, offer farmers and other rural-based businesses new business
opportunities and provide alternatives to traditional farming activities. Revenue generated from the
production of bioenergy feedstocks or from the sale of energy produced from bioenergy can help
to sustain farm incomes and, because the majority of this income will be spent locally, will help to
maintain income and employment within the wider rural community.
This will, in turn, contribute to sustaining rural communities and help deliver more balanced
regional economic development.
Impact on Fuel Imports and Balance of Payments
Security of energy supply is a critically important economic issue for an island nation such as
Ireland.
The production of bioenergy offers the opportunity to address energy import dependency (which
currently stands at 90%) and also to protect against volatile oil and gas prices.
In addition, by substituting for fossil fuel imports it will help to improve the country’s balance of
payment position.
Ireland currently spends some €6.5 billion a year on imported gas, oil and coal. On the basis of
the scenario outlined in this report, the bioenergy sector will contribute the equivalent of 850 ktoe
per year by 2020. If this is domestically produced and is fully utilised, at today’s prices, this would
lead to a reduction in Ireland’s import bill of €488 million a year. That is, Ireland’s energy import bill
would be reduced by approximately 7.5%.
Competitiveness
The bioenergy sector also has the potential to contribute to Ireland’s competiveness. This will
depend in large part on the relative cost of producing bioenergy from the various sources,
compared to the alternative of continuing to import conventional fossil fuels.
While it would appear that, at least in the short-run, the cost of generating electricity from
bioenergy sources will need to be supported through Feed In Tariffs (e.g. Renewable Energy Feed
in Tariff – REFIT), usage of bioenergy for heating can reduce costs substantially for many Irish
businesses (and Irish households).
For example, the estimated saving from the use of biomass compared with gas oil in the 650
commercial and industrial boilers which are projected to be installed by 2020 is €208 million per
year (in 2011 prices).
Moreover, while the future path of fossil fuel prices is unknown, it is unlikely that they will return to
the relatively low prices of a few years ago, and there is a strong possibility that they will continue
to increase over the medium term as demand grows.
The presence of a strong bioenergy sector in Ireland provides a valuable hedge against future
energy price instability, as well as important security of supply benefits. Both of these will benefit
Ireland’s competitiveness.
In addition, Ireland is legally obliged to meet the targets under the Renewable Energy Directive,
and without the development of the sector and an appropriate supply base, Ireland will be forced
to rely on imported bioenergy to meet the 2020 targets.
Teagasc has warned that the price of imported bioenergy products is likely to increase
substantially as 2020 approaches and Member States compete for resources to meet their targets.
The development of an indigenous bioenergy sector and supply base will help to address these
concerns and provide greater security of supply of energy to the Irish economy.
While the overall economic benefit of this is difficult to measure, there would be a real economic
cost if Ireland fails to meet the terms of the Renewable Energy Directive, as the European Court of

The Economic Benefits of the Development of
Bioenergy in Ireland
iii
Justice can impose a range of fines on Ireland. These could be as high as €40 million per annum
plus a lump sum fine (minimum €1.5 million).
Environmental Impacts
The achievement of the biomass energy targets will also have a major impact on the environment
by reducing Greenhouse Gas (GHG) emissions.
It is estimated that the achievement of the targets will result in a saving of 3.14 million tonnes of
CO2 per annum by 2020. This is equivalent to roughly 5% of total GHG emissions in 2009, and
would represent a significant contribution to the required reduction in GHG emissions to be
achieved by 2020, under Ireland’s international commitments.
The value of the emissions reduction could be €94 million per annum by 2020, based on the level
of carbon tax envisaged in the Government’s National Recovery Plan 2011-2014.
Other Impacts
While the development of the bioenergy sector in Ireland has the potential to support significant
spending and employment creation in the domestic economy, a significant proportion is also
expected to “leak” out of the economy in the form of imported equipment and professional
services.
There is, therefore, the potential for Ireland to secure an even greater share of the economic
benefits through the development of a local supply base.
This also offers an opportunity for the development and testing of new technologies, processes
and skills, which could, in turn, be used to develop an export-focussed industry, as has happened
in other countries.
This will be dependent however on the growth of a critical mass of local activity in the bioenergy
sector, as is envisaged under the baseline scenario presented here.
The expectation under the baseline scenario is also that significant amounts of bioenergy will need
to be imported to reach the required targets. Clearly, if this could be substituted by domestic
production, further economic opportunities and benefits would accrue to Ireland.

The Economic Benefits of the Development of
Bioenergy in Ireland
1
Section 1 Introduction Bioenergy will be an essential element in contributing to Ireland’s future energy needs and has the
potential to provide significant economic and environmental benefits.
(SEAI Bioenergy Roadmap)
The bioenergy sector has the potential to play a vital role in helping Ireland to meet the challenging
targets set by the EU on renewable energy and climate change. In addition, it also offers a more
environmentally sustainable waste management option, helping Ireland to achieve EU Landfill
Directive requirements and reduce costs. Moreover, given the scale of the country’s bioenergy
resources - in the form of agricultural land, forestry and waste from municipal, agriculture and industrial
sources - the sector also offers the opportunity for Ireland to develop a reliable and predictable
indigenous energy supply, thereby reducing the country’s reliance on increasingly volatile and
insecure imported energy products.
While these benefits have been well articulated elsewhere, this report, commissioned by IrBEA and
SEAI, focuses exclusively on the potential economic benefits of developing the bioenergy
sector.
To date, progress in developing the sector has been limited. Indeed, despite a range of policy
initiatives, bioenergy still accounts for less than 2% of Ireland’s total primary energy requirements. This
compares to a situation in the EU27 where biomass now represents some 11.6% of final energy
consumption1. It is clear, therefore, that Ireland has a considerable way to go if bioenergy is to make a
contribution on the scale of that envisaged in the National Renewable Energy Action Plan (NREAP2).
1.1 Approach and Methodology
As set out in the project Terms of Reference, the purpose of this report is to provide evidence on the
potential economic benefits of bioenergy development in Ireland. It focuses in particular on:
the expected employment benefits
the expected investment required
the expected competitiveness benefits
the expected displacement of energy imports / balance of trade benefits
the expected impacts on the rural economy
The approach that has been adopted in undertaking this study has involved two key stages as set out
below.
Stage 1: Meeting the 2020 Targets – Implications for the Structure of the Bioenergy Sector
In order to quantify the potential economic benefits of the development of the bioenergy sector, it was
firstly necessary to define the likely shape of the sector in coming years. Under the EU’s Renewable
1 AEBIOM Annual Statistical Report on the contribution of Biomass to the Energy System in the EU27. Brussels.
June 2011. http://www.aebiom.org/?cat=20 2 http://ec.europa.eu/energy/renewables/transparency_platform/action_plan_en.htm

The Economic Benefits of the Development of
Bioenergy in Ireland
2
Energy Directive (RED)3, Ireland has a mandatory target to produce 16% of its final energy needs from
renewable sources by 2020. In addition, 10% of transport energy must also come from renewable
sources. Bioenergy is expected to make a major contribution to the achievement of these targets.
These targets were used to develop a baseline scenario based on the range of different bioenergy
technologies available. The BioEnergy sub-sectors examined are:
Biomass Heat Only
Biomass CHP - large and small
Biomass to Power
Waste to energy - CHP
Waste to energy - power only
Electricity co-firing with biomass
Anaerobic Digestion (AD) on-farm - large, medium and small
Biomethane - AD on-farm Large, AD off-farm (including Compressed BioMethane - Bio-CNG)
Municipal Sewage AD
Landfill Gas
Biofuels (Including Bioethanol, Biodiesel, PPO + other Irish biofuels)
In addition, developments in the broader policy environment, both nationally and at EU level, were also
considered. This included, for example, the proposed levels of REFIT4 that are likely to be available
over the period to 2020 as well as the REFIT quantitative limits for different technologies, as these
could affect the relative size and composition of facilities. The results of this analysis were then placed
in the context of expectations regarding the overall energy sector in Ireland to 2020, particularly in
terms of total and sectoral energy demand. The analysis also took account of existing and planned
facilities as well as information on potential feedstocks etc. The Consultants worked closely with SEAI
and IrBEA to develop this baseline scenario on how the various targets under the RED could be
achieved and what this could mean in terms of the number and type of bioenergy facilities operating in
Ireland by 2020.
Step 2: Quantifying the Economic Impacts
Having established the likely scope and structure of the sector, the next stage involved the
quantification of possible impacts of developing the sector in terms of investment, employment, energy
imports etc. This analysis was based on a combination of desk-top research of previous studies into
the sector, both nationally and internationally; information on facilities and projects that are already in
place or planned nationally, and also on consultation with and feedback from market participants and
industry experts.
This approach was adopted in light of the relative lack of comprehensive and up-to-date published
statistical information on the sector. While this may partly reflect the complexity of the sub-sectors
covered and the fact that many are at the very early stages of development, it does, nevertheless,
pose a challenge for the industry and for policymakers.
As a result, for the purposes of trying to calculate overall economic impacts at a macro level it has
been necessary to make some broad assumptions about “standard” facilities (in terms of size,
feedstocks etc). In reality, it is clear that capital costs, labour input etc. will vary significantly
depending on the type of technology used, the feedstock available and other factors. Nevertheless,
3 Directive 2009/28/EC of the European Parliament and of the Council of 23 April 2009 on the promotion of the
use of energy from renewable sources and amending and subsequently repealing Directives 2001/77/EC and 2003/30/EC 4 http://www.dcenr.gov.ie/Energy/Sustainable+and+Renewable+Energy+Division/REFIT.htm

The Economic Benefits of the Development of
Bioenergy in Ireland
3
given the scope of the current study it has been necessary to focus on a limited number of types of
“standard” facilities and use these as the basis for arriving at estimates for the sector as a whole.

The Economic Benefits of the Development of
Bioenergy in Ireland
4
Section 2 Meeting the 2020 targets
2.1 Introduction
Ireland is faced with very significant challenges to meet the targets set by the EU in the Climate and
Energy Package and in the Renewable Energy Directive (RED)5.
Ireland’s overall target is to achieve a Renewable Energy Share (RES) of 16% of total energy
consumption by 2020. Furthermore, in its National Renewable Action Plan (NREAP)6, the
Government also set individual 2020 targets for renewable energy in electricity generation (RES-E),
thermal energy (RES-H), and transport (RES-T) namely:
Renewables contribution to gross electricity consumption of 40%.
Renewables contribution to thermal energy (heating & cooling) of 12%.
Renewables contribution to transport energy of 10%.
The Irish government also set the following specific targets:
30% co-firing with biomass at the three peat power plants (by 2015);
800 MWe of CHP by 2020 with an “emphasis on biomass fuelled CHP”.
The bioenergy share of Ireland’s RES targets provides the baseline scenario to the model in this
report. The projected figures for the Total Final Consumption (TFC) and Renewable Energy Share
(RES) are taken from the NREAP / National Energy Efficiency Action Plan (NEEAP) scenario in the
2010 Report, Energy Forecasts to 2020 by the SEAI. The proportions of biofuels used to meet the
RES targets, i.e. the % of TFC from Bioenergy, are assumptions based on the previously mentioned
SEAI report and also from the NREAP itself.
The ‘Energy Forecasts for Ireland to 2020’ (SEAI, 2010) report details the expected total final energy
demand towards 2020. It breaks the total final consumption down by mode into three individual
targets, namely electricity (RES-E), thermal (RES-H) and transport (RES-T). The NEEAP / NREAP
scenario has been adopted as the baseline scenario for the technical model. The following paragraphs
outline the bioenergy-related findings of the ‘Energy Forecasts for Ireland to 2020’ report.
The ‘Energy Forecasts for Ireland to 2020’ report predicts a 2020 Total Final Consumption figure of
12,123 ktoe. (Note: the ‘transport for RES-T’ adjustment results from the EU methodology for
calculation of RES-T to prevent double counting some energy sources.) Table 2.1 outlines predicted
energy consumption by mode of application in 2016 and 2020.
5 EU Directive 2009/28/EC http://eur-
lex.europa.eu/LexUriServ/LexUriServ.do?uri=OJ:L:2009:140:0016:0062:en:PDF 6 National Renewable Energy Action Plan http://www.dcenr.gov.ie/NR/rdonlyres/03DBA6CF-AD04-4ED3-B443-
B9F63DF7FC07/0/IrelandNREAPv11Oct2010.pdf

The Economic Benefits of the Development of
Bioenergy in Ireland
5
Table 2.1 Energy Consumption by Mode of Application (NEEAP/NREAP)
Fuel Final Consumption (ktoe)
2009 2016 2020
Electricity 2429 2562 2613
Thermal 5025 4601 4389
Transport 5074 5109 5121
Transport for (RES-T) 4304 4242 4257
TOTAL 12626 12271 12123
Source: (Energy Modelling Group, SEAI 2010) Adapted from Table 19, Energy Forecast for Ireland to 2020
The ‘Energy Forecasts for Ireland to 2020’ report assumes that REFIT will be the main policy
instrument contributing to achieving Ireland’s RES-E targets. It assumes that biomass electricity
generation will increase by 153MW between 2010 and 2020, due to co-firing potentials at Edenderry
power station, the construction of two Waste-to-Energy facilities and the continued development of
landfill gas and small scale biomass CHP generation.
The report further assumes that the Biofuels Obligation Scheme7 and the Electric Vehicles support
measures will be the main instruments contributing to achieving the 10% RES-T target.
It is also assumed that domestic and commercial Government support measures will be reinstated or
replaced by similar supports and will be the main policy instrument contributing to achieving Ireland’s
RES-H targets. The REFIT tariffs for biomass CHP will also be a key mechanism in achieving 12%
heating and cooling energy from renewables by 2020.
2.2 Meeting the 2020 Targets – The Contribution of the Bioenergy Sector
Bioenergy can make a significant contribution to meeting the 2020 targets. However, despite the
introduction of a range of policy measures and supports (see Appendix 1), progress to date has been
limited – and indeed, bioenergy currently contributes less than 2% of Ireland’s total primary energy
requirements. There is, therefore, a real risk that, without a more concerted and coordinated effort to
promote the development of the sector, it will not be able to achieve its potential.
The following tables (2.2 – 2.5) set out a baseline scenario, with and without imports, of how the
bioenergy sector might look in 2020. It is important to stress that this is intended to provide an
indication of how the targets could be met, not a prediction of how they will be met.
The ‘Energy Forecasts for Ireland to 2020’ report assumes that 2% of the RES-E target will be met by
bioenergy. This equates to a biomass penetration of 607 GWh or 52 ktoe by 2020. The report
assumes the 9% of energy for transport will come from biofuels by 2020. This equates to 4,454 GWh
or 383 ktoe. Following discussion within the project team and with available industry experts, the
project team have assumed that bioenergy will supply 80% of the 12% RES-H target, with the
remainder coming from other technologies such as solar thermal and geothermal systems. This
7 http://www.nora.ie/regulations_legislation/biofuels_obligation_scheme.450.474.html

The Economic Benefits of the Development of
Bioenergy in Ireland
6
equates to a target of 9.6% of total final energy consumption from bioenergy, which is equivalent to
4,896 GWh or 421 ktoe.
The model baseline scenario centres on the following targets:
2.0% bioenergy contribution to total final electricity consumption
9.6% bioenergy contribution to total final thermal energy consumption
The target of 10% of renewable contribution to total final transport energy consumption is not solely
based of domestic production. Imported renewable transport fuels can contribute towards the RES-T
target. To account for this in the model, two different targets for bioenergy contribution to total final
transport consumption were considered:
1. Non-Imports Scenario – 3.0% of transport TFC from Bioenergy
2. Imports Scenario – 9.0% transport TFC from Bioenergy
Non-Imports Scenario
The Non-Imports Scenario does not take account of imported biofuels. The target of 3% of total final
transport consumption is based on the NREAP predictions to 2020 less the proportion of biofuels
which is imported.8
Overall, the target for bioenergy share of total final energy consumption is 5.0% or 601.3 ktoe, as
shown in Table 2.2.
Table 2.2 Targets for Bioenergy Contribution to TFC (Non-Imports Scenario)
Non-Imports Scenario RES % RES (ktoe) TFC (ktoe) % of TFC from
Bioenergy (ktoe) from Bioenergy
Electricity 40 1032 2613 2.0 52.3
Thermal 12 523 4389 9.6 421.3
Transport for RES-T 10 420 4257 3.0 127.7
Total 16 1936 12123 5.0 601.3
Imports Scenario (Transport Biofuels Import Scenario)
The Imports Scenario assumes a target of 9.0% of transport energy coming from biofuels. Note, this
imports scenario is for transport biofuels only and not for imports of other biomass. This results in an
overall target of 7.1% of total final energy consumption coming from bioenergy, or 856.7 ktoe as
shown in Table 2.3.
Table 2.3 Targets for Bioenergy Contribution to TFC (Imports Scenario)
Import Scenario RES % RES (ktoe) TFC (ktoe) % of TFC from
Bioenergy (ktoe) from Bioenergy
Electricity 40 1032 2613 2.0 52.3
Thermal 12 523 4389 9.6 421.3
8 Table 12, NREAP http://www.dcenr.gov.ie/NR/rdonlyres/03DBA6CF-AD04-4ED3-B443-
B9F63DF7FC07/0/IrelandNREAPv11Oct2010.pdf

The Economic Benefits of the Development of
Bioenergy in Ireland
7
Transport for RES-T 10 420 4257 9.0 383.1
Total 16 1936 12123 7.1 856.7
2.3 Modelling the Potential of the Bioenergy Sector
Non-Imports Scenario
Adopting the non-imports scenario for the technical model, it is estimated that the overall target of 5%
bioenergy contribution to TFC can be exceeded. This is based on the assumption that there will be
one large bioethanol and biodiesel facility providing the transport energy and that a substantial portion
of the electricity target will come from waste to energy facilities.
Table 2.4 gives a summary of the model developed and the percentage contribution to each of the
three RES areas. Note, the individual contributions are higher than the NREAP targets; this is as the
model was developed to present a credible industry picture.
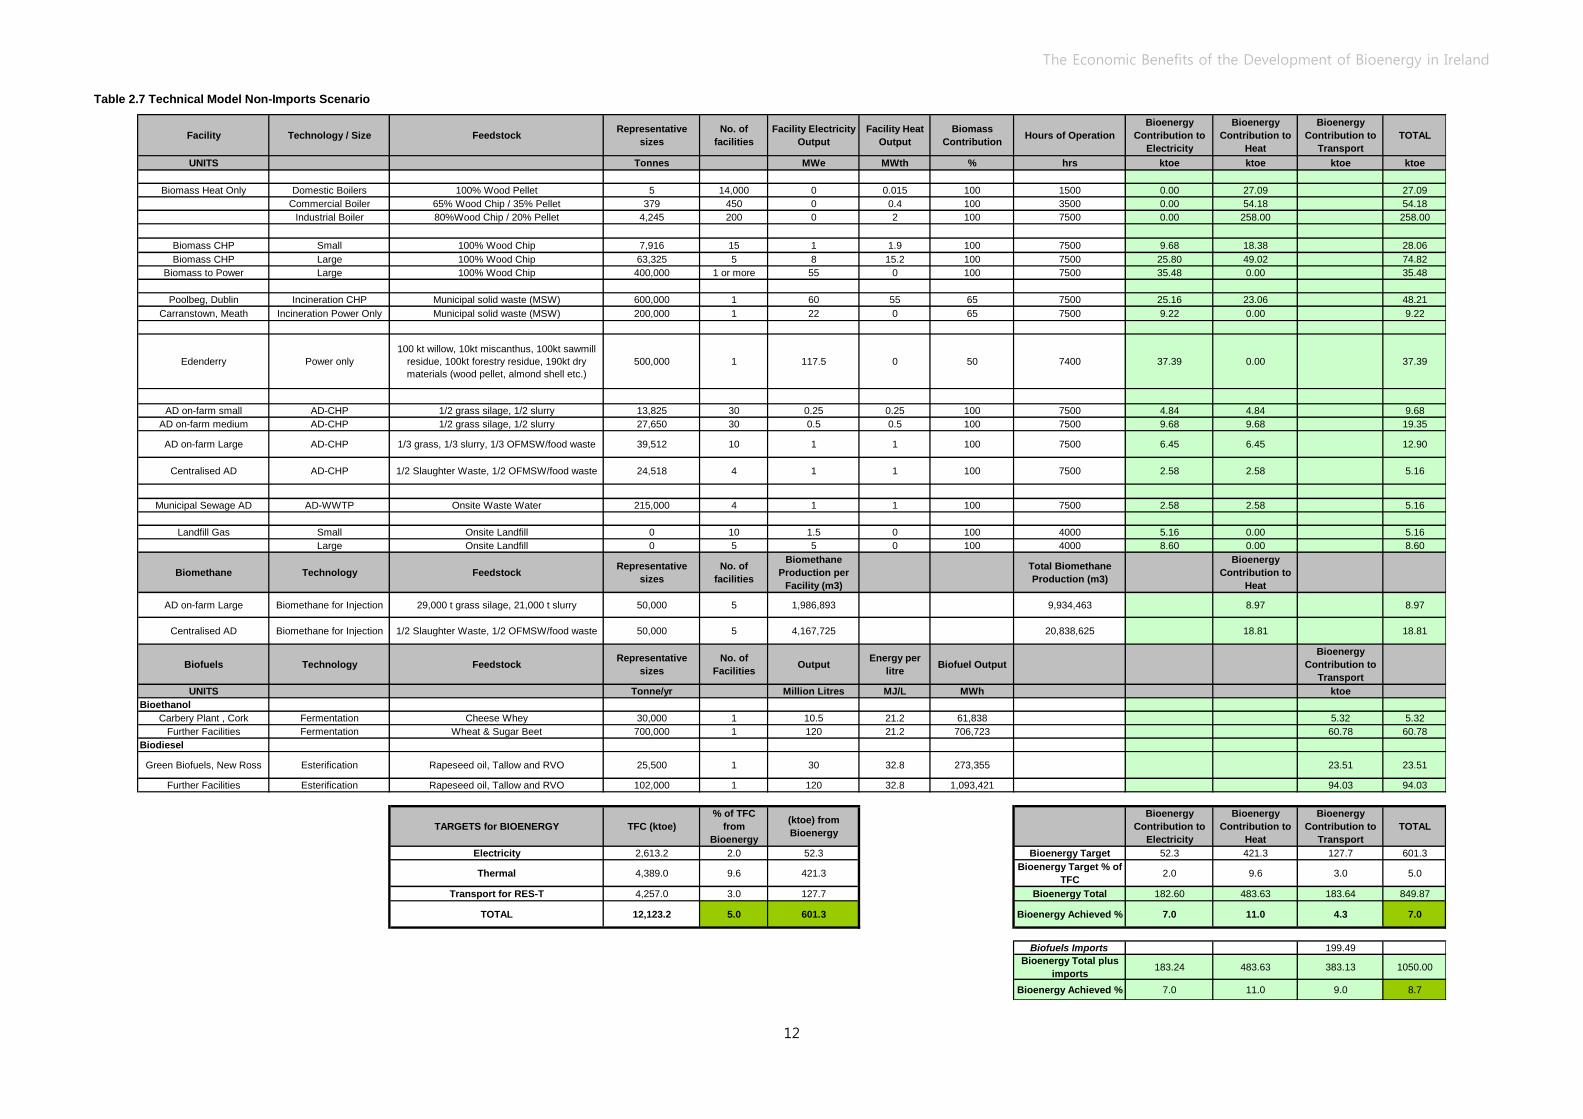
A full version of the model is presented in Table 2.7.
Table 2.4 Modelled Bioenergy Contribution to TFC (Non-Imports Scenario)
Bioenergy
Contribution
to Electricity
Bioenergy
Contribution
to Heat
Bioenergy
Contribution
to Transport
TOTAL
Bioenergy Total 183.24 483.63 183.64 850.51
Bioenergy Achieved % 7.0 11.0 4.3 7.0
Imports Scenario
Adopting the imports scenario, it is estimated that the overall target for bioenergy contribution to TFC
can be exceeded also. Table 2.5 gives a summary of the imports scenario model developed and the %
contribution to each of the three RES areas.
Table 2.5 Modelled Bioenergy Contribution to TFC (Imports Scenario)
Bioenergy
Contribution
to Electricity
Bioenergy
Contribution
to Heat
Bioenergy
Contribution
to Transport
TOTAL
Bioenergy Total 183.2 483.6 183.64 850.51
Biofuels Imports 199.49
Bioenergy Total plus imports 183.2 483.6 383.1 1050.0
Bioenergy Achieved % 7.0 11.0 9.0 8.7
2.4 Technical Model Assumptions
The information for the technical model was gathered from a range of sources including published
industry reports, research publications, international best practice documents and industry feedback.
This chapter provides an overview of the primary assumptions made in the determination of facility
types, sizes, feedstocks and efficiencies incorporated in the technical model.

The Economic Benefits of the Development of
Bioenergy in Ireland
8
2.5 Facilities
Combustion
Five different types of combustion facility are considered in the technical model as follows: Biomass
Heat-Only, Biomass CHP, Biomass to Power, Waste to Energy and Co-firing.
A conversion efficiency of 90% has been assumed for biomass heat-only facilities. Three size
categories are considered for this type of installation: Domestic Boilers – 0.015 MW thermal output,
Commercial Boilers – 0.4 MW thermal output, Industrial Boilers – 2 MW thermal output. The selected
size categories are based on data gathered from the SEAI ReHEAT (Renewable Heat Deployment)
scheme, a number of Irish case studies and from industry feedback. It is estimated that the rate of
installation of biomass heat only boilers will double over the coming nine years until 2020. Forestry
derived feedstocks, i.e. wood chips and pellets are the main input for biomass heat only facilities and
the ratio of wood chips to wood pellets is assumed based on a review of a number of facilities
operating in Ireland and the UK.
Agri-residues such as spent mushroom compost, straw, animal by-products (ABP) and manures can
be used as feedstock for certain combustion facilities. Further detail on these feedstocks can be found
in Appendix 2. For the purpose of the technical model, wood products as feedstock (i.e. chips and
pellets) is applied when examining combustion technologies.
Biomass CHP facilities produce both heat and electricity. The ratio of heat output to electricity output
and the associated efficiencies are largely dependent on the type of technology installed. The
technical model assumes that for every 1 MW of electricity produced there will be 1.9 MW of heat and
that the electrical and thermal efficiencies are 30% and 55% respectively. These assumptions are
based on a number of reference facilities and from industry feedback. Two CHP facility sizes are
described in the model, namely small (1MWe / 1.9 MWth) and large (8 MWe / 15.2 MWth). The sizes
of the small facilities are in line with the European CHP Directive and the larger facility size was
selected based on a number of commercial and industrial CHP units installed in Ireland. It is assumed
that wood chips will be the main feedstock for CHP facilities although wood pellets may also be used
in theory.
The Biomass to Power category relates to several facilities which are at various stages of planning
throughout Ireland. The technical model assumes that a small number of such facilities will be
operational by 2020. The estimated overall capacity is estimated to be in the order of 55 MWe. The
feedstock capacity is assumed to be approximately 400,000 tonnes of wood, which, it is envisaged,
would all be sourced indigenously by 2020 and dried and chipped on site. These assumptions are
based on information provided in the Environmental Appraisal Report of one such facility.
Waste to Energy (WtE) falls under the category of combustion but typically operates with municipal
solid waste (MSW) as their only feedstock. WtE facilities are typically capable of operating in either
‘power-only’ or ‘combined heat or power (CHP)’ modes. The technical model assumes that two
facilities will be operational by 2020 (the Poolbeg facility in Dublin and the Carranstown facility in Co.
Meath) in line with the SEAI ‘Energy Forecast to 2020’ report. Most of the data relating to each facility
(feedstock input, electrical & thermal capacity etc.) has been extracted from reports and documents
available to the public. The model assumes that biomass contributes 65% of the MSW feedstock for
both facilities. The output from the Poolbeg WtE facility is assumed to be 60 MWe and 55 MWth. The
Carranstown facility in Co. Meath is a power only facility with an expected electrical output of 22 MWe.
The Irish government set a target of 30% Co-firing with biomass in three state owned electricity
generating stations by 2015 in the 2007 white paper ‘Delivering a sustainable energy future for Ireland:

The Economic Benefits of the Development of
Bioenergy in Ireland
9
the energy policy framework 2007 – 2020’. However, for the purposes of the model only one facility,
Edenderry Power, is assumed to use biomass at any scale before 2020. This is in line with the
assumptions made in the SEAI “Energy Forecast to 2020” report and also due to the feasibility of co-
firing penetration by 2020.
The Coford “All Ireland Roundwood Demand Forecast 2011-2020” published in 2011, notes the
demand for forest-based biomass for specific use in co-firing will be 109,000m3 in 2020, this will
represent 4% of the total forest-based biomass demand for Ireland.
Information on the facility size, the potential proportion of biomass co-firing and the facility efficiencies
were gathered from statistics released by the Edenderry facility operator. The Edenderry power station
has an electrical efficiency of 38.4% and has an electrical output of 117.5 MW. It is assumed that 50%
of the feedstock will be biomass by 2020. Based on information from Bord na Mona it is predicted that
in 2020 the facility will use 500,000 tonnes of feedstock consisting of 100,000 tonnes of willow,
100,000 tonnes of sawmill residue, 100,000 tonnes of forestry residue, 200,000 tonnes of dry compact
materials (wood pellet, almond shell etc.)9
Anaerobic Digestion
Anaerobic digestion (AD) is a natural process whereby organic material is broken down by bacteria in
an oxygen free environment. Farm, municipal or industrial-based AD plants process organic material in
the form of waste material or purpose grown energy crops into biogas (which contains methane and
carbon dioxide). Four main AD facility types are considered in the technical model: AD on-farm and
off-farm for heat and electricity production and biomethane injection, AD of Municipal Sewage, and
Landfill Gas.
AD on-farm facilities are generally smaller than off-farm centralised AD plants. The facility outputs
assumed for the model are based on the Irish REFIT scheme. The technical model assumes electricity
to heat output ratio of one to one. AD-CHP facilities are assumed to have 35% electrical efficiency and
55% thermal efficiency (based on industry feedback), AD facilities have a parasitic heat requirement
reducing the usable heat to around 35%. The feedstocks used are estimated on the basis that
agricultural residues, e.g. silage and slurry, will be used in on-farm plants and agri-food by-products
will be used in off-farm plants, e.g. food waste, the organic fraction of MSW and animal-by products
(ABP). The quantities and proportions of each are estimates based on figures produced by Singh et
al.10
and from industry feedback.
AD on-farm facilities are considered in three size categories in the model: small, medium and large.
Small on-farm anaerobic digesters are estimated to have outputs of 0.25 MWe and 0.25MWth.
Feedstock is assumed to be half grass silage and half slurry, with a requirement of approximately
22,000 tonnes. Medium on-farm anaerobic digesters are estimated to have outputs of 0.5 MWe and
0.5MWth. Feedstock is assumed to be half grass silage and half slurry, with a requirement of
approximately 45,000 tonnes. Large on-farm anaerobic digesters are estimated to have outputs of 1
MWe and 1 MWth. Feedstock is assumed to be a third grass silage, a third slurry and a third
OFMSW/food-waste, with a requirement of approximately 60,000 tonnes.
Note, these feedstocks are defined in order to generate figures for use in the technical model. It is
possible facilities using these feedstock mixes may require additional support measures in order to be
commercially viable.
9 John O’ Halloran Nov 2010, Co-Firing with Biomass, Edenderry Case Study, Presentation for Teagasc.
10 A. Singh, et al., 2009, A biofuel strategy for Ireland with an emphasis on production of biomethane and
minimization of land-take.

The Economic Benefits of the Development of
Bioenergy in Ireland
10
Off-farm AD facilities are typically of a larger size and therefore electrical and heat outputs of 2MW
have been assumed. These output size estimations for small and large on-farm and off-farm AD
facilities are based on information gathered from currently connected generators and industry
feedback
AD for biomethane injection is treated slightly differently than conventional on and off-farm AD
facilities. The energy produced is in the form of biomethane which can be used for injection into the
grid and also as a vehicle fuel when upgraded to Biomethane CNG. Assumptions and estimates for
biomethane production are based on the previously mentioned report by Singh et al. which was
carried out in conjunction with Bord Gáis.
The capacity of Anaerobic Digestion of municipal sewage is estimated to be 4.5 MWe based on
data provided in the ‘All Ireland Grid Study’ (ESBI, 2008). Industry feedback suggests that the scope
for further large scale projects will be limited but smaller projects may be possible because municipal
sewage anaerobic digesters are typically only installed in waste water treatment facilities which are
servicing a population equivalent of at least 40,000.
The number of landfill gas facilities is also based on figures provided in the All Ireland Grid Study
(ESBI, 2008). The size of Landfill Gas facilities is defined by the amount of waste that was / can be
accepted. The technical model assumes that (other than those identified in the All Ireland Grid Study)
the bioenergy potential from landfill gas will not increase.
Biofuels
There is very little available data relating to biofuel production in Ireland. Figures in the technical model
relating to the Carbery bioethanol facility (Co. Cork) and the Green Biofuels biodiesel facility (New
Ross) were extracted from information provided by Teagasc. In addition one or more bioethanol and
biodiesel facilities have been assumed plus a number of smaller facilities producing PPO or similar.
Biomethane from AD may be compressed to make Biomethane CNG which can also be used as a
transport fuel, but this option is not explored in the current technical model presented.
The feedstock quantity and facility output for the ‘further bioethanol facility’ is based on scaling down
from similar facilities in the UK which also use sugar beet and wheat as feedstocks. Similarly, the
quantity of feedstock and output of the ‘further biodiesel facility’ is based on scaling up of the figures
from the ‘Green Biofuels Plant’ following industry feedback. Feedstocks for biodiesel production
include vegetable oil, tallow and recovered vegetable oil (RVO). The output (in millions of litres) is an
estimate based on advice from industry feedback.
2.6 Feedstocks
The technical model assumes that the main feedstocks used for combustion are wood chip and wood
pellet with potential to use Agri-residues. Biomass heat only, Biomass CHP and Biomass Power only
facilities are all assumed to use some combination of wood chip and pellet or else exclusively wood
chip. An energy content of 4.7 kWh/kg is assumed for wood pellets which have 8% moisture content
and 3.79 kWh/kg for wood chip, with 25% moisture content.
In the Waste to Energy and Co-firing facilities the feedstock information was not assumed. Values
used in the model are obtained from documents and reports made available to the public by the
specific facility operators.

The Economic Benefits of the Development of
Bioenergy in Ireland
11
The proportions and likely types of feedstock assumed for anaerobic digestion facilities are based on
estimates by the consultant team and on industry feedback. The size and number of AD facilities were
verified based on the projected available feedstock in 2020, from a report by A. Singh et al.11
Furthermore, the energy yield in kWh/t and the biogas yield per tonne of slurry, Animal By-Products
and the organic fraction of municipal solid waste (OFMSW) used in the technical model was based on
the same report. A normalised figure for the various different types of slurry/ABP projected to be
available in Ireland in 2020 was used, based on the slurry available per head from each livestock type
and the slaughter waste available.
Table 2.6 Feedstock Values for Model
Feedstock Energy Content
Wood Chip @ 25% moisture 3.79 kWh/kg
Wood Pellet @ 8% moisture 4.7 kWh/kg
Grass Silage @ 22% DM 0.640 kWh/kg
Slurry (normalised) 0.135 kWh/kg
OFMSW 0.852 kWh/kg
Slaughter Waste 0.897 kWh/kg
Wastewater sludge 0.162 kWh/kg
11
A. Singh, B. Smyth & J. Murphy, 2009, A biofuel strategy for Ireland with an emphasis on production of
biomethane and minimization of land-take.
The Economic Benefits of the Development of Bioenergy in Ireland
12
Table 2.7 Technical Model Non-Imports Scenario
Facility Technology / Size FeedstockRepresentative
sizes
No. of
facilities
Facility Electricity
Output
Facility Heat
Output
Biomass
ContributionHours of Operation
Bioenergy
Contribution to
Electricity
Bioenergy
Contribution to
Heat
Bioenergy
Contribution to
Transport
TOTAL
UNITS Tonnes MWe MWth % hrs ktoe ktoe ktoe ktoe
Biomass Heat Only Domestic Boilers 100% Wood Pellet 5 14,000 0 0.015 100 1500 0.00 27.09 27.09
Commercial Boiler 65% Wood Chip / 35% Pellet 379 450 0 0.4 100 3500 0.00 54.18 54.18
Industrial Boiler 80%Wood Chip / 20% Pellet 4,245 200 0 2 100 7500 0.00 258.00 258.00
Biomass CHP Small 100% Wood Chip 7,916 15 1 1.9 100 7500 9.68 18.38 28.06
Biomass CHP Large 100% Wood Chip 63,325 5 8 15.2 100 7500 25.80 49.02 74.82
Biomass to Power Large 100% Wood Chip 400,000 1 or more 55 0 100 7500 35.48 0.00 35.48
Poolbeg, Dublin Incineration CHP Municipal solid waste (MSW) 600,000 1 60 55 65 7500 25.16 23.06 48.21
Carranstown, Meath Incineration Power Only Municipal solid waste (MSW) 200,000 1 22 0 65 7500 9.22 0.00 9.22
Edenderry Power only
100 kt willow, 10kt miscanthus, 100kt sawmill
residue, 100kt forestry residue, 190kt dry
materials (wood pellet, almond shell etc.)
500,000 1 117.5 0 50 7400 37.39 0.00 37.39
AD on-farm small AD-CHP 1/2 grass silage, 1/2 slurry 13,825 30 0.25 0.25 100 7500 4.84 4.84 9.68
AD on-farm medium AD-CHP 1/2 grass silage, 1/2 slurry 27,650 30 0.5 0.5 100 7500 9.68 9.68 19.35
AD on-farm Large AD-CHP 1/3 grass, 1/3 slurry, 1/3 OFMSW/food waste 39,512 10 1 1 100 7500 6.45 6.45 12.90
Centralised AD AD-CHP 1/2 Slaughter Waste, 1/2 OFMSW/food waste 24,518 4 1 1 100 7500 2.58 2.58 5.16
Municipal Sewage AD AD-WWTP Onsite Waste Water 215,000 4 1 1 100 7500 2.58 2.58 5.16
Landfill Gas Small Onsite Landfill 0 10 1.5 0 100 4000 5.16 0.00 5.16
Large Onsite Landfill 0 5 5 0 100 4000 8.60 0.00 8.60
Biomethane Technology FeedstockRepresentative
sizes
No. of
facilities
Biomethane
Production per
Facility (m3)
Total Biomethane
Production (m3)
Bioenergy
Contribution to
Heat
AD on-farm Large Biomethane for Injection 29,000 t grass silage, 21,000 t slurry 50,000 5 1,986,893 9,934,463 8.97 8.97
Centralised AD Biomethane for Injection 1/2 Slaughter Waste, 1/2 OFMSW/food waste 50,000 5 4,167,725 20,838,625 18.81 18.81
Biofuels Technology FeedstockRepresentative
sizes
No. of
FacilitiesOutput
Energy per
litreBiofuel Output
Bioenergy
Contribution to
Transport
UNITS Tonne/yr Million Litres MJ/L MWh ktoe
Bioethanol
Carbery Plant , Cork Fermentation Cheese Whey 30,000 1 10.5 21.2 61,838 5.32 5.32
Further Facilities Fermentation Wheat & Sugar Beet 700,000 1 120 21.2 706,723 60.78 60.78
Biodiesel
Green Biofuels, New Ross Esterification Rapeseed oil, Tallow and RVO 25,500 1 30 32.8 273,355 23.51 23.51
Further Facilities Esterification Rapeseed oil, Tallow and RVO 102,000 1 120 32.8 1,093,421 94.03 94.03
TARGETS for BIOENERGY TFC (ktoe)
% of TFC
from
Bioenergy
(ktoe) from
Bioenergy
Bioenergy
Contribution to
Electricity
Bioenergy
Contribution to
Heat
Bioenergy
Contribution to
Transport
TOTAL
Electricity 2,613.2 2.0 52.3 Bioenergy Target 52.3 421.3 127.7 601.3
Thermal 4,389.0 9.6 421.3Bioenergy Target % of
TFC2.0 9.6 3.0 5.0
Transport for RES-T 4,257.0 3.0 127.7 Bioenergy Total 182.60 483.63 183.64 849.87
TOTAL 12,123.2 5.0 601.3 Bioenergy Achieved % 7.0 11.0 4.3 7.0
Biofuels Imports 199.49
Bioenergy Total plus
imports183.24 483.63 383.13 1050.00
Bioenergy Achieved % 7.0 11.0 9.0 8.7
The Economic Benefits of the Development of
Bioenergy in Ireland
13
Section 3 Economic Benefits of Bioenergy
“Bioenergy contributes to many important elements of a country or region’s development including:
economic growth through business expansion and employment; import substitution; and
diversification and security of energy supply. Other benefits include support of traditional industries,
rural diversification, rural depopulation mitigation and community empowerment.”
International Energy Agency12
3.1 Introduction
Chapter 2 sets out a scenario of how the 2020 targets could be achieved and what this might mean in
terms of the structure of the bioenergy sector in Ireland. This chapter focuses on the potential
impacts of this structure on the wider economy in terms of key economic indicators such as capital
investment, employment, trade and competitiveness.
The following sections set out the findings and the underlying assumptions for each of the different
types of bioenergy technologies covered. The analysis draws on a combination of desk-top research
of previous studies into the sector, both nationally and internationally; information on facilities and
projects that are already in place or planned nationally and also from feedback from industry experts
and market participants.
Note that all monetary values are in 2011 prices.
3.2 Direct Combustion
Direct combustion is the simplest way to produce heat energy from biomass. The heat, in the form of
steam or hot water, can be converted to electricity and/or it can be used directly for heating houses
and buildings and processes.
Biomass combustion facilities will vary widely in size depending on the type of facility and the
application. For domestic applications (e.g. those covered by the Greener Homes Scheme), the
output from small wood and pellet stoves and boilers can vary from 2 kW up to 50 kW, depending on
the dwelling. Medium sized combustion facilities i.e. those for larger commercial and industrial
developments can have an output range of 0.5 to 3 MW.
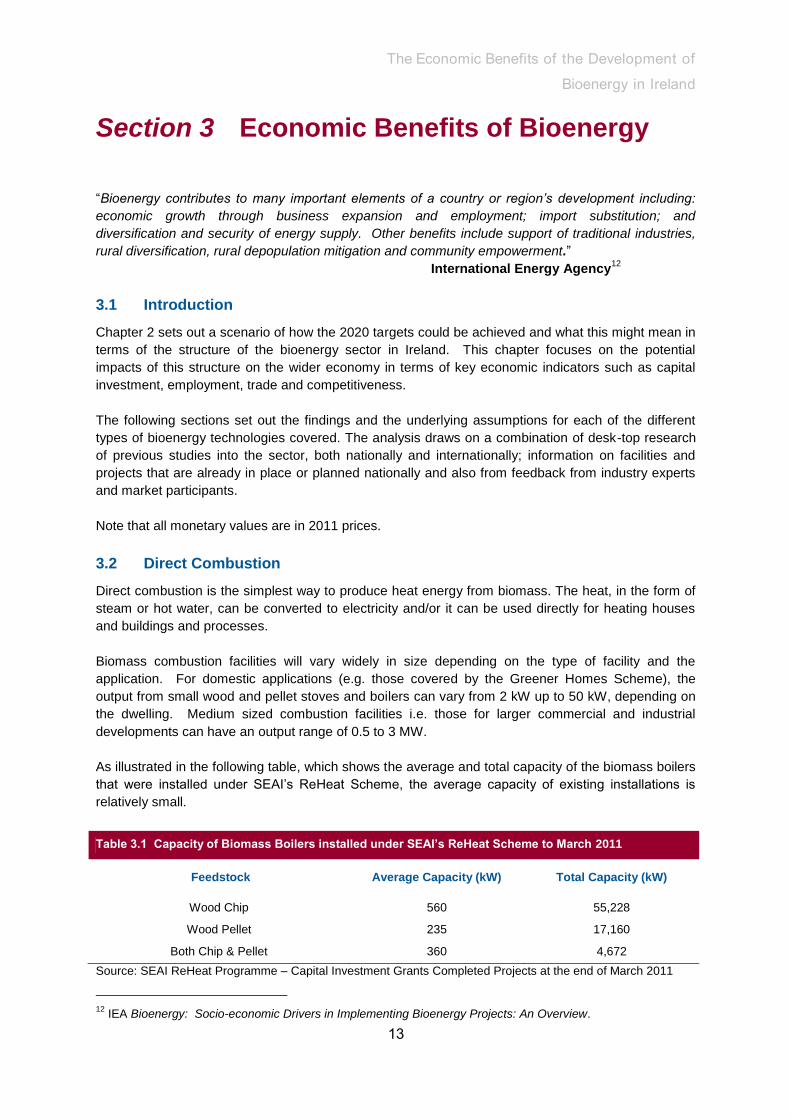
As illustrated in the following table, which shows the average and total capacity of the biomass boilers
that were installed under SEAI’s ReHeat Scheme, the average capacity of existing installations is
relatively small.
Table 3.1 Capacity of Biomass Boilers installed under SEAI’s ReHeat Scheme to March 2011
Feedstock Average Capacity (kW) Total Capacity (kW)
Wood Chip 560 55,228
Wood Pellet 235 17,160
Both Chip & Pellet 360 4,672
Source: SEAI ReHeat Programme – Capital Investment Grants Completed Projects at the end of March 2011
12
IEA Bioenergy: Socio-economic Drivers in Implementing Bioenergy Projects: An Overview.
The Economic Benefits of the Development of
Bioenergy in Ireland
14
Published data on the costs of biomass combustion projects is limited, particularly for those in a non-
domestic setting, where their application and the heat service they supply can vary significantly.
For the purposes of this study a number of different facilities have been considered in an attempt to
build up a picture of how the sector might develop by 2020. This includes assumptions about the use
of domestic, commercial and industrial boilers, as well as Biomass CHP facilities, co-firing at Irish
power stations and the development of a number of Waste-to-Energy facilities.
3.3 Biomass Heat in 2020
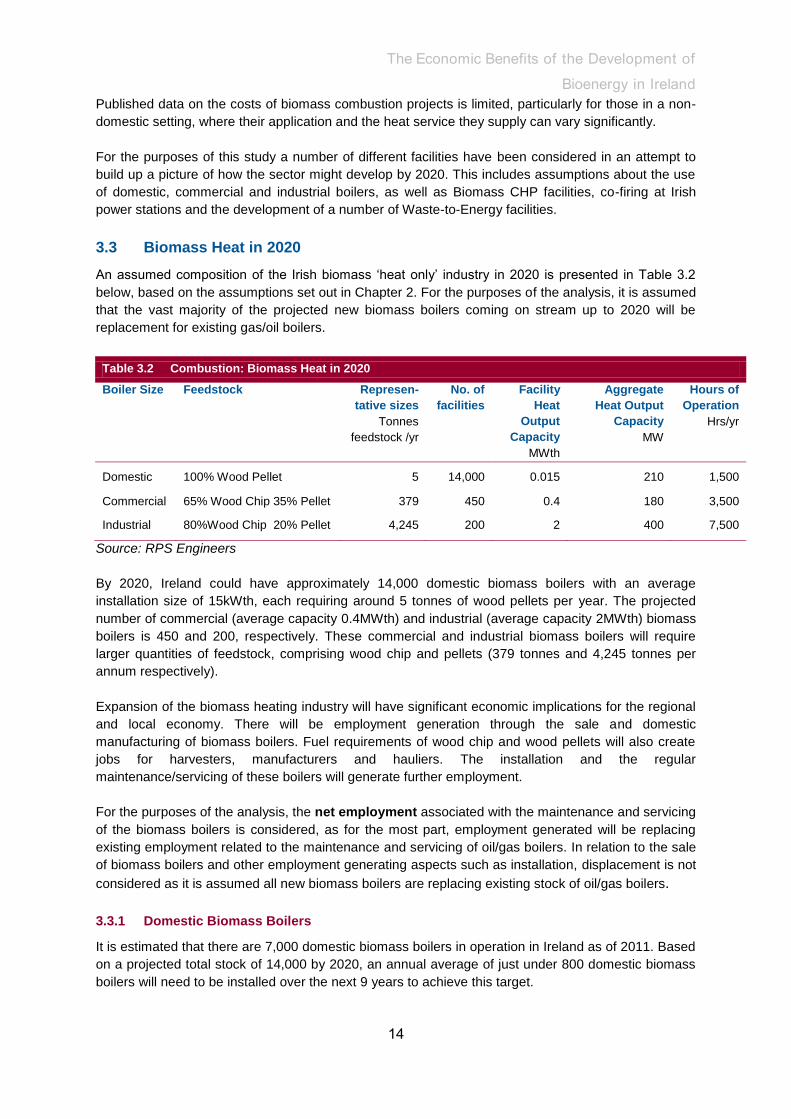
An assumed composition of the Irish biomass ‘heat only’ industry in 2020 is presented in Table 3.2
below, based on the assumptions set out in Chapter 2. For the purposes of the analysis, it is assumed
that the vast majority of the projected new biomass boilers coming on stream up to 2020 will be
replacement for existing gas/oil boilers.
Table 3.2 Combustion: Biomass Heat in 2020
Boiler Size
Feedstock
Represen-
tative sizes
Tonnes
feedstock /yr
No. of
facilities
Facility
Heat
Output
Capacity
MWth
Aggregate
Heat Output
Capacity
MW
Hours of
Operation
Hrs/yr
Domestic 100% Wood Pellet 5 14,000 0.015 210 1,500
Commercial 65% Wood Chip 35% Pellet 379 450 0.4 180 3,500
Industrial 80%Wood Chip 20% Pellet 4,245 200 2 400 7,500
Source: RPS Engineers
By 2020, Ireland could have approximately 14,000 domestic biomass boilers with an average
installation size of 15kWth, each requiring around 5 tonnes of wood pellets per year. The projected
number of commercial (average capacity 0.4MWth) and industrial (average capacity 2MWth) biomass
boilers is 450 and 200, respectively. These commercial and industrial biomass boilers will require
larger quantities of feedstock, comprising wood chip and pellets (379 tonnes and 4,245 tonnes per
annum respectively).
Expansion of the biomass heating industry will have significant economic implications for the regional
and local economy. There will be employment generation through the sale and domestic
manufacturing of biomass boilers. Fuel requirements of wood chip and wood pellets will also create
jobs for harvesters, manufacturers and hauliers. The installation and the regular
maintenance/servicing of these boilers will generate further employment.
For the purposes of the analysis, the net employment associated with the maintenance and servicing
of the biomass boilers is considered, as for the most part, employment generated will be replacing
existing employment related to the maintenance and servicing of oil/gas boilers. In relation to the sale
of biomass boilers and other employment generating aspects such as installation, displacement is not
considered as it is assumed all new biomass boilers are replacing existing stock of oil/gas boilers.
3.3.1 Domestic Biomass Boilers
It is estimated that there are 7,000 domestic biomass boilers in operation in Ireland as of 2011. Based
on a projected total stock of 14,000 by 2020, an annual average of just under 800 domestic biomass
boilers will need to be installed over the next 9 years to achieve this target.

The Economic Benefits of the Development of
Bioenergy in Ireland
15
Purchase Price, Import Content and Installation
Based on discussions with manufacturers and retailers of biomass boilers, the average purchase
price of the domestic biomass boilers being sold in the Republic of Ireland is approximately €9,230
(exc. VAT), of which an average of 36% represents import content.13
The non-labour aspect of the
installation process, such as flues and base supports, is also included in this purchase price.
Employment Impacts
Information on the number of full-time equivalent staff (FTE) employed in the manufacture and sale of
boilers in Ireland was obtained from discussions with Irish manufacturers and retailers14
. This was
combined with information on volumes of sales, again obtained from market participants, to obtain an
estimate of how many annual FTEs were required ‘per domestic biomass boiler’ sold in Ireland. In
this instance, it was calculated that 0.07 annual work years per domestic biomass boiler sold. On the
basis of estimated annual sales of 778 domestic biomass boilers over the period to 2020, then this
would support 57 FTE positions each year through manufacturing and retailing that would not
have been created otherwise.
It is assumed that that there will be around 14,000 biomass boilers in operation in Ireland by 2020,
with the requirement for each boiler to be maintained and serviced. Market feedback indicates that it
would take one professional approximately 1 day in total to service each boiler per year. This equates
to an annual requirement of approximately 61 FTEs. However, it also means that the 14,000 gas and
oil boilers that, it is assumed, have been replaced will no longer need servicing. Having established
that it takes one professional roughly 0.25 days to service a gas and oil boiler, this would result in net
additional employment of 46 FTEs for servicing domestic biomass boilers by 2020.15
As each service is expected to cost in the region of €400, an annual sum of €5.6m is estimated to be
spent on servicing domestic biomass boilers by 2020. However, net additional expenditure will be
closer to €3.5m after taking account of expenditure foregone on the servicing of gas and oil boilers16
.
The installation of domestic biomass boilers is relatively employment intensive, albeit the impact is
temporary. With a projected 778 boilers being installed annually, each will take approximately 1.5
days of a professional’s time. This is equivalent to an annual employment impact equivalent to 5 work
years over the period to 2020 that would not have happened otherwise (or 46 work years in total for
the period 2012-202 as a whole). The average labour cost of installation is estimated to be €1,500 per
boiler, or €1.2m per annum based on the above.
Looking at the domestic biomass sector as a whole in 2020, if the target of 14,000 boilers is
achieved, this will have cost €129.2 million (ex VAT). Factoring labour installation costs into
this implies that consumers will have invested approximately €150.2 million in domestic
biomass boilers. Half of this investment is expected to take place between 2011 and 2020, with
the remainder having taken place pre-2011.
3.3.2 Commercial & Industrial
13 Note: This also accounts for resellers, who import boilers from abroad and charge a mark-up. 14
Those companies who also have operations outside of the Republic of Ireland were asked to provide employment/sales information for the approximate proportion that dealt with the Republic market only.
15 Based on 229 working days in a year. 16
Estimated to average approximately €150 per boiler over the entire stock.

The Economic Benefits of the Development of
Bioenergy in Ireland
16
There are an estimated 80 commercial biomass boilers in Ireland as of 2011.17
Based on a projected
total stock of 450 by 2020, an annual average of 41 commercial biomass boilers will need to be
installed over the next 9 years.
Similarly, with an estimated 10 industrial biomass boilers in operation in Ireland as of 2011, an annual
average of 21 boilers will need to be installed over the next 9 years to reach the projected total stock
of 200 by 2020.
Purchase Price, Import Content and Installation
Based on data from applications under SEAI’s Renewable Heat Deployment Programme (ReHeat),
commercial biomass boilers typically cost in the region of €400/kW while industrial biomass boilers
cost approximately €350/kW. Therefore, a typical commercial biomass boiler costs approximately
€160,000 (ex. VAT, based on a 400kw boiler size), while discussions with manufacturers and
resellers of biomass boilers suggest that approximately 77% of that value is imported.18
Industrial
biomass boilers are estimated to cost approximately €700,000 (ex. VAT based on a 2MW boiler size),
with an average import content of 63%. These figures also include the labour and non-labour
elements of the installation process but they do not account for ancillary works.
On the basis that 41 commercial and 21 industrial boilers will be installed each year up to 2020, an
annual average of almost €21.3 million (ex. VAT) will have been spent purchasing and installing them.
This equates to a total of €191.7 million (ex. VAT) for the period from 2012 to 2020 as a whole.
In addition, it is estimated that ancillary works (civil engineering etc.) will cost almost €1.1 million a
year,19
or €9.6 million in total, over the period from 2012 to 2020.
Employment Impacts
Production and Supply
Industry feedback indicates that the equivalent of just over 0.5 FTEs is required on average for every
commercial biomass boiler sold/produced in Ireland per year – based on the employment intensity of
production and reselling in Ireland. This excludes installation and ancillary works however.
With a projection of 41 commercial biomass boilers being sold each year up to 2020, this
would generate an estimated 20 FTE jobs.
Discussions with boiler manufacturers and retailers indicate that, on average, approximately 1.2 FTEs
are required to produce and sell one industrial biomass boiler in Ireland.
With an assumed 21 industrial biomass boilers being sold each year up to 2020, this would
generate an estimated 25 FTE jobs.
It is estimated that over the period 2012-2020, the €9.6 million which would also be invested in
ancillary works would generate temporary employment equivalent to 108 work years (54 direct, 23
indirect, 31 induced).
Maintenance and Servicing
As indicated above, it is estimated that there are already some 90 industrial and commercial boilers
installed in Ireland and a further 558 are expected to be installed over the period to 2020, resulting in
17
http://www.seai.ie/Grants/Renewable_Heat_Deployment_Programme/. 18
Taking account of importers’ and resellers’ mark-up. 19
Industry feedback recommended the use of a 5% uplift to reflect the typical costs of ancillary works.

The Economic Benefits of the Development of
Bioenergy in Ireland
17
a total stock of almost 650 commercial and industrial biomass boilers which will require annual
maintenance and servicing (i.e. 450 commercial and 200 industrial boilers).
Industry feedback suggests that it would take approximately 3 days per year for a qualified
professional to service a 400kW commercial boiler and would cost in the region of €2,000. The
industrial boilers could take two professionals up to six days per annum to maintain and service (12
days) and would cost closer to €4,000 per boiler.20
On this basis:
Expenditure on the servicing of commercial and industrial boilers would be in the region of
€1.7m (ex VAT) per annum.
The employment generated would be equivalent to 16 FTEs (6 FTE for the 450 commercial
and 10 FTE for the 200 industrial boilers).
As with the servicing of domestic biomass boilers, there would be some displacement involved as
servicing of alternative boilers would be required in their absence. Market feedback indicates that the
average cost of servicing a natural gas/oil commercial boiler is in the region of €590 annually, taking
one day of a qualified technician’s time. This increases to €725 for industrial boilers which generally
would require the same time allocation.
Based on the above and the assumption that all biomass boilers installed between 2012 and 2020 are
replacements for gas/oil boilers, the following net economic impacts are calculated:
Accounting for displacement, the net annual expenditure on servicing
commercial/industrial biomass boilers is Commercial (€900,000-€265,500) + Industrial
(€800,000-€145,000) = €1.290 million.
The net increase in employment generated by servicing commercial/industrial biomass
boilers by 2020 is estimated to be in the region of 13.5 FTEs.
By 2020, it is expected that €212 million (ex. VAT) will have been invested in the purchase and
installation of commercial and industrial biomass boilers. In addition, approximately €10.6
million will also have been spent on ancillary works. Over 90% of investment – €201 million –
is expected to take place between 2012 and 2020.
Feedstock – Economic Impacts
Domestic Biomass Boilers
Feedstock is an important aspect of the industry that will generate sustained employment as the
14,000 domestic biomass boilers in 2020 will each require approximately 5 tonnes of wood pellets per
annum. This would equate to a total annual feedstock requirement of 70,000 tonnes of wood pellets
by 2020. Industry feedback indicates that wood pellets for domestic use cost roughly €225 per tonne,
implying a total annual cost of €15.75m by 2020. It is assumed that this will displace imported oil and
natural gas. Based on market research and discussions with industry personnel, wood pellets for
domestic biomass boilers alone could generate 24 FTE positions, based on 0.35 FTE per thousand
tonnes of wood pellets produced.
The displacement of oil delivery personnel also needs to be considered, however. Assuming that one
tonne of green wood fuel displaces 300 litres of oil, this would suggest that the domestic biomass
20
These figures include the cost of replacement parts and components.

The Economic Benefits of the Development of
Bioenergy in Ireland
18
boilers in 2020 would displace 21 million litres of oil, equivalent to approximately 3 FTEs in
distribution.21
Therefore the net employment impact for domestic biomass boilers is 21 direct FTE positions
by 2020.
Commercial/Industrial Biomass Boilers
The feedstock for the biomass boilers with an average heat output of around 0.4 MWth will comprise
both wood chip and wood pellet, with the former accounting for a more significant proportion.
With approximately 379 tonnes of feedstock required per annum for each of the 450
commercial biomass boilers estimated to be in operation by 2020, 65%, or 246 tonnes, is
likely to come from wood chip with the remainder (133 tonnes) comprising wood pellet.
There will be a larger annual requirement of feedstock for industrial biomass boilers,
estimated at approximately 4,245 tonnes for each of the 200 boilers in operation by 2020.
Wood chip will be the primary feedstock component (80%, or 3,396 tonnes) with pellet
accounting for the balance (849 tonne).
Wood Pellet
On this basis, a total of 60,000 tonnes of wood pellet per annum will be required for commercial
biomass boilers by 2020, while 170,000 tonnes per annum will be required for industrial biomass
boilers: a total of 230,000 tonnes. Companies operating on this scale would generally be buying in
bulk and would therefore be able to achieve a discount over rates charged at domestic level. It is
estimated that commercial premises will be able to purchase wood pellet for €188 per tonne, implying
that commercial/industrial boilers would require approximately €43.2 million worth of pellets for their
respective operations by 2020.
Based on an estimated employment intensity of 0.35 FTE per 1,000 tonnes of wood pellet produced,
and assuming that it is all sourced in the Republic of Ireland, then this would suggest that the pellet
industry for commercial and industrial boilers would generate around 81 FTEs by 2020.22
Both
expenditure and employment figures would account for all stages of production in addition to transport
and delivery.
The 230,000 tonnes of pellet would however displace approximately 102.5 million litres23
of oil
therefore reducing the net employment impact by 14 FTE due to oil distribution displacement. Thus,
the net employment impact of pellet provision for the commercial and industrial sector is
about 67 FTEs by 2020.
Wood Chip
Wood chip is reported to be less expensive than wood pellet and also less employment intensive (at
0.21 FTE per tonne produced). By 2020, based on the projection of 650 commercial/industrial
21
P. 19, Economic Potential Biomass CHP: Market Potential in the Western Region. Estimates based on Economic Impact of a Regional Wood Energy Strategy. i.e. approximately 7.542 million litres of oil is equivalent
to c. 1 FTE in distribution – this methodology has been applied throughout this document. 22
There are pellet producers that operate on a relatively small scale in Ireland and thus do not generate large economies of scale in terms of employment. Conversely, there are larger providers who do achieve these efficiencies. The figure of 0.35 FTE per 1000 tonne of pellet produced is based on a combined average of producer’s employment intensities and applying this to feedstock for all boilers. 23
Oil = 10.5Kwh/litre for comparison purposes. Source: http://www.seai.ie/Publications/Statistics_Publications/Fuel_Cost_Comparison/Commercial%20Fuel%20Cost%20Comparison.pdf
The Economic Benefits of the Development of
Bioenergy in Ireland
19
biomass boilers and the feedstock requirements outlined previously, 790,000 tonnes a year of wood
chip will be required for commercial/industrial boilers. It is estimated that the average cost per tonne
will be roughly €84 based on market feedback, implying that total expenditure on wood chip will be in
the region of €66 million per year by 2020.
Assuming this is all produced domestically, the supply of 790,000 tonnes of wood chip will generate
166 FTEs.24
Both expenditure and employment figures would account for all stages of production in
addition to transport and delivery.
It is also necessary to take account of possible displacement effects, however. It is estimated that the
use of 790,000 tonnes of wood chip will result in the displacement of approximately 285 million litres
of oil. As a result, the employment impact will be reduced by 37 FTE. Thus, the net employment
impact associated with wood chip provision for the commercial / industrial sector is estimated
at approximately 129 direct FTEs by 2020.
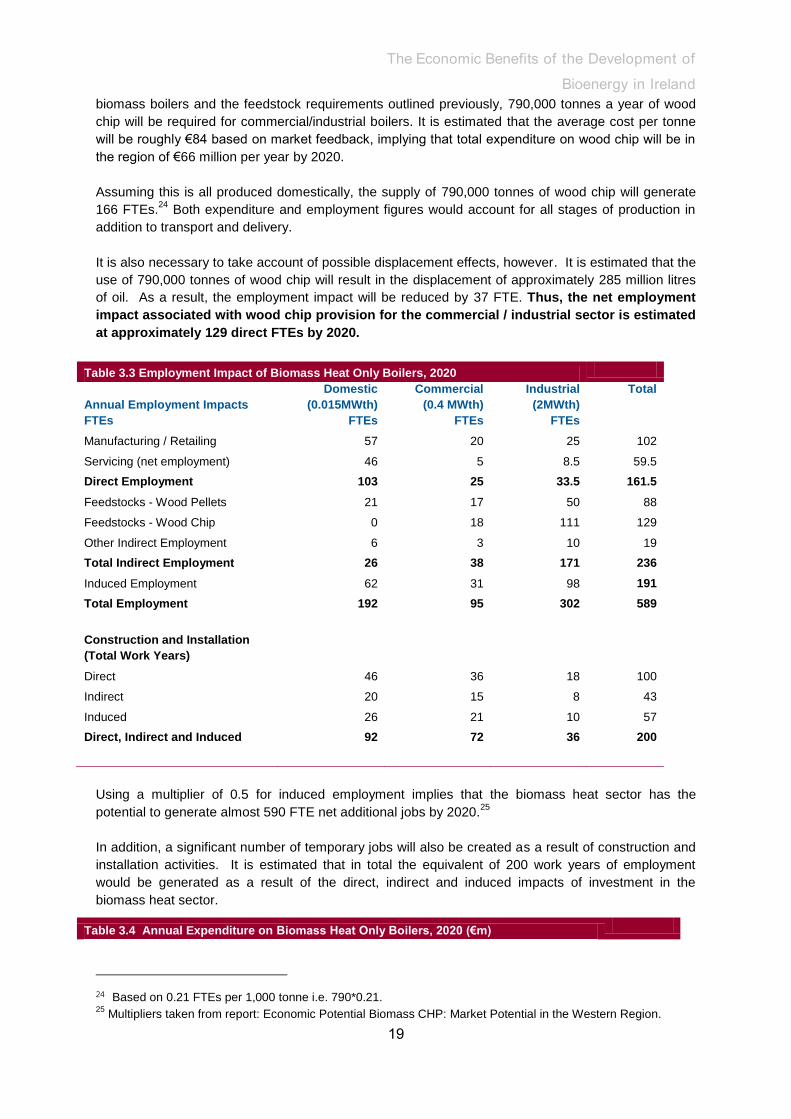
Table 3.3 Employment Impact of Biomass Heat Only Boilers, 2020
Annual Employment Impacts
FTEs
Domestic
(0.015MWth)
FTEs
Commercial
(0.4 MWth)
FTEs
Industrial
(2MWth)
FTEs
Total
Manufacturing / Retailing 57 20 25 102
Servicing (net employment) 46 5 8.5 59.5
Direct Employment 103 25 33.5 161.5
Feedstocks - Wood Pellets 21 17 50 88
Feedstocks - Wood Chip 0 18 111 129
Other Indirect Employment 6 3 10 19
Total Indirect Employment 26 38 171 236
Induced Employment 62 31 98 191
Total Employment 192 95 302 589
Construction and Installation
(Total Work Years)
Direct 46 36 18 100
Indirect 20 15 8 43
Induced 26 21 10 57
Direct, Indirect and Induced 92 72 36 200
Using a multiplier of 0.5 for induced employment implies that the biomass heat sector has the
potential to generate almost 590 FTE net additional jobs by 2020.25
In addition, a significant number of temporary jobs will also be created as a result of construction and
installation activities. It is estimated that in total the equivalent of 200 work years of employment
would be generated as a result of the direct, indirect and induced impacts of investment in the
biomass heat sector.
Table 3.4 Annual Expenditure on Biomass Heat Only Boilers, 2020 (€m)
24 Based on 0.21 FTEs per 1,000 tonne i.e. 790*0.21. 25
Multipliers taken from report: Economic Potential Biomass CHP: Market Potential in the Western Region.

The Economic Benefits of the Development of
Bioenergy in Ireland
20
Domestic Boilers
Commercial
Boilers
Industrial
Boilers
Total
Maintenance / Servicing 3.5 0.9 0.8 5.2
Feedstock Pellet 15.8 11.2 32.0 59.0
Feedstock Chip 0.0 9.2 56.8 66.0
Total Annual Expenditure* 19.3 21.3 89.6 130.2
*excludes payroll
The figures above are grossed up to account for 14,000 domestic biomass boilers and 450
commercial /200 industrial biomass boilers in 2020. It is apparent from Table 3.4 that fuel is a
significant ongoing cost of operating biomass boilers.
Table 3.5 Cumulative Investment in Biomass Heat Only Boilers by 2020
Boiler Purchase and
Installation
(€m ex VAT)
Ancillary Works
(€m ex VAT)
Total
(€m ex VAT)
Domestic Biomass Boilers 150 0 150
Commercial / Industrial Boilers 212 11 223
Total 362 11 373
Of the €373 million that is projected to have been invested in installing biomass heat boilers by 2020,
approximately €201 million, or 54% of this value will have been imported, which is based on the
respective import values outlined in section 3.3.1 and 3.3.2.
3.4 Biomass Combined Heat and Power (CHP) and Biomass Power in 2020
3.4.1 Small Biomass CHP Facilities
Investment – Capital Costs
By 2020, it is assumed that there will be 15 ‘smaller’ Biomass CHP (approx. 1MWe) facilities in
Ireland, each requiring more than 7,900 tonnes of biomass feedstock each year. Based on
discussions with the CHP market, it is estimated that a biomass CHP facility with 1MWe would have a
capital cost in the region of €3.56 million. Grossing up this average capital cost to account for a
projected 15 facilities by 2020 implies that approximately €53.4 million will need to be invested in
these facilities by 2020. €42.7 million of this is expected to be invested over the period 2012-2020,
with approximately €30 million being spent domestically.
Facility Operating Costs26
In order to estimate operations and maintenance costs for Biomass CHP facilities, an average cost of
€130 per kWe per annum was applied (as per ECOFYS, 2011)27
. For the projected Biomass CHP
plants in 2020, each with a facility capacity of 1MWe, operations and maintenance is likely to cost in
the region of €130,000 per annum – or a combined cost of €1.95 million per annum. This does not
include feedstock costs, however, which are estimated below.
Feedstock Costs
For the 15 smaller biomass CHP facilities, it is estimated that they will each require an annual
average of 7,916 tonnes of biomass feedstock. This equates to 118,740 tonnes in aggregate, which it
26 Excludes feedstock costs 27
Financing Renewable Energy in the European Energy Market, European Commission January 2011.
The Economic Benefits of the Development of
Bioenergy in Ireland
21
is assumed will comprise wood chip or similar biomass based on industry feedback. On the basis that
industrial clients can obtain wood chip for €70 per tonne (inc. delivery) at 50% moisture content, 28
then approximately €8.3 million per annum will be spent on biomass fuel for these 15 CHP facilities by
2020.
Therefore, approximately €10 million per annum, excluding payroll, will be spent running the
15 Biomass CHP facilities by 2020.
Employment Generated
The job creation potential of Biomass CHP has also been assessed on the basis of industry feedback
and cross referencing these findings with typical employment intensities from other national and
international studies. This approach was necessary as it proved challenging to obtain precise
estimates of employment levels at CHP plants in Ireland, as many projects are still at the planning
stage.
Nevertheless, industry feedback suggests that typically, between 4 and 4.5 FTEs will be created per
MWe. This incorporates direct and indirect employment, including operation, maintenance and fuel
production but excludes the construction element. This is broadly consistent with the finding of the
Western Development Commission report on Biomass CHP which found that approximately 3.9 FTEs
are generated per MWe capacity.29
For the purposes of this analysis, an average figure of 4.2 FTEs
per MWe of capacity at each facility has been used. Therefore, based on a total gross electricity
capacity of 15MWe at the ‘smaller’ biomass facilities, this suggests a total employment potential of 63
FTE positions by 2020 – of which some 26 FTEs are classed as direct employment and 37 FTEs as
indirect.
In terms of estimating induced employment impacts resulting from the operation of the Biomass CHP
facilities, employment multipliers of 0.5 for induced jobs have been calculated.30
This suggests that 32
additional FTE positions will be created as a result of induced impacts on smaller biomass CHP
facilities. Therefore, total ongoing employment would be approximately 95 FTEs by 2020.
The green wood energy required to fuel 15 smaller CHP facilities would however displace alternative
fuels. It is estimated that the 28.5MWth of usable heat generated will displace the equivalent of
18,308 tonnes of oil - estimated to equate to 3 FTEs in oil delivery.31
32
In summary, once operational, the fifteen 1MWe/1.9MWth biomass CHP facilities that are
projected to come on stream by 2020 are estimated to support 95 direct, indirect and induced
permanent positions.
3.4.2 Larger Biomass CHP and Biomass to Power Facilities
Investment – Capital Costs
28
P.15 WDC Economic Impact of a Regional Wood Energy Strategy. 29 P. 33, Economic Potential Biomass CHP: Market Potential in the Western Region. 30
P. 33, Economic Potential Biomass CHP: Market Potential in the Western Region. Estimates based on Economic Impact of a Regional Wood Energy Strategy. ADAS UK Ltd Wolverhampton UK. The multipliers were stated 1.5 but have been reduced accordingly to reflect the fact that the majority of CHP technology in Ireland will be imported. We use multiplier figures 0.5. 31
For the combined heat and power facilities, there will only be displacement of oil from the usable heat generated and not from electricity. We have therefore estimated the proportion of total feedstock that is likely to generate the heat element and have worked out the displacement of oil accordingly. 32
P. 19, Economic Potential Biomass CHP: Market Potential in the Western Region. Estimates based on Economic Impact of a Regional Wood Energy Strategy. i.e. approximately 7.542 million litres of oil (6,410.5 toe) is equivalent to c. 1 FTE in distribution – this methodology has been applied throughout this document.

The Economic Benefits of the Development of
Bioenergy in Ireland
22
By 2020, it is assumed that there will be five large biomass CHP facilities as well as a small number of
biomass to power facilities operating in Ireland. On the basis of evidence from previous studies and
industry consultation, it is assumed that a biomass CHP facility with a capacity of 8MWe would have a
capital cost in the region of €28.3 million. This would imply a total investment in the five facilities of
€141.5 million by 2020. The capital cost of the biomass to power facilities is expected to be in the
region of €130 million, implying that €271.5 million in total would need to be invested in these larger
facilities by 2020. As some investment has already taken place, it is estimated that over the period
2012-2020, €243 million will be invested on these facilities, of which €170 million is expected to be
spent domestically.
Facility Operating Costs
On the basis of an average of €130 per kWe per annum for the larger Biomass CHP and power
facilities33
, operation and maintenance costs are likely to be in the region of €1.04 million per annum
for each of the five 8MWe facilities or a combined cost of €5.2 million (excluding fuel). Annual
operating costs (excluding fuel) for the biomass to power facilities are estimated at €6.5 million. This
would bring the total O&M costs (excluding fuel) at the larger biomass facilities (CHP and Power only)
to €11.7 million per annum.
Feedstock Costs
For the 5 larger biomass CHP facilities that are expected to come on stream by 2020, it is estimated
that they will each require an annual average of just over 63,000 tonnes of biomass feedstock, or
316,600 tonnes in total. For the purposes of this analysis, it is assumed that this will comprise 50%
wood chip and 50% energy crop (willow) based on discussions with industry participants. It has also
been assumed that companies can obtain wood chip for €50 per tonne (inc. delivery),34
and that
willow will cost approximately €86 per tonne (€456 per acre, annual average).35
On this basis, it is
estimated that €21.5 million per annum will be spent on fuelling the 5 larger CHP facilities by 2020.
In respect of the biomass to power facilities, the total annual feedstock requirement is expected to be
400,000 tonnes of wood chip. Assuming this can be obtained for €50 per tonne implies that €20
million could be spent on feedstock each year.
Therefore the larger biomass facilities (CHP and Power only) are estimated to spend €41.5 million per
annum on feedstock requirements, which, for the purposes of this study, has been assumed to be
sourced domestically.
Approximately €53.2 million per annum, excluding payroll, will be spent running the larger
Biomass facilities (CHP and Power only) by 2020.
Employment Generated – FTE Direct / Indirect
In estimating the potential employment impacts of the larger facilities, the same estimate of 4.2 jobs
created per MWe installed at the facility was applied. As indicated above, this incorporates all direct
and indirect employment, except for the construction element. On the basis of a total gross electricity
capacity of 95MWe at the ‘larger’ biomass facilities, this would imply 399 FTE (164 direct and 235
indirect) positions in 2020.
33
Financing Renewable Energy in the European Energy Market, European Commission January 2011. 34
Based on industry feedback. 35
These figures relate to what is paid to the farmer (though, their net income will be much lower as they have harvesting/delivery/spray/management costs also which are estimated at an annual average of €196 per acre). Some companies are offering to pay farmers approximately €406 per acre (annual average over 2 year period 2020) under willow establishment programmes. RPS has indicated elsewhere in this document that one hectare produces approximately 13 tonnes of willow each year, equivalent to 5.3 tonnes per acre.

The Economic Benefits of the Development of
Bioenergy in Ireland
23
To estimate induced jobs resulting from these facilities, the same job multipliers of 0.5 for induced
jobs was applied, as before. This implies that there is the potential for 200 FTE induced jobs to be
created as a result of induced impacts on the larger facilities.
Again these facilities would result in displacing fuels that are currently used. It is estimated that the
larger CHP facilities with the capacity to generate 76 MWth will displace the equivalent of 49,000
tonnes of oil – or 8 FTEs in oil delivery. This is subtracted from the figures outlined above to arrive at
the net employment effect.
In summary, the operation of the large scale biomass facilities is estimated to create a net 591
direct, indirect and induced jobs in 2020.
Payroll: All Biomass CHP/Power Facilities
Total payroll costs of €6.78 million per annum for all CHP facilities have been calculated using the
average industrial wage of €35,700 for each of the 190 direct FTE positions.
Construction and Installation Employment 2012-2020
It is estimated that temporary employment equivalent to 2,242 work years will be created in
construction as a result of the projected €200 million invested domestically over the period 2012-2020
in all biomass CHP and power facilities. Based on the Input-Output analysis in Appendix 3,
approximately 1,137 work years can be considered direct employment with the remaining 464
created indirectly. A further 40 work years are generated through the induced impact for every €10
million spent, which implies an additional 640 induced work years.
Table 3.6 Annual Operations Employment Impact of Biomass CHP and Power Facilities, 2020
Annual Employment Impacts Smaller facilities Larger facilities
Direct Employment 26 164
Indirect Employment 37 235
Induced Employment 32 200
Displacement Oil Distribution -3 -8
Total Employment 92 591
Table 3.7 Construction Employment Impact of Biomass CHP & power only Facilities 2012-20
Employment Impacts (work years) CHP and power only facilities
Direct Employment 1,137
Indirect Employment 464
Induced Employment 640
Total Work Years 2,242
Table 3.8 Investment in Biomass CHP/Power, €m
Representative Sizes Smaller facilities Larger facilities Total
Total Investment by 2020 53 271 324
Investment 2012-20 43 243 286
For current purposes, it has been assumed that 70%, or €200 million, of the total investment 2012-
2020 will represent imported equipment.
Summary: Economic Impacts of Biomass Heating, CHP and Power

The Economic Benefits of the Development of
Bioenergy in Ireland
24
The solid biomass sector is an extremely important component of the bioenergy industry in terms of
meeting the NREAP targets in 2020.
It is evident from Table 3.9 that some €561 million of investment in the biomass energy sector will
be needed by 2020 to achieve the baseline scenario set out in Chapter 2.36
Heat only biomass will
account for €275 million, or 49%, of this investment with CHP/power only accounting for the remaining
51%. However, as a significant proportion of the necessary capital equipment is expected to be
manufactured and assembled abroad, the overall benefit to the domestic economy of this investment
will be diminished. Of the €464 million of total investment required over the period 2012-2020, it is
estimated that 64%, or €359 million, will be spent domestically with the balance imported. Industry
feedback indicates that the domestic supply base is in its infancy at the present time, but given the
scale of the potential investment in the biomass energy sector, there are clearly opportunities for
significant import substitution.
In addition to the capital spend, there will also be significant ongoing costs associated with operating,
maintaining and fuelling the boilers and CHP facilities. Therefore, with respect to non-payroll costs, it
is estimated that approximately €212 million could be spent annually in running these facilities by
2020.
Table 3.9 Economic Impacts of Biomass Heat/CHP Facilities
Biomass Heat Only Biomass CHP/Power Total
Investment 2012-2020 €m 275.1 285.9 561
Annual Expenditure by 2020 €m 130.2 82.0 212
Annual Employment Impacts
by 2020 FTEs 589 683 1,272
One of the most important contributions of biomass energy to the Irish economy will be in terms of
employment generated. Based on our analysis earlier in this section, it has been estimated that
biomass energy could generate approximately 1,272 full-time equivalent positions in the Irish
economy by 2020. These positions will be diverse and widespread and are expected to be based in
manufacturing, retailing, agriculture, distribution, installation, marketing, maintenance and general
operations. Induced employment resulting from increased spending within the wider economy has
also been incorporated. These exclude the temporary employment generated during the construction
phase.
3.5 Power Generation: Co-firing
Introduction
Ireland has three peat-fired electricity generating stations: Edenderry Power owned by Bord na Móna,
which was commissioned in 2000; and Lough Ree Power and West Offaly Power both of which are
owned by the ESB, and which were commissioned in 2004 and 2005 respectively.
In order to mitigate the carbon emissions from peat-fired electricity, the 2007 White Paper on Energy
“Delivering a Sustainable Energy Future for Ireland” set a target for the peat stations of 30% co-firing
with biomass by 2015. This target was also included in the National Climate Change Strategy 2007-
2012.37
36
This figure includes installation costs. 37
Ireland’s National Climate Change Strategy 2007-2012. Department of the Environment, Heritage and Local
Government, 2007.
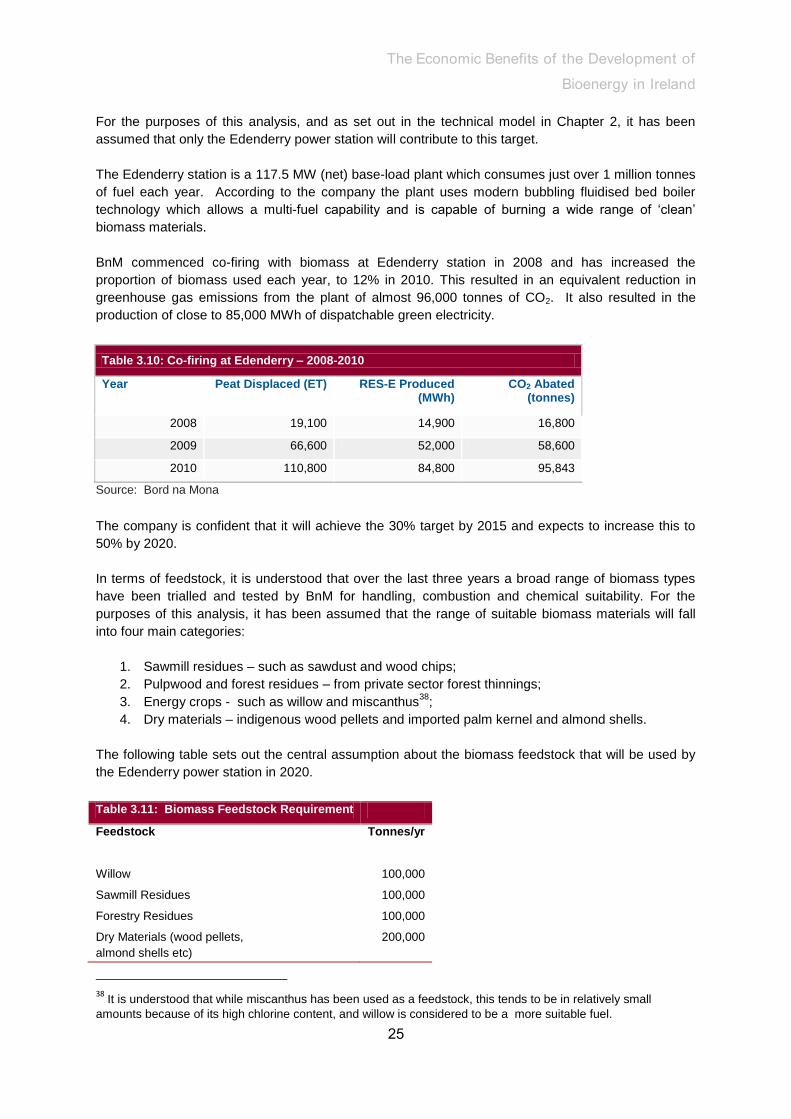
The Economic Benefits of the Development of
Bioenergy in Ireland
25
For the purposes of this analysis, and as set out in the technical model in Chapter 2, it has been
assumed that only the Edenderry power station will contribute to this target.
The Edenderry station is a 117.5 MW (net) base-load plant which consumes just over 1 million tonnes
of fuel each year. According to the company the plant uses modern bubbling fluidised bed boiler
technology which allows a multi-fuel capability and is capable of burning a wide range of ‘clean’
biomass materials.
BnM commenced co-firing with biomass at Edenderry station in 2008 and has increased the
proportion of biomass used each year, to 12% in 2010. This resulted in an equivalent reduction in
greenhouse gas emissions from the plant of almost 96,000 tonnes of CO2. It also resulted in the
production of close to 85,000 MWh of dispatchable green electricity.
Table 3.10: Co-firing at Edenderry – 2008-2010
Year Peat Displaced (ET) RES-E Produced (MWh)
CO2 Abated (tonnes)
2008 19,100 14,900 16,800
2009 66,600 52,000 58,600
2010 110,800 84,800 95,843
Source: Bord na Mona
The company is confident that it will achieve the 30% target by 2015 and expects to increase this to
50% by 2020.
In terms of feedstock, it is understood that over the last three years a broad range of biomass types
have been trialled and tested by BnM for handling, combustion and chemical suitability. For the
purposes of this analysis, it has been assumed that the range of suitable biomass materials will fall
into four main categories:
1. Sawmill residues – such as sawdust and wood chips;
2. Pulpwood and forest residues – from private sector forest thinnings;
3. Energy crops - such as willow and miscanthus38
;
4. Dry materials – indigenous wood pellets and imported palm kernel and almond shells.
The following table sets out the central assumption about the biomass feedstock that will be used by
the Edenderry power station in 2020.
Table 3.11: Biomass Feedstock Requirement
Feedstock Tonnes/yr
Willow 100,000
Sawmill Residues 100,000
Forestry Residues 100,000
Dry Materials (wood pellets,
almond shells etc)
200,000
38
It is understood that while miscanthus has been used as a feedstock, this tends to be in relatively small
amounts because of its high chlorine content, and willow is considered to be a more suitable fuel.

The Economic Benefits of the Development of
Bioenergy in Ireland
26
Total 500,000
Source: BnM.
(Note: Moisture content of feedstocks expected to be between 10% and 60%)
As indicated above, the core scenario assumes that some 300,000 tonnes of the feedstock required
to fuel the Edenderry power station will come from the domestic forestry (200,000 tonnes) and
agricultural sector (100,000 tonnes), with 200,000 tonnes being made up of imported material
(including material imported from Northern Ireland). If domestic suppliers are unable to meet these
targets, BnM has the option to increase the volumes of imported feedstock.
To facilitate its increased usage of biomass feedstocks BnM has begun to enter into long and short
term contracts for the supply of suitable forestry products and residues and dry biomass material for
power generation. In addition, and in recognition of the fact that there is likely to be a limit to the
amount of biomass that can be obtained from the Irish forest sector, BnM has launched a programme,
Farming Energy from the Land, to encourage farmers and landholders within 50 km of the Edenderry
Station to grow willow for co-firing under 20-year supply contracts. The programme is integrated with
the Department of Agriculture, Fisheries and Food’s Bioenergy Scheme, which provides grants for the
establishment of energy crops.
Under this programme, BnM will fund 50% of the establishment cost for the willow (in addition to the
DAFF grant) if the farmer wishes and will also provide technical and crop management support for the
first 4 years post planting.
For the purposes of this analysis, it has been assumed that BnM will spend some €15.5 million
annually on feedstocks in the Irish economy. This is based on an average delivered cost of €45 per
tonne for willow and other domestically sourced feedstocks39
, and a provision of €10 per tonne to
cover the domestic transport element of imported feedstocks. The actual cost of the imported wood
pellets and shells is not included as it does not contribute to the domestic economy.
Investment – Capital Costs
As indicated above, the Edenderry power station has been designed with a multi-fuel capability and
therefore, it is not expected that significant additional capital investment will be needed in the plant
itself to facilitate the switch from peat to biomass. There will, however, be a necessity for the
company to invest in biomass storage and handling facilities, though this is expected to be relatively
modest – estimated to be in the region of €5 million in total. The direct, indirect and induced impacts
of this expenditure are estimated using the CSO Input-Output Tables as outlined in Appendix 3.
Facility Operating Costs
In relation to the ongoing operating and maintenance costs too, and based on industry feedback, it is
assumed that there will be no change in these overall costs as a result of the switch from peat to
biomass.
Employment Generated
While some temporary construction employment will be created as a result of the investment in
constructing new storage and handling facilities at Edenderry, the direct employment impacts within
BnM are expected to be minimal as a result of the substitution of peat by biomass. Indeed, based on
industry feedback, it has been assumed that there will be no net new jobs created or jobs lost
within BnM as a result of the switch.
39
Based on an ex-gate price of €35 per tonne and transport cost of €10 per tonne.

The Economic Benefits of the Development of
Bioenergy in Ireland
27
The most significant impact of the development of biomass co-firing is expected to be on the supply
industries. For example, Bord na Móna expects that approximately 5,000 hectares of land will need to
be planted to meet its targets. At an average establishment cost of c. €2,600/ha for willow, the total
cost of planting to meet BnM’s requirements is, therefore, expected to be in the region of €13 million.
Based on figures contained in the ECOTEC study on employment intensity within the EU, the direct
employment impacts per €1 million investment for fuel production energy crops is estimated to be 11
FTEs - including the labour required for cultivation. On this basis, therefore, then the labour input
would be 143 FTEs.
In addition, it is estimated that some 200,000 tonnes of forestry residue will be required each year –
on the basis of 0.21 FTE per 1,000 tonnes of wood chip (used in relation to the biomass CHP
facilities), then this would suggest an employment impact of 42 FTE.
Table 3.12 : Co-firing: Summary of Key Economic Indicators 2020
Key Indicators
Number of Facilities 1
Feedstock Capacity (Biomass) 500,000
Gross Electricity Capacity 117.5 MWe
Biomass Share 50%
Bioenergy Electricity Net Output (MWe) 58.75
Bioenergy Contribution to RES-E (MWh) 434,750
Bioenergy Contribution to RES-E (ktoe) 37.4
Total Investment €5 million
Direct Impact €2 million
Direct and Indirect Impact €4 million
Direct, Indirect and Induced Impact €6 million
O&M Expenditure per annum – net change €0 million
Feedstock (Domestic) €15.5 million
Employment
Construction Phase
Direct Employment 29
Direct and Indirect Employment 40
Direct, Indirect and Induced Employment 56
Operations – Net Change 0
Indirect – Feedstock Supply 185
Direct, Indirect and Induced 278
3.6 Waste to Energy
The scenario outlined in Chapter 2 assumes that there will be two Waste to Energy (WtE) facilities in
operation in Ireland by 2020. These are Carranstown, Co. Meath, where Indaver is set to commence
operation of a 200,000 tonne capacity plant, and Poolbeg in Dublin, which will have a capacity of
600,000 tonnes when operational (currently estimated to be the end 2014). In line with the SEAI
Energy Forecast to 2020 it is not expected that any more facilities of this scale will be in a position to

The Economic Benefits of the Development of
Bioenergy in Ireland
28
contribute to the 2020 targets. These facilities will recover energy predominantly from Municipal Solid
Waste and it is assumed that 65% of the energy produced by the facilities will come from biomass.40
Investment – Capital Costs
According to published information, these two facilities, which will have a combined capacity of over
800,000 tonnes of MSW a year, will involve capital investment of €515 million. Given the nature and
scale of these facilities, a significant proportion of this expenditure will go to foreign based technical
and engineering contractors and capital equipment suppliers. Nevertheless, based on feedback from
industry experts, it is estimated that at least 40% or €206 million would find its way into the Irish
economy through payments to domestically based contractors and suppliers. As the bulk of the
investment in the Carranstown facility has already taken place, estimates for the likely investment in
WtE for the period from now to 2020 have also been shown separately. The direct, indirect and
induced impacts of this spend on the domestic economy are shown in Table 3.16. These estimates
are based on the CSO latest Input-Output Tables for Construction Expenditure as set out in Appendix
3.
Facility Operating Costs
While it has not been possible to arrive at precise estimates for the scale of the annual running costs
likely to be incurred by the WtE facilities in Meath and Dublin, figures from an EU report on Financing
Renewable Energy in the European Energy Market41
suggests that the typical O&M costs for a waste
incineration plant is likely to be between €145-249 per kWe per annum and €172 and €250 per kWe
for a waste incineration plant with CHP. On the basis of an installed capacity of 60 MWe for the
Ringsend plant (with CHP) and an average O&M cost of €210 per kWe, and 22 MWe installed
capacity at the Carranstown plant and an average O&M cost of €200 per kWe, this would imply a
potential total spend on O&M costs of close to €17 million each year.
Based on industry feedback, it is estimated that the vast majority of this spending (at least 80% or
€13.6 million) would remain in the local economy. The direct, indirect and induced impacts of this
spend on the domestic economy is shown in Table 3.14, again drawing on figures contained in the
CSO’s latest Input-Output Tables.42
Employment Generated – FTE Direct / Indirect
During construction, it is estimated that on average some 500 FTE will be employed in all aspects of
the two WtE projects43
– with construction in both instances lasting for between 2 and 3 years. Again,
a significant proportion of these will be locally based suppliers with specialist input from international
contractors. However, as the construction of the Carranstown facility has largely been completed,
estimates for construction employment for the period from 2012 to 2020 have also been shown
separately. Table 3.16 shows the estimated direct, indirect and induced employment effects based on
the estimated domestic share of the capital spend on the WtE facilities. The approach adopted, which
is based on standard civil engineering projects, is set out in Appendix 3.
40 For the purposes of this analysis, the full costs of constructing and operating these facilities, as well as the full
employment impacts have been taken into account, even though energy production from biomass is only part,
albeit a central part, of the plants overall function.
41 http://ec.europa.eu/energy/renewables/studies/doc/renewables/2011_financing_renewable.pdf 42
The I/O estimates for the electricity and gas sector have been used for the WtE facilities. It should be noted, however, that the direct, indirect and induced effects have been calculated on the basis of estimated annual operating costs rather than turnover – and therefore, once fully operational, these impacts are likely to be even greater. 43
This is an average estimate based on feedback from industry experts and publicly available information. It was noted that construction employment could be significantly higher during certain phases of the construction project, but would average out to 500 FTE per year for the duration of the projects.
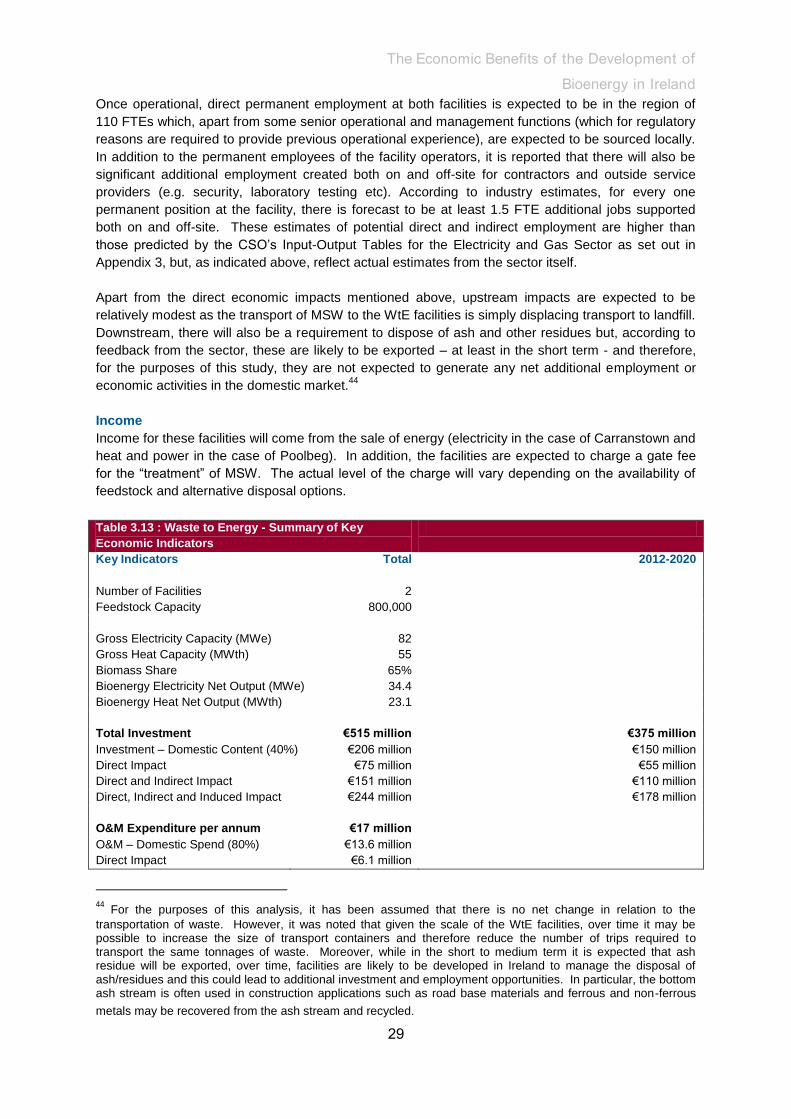
The Economic Benefits of the Development of
Bioenergy in Ireland
29
Once operational, direct permanent employment at both facilities is expected to be in the region of
110 FTEs which, apart from some senior operational and management functions (which for regulatory
reasons are required to provide previous operational experience), are expected to be sourced locally.
In addition to the permanent employees of the facility operators, it is reported that there will also be
significant additional employment created both on and off-site for contractors and outside service
providers (e.g. security, laboratory testing etc). According to industry estimates, for every one
permanent position at the facility, there is forecast to be at least 1.5 FTE additional jobs supported
both on and off-site. These estimates of potential direct and indirect employment are higher than
those predicted by the CSO’s Input-Output Tables for the Electricity and Gas Sector as set out in
Appendix 3, but, as indicated above, reflect actual estimates from the sector itself.
Apart from the direct economic impacts mentioned above, upstream impacts are expected to be
relatively modest as the transport of MSW to the WtE facilities is simply displacing transport to landfill.
Downstream, there will also be a requirement to dispose of ash and other residues but, according to
feedback from the sector, these are likely to be exported – at least in the short term - and therefore,
for the purposes of this study, they are not expected to generate any net additional employment or
economic activities in the domestic market.44
Income
Income for these facilities will come from the sale of energy (electricity in the case of Carranstown and
heat and power in the case of Poolbeg). In addition, the facilities are expected to charge a gate fee
for the “treatment” of MSW. The actual level of the charge will vary depending on the availability of
feedstock and alternative disposal options.
Table 3.13 : Waste to Energy - Summary of Key
Economic Indicators
Key Indicators Total 2012-2020
Number of Facilities 2
Feedstock Capacity 800,000
Gross Electricity Capacity (MWe) 82
Gross Heat Capacity (MWth) 55
Biomass Share 65%
Bioenergy Electricity Net Output (MWe) 34.4
Bioenergy Heat Net Output (MWth) 23.1
Total Investment €515 million €375 million
Investment – Domestic Content (40%) €206 million €150 million
Direct Impact €75 million €55 million
Direct and Indirect Impact €151 million €110 million
Direct, Indirect and Induced Impact €244 million €178 million
O&M Expenditure per annum €17 million
O&M – Domestic Spend (80%) €13.6 million
Direct Impact €6.1 million
44
For the purposes of this analysis, it has been assumed that there is no net change in relation to the
transportation of waste. However, it was noted that given the scale of the WtE facilities, over time it may be possible to increase the size of transport containers and therefore reduce the number of trips required to transport the same tonnages of waste. Moreover, while in the short to medium term it is expected that ash residue will be exported, over time, facilities are likely to be developed in Ireland to manage the disposal of ash/residues and this could lead to additional investment and employment opportunities. In particular, the bottom ash stream is often used in construction applications such as road base materials and ferrous and non-ferrous
metals may be recovered from the ash stream and recycled.

The Economic Benefits of the Development of
Bioenergy in Ireland
30
Direct and Indirect Impact €10.4 million
Direct, Indirect and Induced Impact €16.7 million
C&I Employment (Total Work Years)
Direct Employment (Domestic) 1,174 855
Direct and Indirect Employment 1,648 1,200
Direct, Indirect and Induced Employment 2,307 1,680
Operations
Direct Employment 110
Direct and Indirect Employment 275
Direct, Indirect and Induced Employment 706

The Economic Benefits of the Development of
Bioenergy in Ireland
31
3.7 Anaerobic Digestion (AD)
“The use of agricultural material such as manure, slurry and other animal and organic waste for
biogas production has, in view of the high greenhouse gas emissions saving potential, significant
environmental advantages in terms of heat and power production and its use as a biofuel. Biogas
installations can, as a result of their decentralised nature and the regional investment structure,
contribute significantly to sustainable development in rural areas and offer farmers new income
opportunities.”
EU Directive 2009/28/EC on the Promotion of the Use of Energy from Renewable Sources45
Biogas is produced when feedstocks, such as organic wastes (agricultural and municipal), and energy
crops, such as grass silage, are converted into biogas using anaerobic digestion technology. Ireland
has significant potential for biogas feedstocks in the form of by-products and waste from municipal,
agricultural and industrial sources as well as the potential for growing agricultural energy crops such
as grass and maize silage. In 2010, for example, it is estimated that Ireland produced almost 35
million tonnes of farm slurries which required management, 0.4 million tonnes of slaughter waste and
0.8 million tonnes of organic household waste suitable for anaerobic digestion46
. Currently, the vast
majority of the slurries are disposed of by land spreading – which has become more difficult due to
tighter environmental legislation. In addition, Ireland has significant unexploited resource potential in
the form of grass, with 91% of agricultural land, or 3.9 million hectares, being used to grow this
potential energy crop.47
To date, however, the growth in the Irish AD sector has been limited. There are currently 5 on-farm
digesters in operation along with a number of industrial and municipal facilities. However, industry
sources indicate that there are potentially in the region of 25 AD projects in various stages of
development in Ireland (though a number have been moth-balled pending a decision on REFIT III)
and for the purposes of the current study, it has been assumed that a significant number of new
facilities will be in place by 2020.
While it is recognised that the size of a biogas facility needs to be designed and adapted to meet
individual requirements, particularly the availability of feedstock materials in close proximity to the
facility48
, in order to estimate the potential economic impacts of the sector, it is necessary to base the
analysis on some “standard” facilities. For these purposes, a number of different types of “standard”
AD facilities have been considered, namely:
Small on-farm
Medium on-farm
Large on-farm
Large off-farm/Centralised AD
Biomethane – Large on-farm
Biomethane – Centralised AD / Large off-farm
Municipal Sewage AD
Landfill Gas – Small
Landfill Gas – Large
45
http://eur-lex.europa.eu/LexUriServ/LexUriServ.do?uri=OJ:L:2009:140:0016:0062:en:PDF 46 Jerry Murphy, IEA presentation, November 2010. 47
Bord Gáis Report: The Future of Renewable Gas in Ireland. 48
AEBIOM: A Biogas Roadmap for Europe.

The Economic Benefits of the Development of
Bioenergy in Ireland
32
As shown below, the central assumption is that there will need to be some 103 on and off-farm
facilities in operation by 2020, in addition to the existing and planned municipal and sewage and
landfill gas facilities. This represents a substantial increase from the numbers currently in
operation/planning. Nevertheless, this ambitious target would need to be achieved if biogas is to
make a significant contribution to meeting the 2020 RED targets.
The following table summarises the core assumptions for each of these types of facility.
Table 3.14 Core Assumptions of AD facilities
Feedstock
Feedstock
Tonnes per
annum
No. Of
facilities
Electricity
Output
MWe per
unit
Heat
Output
MWth per
unit
Hours of
Operation
Small On-
farm
50% slurry
50% grass silage
22,000 30 0.25 0.25 7,500
Medium On-
farm
50% slurry
50% grass silage
45,000 30 0. 5 0. 5 7,500
Large On-
farm
33% slurry
33% grass silage
33% OFMSW*/Food
waste
60,000 10 1 1 7,500
Large Off-
farm
50% ABP†
50% OFMSW
40,000 4 1 1 7,500
Biomethane
Biomethane
– Large On-
farm
58% grass silage
42% silage
50,000 5 7,500
Biomethane
– Large Off-
farm
50% ABP
50% OFMSW/Food
waste
50,000 5 7,500
Municipal
Municipal
Sewage AD
WWTP‡ – Onsite
Waste Water
215,000 4 1 1 7,500
Landfill Gas
-Small
On-site landfill 10 1.5 4,000
Landfill Gas
-Small
On-site landfill 5 5 4,000
*OFMSW: Organic Fraction of Municipal Solid Waste; †ABP: Animal By-Products; ‡WWTP: Waste Water
Treatment Plant.
Source: RPS
Economic Impacts
The following table summarises the findings on the potential economic impact of these projected
facilities in terms of output, employment, investment etc. Again, it should be stressed that while it is
recognised that both capital and operating costs will vary significantly from AD facility to AD facility
depending on the technology used, the feedstocks available, tonnages, ease of grid connection etc,49
49 For example, according to Teagasc, costs will depend on digester volume, CHP capacity (kWe), pumps,
mixers, flare, heat exchanger within the digester, grid connection, earthworks, civil works, engineering, planning, automation, visualisation, pre-mixing well, dry matter input, fluid matter input, sanitation/ disinfection tank may be required in some situations, silo and manure bag storage volume, weighbridge, feeding system, separator, sorting system, biogas storage volume, insulation type, return heat pipes and other equipment such as gas cooling and cleaning (desulphurisation, condensate trap), leak detector. (Barry Caslin, Teagasc, in “Financing an AD Project”; Farmers Journal, 17 October 2009.)

The Economic Benefits of the Development of
Bioenergy in Ireland
33
it has, nevertheless, been necessary to use average or “typical” numbers to enable overall economic
impacts to be estimated.
Table 3.15: On/Off Farm AD/Biomethane Facilities
Key Assumptions Per Unit Total
Small On-farm AD
Number of Facilities 30
Feedstock Capacity (tonne) 22,000 660,000
Grass Silage (50%) 11,000 330,000
Slurry (50%) 11,000 330,000
Bioenergy Output (MWe) 0.25 7.50
Bioenergy Output (MWth) 0.25 7.50
Bioenergy Contribution to RES-E (ktoe) 4.8
Bioenergy Contribution to RES-H (ktoe) 4.8
Investment Costs €1.25 million €37.5 million
Annual Operation and Maintenance Costs (7%) €0.09 million €2.62 million
Direct Employment – O&M 1 30
Medium On-farm AD
Number of Facilities 30
Feedstock Capacity (tonne) 45,000 1,350,000
Grass Silage (50%) 22,500 675,000
Slurry (50%) 22,500 675,000
Bioenergy Output (MWe) 0.5 15.0
Bioenergy Output (MWth) 0.5 15.0
Bioenergy Contribution to RES-E (ktoe) 9.7
Bioenergy Contribution to RES-H (ktoe) 9.7
Investment Costs €2.5 million €75 million
Annual Operation and Maintenance Costs (7%) €175,000 €5.25 million
Direct Employment – O&M 2 60
Large On-Farm AD
Number of Facilities 10
Feedstock Capacity (tonne) 60,000 600,000
Grass Silage (33%) 20,000 200,000
OFMSW/food waste (33%) 20,000 200,000
Slurry (33%) 20,000 200,000
Bioenergy Output (MWe) 1.0 10
Bioenergy Output (MWth) 1.0 10
Bioenergy Contribution to RES-E (ktoe) 6.5
Bioenergy Contribution to RES-H (ktoe) 6.5
Investment Costs €5.0 million €50.0 million
Operation and Maintenance (7%) €350,000 €3.5 million
Direct Employment – O&M 4 40

The Economic Benefits of the Development of
Bioenergy in Ireland
34
Large Off-farm AD
Number of Facilities 4
Feedstock Capacity (tonne) 40,000 160,000
ABP (50%) 20,000 80,000
Separated MSW (50%) 20,000 80,000
Bioenergy Output (MWe) 1.0 4.0
Bioenergy Output (MWth) 1.0 4.0
Bioenergy Contribution to RES-E (ktoe) 2.6
Bioenergy Contribution to RES-H (ktoe) 2.6
Investment Costs €15 million €60.0 million
Annual Operation and Maintenance Costs (7%) €1.05 million €4.2 million
Direct Employment – O&M 6 24
Large On-Farm - Biomethane
Number of Facilities 5
Feedstock Capacity (tonne) 50,000 250,000
Grass Silage (58%) 29,000 145,000
Slurry (42%) 21,000 105,000
Bioenergy Contribution to RES-H (ktoe) 9.0
Investment Costs €7.0 million €35 million
Annual Operation and Maintenance Costs (7%) €490,000 €2.45 million
Direct Employment – O&M 4 20
Large Off-farm - Biomethane
Number of Facilities 5
Feedstock Capacity (tonne) 50,000 250,000
ABP (50%) 25,000 125,000
OFMSW/Food waste (50%) 25,000 125,000
Bioenergy Contribution to RES-H (ktoe) 18.8
Investment Costs €15 million €75 million
Annual Operation and Maintenance Costs (7%) €1.05 million €5.25 million
Direct Employment – O&M 6 30
Key Assumptions:
The following section sets out the key assumptions underlying the estimates contained in the table
above. As indicated earlier, the central scenario assumes that there will be a number of different AD
facilities of various sizes and scale and using a variety of different feedstocks operating in Ireland by
2020.
Investment Costs
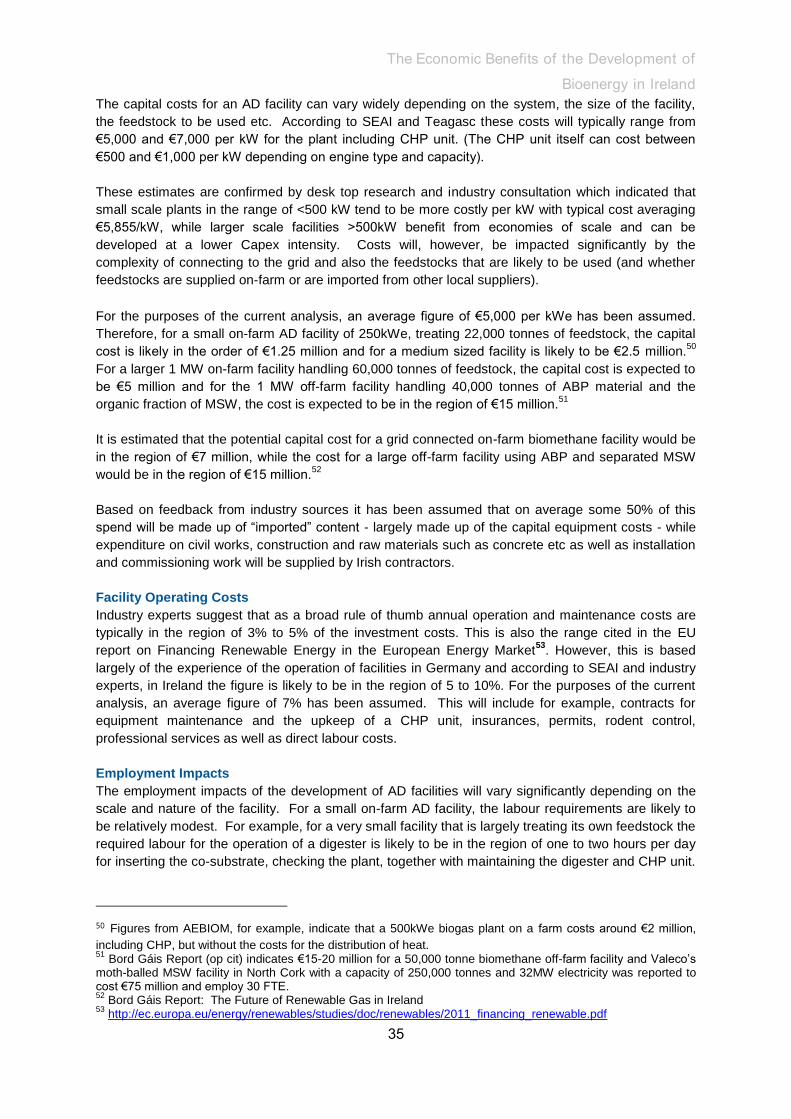
The Economic Benefits of the Development of
Bioenergy in Ireland
35
The capital costs for an AD facility can vary widely depending on the system, the size of the facility,
the feedstock to be used etc. According to SEAI and Teagasc these costs will typically range from
€5,000 and €7,000 per kW for the plant including CHP unit. (The CHP unit itself can cost between
€500 and €1,000 per kW depending on engine type and capacity).
These estimates are confirmed by desk top research and industry consultation which indicated that
small scale plants in the range of <500 kW tend to be more costly per kW with typical cost averaging
€5,855/kW, while larger scale facilities >500kW benefit from economies of scale and can be
developed at a lower Capex intensity. Costs will, however, be impacted significantly by the
complexity of connecting to the grid and also the feedstocks that are likely to be used (and whether
feedstocks are supplied on-farm or are imported from other local suppliers).
For the purposes of the current analysis, an average figure of €5,000 per kWe has been assumed.
Therefore, for a small on-farm AD facility of 250kWe, treating 22,000 tonnes of feedstock, the capital
cost is likely in the order of €1.25 million and for a medium sized facility is likely to be €2.5 million.50
For a larger 1 MW on-farm facility handling 60,000 tonnes of feedstock, the capital cost is expected to
be €5 million and for the 1 MW off-farm facility handling 40,000 tonnes of ABP material and the
organic fraction of MSW, the cost is expected to be in the region of €15 million.51
It is estimated that the potential capital cost for a grid connected on-farm biomethane facility would be
in the region of €7 million, while the cost for a large off-farm facility using ABP and separated MSW
would be in the region of €15 million.52
Based on feedback from industry sources it has been assumed that on average some 50% of this
spend will be made up of “imported” content - largely made up of the capital equipment costs - while
expenditure on civil works, construction and raw materials such as concrete etc as well as installation
and commissioning work will be supplied by Irish contractors.
Facility Operating Costs
Industry experts suggest that as a broad rule of thumb annual operation and maintenance costs are
typically in the region of 3% to 5% of the investment costs. This is also the range cited in the EU
report on Financing Renewable Energy in the European Energy Market53
. However, this is based
largely of the experience of the operation of facilities in Germany and according to SEAI and industry
experts, in Ireland the figure is likely to be in the region of 5 to 10%. For the purposes of the current
analysis, an average figure of 7% has been assumed. This will include for example, contracts for
equipment maintenance and the upkeep of a CHP unit, insurances, permits, rodent control,
professional services as well as direct labour costs.
Employment Impacts
The employment impacts of the development of AD facilities will vary significantly depending on the
scale and nature of the facility. For a small on-farm AD facility, the labour requirements are likely to
be relatively modest. For example, for a very small facility that is largely treating its own feedstock the
required labour for the operation of a digester is likely to be in the region of one to two hours per day
for inserting the co-substrate, checking the plant, together with maintaining the digester and CHP unit.
50 Figures from AEBIOM, for example, indicate that a 500kWe biogas plant on a farm costs around €2 million,
including CHP, but without the costs for the distribution of heat. 51
Bord Gáis Report (op cit) indicates €15-20 million for a 50,000 tonne biomethane off-farm facility and Valeco’s moth-balled MSW facility in North Cork with a capacity of 250,000 tonnes and 32MW electricity was reported to cost €75 million and employ 30 FTE. 52
Bord Gáis Report: The Future of Renewable Gas in Ireland 53
http://ec.europa.eu/energy/renewables/studies/doc/renewables/2011_financing_renewable.pdf

The Economic Benefits of the Development of
Bioenergy in Ireland
36
However, the labour requirement is likely to increase to at least 5 hours per day54
for the scale of
small on-farm facility envisaged here – and would be even greater if the farmer is also importing
feedstock from external suppliers as this will increase the amount of time involved in organising
logistics and handling and recording incoming feedstocks etc. If one were to assume, for example, an
average labour input of at least 5 hours per day or 1 FTE. For the medium-sized facility, and based
on industry feedback, it was felt that 2 FTE would be needed to operate a facility of this type and
scale.
Larger facilities will benefit from significant economies of scale and therefore, the estimated labour
input will depend largely on the type and source of feedstock used. According to industry experts55
,
for example, the labour input for a 50,000 tonne on farm biomethane plant is likely to be 3 to 4 FTEs
(i.e. a plant manager, lab technician and two loader drivers). This figure has also been used for the
on-farm AD facility of a similar scale. For the larger off-farm facilities, it has been assumed that the
labour requirement will be 6 FTEs.56
Employment during the construction and installation phase has been estimated based on a previous
ECOTEC study undertaken for the EU. This indicated 7.5 FTE per €1 million of capital investment
which is broadly consistent with Irish statistics from the Construction Industry Council on employment
creation for construction projects (Appendix 3). On the basis of a total capital investment of €332.5
million then this would imply total C&I employment of almost 2,500 work years if the 2020 scenario is
achieved. It should be noted, however, that not all of these jobs will accrue to workers based in
Ireland as large items of plant will be imported and installed by the suppliers’ staff. On the basis of
the assumed domestic content of the capital spend on these facilities, then approximately half of this
employment would accrue to workers in Ireland i.e. 1,250 work years.
Feedstocks
As indicated elsewhere, a very wide range of materials can be used as a feedstock for an AD facility.
Biogas yields per tonne will vary significantly depending on the type of feedstock. Maize silage has
amongst the highest biogas yields, followed by rye and grass silage, while liquid pig and cattle
manure have the lowest – reflecting the very high water content (and should therefore be processed
close to where they are produced to minimise transportation costs).
For the purpose of this study a range of different feedstocks has been assumed – from farm slurries
to grass silage as well as animal by-products, food wastes and separated municipal solid wastes. It is
understood that each facility has to be designed and constructed for the particular feedstocks and
while it is possible to alter the “mix” to a certain degree, it is not possible to switch feedstocks
completely once the facility is up and running.
Table 3.16: AD Feedstocks
Feedstocks Tonnages
Slurry 1,350,000
Grass Silage 1,310,000
OFMSW/Food waste 405,000
ABP 205,000
54
SEAI estimate. 55
See for example, estimates produced by Jerry Murphy in Bord Gáis Report 56
These figures draw on a number of planning applications. They also include estimates produced for the moth-balled Valeco facility, where it was estimated that 30 FTE would be needed to operate a facility handling 250,000 tonnes of MSW per year would also equate to 6 FTE for 50,000.

The Economic Benefits of the Development of
Bioenergy in Ireland
37
In the case of the on-farm facilities, silage grass is assumed to be an important feedstock. On this, it
is estimated that 1,310,000 tonnes of grass silage each year would be required - at a cost of €25
tonnes or €32.75 million in total.
Income Generation
For facilities that are taking in feedstocks from outside suppliers a gate fee may be obtained – this is
reported to range from between €20 and €70 per tonne on-farm depending on the actual feedstock
used and €40-120 per tonne off-farm. These facilities, therefore, have the potential to become an
important alternative income stream for operators. If for example, it is assumed that an average gate
fee of €50 per tonne could be achieved (with slurries assumed to be free) based on the tonnages
assumed, then this would be equivalent to an income of over €15 million annually – if it is assumed
that half of the waste processed is “imported” onto the site (i.e. 610,000 tonnes by 50% at €50 per
tonne).
It should be noted, however, that while these gate fees may be achieved in the short run, there is a
concern that with over 80 facilities of all sizes plus other facilities such as the planned waste to energy
plants, the supply of feedstocks could come under pressure as has happened in other countries and
gate fees could fall sharply or indeed, may no longer be achievable.
In addition to possible income from gate fees, AD facilities such as those envisaged will also generate
income from the sale of electricity to the national grid. At the present time, the proposed tariff under
REFIT III for an AD CHP facility of less than 500 KWe is €0.15 per kWh.
The core scenario set out in Chapter 2 also envisages the operation of 10 on and off-farm biomethane
plants by 2020. As indicated above, where biogas is used in electricity production, these facilities
benefit from a feed-in tariff under Ireland’s REFIT scheme. Biomethane, however, would not directly
benefit from this tariff and would have to rely instead on the sale of the gas at market rates.57
The AD facility will also produce residual heat which can result in significant savings on site. Again
this will vary from facility to facility, and it is likely that not all of the residual heat produced by the CHP
unit can be used, owing to variation in heat demand during the year. 58
59
Summary – On/Off Farm AD/Biomethane
The following table summarises the key economic impacts of the development of the on and off-farm
biogas and biomethane sector of the size and scale of that envisaged in Chapter 2 (LFG and sewage
gas is covered separately).
In addition to the direct impacts of investment in the sector, indirect and induced impacts have also
been calculated based on figures contained in the CSO’s Input-Output tables for the Irish economy.
57
Bord Gáis Report 58 Based on discussions with industry experts, it is assumed that just 5% of the heat is considered to be “useful”
heat for the smaller AD facilities, rising to 25% for larger facilities. 59
It is also recognised that the AD process will produces digestate which can be used as a fertilizer but no
attempt has been made to value this as a replacement for traditional fertilizers. It is understood that the quality of
the output material will depend on the feedstock used in the digestion process - the output material can either be
used as digestate, compost, or a stabilised biowaste. Stabilised biowaste has limited outlets and generally will
attract a disposal cost and possibly, the landfill levy. Digestate and compost are both useable products, with
potential markets in horticulture, agriculture, land remediation, forestry, biofilters, acoustic barriers, landfill
cover/capping etc.
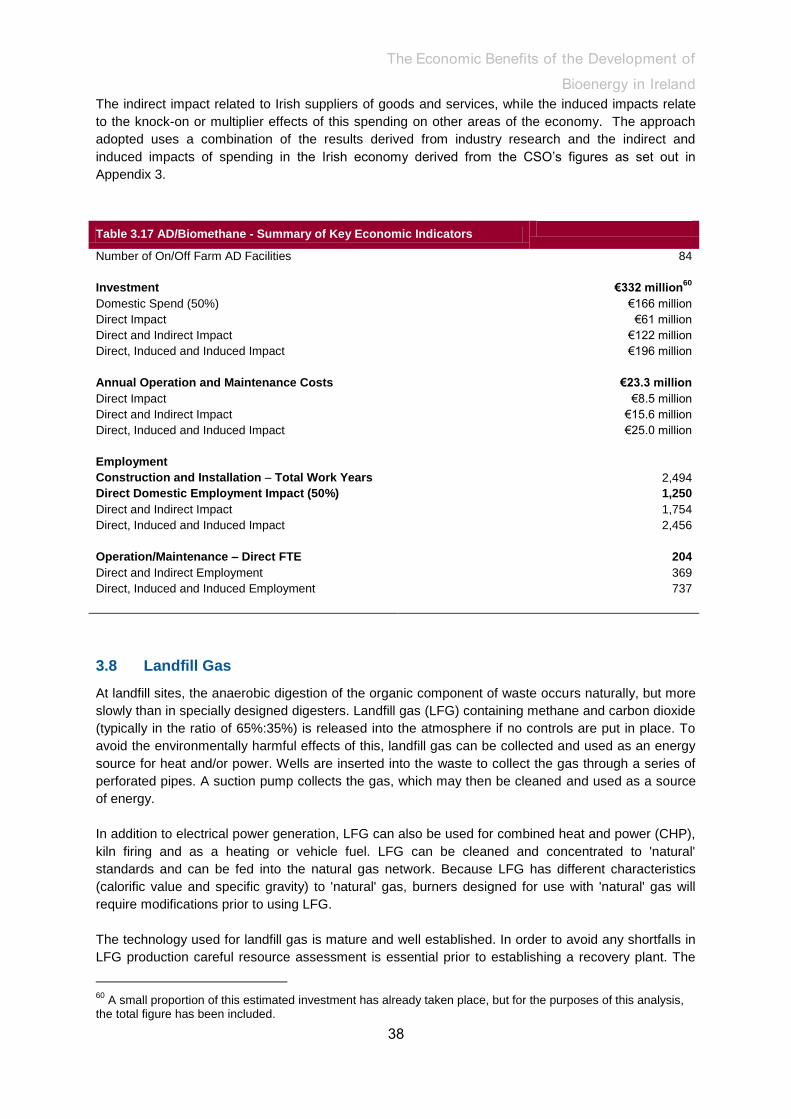
The Economic Benefits of the Development of
Bioenergy in Ireland
38
The indirect impact related to Irish suppliers of goods and services, while the induced impacts relate
to the knock-on or multiplier effects of this spending on other areas of the economy. The approach
adopted uses a combination of the results derived from industry research and the indirect and
induced impacts of spending in the Irish economy derived from the CSO’s figures as set out in
Appendix 3.
Table 3.17 AD/Biomethane - Summary of Key Economic Indicators
Number of On/Off Farm AD Facilities 84
Investment €332 million60
Domestic Spend (50%) €166 million
Direct Impact €61 million
Direct and Indirect Impact €122 million
Direct, Induced and Induced Impact €196 million
Annual Operation and Maintenance Costs €23.3 million
Direct Impact €8.5 million
Direct and Indirect Impact €15.6 million
Direct, Induced and Induced Impact €25.0 million
Employment
Construction and Installation – Total Work Years 2,494
Direct Domestic Employment Impact (50%) 1,250
Direct and Indirect Impact 1,754
Direct, Induced and Induced Impact 2,456
Operation/Maintenance – Direct FTE 204
Direct and Indirect Employment 369
Direct, Induced and Induced Employment 737
3.8 Landfill Gas
At landfill sites, the anaerobic digestion of the organic component of waste occurs naturally, but more
slowly than in specially designed digesters. Landfill gas (LFG) containing methane and carbon dioxide
(typically in the ratio of 65%:35%) is released into the atmosphere if no controls are put in place. To
avoid the environmentally harmful effects of this, landfill gas can be collected and used as an energy
source for heat and/or power. Wells are inserted into the waste to collect the gas through a series of
perforated pipes. A suction pump collects the gas, which may then be cleaned and used as a source
of energy.
In addition to electrical power generation, LFG can also be used for combined heat and power (CHP),
kiln firing and as a heating or vehicle fuel. LFG can be cleaned and concentrated to 'natural'
standards and can be fed into the natural gas network. Because LFG has different characteristics
(calorific value and specific gravity) to 'natural' gas, burners designed for use with 'natural' gas will
require modifications prior to using LFG.
The technology used for landfill gas is mature and well established. In order to avoid any shortfalls in
LFG production careful resource assessment is essential prior to establishing a recovery plant. The
60
A small proportion of this estimated investment has already taken place, but for the purposes of this analysis, the total figure has been included.

The Economic Benefits of the Development of
Bioenergy in Ireland
39
landfill site must be evaluated in relation to size, location, composition of waste, age and estimated
tonnage. The rate of LFG production can then be calculated using computer models.
The size of LFG facilities are defined by the amount of waste that was/can be accepted at the landfill
and there is, therefore, a finite number of landfill gas opportunities in Ireland. Moreover, given the EU
and national legislative and policy framework61
(including the European Waste Directive) which is
aimed at discouraging the land filling of organic waste and also the potential impact on the volumes of
waste being landfilled as other facilities, such as the planned Waste to Energy plants, come on
stream, it is assumed that the bioenergy potential from landfill gas will not increase over the coming
years.62
The All Ireland Grid Study (ESBI, 2008) concluded that there would be a total of 37.4 MWe available
from landfill gas by 2020 in the Republic of Ireland. This would be established through approximately
15 landfill sites with a capacity of 1.0 – 9.4 MWe.
Table 3.18: LFG Installed Capacity
Name Status Installed Capacity MW
Corranure Closing 2010 circa 1 MW 2008-20 1
Ballyduff Circa 1MW 1
Kinsale Rd. 2 x 1MW operational 2
Ballyogan 2 x 1MW operational 2
Dunsink 1 x 1.2MW operational 1.2
Balleally 5 x 1MW 5
Carrowbrowne Closed 2001 – 1MW from 2008 1
Kilconnell E. Galway (2005) Greenstar – 1MW from 2010 1
Silliot Hill 1 x 1.2 MW operational 1.2
KTK (1999) 2 x 1.2MW operational 1.2 MW o/s 2.4
Usk (2008) 1.5 MW circa 2010 1.5
Arthurstown 5 x1.4MW, 2x 1.2MW operational 9.4
Gortadroma 1.8MW 1.8
Knockharley Greenstar C – 1MW 2007-8 5.4
Ballinagran Greenstar – 1.5MW 2010 1.5
Total 37.4 MWe
Source: Adapted from the All Ireland Grid Study – ESBI, 2008
Current active landfill facilities and their annual tonnages are identified below.
61
In order to meet the EU Landfill Directive, Ireland needs to deliver waste infrastructure to divert 900,000 tonnes per annum of biodegradable municipal waste from landfill by 2016. 62
Industry sources also noted that the delay in agreeing REFIT II levels is having a damaging impact on
investment within the sector as without a guaranteed price for the energy produced from the facilities, financiers
are unwilling to provide funding to invest in the sector – indeed, in a number of instances, operators are simply
flaring the gas as without REFIT it is not commercially viable to use the gas to generate electricity.

The Economic Benefits of the Development of
Bioenergy in Ireland
40
Table 3.19: Active Landfill Sites
Waste License No. FACILITY
Total Tonnage waste
accepted per annum
(tpa)
W0001-04 Kerry North Landfill 77,000
W0017-04 Gortadroma Landfill 130,000
W0020-02 Scotch Corner Landfill 39,500
W0021-02 Derrinumera Landfill 40,000
W0024-04 Ballynacarrick Landfill 35,000
W0025-03 Powerstown Landfill 40,000
W0026-03 Kyletalesha Landfill 47,100
W0029-04 Derryclure Landfill 100,000
W0060-03 Whiteriver Landfill 96,000
W0066-03 Rampere Landfill 50,000
W0067-02 Rathroeen Landfill 44,600
W0068-03 Youghal Landfill 170,000
W0074-03 Donohill Landfill 40,000
W0077-03 Corranure Landfill 45,000
W0078-03 Ballaghveny Landfill 49,000
W0109-02 Inagh Landfill 56,500
W0146-02 Knockharley Landfill 175,000
W0165-02 Ballynagran Landfill 175,000
W0178-02 East Galway Landfill 100,000
W0191-02 Holmestown 80,000
W0201-03 Drehid Landfill 360,000
1,949,700
Source: RPS Map of Active Waste Facilities
For the purposes of the current study, therefore, the Consultants have assumed a total number of
LFG facilities of 15, comprising 10 small and 5 large sites as outlined in the table above.
Economic Impacts
The direct economic impacts of the LFG sector are expected to be relatively modest over the period
to 2020 as the bulk of investment has already taken place.
Investment Costs
Industry sources noted that the capital costs of LFG facilities can vary widely depending on the
system, the size of the facility etc. The cost of connection to the electricity grid is considered to be a
key factor in determining the commercial viability of using landfill gas for powergen purposes. While
the cost of connecting to the distribution grid can be relatively modest, more complicated connections
to the transmission grid, over greater distances or more difficult terrain, can cost millions of euros.
According to industry sources, the capital cost for each MWe capacity can range from €1 to €2 million.
This is broadly consistent with the figures contained in a recent EU report on Financing Renewable

The Economic Benefits of the Development of
Bioenergy in Ireland
41
Energy in the European Energy Market63
which noted that the typical investment costs for a landfill
gas plant ranges from €1,350-1,950/kWe64
.
Industry sources suggest that the engine itself can cost up to €0.75 million if purchased new, with
switch gear, engineering and ground works pushing the total over €1 million. The cost of the grid
connection can add significantly to overall capital investment and, as indicated above, can vary
significantly from site to site. If it is assumed that the “typical” capital cost for each MWe is, therefore,
approximately €1.5 million – industry feedback suggests that just over 50% is likely to be made up of
imported capital equipment (though there will be a margin for the Irish distributors) while the
remainder of the spend would remain in the domestic economy – as payments to locally based
engineering and groundwork contractors, as well as the grid operator.
On the basis of an average of €1.5 million per MWe, this would indicate a total capital cost of the
installed LFG capacity of €60 million. The bulk of this investment has already taken place, however.
Nevertheless, some investment will be needed in upgrading and refurbishing a number of existing
sites, including the development of the Drehid Landfill site in North Kildare by AES/Bord na Mona.
For the purposes of this study, therefore, it has been assumed that approximately €10 million will be
invested in the sector over the period to 2020.
Facility Operating Costs
Annual spend on operation and maintenance costs can also vary significantly from site to site –
depending on the nature and age of the facility and also on whether the LFG is “cleaned”. Industry
sources, therefore, found it difficult to indicate what the “typical” O&M costs are likely to be. To arrive
at an estimate of annual spend, therefore, it has been necessary to rely on average figures for the
EU. These indicate that O&M costs for LFG facilities are typically in the region of €50-80 per kWe.
On the basis of an installed capacity of 40 MWe and an annual O&M cost of €70 per kWe, the total
annual spend on O&M could be in the region of €2.8 million. While a proportion of this will be needed
to cover replacement parts and equipment, the vast majority (assumed to be 80%) will remain in the
domestic economy.
Employment Impacts
Using ECOTEC statistics on employment intensities for AD facilities, it has been assumed that 7.5
FTE positions will be created for each €1 million of capital investment. On the basis of the projected
spend of €10 million over the period to 2020 this would imply C&I employment of 75 man years over
the period as a whole. However, as some 50% of the capital expenditure is on imported plant, only
half of the employment creation could be attributed to domestic contractors/suppliers.
The direct employment impacts of the ongoing operation of LFG facilities are relatively modest.
Based on feedback from industry sources, it is estimated that the total number of FTE employees
needed to operate the 15 facilities is likely to be in the region of 36 FTEs (including technical staff as
well as an allocation for administrative and management staff). This is also consistent with the
findings from previous studies.65
The indirect and induced employment effects are estimated using
CSO Input-Output figures for the Irish economy.
63
http://ec.europa.eu/energy/renewables/studies/doc/renewables/2011_financing_renewable.pdf 64
These figures are, however, somewhat higher than those reported in the SEAI’s Study into Bioenergy Training and Education Needs which cited a figure of €925,000 per MWe over the period 2005-2010 and €771,000 for the period from 2010 to 2020. 65 The SEAI Training Needs Study which – based on the ECOTEC study – used a figure of 0.225 FTE per GWh
of energy delivered. On the basis of the 160 GWh of energy forecast to be delivered by the LFG sector under the
2020 scenario, this would equate to 36 FTE.

The Economic Benefits of the Development of
Bioenergy in Ireland
42
Table 3.20: LFG – Summary of Key Economic Indicators
Key Indicators Total
Number of Facilities - Total 15
Small 10
Large 5
Bioenergy Electricity Net Output MWe 40
Bioenergy Contribution to RES-E (ktoe) 13.8
Investment Costs – Total Installed Capacity €60 million
Investment Cost – to 2020 €10 million
Domestic Content (50%) €5 million
- Direct Impact €1.8 million
- Direct and Indirect Impact €3.7 million
- Direct, Indirect and Induced Impact €5.9 million
Operation and Maintenance – Annual Spend €2.8 million
- Direct Impact €1.0 million
- Direct and Indirect Impact €1.7 million
- Direct, Indirect and Induced Impact €2.8 million
Employment
Construction and Installation - Man years 75
Direct Domestic Employment Impact (50%) 37.5
Direct and Indirect Employment 53
Direct, Induced and Induced Employment 74
Operation/Maintenance – Direct Employment FTE 36
Direct and Indirect Employment 61
Direct, Induced and Induced Employment 156
3.9 Municipal Sewage Gas
The current installed capacity of the four municipal sewage gas facilities which are operating in
Ireland is reported to be 4.335 MWe. It is understood that the scope for further large scale projects is
likely to be limited but smaller projects may be possible.66
This mainly reflects the fact that anaerobic
digesters are typically only installed in waste water treatment facilities with a population equivalent of
40,000 or more.
Table 3.21: MSG: Installed Capacity
Location Installed Capacity
Dublin City 4 MWe
Kildare (Osberstown) 160 kWe
Clonmel 120 kWe
Tralee 55 kWe
Total 4.335 MWe
66
All Ireland Grid Study – ESBI, 2008

The Economic Benefits of the Development of
Bioenergy in Ireland
43
Source: All Ireland Grid Study – ESBI, 2008
Investment – Capital Costs
According to figures contained in the recent EU report on Financing Renewable Energy in the
European Energy Market67
the typical investment costs for a sewage gas plant ranges from €2,300-
3,400/kWe, and from €2,400-3,550/kWe for a sewage gas plant with CHP68
. However, it is not
envisaged that any further large scale investment will take place in sewage gas facilities in Ireland
over the period to 2020 and therefore, this has not been taken into account in estimating the potential
economic benefits.
Facility Operating Costs
There will, however, be the ongoing costs associated with the operation and maintenance of existing
facilities and the energy produced will, of course, contribute to national energy supply. According to
EU statistics, the annual O&M costs are likely to be in the range of €115-175 per KWe, depending on
whether a CHP facility is also in place. If an average figure of €145 per kWe is assumed, this would
imply an annual spend on O&M of approximately €0.6 million on the basis of installed capacity. The
direct, indirect and induced impacts of this spending on the Irish economy are calculated using CSO
Input-Output figures for the electricity and gas sector.
Employment Impacts
Direct employment impacts are also relatively modest. These have been estimated using EU labour
intensity figures for operation and maintenance of similar plants. On the basis of 0.225 FTE per GWh
of energy delivered (in line with SEAI/ECOTEC estimates), then this would imply ongoing employment
in the sector of 13 FTE per annum. The indirect and induced employment impacts have been
estimated using data from the CSO as set out in Appendix 3.
Table 3.22: MSG – Summary of Key Economic Indicators
Key Indicators Total
Number of Facilities - Total 4
Bioenergy Electricity Output (MWe) 4.0
Bioenergy Heat Output (MWth) 4.0
Bioenergy Contribution to RES-E (ktoe) 2.58
Bioenergy Contribution to RES-H (ktoe) 2.58
Investment – to 2020 0
Operation and Maintenance – Annual Spend €0.6 million
- Direct Impact €0.2 million
- Direct and Indirect Impact €0.4 million
- Direct, Indirect and Induced Impact €0.6 million
Employment
Operation/Maintenance – Direct Employment 13
Direct and Indirect Employment 22
Direct, Induced and Induced Employment 57
67 http://ec.europa.eu/energy/renewables/studies/doc/renewables/2011_financing_renewable.pdf 68
These figures are, however, somewhat higher than those reported in the SEAI’s Study into Bioenergy Training and Education Needs which cited a figure of €925,000 per MWe over the period 2005-2010 and €771,000 for the period from 2010 to 2020.

The Economic Benefits of the Development of
Bioenergy in Ireland
44
Summary – Total Biogas
The following table summarises the potential economic impact of the development of the
biogas/biomethane sector in Ireland, on the scale envisaged in Chapter 2. To achieve these targets,
some €342million will need to be invested over the period to 202069
- of which almost 50% would be
spent in the Irish economy. In addition, almost €27 million would be spent annually on ongoing
operational costs, with the vast majority of this being spent domestically.
In terms of employment, too, significant impacts are expected. During the construction and
installation phase, it is estimated that temporary direct employment, equivalent to 1,290 work years
would be created in Ireland. This would rise to the equivalent of over 2,500 work years if indirect and
induced employment impacts are also taken into account. In addition, over 250 direct FTE permanent
positions would be created in Ireland to operate and maintain biogas infrastructure on this scale. This
rises to 950 if indirect and induced employment impacts are also included.
Table 3.23: Total Biogas – Key Economic Indicators
Key Indicators Total
Total Capital Investment to 2020 €342 million
Annual Operating Spend €26.7 million
Construction and Installation – Work years
Direct Employment in Ireland 1,287
Direct and Indirect Employment 1,807
Direct, Induced and Induced Employment 2,530
Operation/Maintenance – Direct Employment in Ireland 253
Direct and Indirect Employment 452
Direct, Induced and Induced Employment 950
Bioenergy Contribution to RES-E (ktoe) 39.9
Bioenergy Contribution to RES-H (ktoe) 53.9
3.10 Biofuels
Chapter 2 sets out a baseline scenario of how the 2020 RES-T targets may be met. While it is
acknowledged that significant difficulties exist in relation to the development of an indigenous biofuels
sector and that in reality imports are likely to play a key role for the foreseeable future, nevertheless,
for the purposes of this study, it has been assumed that additional infrastructure will be put in place to
supplement the output from the existing facilities currently operating in Ireland.
At present, there is a bioethanol facility operational in Cork i.e. Carbery/Maxol facility. The facility uses
a feedstock of cheese whey, and has an estimated output capacity of 10.5 million litres per year70
. In
addition, there is one biodiesel facility - Green Biofuels, New Ross - which uses feed stocks of
rapeseed oil, tallow and recovered vegetable oil (RVO). It produces roughly 30 million litres per
69 Although there has already been some limited investment in on/off farm AD facilities to date, the total is
included for the purposes of calculating total capital spend, however, as the bulk of the LFG and sewage gas infrastructure is already in place, only estimated new investment in these facilities is included over the period to 2020. 70
Liquid Biofuels Update - Presentation by Barry Caslin, Teagasc, National Bioenergy Conference 2011
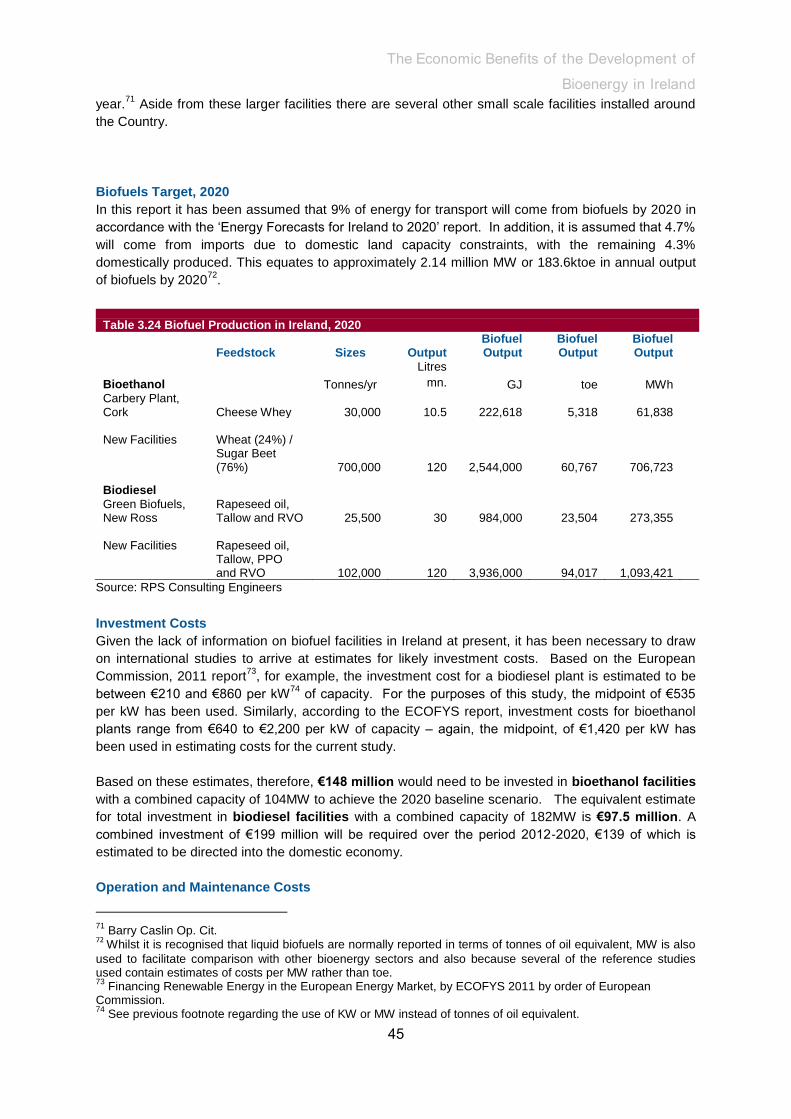
The Economic Benefits of the Development of
Bioenergy in Ireland
45
year.71
Aside from these larger facilities there are several other small scale facilities installed around
the Country.
Biofuels Target, 2020
In this report it has been assumed that 9% of energy for transport will come from biofuels by 2020 in
accordance with the ‘Energy Forecasts for Ireland to 2020’ report. In addition, it is assumed that 4.7%
will come from imports due to domestic land capacity constraints, with the remaining 4.3%
domestically produced. This equates to approximately 2.14 million MW or 183.6ktoe in annual output
of biofuels by 202072
.
Table 3.24 Biofuel Production in Ireland, 2020
Feedstock Sizes Output Biofuel Output
Biofuel Output
Biofuel Output
Bioethanol Tonnes/yr
Litres
mn. GJ toe MWh Carbery Plant, Cork Cheese Whey
30,000 10.5
222,618
5,318
61,838
New Facilities
Wheat (24%) / Sugar Beet (76%)
700,000 120
2,544,000 60,767
706,723
Biodiesel
Green Biofuels, New Ross
Rapeseed oil, Tallow and RVO 25,500 30 984,000 23,504 273,355
New Facilities
Rapeseed oil, Tallow, PPO and RVO 102,000 120 3,936,000 94,017 1,093,421
Source: RPS Consulting Engineers
Investment Costs
Given the lack of information on biofuel facilities in Ireland at present, it has been necessary to draw
on international studies to arrive at estimates for likely investment costs. Based on the European
Commission, 2011 report73
, for example, the investment cost for a biodiesel plant is estimated to be
between €210 and €860 per kW74
of capacity. For the purposes of this study, the midpoint of €535
per kW has been used. Similarly, according to the ECOFYS report, investment costs for bioethanol
plants range from €640 to €2,200 per kW of capacity – again, the midpoint, of €1,420 per kW has
been used in estimating costs for the current study.
Based on these estimates, therefore, €148 million would need to be invested in bioethanol facilities
with a combined capacity of 104MW to achieve the 2020 baseline scenario. The equivalent estimate
for total investment in biodiesel facilities with a combined capacity of 182MW is €97.5 million. A
combined investment of €199 million will be required over the period 2012-2020, €139 of which is
estimated to be directed into the domestic economy.
Operation and Maintenance Costs
71
Barry Caslin Op. Cit. 72
Whilst it is recognised that liquid biofuels are normally reported in terms of tonnes of oil equivalent, MW is also
used to facilitate comparison with other bioenergy sectors and also because several of the reference studies used contain estimates of costs per MW rather than toe. 73
Financing Renewable Energy in the European Energy Market, by ECOFYS 2011 by order of European Commission. 74
See previous footnote regarding the use of KW or MW instead of tonnes of oil equivalent.

The Economic Benefits of the Development of
Bioenergy in Ireland
46
According to ECOFYS estimates, it costs between €32-€110 per kW(transport) to operate and
maintain a bioethanol plant and €10.50-€45.00 per kW(transport) to operate and maintain a biodiesel
plant. These are annual costs based on typical plants, ranging in size from 5 to 25 MW(transport).
In order to estimate the annual operating cost of the projected bioethanol facilities in Ireland in 2020, a
cost of €71 per kW of capacity has been applied. Based on the bioethanol plants operating for 7,500
hours per year the total capacity of the bioethanol facilities in 2020 will be approximately 104 MW
(8.9 ktoe). It is therefore estimated that operating costs would be in the region of €7.4 million per
annum.
Using the same methodology to the biodiesel plants with a projected capacity of 182 MW (15.6 ktoe)
and taking the midpoint of the ECOFYS estimates (i.e. €27.80 per kW of capacity), then the annual
operating and maintenance costs of the biodiesel plants are estimated to be roughly €5 million in
2020. These costs do not include the cost of feedstock or payroll, which are detailed below.
Annual Feedstock requirement by 2020
In 2020, the bioethanol plants will require an additional 700,000 tonnes of feedstock per year.
Approximately 530,000 tonnes of this requirement will be in the form of sugar beet at an approximate
price of €31.66 per tonne75
or €16.8 million in total. The remaining 170,000 tonnes will comprise
wheat at €184 per tonne76
, or €31.3 in total per annum. Thus, by 2020 domestic bioethanol facilities
will require €48.1 million worth of additional feedstock per annum.
Domestic biodiesel facilities will require 127,500 tonnes of feedstock per year by 2020 which will
comprise rapeseed (75%) and tallow (25%). While tallow will not incur a cost, rapeseed has been
estimated at €941 per tonne or €90 million per annum77
.
Annual feedstock requirements for the biofuels facilities will thus cost in the region of €138 million per
annum by 202078
.
Annual Payroll by 2020
Payroll has been calculated using an annual industrial wage of €35,700 and based on 147 Direct
FTE’s (estimated below). Annual payroll by 2020 has been estimated to approximate €5.2 million.
Employment Intensity of Biofuel Facilities
Bioethanol Facilities
In calculating the potential employment impacts arising from the development of new bioethanol
facilities out to 2020, figures from a proposed Irish development have been used. On the basis of 50
FTEs for a 360,000 tonne (input) bioethanol facility, and a projected input of 700,000 tonnes in
Ireland, then this would suggest that approximately 75 additional direct FTEs could be generated in
the Bioethanol sector by 2020.79
Based on the Input-Output tables in the Appendix, 60 are expected
to result from indirect employment, while 69 positions will result from induced impacts. Thus, the
projected Bioethanol facilities in Ireland by 2020 are likely to result in just over 204 additional
full-time sustainable jobs throughout the economy.
Of course, the construction of these facilities would also generate significant employment
opportunities. For the purposes of assessing the potential impact of constructing a new 700,000
75
Based on UK market prices in September 2011. 76
Based on figures from Teagasc on cost of production with a margin to cover farmers profit and transport costs. 77
Based on international prices. 78
Cheese whey used in the production of bioethanol at Carbery is not valued. 79
We have assumed economies of scale will exist in the operation of one large 700,000 tonne facility.

The Economic Benefits of the Development of
Bioenergy in Ireland
47
tonnes bio-ethanol facility, it has again been necessary to draw on information on the proposed
development of a number of smaller facilities. For example, it has been estimated by project
promoters that a 360,000 tonne facility would create 400 direct construction jobs over 2 years. It has
been assumed that the labour requirement for the construction of a 700,000 tonne facility would
equate to almost 800 direct construction jobs over 2 years – or 1,600 man years in total80
.
Approximately 646 work years would result from indirect construction labour while the induced
impacts have been estimated at 898 work years. This implies a total of 3,144 work years created
from the construction of bioethanol facilities by 2020.
Biodiesel Facilities
Previously published plans of a proposed Irish plant estimated that 65 FTEs would be required to
operate a 120,000 tonne (output) per annum biodiesel facility.81
It has been estimated to have created
approximately 200 construction jobs lasting for just over one year – thus, we estimate 250 work years
would have been created from construction.
As indicated above, the baseline scenario set out here, anticipates there being two facilities in 2020
producing 150 million litres (output) of biodiesel by 2020.82
On a pro-rata basis, therefore, it is
estimated this would support approximately 72 new direct FTE positions by 2020. Indirect
employment is likely to create 58 FTE positions while 66 FTE jobs are created from induced impacts.
Thus, the projected number of biodiesel facilities by 2020 could create 196 FTE new positions.
In addition, it is estimated that some 250 work years would be created. Approximately 101 work
years would result from indirect construction labour while the induced impacts have been estimated at
140 work years. This implies a total of 491 work years created from the construction of biodiesel
facilities by 2020
Table 3.25Summary Table: Biofuels
Investment 2012-20 €m
Annual O&M Costs by 2020
€m Employment by 2020*
FTE
Total 199 156 400
80
We have not assumed any economies of scale in the construction of the larger facility. 81
While the source does not specify, these have been assumed as direct employment, while total employment has been calculated on the basis of the Input-Output model in the Appendix. 82
120,000 tonnes of biodiesel is equivalent to approximately 136 million litres of Biodiesel.

The Economic Benefits of the Development of
Bioenergy in Ireland
48
Section 4 Economic Impacts
The development of the Irish bioenergy sector offers a significant opportunity to address Ireland’s
challenging targets on renewable energy, emissions reductions and waste management. Over and
above these, however, this study has confirmed that there are also significant economic benefits that
could be delivered as a result of the development of the sector.
It will, however, require a significant capital investment in a wide range of bioenergy infrastructure if
these targets are to be achieved. In total, it is estimated that almost €1.5 billion in direct investment in
biomass processing infrastructure and equipment83
will be required over the period to 2020 to deliver
the output needed to meet the targets under RES-E, RES-H and RES-T.
This investment will deliver the following energy outputs, by 2020:
Table 4.1: Domestic Contribution of Biomass to Ireland's Energy Demand, 2020 (kTOE)
Bioenergy Contribution
to RES-E
Bioenergy Contribution
to RES-H
Bioenergy Contribution to
Res-T
Bioenergy Total Contribution
Biomass Heat Only 339.3 339.3
Biomass CHP 71.0 67.4 138.4
Waste to Energy 34.4 23.1 57.4
Co-firing 37.4 0.0 37.4
Anaerobic Digestion 23.5 23.5 47.1
Municipal Sewage 2.6 2.6 5.2
Landfill Gas 13.8 0.0 13.8
Biomethane 27.8 27.8
Biofuel 183.64 183.64
Total 182.6 483.6 183.6 849.9
If this is delivered, it will also generate significant economic impacts across a range of sectors. These
are summarised in the following tables.
83 This does not take account of the investment that will be required in the production of energy crops etc.

The Economic Benefits of the Development of
Bioenergy in Ireland
49
As indicated in Table 4.2, total investment in bioenergy infrastructure could reach almost €1.5 billion
(2011 money) over the period from now to 2020, of which approximately 55% is expected to be spent
in the Irish economy (the balance being imported plant and equipment).
In addition, once fully operational, it is estimated that some almost €430 million (2011 money) would
need to be spent annually on operating these facilities.
In terms of employment, (Table 4.3) it is estimated that almost 8,300 work years would be generated
throughout the domestic economy during the construction and installation of the various facilities
required to deliver the targets. Again, the focus is on the potential impact on employment associated
with investment in the sector over the period from 2012 to 2020. It also only focuses on the impact of
capital investment in the domestic economy only.
Permanent ongoing employment generated by the sector would grow to over 3,600 FTEs by 2020.
This includes employment in the facilities themselves, in supply industries and in the wider economy.
These figures record the net or incremental employment impacts across the different sectors. In
some instances, for examples, the net impacts may be relatively modest as they are simply displacing
the employment associated with existing activities.
Table 4.2 : Summary of Investment in Bioenergy Infrastructure and Annual Spend in 2020
Investment (€ million) Investment (€ million) O&M
Expenditure
Total Cumulative Installed Capacity by
2020
2012-2020 Total
Total Domestic Imports Total Domestic Imports Annual €
million
Biomass (heat) 373 203.1 169.7 276.4 150.4 126.0 130.2
CHP 325 227.4 97.5 285.9 200.1 85.8 82.0
Co-Firing 5 5 0 5 5 0 15.5
WtE 515 206 309 375 150 225 17
AD/Biomethane 332 166 166 332 166 166 23.3
LFG 60 30 30 10 5 5 2.8
MSG 12 6 6 0 0 0 0.6
Biofuels 246 171.85 73.65 198.9 139.2 59.7 155.7
Total 1,867 1,015.35 851.85 1,483.2 815.7 627.2 427.1

The Economic Benefits of the Development of
Bioenergy in Ireland
50
Table 4. 3: Summary of Employment Impacts – Temporary and Permanent
Employment
Construction and Installation –
Temporary
Work Years 2012-2020
Employment
Operations – Permanent
Full Time Equivalents
Direct Indirect Induced Total Direct Indirect Induced Total
Biomass (heat) 100 43 57 200 162 236 191 589
CHP 1,137 464 640 2,242 187 268 228 683
Co-Firing 29 11 16 56 0 185 93 278
WtE 855 345 480 1,680 110 165 431 706
AD/Biomethane 1,250 504 702 2,456 204 165 368 737
LFG 37.5 15.5 21 74 36 25 95 156
MSG 0 0 0 0 13 9 35 57
Biofuels 791 323 445 1,559 147 118 135 400
Total 4,200 1,705 2,361 8,267 859 1,171 1,576 3,606
Tables 4.4 and 4.5 outline what these economic impacts mean in terms of energy output (kTOE). The
figures for co-firing have not been shown as the net or incremental economic impacts were found to
be relatively minor as a result of substituting biomass for peat).
As can be seen, there are significant differences in both the investment and labour intensity between
the different fuel types. Again it is important to note that the figures presented in this report focus on
the “incremental” or additional impacts of the bioenergy sectors and therefore, where biomass is
replacing existing fuels, the impacts will be reduced. In contrast, in the case of Waste to Energy, the
full costs of constructing and operating the two WtE facilities, as well as the full employment impacts
have been taken into account, even though energy production from biomass is only part of the plants
overall function.
Table 4.4 : Investment and Annual Spending Multipliers
Total Cumulative Investment in Installed
Capacity
O&M Spending
€ 000 Per ktoe
Output Per annum
€000 Per ktoe
Output Per Annum
Biomass (heat)
1,099
384
CHP
2,347
592
WtE
8,972
296
AD/Biomethane
4,433
311
LFG
4,348
203
MSG
2,308
115
Biofuels
1,337
848

The Economic Benefits of the Development of
Bioenergy in Ireland
51
Table 4.5 : Employment Multipliers by Category
Construction Employment
/Installation– Temporary Work Years
2012-2020
O&M Employment - Permanent
Per ktoe annual
Output
Per €mn invested
(2012-2020)
Per ktoe annual
Output
Per €mn invested
(Cumulative
Installed Capacity)
Biomass (heat) 0.6 0.7 1.7 1.6
CHP 16.2 7.8 4.9 2.1
WtE 29.3 4.5 12.3 1.4
AD/Biomethane 32.8 7.4 9.8 2.2
LFG 5.4 7.4 11.3 2.6
MSG 11.0 4.8
Biofuels 8.5 7.8 2.2 1.6
Impact on the Rural Economy
A very significant proportion of the employment generated in the both the construction and operations
of the bioenergy sector will be in rural Ireland. Most of the facilities themselves will be based in rural
areas, and most of the feedstock will be grown or produced there. Indeed, with the exception of the
WtE facilities and some of the LFG and sewage gas facilities, the vast majority of the employment
impacts will be in rural areas. This will in turn make a significant contribution to sustaining rural
communities.
As highlighted by the Irish Farmers Association (IFA) in their policy document on Ireland’s Land-
based Renewables Strategy84
the development of the bioenergy sector offers major opportunities for
Ireland’s agricultural community. Agricultural crops, as well as farm by-products such as animal
manures, have the potential to become a valuable and reliable source of energy. These in turn will
allow farmers to reduce their energy costs and generate income from the sale of biomass products or
from selling electricity or gas to the national grid. The renewable energy sector can offer farmers new
business opportunities and provide alternatives to traditional farming activities. Revenue generated
from renewable energy on the farm can help to sustain farm incomes and, because the majority of
this income will be spent locally, will help to maintain income and employment within the wider rural
community. As the bioenergy sector becomes more established, new opportunities will emerge in the
supply chain which will help to create employment opportunities in harvesting, processing,
transportation, and installation and maintenance.
Moreover, while an analysis of the spatial distribution impacts of the development of the bioenergy
sector is outside the scope of the current study, it is clear given the location of forestry resources and
the potential location of energy crop production that the development of the sector could also
contribute to delivering more balanced regional economic development.
Impact on Fuel Imports and Balance of Payments
84 IFA, Ireland’s Land Based Renewables Strategy, April 2011.

The Economic Benefits of the Development of
Bioenergy in Ireland
52
Security of energy supply is a critically important economic issue for an island nation such as Ireland.
This has been noted consistently by the National Competitiveness Council (NCC) in its annual reports
on Ireland’s competitiveness. In the latest report the NCC again pointed to the fact that since the mid-
1990s energy import dependence has grown significantly in Ireland, due to an increase in energy use
and a decline in indigenous natural gas and peat production.
Ireland’s overall import dependency now stands at 90% - which compares unfavourably with the EU-
15 average of 56%.85
The report also points to the fact that Ireland’s share of energy derived from
renewable resources, while growing quickly, is still only half the OECD average.86
While the global recession has slowed down the growth in world demand for oil, upward pressure on
prices is expected to continue. Indeed, the ESRI in its Review of Irish Energy Policy87
notes that
“there is little prospect of a return to low oil prices in the immediate future and further upward
pressure on prices can be expected in the face of a prolonged world recovery. Temporary
shocks, such as the current unrest in the Middle East, can also put prices under pressure”.
This exposes Ireland to a major risk of disruption which would significantly damage domestic
economic activity. While some progress has been achieved in relation to the development of
alternative renewable energy resources, to date this has focused heavily on the development of on-
shore wind, which is unpredictable relative to bioenergy. The production of bioenergy using a range of
technologies and exploiting Ireland’s extensive indigenous resources, therefore, offers the opportunity
to address import dependency and also to protect against volatile international oil and gas prices.
Moreover, Ireland is legally obliged to meet the targets under the Renewable Energy Directive.
Without the development of the sector, and an appropriate supply-base, Ireland will be forced to rely
on imported bioenergy to meet the 2020 targets. Teagasc has warned that the price of imported
bioenergy products is likely to increase substantially as 2020 approaches and many Member States
compete for material to meet their targets. In addition, they point to the fact that imports will largely
have to come from outside the EU, in which case sustainability, security of supply and fluctuating
prices are likely to be recurring issues.
The development of an indigenous bioenergy sector and supply base will help to address these
concerns and provide greater security of supply of energy to the Irish economy. The economic benefit
of this is difficult to measure, since it relates to the risk of something occurring or not occurring, the
probability of which is uncertain. However, there is an economic impact if Ireland fails to meet the
terms of the Renewable Energy Directive. The European Court of Justice can impose a range of fines
on Ireland that can be as high as €40 million per annum plus a lump sum fine (minimum €1.5
million)88
.
In addition, by substituting imports it will help to improve the country’s balance of payment position.
Ireland currently spends some €6.5 billion a year on imported gas, oil and coal. The scenario outlined
in this report indicates that the bioenergy sector has the potential to contribute the equivalent of 850
ktoe a year by 2020. On the basis that all of this is domestically produced and is fully utilised, at
85
National Competitiveness Council: Annual Competitiveness Report 2010. http://www.competitiveness.ie/publications/featuredpublications/title,7075,en.php 86
In addition, Ireland is among the highest carbon emitters in the OECD on a per capita basis, driven by
significant increases in transport emissions over the last two decades. 87
http://www.esri.ie/UserFiles/publications/RS21.pdf 88
The annual figure of €40 million would apply for a serious breach of community law that had persisted for at least 2 ½ years subsequent to a European Court of Justice judgement. http://ec.europa.eu/eu_law/docs/docs_infringements/sec_2010_923_en.pdf

The Economic Benefits of the Development of
Bioenergy in Ireland
53
today’s prices, this would lead to a reduction in Ireland’s import bill of €488 million a year89
. That is,
Ireland’s energy import bill would be reduced by approximately 7.5%.
Competitiveness
The manifold competitiveness challenges facing the Irish economy are, as stated above, highlighted
in the annual report of the National Competitiveness Council.
Particular issues exist with respect to energy. The ESRI’s report on Irish Energy Policy notes that,
against the backdrop of prolonged sluggishness in world economic growth, intense pressure is being
put on the competitiveness of the Irish economy:
“Economic recovery requires a substantial reduction in the domestic price level relative to that
of competitors. This enhances the need for policy to minimise the cost of energy for the
economy.”90
The degree to which the bioenergy sector can contribute directly to Ireland’s competiveness will
depend in large part on the relative cost of producing bioenergy from the various sources, compared
to the alternative of continuing to import conventional fossil fuels or of importing biofuels.
While it would appear that, at least in the short-run, the cost of generating electricity from bioenergy
sources will need to be supported under the REFIT regime, usage of bioenergy for heating could
reduce costs substantially for many Irish businesses (and Irish households).91
The following table, for
example, shows the relative cost of energy from different fuel types for commercial and industrial
users. These figures are taken from the SEAI’s regular publication “Fuel Cost Comparison”92
and
serve to illustrate the potential cost reduction that could be achieved for some commercial and
industrial users from a switch from conventional fuels to biomass.
89
On the basis that, at the margin, all replaced fuel is imported. One tonne of crude oil equals 7.3 barrels of oil.
Closing spot price for Brent Crude on 28th September 2011 is USD106.74 (Bloomberg), while the spot exchange
rate to Euros on 28th September 2011 is 1.3631 (European Central Bank
http://www.ecb.int/stats/exchange/eurofxref/html/index.en.html). 852 x 1,000 x 7.3 x 106.74 ÷ 1.3631 = €487.8 million. 90
ESRI: Op cit.
91 The REFIT scheme is funded through the Public Service Obligation (PSO) charged to all electricity
consumers. The Commission for Energy Regulation (‘CER’) calculates and certifies the costs associated with the
PSO, including each of the relevant PSO schemes, and sets the associated levy for the required period. See for
example, http://www.cer.ie/en/renewables-current-consultations.aspx?article=15340173-5b39-4c82-bb93-
a123dd3245fc
Information on the potential impact of the biofuels obligation scheme can also be found at
http://www.dcenr.gov.ie/NR/rdonlyres/771EE392-06E0-4B59-888D-
E160FF10CD4B/0/EnergyBiofuelObligationandMiscellaneousProvisionsBill2010RIA.pdf 92
http://www.seai.ie/Publications/Statistics_Publications/Fuel_Cost_Comparison/

The Economic Benefits of the Development of
Bioenergy in Ireland
54
Table: 4.6: Comparison of Energy Costs: Commercial/Industrial Fuels (July 2011)
Fuel Form Delivered Energy Cost
Cent/kWh
Coal Industrial Fines
0.71
Oil (inc. Carbon tax) Gas Oil
Light Fuel Oil
Medium Fuel Oil
Heavy Fuel Oil
9.16
8.31
8.09
7.83
LPG (inc. Carbon tax) Commercial Cylinders
Bulk LPG (0-3 tonnes)
Bulk LPG (3.1-40 tonnes)
13.95
11.33
10.33
Natural Gas (inc. Carbon
tax)
Band I1 <1000 GJ per annum
Band I2 >=1000<10000 GJ per annum
Band I3 >=10,000<100,000 GJ per annum
Band I4 >=100,000 <1 million GJ per annum
4.71
4.25
3.48
2.68
Electricity Band IA <20 MWh per annum
Band IB >=20<500 MWh per annum
Band IC >=500<2,000 MWh per annum
Band ID >=2,000<20,000 MWh per annum
Band IE >=20,000<70,000 MWh per annum
19.32
15.25
12.75
9.76
9.01
Wood Fuel Chips (35% moisture)
Pellets Bulk Delivery
Pellets Bagged
3.10
4.45
5.26
Source: SEAI
If, for example, it is assumed that the 400 commercial and 250 industrial biomass boilers which are
projected to be installed by 2020 replace gas oil boilers, then the potential saving in terms of fuel
costs is in the order of €208 million.93
94
Moreover, while the future path of fossil fuel prices is unknown, most commentators agree that it is
unlikely that they will return to the relatively low prices of a few years ago, and there is a strong
possibility that they will continue to increase over the medium term as demand grows.
In this context, the presence of a strong bioenergy sector in Ireland provides a valuable hedge against
future energy price instability, as well as important security of supply benefits. Both of these will
benefit Ireland’s competitiveness.
Environmental Impacts
The key environmental impact of the achievement of the biomass energy targets is the reduction in
Greenhouse Gas (GHG) emissions as a result of the replacement of fossil fuels. Table 4.8 overleaf
93
This is based on the relative cost per kWh of energy delivered – taking account of the assumptions about the
relative use of woodchip and pellets contained in the baseline case. It is recognised that the savings would be significantly less if biomass was replacing natural gas (of the order of €7 million), or more if biomass was replacing electricity or LPG but given the fact that many areas of the country are not connected to the natural gas network, and the relative costs of the different fuels, the switch from gas oil to biomass seems the most likely scenario. 94
Feedback from suppliers indicates that the annual cost saving could be as much as 66% or €84,600 for a
commercial boiler and €906,800 for an industrial boiler.

The Economic Benefits of the Development of
Bioenergy in Ireland
55
sets out the calculations. We estimate that the achievement of the targets will result in a saving of
3.14 million tonnes of CO2 per annum by 2020 and Table 4.7 below summarises the CO2 reduction by
category. This represents roughly 5% of total GHG emissions in 2009, and will represent a very
significant contribution to the required reduction in GHG emissions to be achieved by 2020, under
Ireland’s international commitments.
Table 4.7 : CO2 Avoided by Category (Per Annum)
CO2 Avoided
‘000 Tonnes
Fuels replaced
Biomass (heat) 1,254.9 Heating Oil (gasoil)
CHP 511.7 Heating Oil (gasoil)/Natural Gas
Co-Firing 138.3 Peat
WtE 212.4 Natural Gas
AD/Biomethane 276.9 Heating Oil (gasoil)/Natural Gas
LFG 50.9 Natural Gas
MSG 19.1 Natural Gas
Biofuels 679.2 Petrol/Diesel
Total 3,143.4
One can place an economic value on this reduction in emissions by reference to the carbon tax
avoided. The carbon tax in Ireland as of Budget 2012 is €20/tonne. At this rate, the value of the
emission reduction would be €63 million per annum95
. The Government’s National Recovery Plan
2011-2014, published with Budget 201196
, envisages the carbon tax doubling to €30/tonne by 2014.
This would increase the value of the GHG emission avoided to would increase this value to €94
million per annum.
Other Economic Impacts
As demonstrated above, the development of the bioenergy sector in Ireland has the potential to
support significant spending and employment creation in the domestic economy. Nevertheless, a
significant proportion of this expenditure - mainly in terms of capital investment - is expected to be
incurred on imported equipment and professional services.
There is, therefore, the potential for Ireland to secure an even greater share of the economic benefits
through the development of a local supply base. The development of the sector could also offer an
opportunity for the development and testing of new technologies, processes and skills, which could, in
turn, be used to develop an export-focussed industry, as has happened in other countries. This will be
dependent however on the growth of a critical mass of local activity in the bioenergy sector, as is
envisaged under the baseline scenario presented here.
The expectation under the baseline scenario is also that significant amounts of bioenergy will need to
be imported to reach the required targets. Clearly, if this could be substituted by domestic production,
further economic opportunities and benefits would accrue to Ireland.
95 Note that the proportion of this saving that relates to heat only biomass is already included in the economic
saving calculated under the Competitiveness heading above. 96
http://www.budget.gov.ie/The%20National%20Recovery%20Plan%202011-2014.pdf

The Economic Benefits of the Development of Bioenergy in Ireland
56
Table 4.8: GHG Emissions Avoided 2020
Based on Final Energy Demand (note 2) Based on Primary Energy Demand (note 2)
RES-E kTOE
RES-H kTOE
Res-T kTOE
Total KTOE
%age split
Total GWh
Total GWh
GHG Emissions
Tonnes per GWh
Total GHG Emissions
Avoided ‘000 Tonnes
Total Biomass energy output 181 484 184 850 9,882 11,999
Fuel Replaced
Natural Gas 145 26 171 20.1% 1,987 3,368 206 692.5
Heating Oil (gasoil) 458 458 53.9% 5,325 5,325 264 1,405.4
Diesel 118 118 13.8% 1,367 1,367 264 360.7
Petrol 66 66 7.8% 769 769 252 193.6
Peat 37 37 4.4% 435 1,170 420 491.3
Total 181 484 184 850 100.0% 9,882 11,999 3,143.4
%age of total 21.5% 56.9% 21.6% 100.0%
Notes:
1. Heat from municipal sewage AD and Waste to Energy is assumed to replace natural gas. All other heat energy is assumed to replace heating oil. All electricity with the exception of peat co-firing is assumed to replace natural gas, as the marginal fuel source in the powergen system.
2. Final energy demand is the total GWh of output or useful energy, while primary energy demand relates to the input energy. This relates specifically to electricity, whereby energy is lost in the conversion of primary fuels to electricity, depending on the conversion efficiency. Displaced natural gas and peat in electricity production are assumed to have conversion efficiencies of 55% and 37.2% respectively.
Sources:
http://cmt.epa.ie/Global/CMT/emission_factor_sources.pdf
http://erc.epa.ie/safer/downloadCheck.jsp?isoID=21&rID=10174&atID=2268
The Economic Benefits of the Development of
Bioenergy in Ireland
57
Appendix 1 Policy and Legislative Background
The EU has set an Irish target of 16% of final energy to come from renewable sources by 2020. This
was further broken down by the NREAP for Ireland into 12% RES-H (heat), 10% RES-T (transport)
and 42.5% RES-E (electricity). Bioenergy is expected to be a major contributor to reaching these
energy targets.
Energy White Paper 2007
The Government’s White paper on energy policy is a National Policy concerned with delivering a
sustainable energy future for Ireland under The Energy Policy Framework 2007-2020.
The Paper sets out the primary goals of Irish energy policy. It sets national renewable energy
contribution targets for Ireland by 2020: 10% to transport, 12% to heat and 33% to gross electricity
consumption. Also specifies targets of 500MW of installed wave capacity by 2020, 30% biomass co-
firing at 3 state owned power stations by 2015 and 800MW of CHP, with an emphasis on biomass
CHP, by 2020.
Note: The 33% RES-E target originally specified by the Energy White Paper, 2007 was revised
upwards to 40% after the All Ireland Grid Study.
DIRECTIVE 2009/28/EC: the promotion of the use of energy from renewable sources
This European legislation specifies the 20-20-20 renewable energy targets. The aim of this piece of
legislation is to achieve a reduction in EU greenhouse gas emissions of at least 20% below 1990
levels, 20% of EU energy consumption to come from renewable resources, and a 20% reduction in
primary energy use compared with projected levels, to be achieved by improving energy efficiency all
be 2020.
This legislation establishes the need for each country to have a National Renewable Energy Action
Plan (NREAP). The legislation stipulates that 16% of gross final energy consumption must from
renewable sources for Ireland. This is the target for the Irish NREAP. Furthermore, each country has
an obligation to provide 10% of the energy used for transport from renewable sources.
In addition to providing renewable energy targets for European countries the Directive also
encourages the decentralisation of bioenergy as it can provide significant rural income opportunities
due to the dispersed nature of agricultural facilities. “It is appropriate to support the demonstration and
commercialisation phase of decentralised renewable energy technologies. The move towards
decentralised energy production has many benefits, including the utilisation of local energy sources,
increased local security of energy supply, shorter transport distances and reduced energy
transmission losses. Such decentralisation also fosters community development and cohesion by
providing income sources and creating jobs locally.”

The Economic Benefits of the Development of
Bioenergy in Ireland
58
The National Renewable Energy Action Plan (NREAP), 2010
This national plan was enacted in 2010. It sets out the Government’s strategic approach and concrete
measures to deliver on Ireland’s 16% target (under Directive 2009/28/EC). The Government set
targets of 40% electricity from renewable energy (RES-E) and 12% heat energy from renewables
(RES-H). The NREAP also further discussed how the 10% of transport energy from renewables
(RES-T) target could be met.
The National Energy Efficiency Action Plan (NEEAP), 2009
The NEEAP sets out actions that should be undertaken over the coming years to achieve the 2020
targets of a 20% more efficient energy systems. The plan details how to reach 20% energy usage
reduction across all sectors and the goal of 33% energy reductions in public sector energy use.
A second NEEAP is underway and submission to the Energy Services Directive was expected in June
this year.
Energy (Biofuel Obligation and Miscellaneous Provisions) Act 2010
This Government Act was enacted in 2010. It requires that fuel suppliers will have to supply an
average of 4% biofuels in their annual fuel sales. However, there is no obligation to source the
biofuels locally or even in Ireland. Thus, fuel suppliers may import their biofuels to meet the targets
and the obligation may not directly result in the generation of biofuels from primary resources in
Ireland.
The Biofuel Obligation also saw the demise of several small PPO producers in Ireland. They had to
either sell their produce un-excised to one of the national oil distributors or pay the full excise on their
production at the time of sale, and some months or years later hope to sell certificates at a price that
would be highly uncertain but likely to be well below the excise paid. Neither was a viable option, so
they have ceased production.
Renewable Energy Feed in Tariff (REFIT) Scheme
This is Irish fiscal policy which is in place to provide a fixed monetary support to renewable electricity
suppliers. The third iteration of REFIT has been approved by the EU Commission. The details of the
proposed values for the new tariffs’ under REFIT 3 are shown below.
Proposed REFIT III Rates
Proposed REFIT III Rate
€/MWh
AD CHP <500 kW €150
AD CHP >500 kW €130
AD (non CHP) <500 kW €110
AD (non CHP) >500 kW €100
Biomass CHP <1500 kW €140
Biomass CHP >1500 kW €120
Co-firing using energy crops €95
Co-firing other biomass €85
The Economic Benefits of the Development of
Bioenergy in Ireland
59
SEAI: Greener Homes Scheme
The Greener Homes Scheme provided grants for the installation of heat pumps, solar panels,
biomass boilers and wood gasification stoves. The scheme is now closed however as of mid-august
2011 it had received over 33,000 applications, approximately 6,000 of which were bioenergy related.
SEAI: Renewable HEAT Deployment Programme (ReHeat)
The Renewable Heat Deployment Programme (ReHeat) provided grants for industrial and commercial
renewable heat installations. Biomass wood chip and pellet boilers, solar thermal systems and heat
pump systems were covered under the scheme. The scheme provided up to 30% of the capital cost
of the installation, but has now ceased.
Better Energy Homes (Retrofit) Scheme
The Better Energy Homes scheme replaces the Greener Homes Scheme and allow for retrofitting
more heat efficient installations such as wall and attic insulation grants.
Bioenergy scheme for Willow and Miscanthus 2007, 2011
After the successful implementation of the scheme in 2007 where nearly 3,000 ha of energy crops
were planted it has been re-opened in 2011. It is administered by the Dept. of Agriculture and Food.
Establishment Grants were payable under the EU Energy Crops scheme to land which was used for
the cultivation of willow and miscanthus and also for land set-aside for the growth of energy crops to
be used as biomass.
The Scheme provides grants of up to €1,300 per hectare of crop, covering up to 50% of costs.
Bord Na Mona Willow Establishment Scheme
DAFF and Bord na Mona offers monetary support for willow establishment. DAFF will supply a 50%
grant for the cost of establishment. The Bord na Mona scheme is for the use of willow in their co-firing
power plant and works as follows:
Bord na Mona will fund the other 50% of the establishment cost if the farmer so wishes. BnM will
also provide farmers with technical and crop management support for the first 4 years post
planting.
If no monetary support is received from BnM then the farmer could receive €38/tonne ex-gate for
willow chips at 55% moisture content from BnM. With an average yield of 10 dry tonnes/ha/yr
farmers could receive a return of €485/ha/yr or €197/acre/yr for the life of their projects.
If the farmer does receive BnM establishment support they will be paid €32/tonne ex-gate. They
can then expect €332/ha/yr or €135/acre/yr for the life of their projects.
BnM will also pay €10 (for distances up for 25km) and €11.50/tonne (for distance between 25km
and 80km) to deliver to the Edenderry station.
Bioenergy Roadmap to 2050, SEAI 2009
Bioenergy has the potential to be the main source of energy in Ireland over the coming decades. The
Bioenergy Roadmap estimates that there will be approximately 3500ktoe of indigenous bioenergy
resources available by 2050, if the correct supports for innovation and research are put into place.

The Economic Benefits of the Development of
Bioenergy in Ireland
60
Refined wood is thought to be the key driver in meeting the RES-H target for 2020 and chip and pellet
boilers are expected to drive domestic RES-H growth to 2020. Grass and waste (both human and
animal) can be significant energy resources in the coming decades, with a large growth being
predicted in the use of energy crops.
Energy Forecast for Ireland to 2020, SEAI 2010
The SEAI 2010 report, Energy Forecasts for Ireland to 2020 detailed the expected total final energy
demand towards 2020. It further broke the total final consumption into the individual RES targets for
Ireland. The NEEAP/NREAP scenario is the most accurate model at present as it takes into account
both the energy savings in the NEEAP and the technology mix contributions from the NREAP.
The Electricity calculation are based on the assumption that the AER for wind will provide 380 MW
and that Gate 1,2 & 3 will provide 381 MW, 1267 MW and the balance of the RES-E targets
respectively. Furthermore Ocean energy will contribute 75 MW and Hydro will contribute 234 MW.
Biomass will provide 153 MW to electricity generation through the generation of Co-firing, Waste to
Energy Landfill Gas and Biomass AD CHP facilities.
The Heat targets are heavily based on policy implementations, such as the Building Regulations Part
L 2008, which requires new builds to have 10 kWh/m2/year from renewable sources, and the Greener
Homes, ReHeat Grant and RetroFit Schemes.
The transport sector will draw influence from the Mineral Oil Tax Relief (MOTR) scheme the Biofuels
Obligation and the 10% Electric Vehicles target.
A further breakdown of the Figures from the Energy Forecasts to 2020 Report is provided in Chapter
2 “Meeting the 2020 Targets”.

The Economic Benefits of the Development of
Bioenergy in Ireland
61
Appendix 2 Feedstock types
Feedstock can be split into two broad categories: Crops and Forestry, to include all the wood
products, processes and wastes associated with forestry and also all food and non-food energy crops,
Other Materials and By-products including Waste and its derivatives from both humans and
animals.
Crops and Forestry
The term forestry incorporates a wide range of feedstock options for use in bioenergy. Energy can be
generated from conventional forestry processes, the residues from such processes and the wastes
from wood and other industries.
The renewable energy fuels derived from wood can include: wood chips, wood pellets, firewood logs,
sawdust, bark, raw wood wastes inter alia.
Wood waste feedstocks consist of the by-products or residues that remain after processing. Examples
include those from industries such as sawmills, broken pallets and crates, timber from building wastes
and the residues that remain after forestry harvesting.
The current wood usage in Ireland for energy production is detailed in the table below.
Table 0-1 Wood Biomass use for Energy Production on the Island of Ireland, 2009
Biomass Type ROI
000 m3 OB
Firewood (including Imports) 87
Wood Chip 53
Short Rotation Coppice (SRC) 4
Charcoal 2
Pellet and wood briquette 110
Forest based biomass for drying and energy production by board mills, sawmills, industrial use and co-firing
438
TOTAL 694
Source: Adapted from - All Ireland Roundwood Demand Forecast 2011 – 2020, COFORD Roundwood Demand
Group
Following the SEAI forecasted energy demands in 2010 and taking wood energy content as 6.9
GJ/m3
the following table details the forecast of roundwood97
demand for energy production until
2020.
97
Wood in its natural state as felled, with or without bark. It may be round, split, roughly squared or in other
forms.

The Economic Benefits of the Development of
Bioenergy in Ireland
62
Table 0-2 Demand for Forest-based biomass to meet renewable energy targets
Item/year ROI 2011 2020
‘000
Required Energy Output (GJ)
CHP 1,139 7,344
Heat Only 4,681 3,610
Co-firing 750 750
Total 6,570 11,704
Roundwood Demand (m3 OB)
CHP 165 1,064
Heat Only 678 523
Co-firing 109 109
Total 952 1,696
Source: Adapted from - All Ireland Roundwood Demand Forecast 2011 – 2020, COFORD Roundwood Demand
Group
Wood Wastes
Wood wastes or by-products from wood processing industries include chips, bark and sawdust. These
residues can be used in board mills, as feedstock for production, and also within sawmills and board
mills to provide heat for drying or space heating and to produce steam for the manufacturing process.
Additional residues are available from forestry and industrial processes for the generation of high
quality wood fuels. High quality wood fuels such as wood chips and wood pellets can be used for
domestic buildings, commercial sized buildings and to drive process heat in industry.
Forest residues
Forest Residues consist of the tree tops and branches that remain after timber is harvested. Some
forest residues are left on the forest floor to decompose and return nutrients to the soil, conserve
ecological value and also to act as brash mats, which allow machinery to travel across soft ground.
The Coford, All-Ireland Roundwood Production Forecast to 2028 predicts that the potential wood fibre
available for energy totals 23.575 million m3 over the forecast period. The volume increases from an
estimated 1.07 million m3 in 2011 to a maximum of 1.81 million m3 in 2027. Based on the estimated
demand for wood energy there will be a very tight supply/demand situation for the next five to six
years and full mobilisation of private sector volumes will be required.
The Coford Study further notes, it cannot be predicted whether the forestry available for energy use
will ultimately be used for energy generation and the price will predict the end-use of forestry
residues. The table below details the estimate of wood fibre potentially available for Energy in the
Republic of Ireland in 2011 and in 2020.
Table 0-3 Potential Available Wood Fibre in 2020, ROI
Year Tip – 7
cm
Roundwood 7
– 13 cm
Downgrade & Wood
Residues PCRW* Total Energy Content
(‘000s m3) (GJ)
2011 48 199 737 86 1069 7,380,000
2020 58 382 915 99 1453 10,020,000
* Post consumer recovered wood
Source: Adapted from - All-Ireland Roundwood Production Forecast 2011 to 2028 – Henry Philips, Coford
Wood Pellets
The Economic Benefits of the Development of
Bioenergy in Ireland
63
Wood pellets are upgraded or refined wood fuels which have been produced from sawdust, grinding
dust, shavings, and bark or cutter chips by drying and pressing. They have a low moisture and ash
content wood pellets burn very efficiently. Lignin released in the pressing process binds the wood
material. They are compact and easy to store and use for fully automatic burning in wood pellet
boilers or stoves.
Pellets are a standardised fuel that are made by pressing dry shavings or saw dust. The production
process does not use chemical additives - only high pressure and steam. To improve the mechanical
stability of pellets often 1-3% of organic additives, such as potato starch, corn flour or waste liquor
from the paper and pulp industry are added. Depending on the moisture, wood pellets have an
approximate energy content of 4.7 kWh/kg, meaning that 1 kg of wood pellets at 8% moisture content
could replace 0.41kg of light fuel oil.98
Wood chips
Chips come from cut wood from forestry logging residues, purpose grown willow or as a by-product
from industrial wood processing. Chips are small pieces of wood that are 5-50 mm long (measured in
the direction of the fibre). There may also be some longer twigs and finer material among them. The
quality of the chips depends on the raw material and the chipping process (sharp chipper blades).
Two main sources for chips are available:
Chips from the sawmill industry: generally have a maximum water content of 30% and be of
uniform quality and size. Generally they are best suited for larger boilers in a commercial
setting.
Forest chips: generally have a water content of between 40% and 60%, they can only be
used in large boilers, unless they are dried. For smaller boilers it is advisable to have moisture
contents of 30% or lower. An option with fresh cut trees is to leave them to dry naturally over
a season after felling. The wood can be artificially dried but this has energy implications for
the drying process and can result in higher per tonne costs.
Large pieces of wood or high humidity can cause problems with boiler operation. For this reason
ensuring the quality of woodchips is an essential precondition for their successful use as a fuel. Good
quality wood chips with a moisture content of 30% will have a calorific value of approximately 3.7
kWh/kg99
. The technical model is based on the assumption of wood chips at 25% moisture content
with an energy value of 3.79kWh/kg100
.
Pellets and chips have various advantages and disadvantages that need to be considered. The fuel
which is used will depend very much on local supply and market conditions. Preferably systems
should be installed, that can use more than one fuel and can therefore respond flexibly to the future
market situation. Such boilers have an electronic control system that adjusts the combustion
parameters to the selected fuel. It is also important that the feed system is suitable for handling both
fuels. As chips (unlike pellets) are not generally blown in, the store should be designed to enable the
fuel to be delivered by tipper truck if chips are expected to be used. The advantage of above ground
silos for pellets is their lower cost.
98
SEAI – Wood Pellets Information
http://www.seai.ie/Renewables/Bioenergy/Wood_Energy/Fuels/Wood_Pellets/ 99 SEAI – Wood Chip Information http://www.seai.ie/Renewables/Bioenergy/Wood_Energy/Fuels/Wood_Chips/ 100
Coford, 2010 Units Conversion factors and Formulas for wood energy http://www.coford.ie/media/coford/content/publications/projectreports/cofordconnects/ht21.pdf

The Economic Benefits of the Development of
Bioenergy in Ireland
64
Purpose-grown energy crops
Purpose grown energy crops are those which are cultivated purely for use in renewable energy
generation. While many crops fall under this category those typical to Ireland include: annual crops
(oilseed rape, cereals, hemp), perennial crops (miscanthus and reed canary grass) and short rotation
forestry (willow and poplar).
Energy crops can be used for a number of processes including heat and electricity production. Most
commonly, energy crops can be used in direct combustion or co-firing with peat for power production.
Certain crops, e.g. grains and grass, can also be used for anaerobic digestion. Sugar and starch
crops, such as sugar beet and wheat, can be fermented and used in the production of ethanol as
biofuel for transport. Biodiesel can also be produced from energy crops through pure plant oil (PPO)
extracted from oilseed rape.
Short rotation Coppice (SRC) refers to the cultivation of forest purely for use in energy applications.
Typically includes the production of wood fuel from trees with high juvenile growth, which are planted
at close spacing and harvested on short rotations (normally every three years). Species such as
Willow are ideal for SRF, as they are easy to establish, fast growing and suitable for a variety of sites
and resistant to pests and disease. Land for short rotation forestry is likely to come from: non-
rotational arable set aside land and land that is not in arable use i.e. beef or sheep production.
There are approximately 4,261,100 hectares of agricultural area farmed in Ireland. This can be broken
down into 292,200 ha of crops, 3,491,767 ha of grassland, 730,500 ha of forestry and 487,247 ha of
hill/rough land.101
Miscanthus
Miscanthus is a perennial, rhizomatous grass, originating from Asia, which somewhat resembles
bamboo. The most common species in Ireland is Miscanthus giganteus.
Growing Cycles
Miscanthus plants can be harvested every year, however it takes 3 to 4 years for it to become
established. Miscanthus is beneficial to farmer income as it can be harvested annually after
establishment. Plants have a lifespan of 15 – 20 years, thus allowing for between 12 and 17 harvests.
Rhizomes are planted in the spring at 20-30,000 plants per hectare using semi-automatic potato
planters or bespoke planters. The term rhizome refers the initial miscanthus cuttings that are
necessary for planting. Miscanthus plantations need 3-5 years to become fully established and to
obtain maximum yield level. Shoots emerge annually from the soil during March. The crop reaches
maximum height in the summer, crop drying occurs in autumn, when nutrients move back into
rhizome, leaves fall off and stems dry during winter (30-50% mc). The canes without leaves are ready
to be harvested mechanically in spring; the moisture content will drop to ~20%.
Cost of Production
101
Co-firing Current Issues, Presentation by Barry Caslin, Teagasc 2009

The Economic Benefits of the Development of
Bioenergy in Ireland
65
Costs relating to Miscanthus production can be lowered if the farmer cultivates some of the initial crop
for sale as cuttings also. The farmer is compensated for the opportunity cost of his land forfeited at a
rate of €0.025 cent per rhizome (150,000 x €0.025) = €3,750. The cost per rhizome from regeneration
of the mother crop is approximately €6,289 /150,000 rhizomes = 4.1 cent per rhizome. If we assume a
10% additional cost for gapping-up the crop and another 15% profit this would allow for a selling price
per rhizome of 5.2 cent per rhizome.
At present, Ireland is not in a position to cultivate its own miscanthus rhizomes, however, the
bioenergy scheme estimates that it may take two years for us to be at this level of production and
efficiency as crops and harvesting know how develop and improve.
The table below estimates the cost of initiating miscanthus cultivation. Figures for the number of
rhizomes harvested and the compensation to the farmer are based on the fact that the farmer
produced an initial ‘mother crop’ of 150,000 Rhizomes.
Table 0-4 Cost Break down of Miscanthus per Hectare
Number of Rhizomes harvested
150,000 rhizomes
Rotavating €82
Harvesting €850
Labour (5 men x two days) €1100
Levelling €36
Rolling €21
Compensation to farmer (4 year land-use)
€3,750
Transport (€15/box) €300
Storage €150
Total Costs €6,289
Source: Teagasc – Best Practice Guidelines for Miscanthus (Barry Caslin, Dr. John Finnan & Dr Alistair
McCracken, September 2010)
If it is assumed that 18,000 rhizomes will be planted per hectare the recommended retail price should
be in the region of 18,000 x €0.052 = €936 per hectare. If the planting rate is 15,000 rhizomes per
hectare the recommended retail price should not exceed (15,000 x €0.052) €780 ha.
Labour Intensity
Labour costs will need to be applied to the following aspects of miscanthus establishment:
Plough, Spray & Plant cuttings (once off)
Maintenance i.e. fertiliser, spray, spread sludge (ongoing basis)
Harvesting (once a year after 3 – 4 years)
Bailing (once a year after 3 – 4 years)
Transport
Other Uses
Miscanthus grass can also be used for animal bedding.
Willow
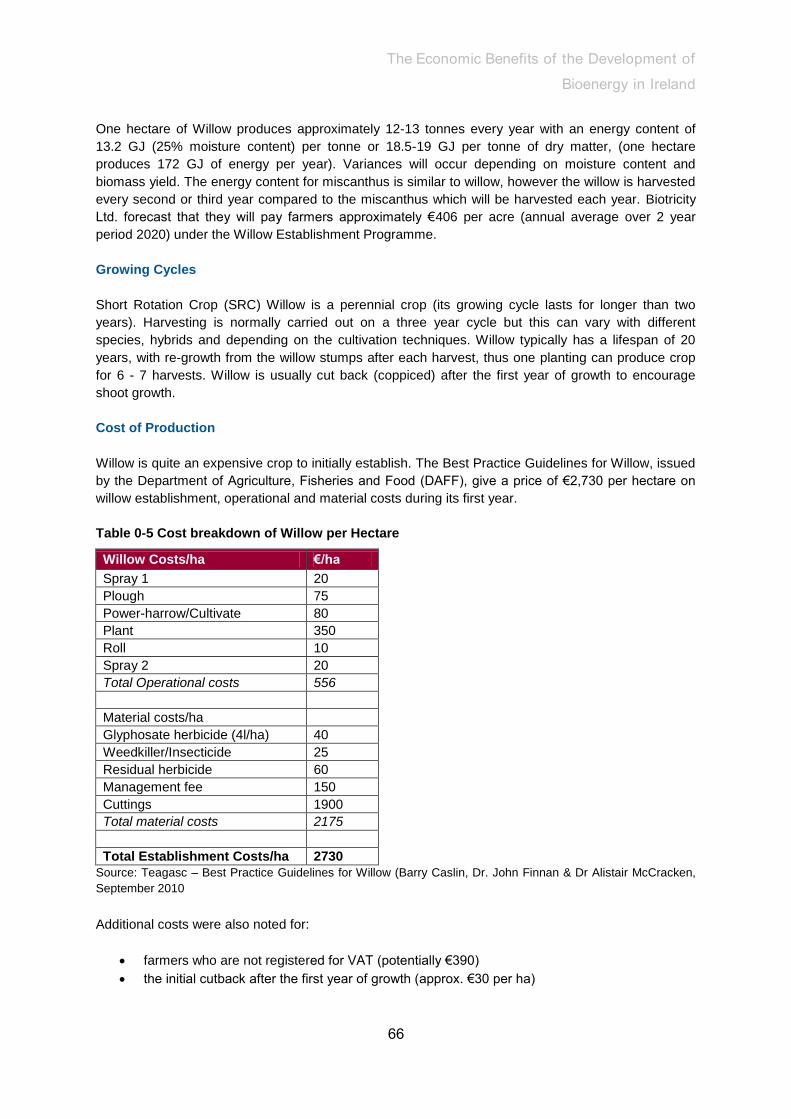
The Economic Benefits of the Development of
Bioenergy in Ireland
66
One hectare of Willow produces approximately 12-13 tonnes every year with an energy content of
13.2 GJ (25% moisture content) per tonne or 18.5-19 GJ per tonne of dry matter, (one hectare
produces 172 GJ of energy per year). Variances will occur depending on moisture content and
biomass yield. The energy content for miscanthus is similar to willow, however the willow is harvested
every second or third year compared to the miscanthus which will be harvested each year. Biotricity
Ltd. forecast that they will pay farmers approximately €406 per acre (annual average over 2 year
period 2020) under the Willow Establishment Programme.
Growing Cycles
Short Rotation Crop (SRC) Willow is a perennial crop (its growing cycle lasts for longer than two
years). Harvesting is normally carried out on a three year cycle but this can vary with different
species, hybrids and depending on the cultivation techniques. Willow typically has a lifespan of 20
years, with re-growth from the willow stumps after each harvest, thus one planting can produce crop
for 6 - 7 harvests. Willow is usually cut back (coppiced) after the first year of growth to encourage
shoot growth.
Cost of Production
Willow is quite an expensive crop to initially establish. The Best Practice Guidelines for Willow, issued
by the Department of Agriculture, Fisheries and Food (DAFF), give a price of €2,730 per hectare on
willow establishment, operational and material costs during its first year.
Table 0-5 Cost breakdown of Willow per Hectare
Willow Costs/ha €/ha
Spray 1 20
Plough 75
Power-harrow/Cultivate 80
Plant 350
Roll 10
Spray 2 20
Total Operational costs 556
Material costs/ha
Glyphosate herbicide (4l/ha) 40
Weedkiller/Insecticide 25
Residual herbicide 60
Management fee 150
Cuttings 1900
Total material costs 2175
Total Establishment Costs/ha 2730
Source: Teagasc – Best Practice Guidelines for Willow (Barry Caslin, Dr. John Finnan & Dr Alistair McCracken,
September 2010
Additional costs were also noted for:
farmers who are not registered for VAT (potentially €390)
the initial cutback after the first year of growth (approx. €30 per ha)

The Economic Benefits of the Development of
Bioenergy in Ireland
67
depending on the method of harvesting used (€30 per dry tonne for whole stem harvesting
and then €10 extra for chipping afterwards or €25 per dry tonne of direct chip harvesting and
an additional €30 for artificial drying)
transportation costs
Labour Intensity
Labour costs will need to be applied to the following aspects of willow establishment:
Plough, Spray & Plant willow cuttings (once off)
Maintenance i.e. fertiliser, spray, spread sludge (ongoing basis)
Initial Coppice (1 year after planting)
Harvest (every 2-3 years after initial coppice)
Chipping (every 2-3 years after initial coppice)
Drying (every 2-3 years after initial coppice)
Transport
Other Uses
It has been noted that Willow cultivation is ideal for bioremediation due to its high water adsorption
shallow roots and many of the physical characteristics of the plant. The treatment of wastes in this
way can also help to improve the economic viability of willow.
Grain
Grain can be burned in a stand-alone stove and also used in conjunction with other feedstocks in the
AD process or in a boiler. In 2007, Ireland had 167,700 hectares of Barley planted (yielding approx.
1,141,765 tonnes), 84,400 hectares of wheat planted ((yielding approx. 801,800 tonnes), and 19,700
hectares of oats planted ((yielding approx. 139,870 tonnes).102
Grain prices are rising at present and it has been brought into question whether it is still economically
viable to use wheat in the production of bioethanol103
. The CSO Cereal Supply Balance statistics for
2009/2010 show that Ireland’s cereals demand did not meet supply, Ireland is only 77% self-sufficient
in cereal production overall and only 57% in wheat production with 690 kilo-tonnes produced and
1,210 kilo-tonnes consumed. Thus, as a net importer, further planting or further imports would be
needed to support the bioenergy industry104
.
Costs of Production
Table 0-6 Cost breakdown of Grain per Hectare
Crops
(Costs in €/ha)
Wheat
(Feed
Winter)
Barley
(Feed
Winter)
Malting
Barley
Oats
(Feed
Winter)
Oilseed
Rape
(Winter)
Oilseed
Rape
(Spring)
Beet Potatoes
Material costs 748 601 469 588 604 377 1012 2511
102 Co-firing Current Issues, Presentation by Barry Caslin, Teagasc 2009 103
Rory Deverell (UCD PhD)- The BRC Energy and commodities bulletin, Sep 2007
http://www.irbea.org/files/brc_ecb_sep071.pdf
104 CSO Cereal supply Balance http://www.cso.ie/releasespublications/documents/agriculture/current/csb.pdf

The Economic Benefits of the Development of
Bioenergy in Ireland
68
Machinery hire 429 393 375 393 466 430 633 2134
Miscellaneous 91 79 60 79 57 33 425 328
Total € / ha 1268 1073 904 1060 1127 840 2070 4973
tonne/ha
(to cover costs) 7.9 7.2 5.3 7.1 2.8 2.1 51.8 22.6
Net Price €/tonne 160 150 170 150 400 400 40 220
Source: Teagasc – Crops Costs and Returns 2011
Contractor charges are used to estimate machinery costs. Assumed yields are the mean national
yields for the 5-year period 1999-2003, with the exception of rape where separate winter and spring
crop yields are not available. Estimates of overhead costs of farms where arable crops are the main
enterprise are given below. The margin for the farmer follows from the difference between market
price and area aid and variable plus overhead costs.
Other Uses
The straw by-products from grain production can also be used in bioenergy production.
Grass
Growing Cycles
Forage grass is a perennial crop and it does not require rotation, so can be harvested annually or bi-
annually. The advantages of grass/silage as a bioenergy fuel are that farmers are well accustomed to
grass cultivation and it does not lessen the quality of arable land. It is suitable for Anaerobic
Digestion.
Silage is forage biomass harvested and fermented for use as winter fodder for cattle and sheep.
Grass silage is harvested in the summer and stored anaerobically in a silage clamp under plastic
sheeting, or in a silo. Although silage is primarily produced as a feed, excess production can also be
suitable as a biomass.
A. Singh et al. (2010) estimate that the surplus grass available in Ireland has the potential to generate
47.58 PJ per annum of energy or a more practical estimate of 11.9 PJ with 25% of the land resource
available being exploited. They further discuss that based on a grass silage yield of 12 tonnes of dry
solids/ha/a and with a potential of 97,000 ha of grass up to 650 grass digesters could be installed in
Ireland.
For the purposes of the technical model, grass silage is assumed to have a methane output of 64
m3/t.
Cost of Production
The operating costs for a farmer for silage production are estimated at €17 per tonne105
.
Grazed Grass is likely to continue to be the cheapest fodder at about €45/tonne dry matter (DM)
utilised. It has the advantage of producing very good yields in most locations and of course is
extremely convenient to produce and utilise.
105 Grass as a source of renewable Gaseous Fuel , Cost of Biomethane – Dr. Jerry D Murphy Biofuels Research
Group ERI

The Economic Benefits of the Development of
Bioenergy in Ireland
69
Grass Silage: First cut grass silage can be produced at reasonable costs - approximately €120/tonne
DM utilised. Grass silage costs vary considerably depending on yields. Second and third cut silage
are more expensive forms of fodder (circa €135/t) where machinery has to be hired. Moreover, the
variability in yield and quality of second and third cut silage has forced many farmers to consider
alternatives such as maize, whole crop wheat and fodder beet.106
Bioenergy Materials
Municipal solid waste (MSW)
Municipal solid waste (MSW), food processing waste, and sewage sludge – all of these wastes can
be converted to energy. The organic fraction of MSW is collected from households and commercial
premises etc. With EU regulations influencing the treatment of waste, increased amounts of wastes
are available as a source of affordable biomass fuel.
The organic fraction of MSW can be used to produce energy through anaerobic digestion and
combustion. Irish legislation aims to remove the biodegradable fraction of MSW from landfill so it is an
ideal source of renewable energy.
Organic Fraction municipal solid waste (OFMSW) is made up of commercial food waste & brown bin
household collections. This material can also be used to produce bioenergy. The main difference
between OFMSW and MSW is the output product. The output from OFMSW, digestate, compost etc.
can be used as a product; however the output from MSW is limited in its use to land reclamation or
deposition in landfill void.
In general, this feedstock is available free of charge or in some cases a gate fee can be charged by
the facility operator. However it is anticipated that as more infrastructure is put in place, a greater
demand for SSOF will be realised which may result in this feedstock commanding a price to facility
owners.
For the purposes of the technical model, OFMSW is assumed to have a biogas output of 125 m3/t with
a methane content of 65%.
Landfill Gas
Landfill gas (LFG) can be collected and processed to be used as a biogas; however The Biomass
Action Plan sees the “mechanical biological treatment of fully stabilised residue to landfill as a last
resort.”
Wells are usually dug into the landfill and the gas is collected through perforated pipes. The use of
landfill gas is very popular on landfill site as the expulsion of the gas into the atmosphere is strictly
controlled so it is highly efficient to extract the gas to use in energy production. The gas requires an
amount of cleaning before being sent to the grid which can be expensive.
It is anticipated this source of gas will reduce over the coming years due to the EPA limits on
biodegrade content of materials into landfill.
Municipal Sewage Sludge
106 Teagasc, Crops Costs and Returns, 2011

The Economic Benefits of the Development of
Bioenergy in Ireland
70
Sewage sludge is a by-product of wastewater treatment. The anaerobic digestion of sewage sludge is
carried out in tanks that typically are heated to accelerate the digestion process over a period of 15 -
20 days. The biogas product can be used to fuel combined heat and power (CHP) schemes at the
treatment works, where it is burned in modified engines or gas turbines to generate electricity, and the
heat recovered from the engines is used to maintain the digestion tanks at the required operating
temperature of about 35ºC. At smaller sites, the gas may be burned directly to heat the digestion
tanks, with any excess gas being flared.
For the purposes of the technical model, municipal sewage sludge is assumed to have a biogas
output of 25 Nm3/tonne, with 65 % methane content.
Agricultural residues & Agri-food effluents
There are a wide range of feedstocks available from agricultural and food industry by-products.
Agricultural residues e.g. animal slurry and manure, chicken litter, spent mushroom compost and
straw. Disposal of some of these residues poses an environmental problem. Wet wastes such as
cattle and pig manure are suitable for anaerobic digestion, while wastes with a lower moisture content
e.g. chicken litter and spent mushroom compost can be combusted.
Other agricultural residues include manures and animal by-products (ABP) i.e. tallow and meat and
bone meal (MBM), these can be used for energy production. Furthermore by-products from
production and food services, e.g. municipal food, recovered vegetable oil (RVO) and used cooking
oil, can be used. Tallow and RVO can be used in the production of transport fuels while some
agrifood wastes can be used to produce biogas by anaerobic digestion.
The feasible resource for dry agricultural residues is estimated to be 80,000 – 320,000 tonnes per
annum for straw, 50,000 – 80,000 tonnes per annum for poultry litter and 92,500 tonnes per annum
for Spent Mushroom Compost (SMC) 107
.
Agricultural residues such as animal slurry and litter have a cost associated with their disposal;
however the main concern with the use of straw for bioenergy is that it can be used on farm for other
processes such as animal bedding. While straw is unlikely to be purposely cultivated for use in
bioenergy production it is a by-product of other agricultural processes. Further estimates of straw
available from grain production are shown in the table below.
Table 0-7 Tonnes of straw by-products from grain
Type Straw price/ha
hectares t/straw/ha t/grain/ha t/straw total
W. wheat €75 85,400 4.7 9.8 401,380
S. wheat €80 42,300 3.8 6.6 160,740
W. Barley €95 21,100 3.8 8.5 80,180
S. Barley €95 114,000 3.2 6.7 364,800
W. Oats €75 18,024 4 8.0 72,096
S. Oats €75 4,083 3.2 6.0 13,065
Source: Co-firing Current Issues – Presentation by Barry Caslin Teagasc, FEB 2009
Animal Manures
107 An Assessment of the Renewable Energy Resource Potential of Dry Agricultural Residues in Ireland
(Compiled by RPS MCOS on behalf of SEI, 2003)

The Economic Benefits of the Development of
Bioenergy in Ireland
71
Wet and dry animal manures (collectable) and poultry litter are very versatile and can be used for
smaller domestic installations, as well as for larger district heating schemes. Generally manures are
used to produce biogas by a process of anaerobic digestion, but poultry litters can also use a
Fluidised Bed Combustion (FBM) system to produce localised energy. Estimates for the amount of
animal manures available and the biogas and energy potential of each are shown in the table
overleaf.
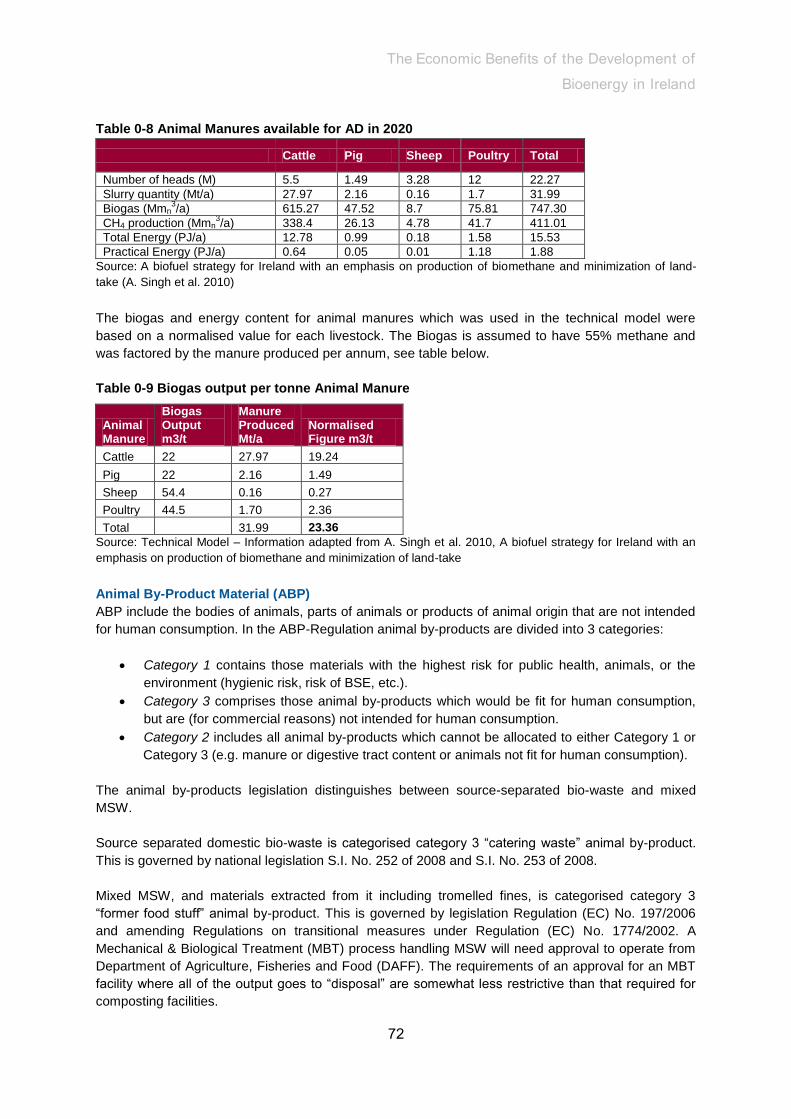
The Economic Benefits of the Development of
Bioenergy in Ireland
72
Table 0-8 Animal Manures available for AD in 2020
Cattle Pig Sheep Poultry Total
Number of heads (M) 5.5 1.49 3.28 12 22.27
Slurry quantity (Mt/a) 27.97 2.16 0.16 1.7 31.99
Biogas (Mmn3/a) 615.27 47.52 8.7 75.81 747.30
CH4 production (Mmn3/a) 338.4 26.13 4.78 41.7 411.01
Total Energy (PJ/a) 12.78 0.99 0.18 1.58 15.53
Practical Energy (PJ/a) 0.64 0.05 0.01 1.18 1.88
Source: A biofuel strategy for Ireland with an emphasis on production of biomethane and minimization of land-
take (A. Singh et al. 2010)
The biogas and energy content for animal manures which was used in the technical model were
based on a normalised value for each livestock. The Biogas is assumed to have 55% methane and
was factored by the manure produced per annum, see table below.
Table 0-9 Biogas output per tonne Animal Manure
Animal Manure
Biogas Output m3/t
Manure Produced Mt/a
Normalised Figure m3/t
Cattle 22 27.97 19.24
Pig 22 2.16 1.49
Sheep 54.4 0.16 0.27
Poultry 44.5 1.70 2.36
Total 31.99 23.36
Source: Technical Model – Information adapted from A. Singh et al. 2010, A biofuel strategy for Ireland with an
emphasis on production of biomethane and minimization of land-take
Animal By-Product Material (ABP)
ABP include the bodies of animals, parts of animals or products of animal origin that are not intended
for human consumption. In the ABP-Regulation animal by-products are divided into 3 categories:
Category 1 contains those materials with the highest risk for public health, animals, or the
environment (hygienic risk, risk of BSE, etc.).
Category 3 comprises those animal by-products which would be fit for human consumption,
but are (for commercial reasons) not intended for human consumption.
Category 2 includes all animal by-products which cannot be allocated to either Category 1 or
Category 3 (e.g. manure or digestive tract content or animals not fit for human consumption).
The animal by-products legislation distinguishes between source-separated bio-waste and mixed
MSW.
Source separated domestic bio-waste is categorised category 3 “catering waste” animal by-product.
This is governed by national legislation S.I. No. 252 of 2008 and S.I. No. 253 of 2008.
Mixed MSW, and materials extracted from it including tromelled fines, is categorised category 3
“former food stuff” animal by-product. This is governed by legislation Regulation (EC) No. 197/2006
and amending Regulations on transitional measures under Regulation (EC) No. 1774/2002. A
Mechanical & Biological Treatment (MBT) process handling MSW will need approval to operate from
Department of Agriculture, Fisheries and Food (DAFF). The requirements of an approval for an MBT
facility where all of the output goes to “disposal” are somewhat less restrictive than that required for
composting facilities.

The Economic Benefits of the Development of
Bioenergy in Ireland
73
The biogas and energy content for slaughter waste which was used in the technical model were
based on a normalised value for each livestock. The Biogas is assumed to have 55% methane and
was factored by the Mtonnes available per annum.
Table 0-10 Biogas Output per tonne Slaughter Waste
Slaughter Waste
Biogas Output m3/t
Mtonnes Available
Normalised Figure m3/t
Cattle 156 0.33 120.85
Pig 156 0.07 25.63
Sheep 156 0.02 7.32
Poultry 112 0.01 1.58
Sum 0.43 155.38
Source: Technical Model – Information adapted from A. Singh et al. 2010, A biofuel strategy for Ireland with an
emphasis on production of biomethane and minimization of land-take
Anaerobic Digestion Feedstock
The quantities of AD feedstock which were used in the technical model are shown in the table below.
The figures are predicted to 2020 and a factor of practical available feedstock for AD was applied.
Table 0-11 Practical available AD feedstocks in 2020
Mt Total Feedstock in 2020
% Practical
Tonnes Practical Feedstock in 2020
Slurry Cow 27.97 2 0.559
Pig 2.16 5 0.108
Sheep 0.16 50 0.080
Poultry 1.7 75 1.275
Slurry Total 2,000,000
Surplus Grass 5.85 25 1,500,000
OFMSW 0.87 50 435,000
Slaughter Waste 0.42 50 210,000
Source: Technical Model – Information adapted from A. Singh et al. 2010, A biofuel strategy for Ireland with an
emphasis on production of biomethane and minimization of land-take
Tallow
This is animal fat of variable quality. Previously, much of this would have been used for animal feed
production, but with restrictions regarding the use of bovine offal due to BSE, increased quantities are
available for alternative use. Investigation of the possibility of using tallow as a biofuel has been
conducted at Teagasc. While further research is required, indications are that tallow can be used in
small quantities in blends with waste vegetable oil and camelina.
The SEAI resource study on the potential of Tallow as a biofuel found that in 2003 there was a
possible 21,900 tonnes of tallow available. They also predicted that availability would fall towards
2020 with potential resources amounting to 20,000 tonnes and 17,600 tonnes in 2010 and 2020
respectively. This estimated drop in tallow availability for biofuel production is linked to the predicted
slowdown in livestock production in Ireland.
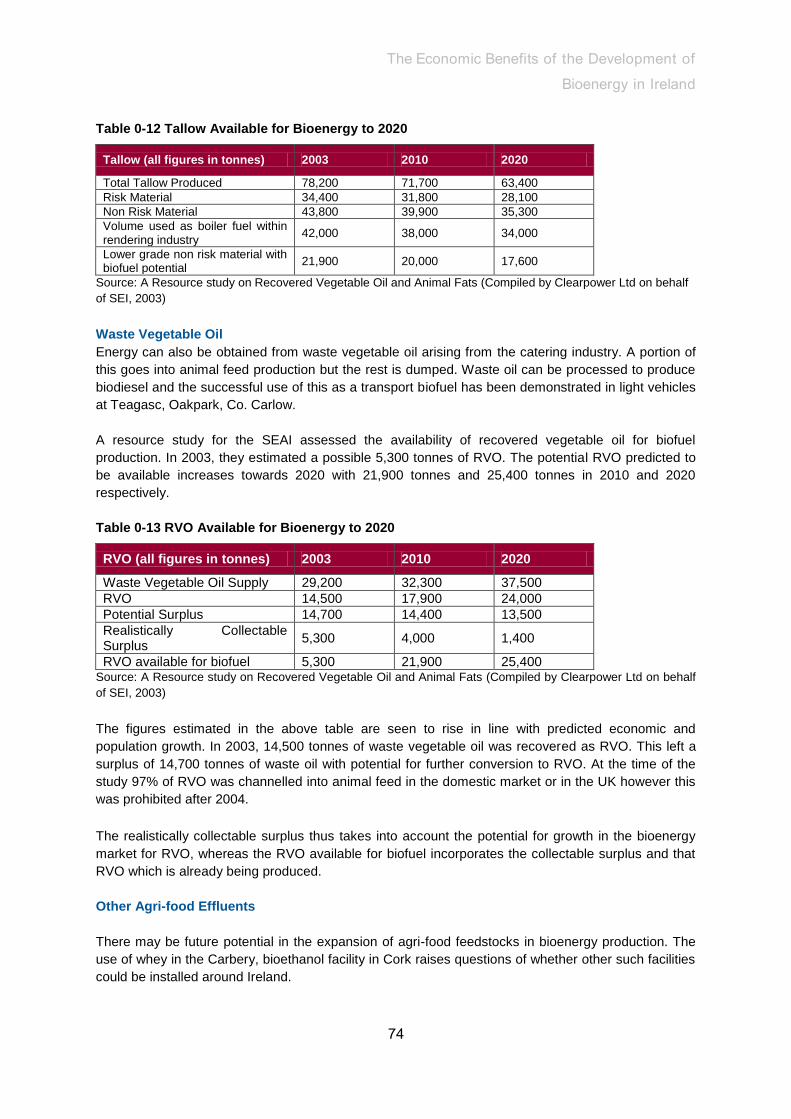
The Economic Benefits of the Development of
Bioenergy in Ireland
74
Table 0-12 Tallow Available for Bioenergy to 2020
Tallow (all figures in tonnes) 2003 2010 2020
Total Tallow Produced 78,200 71,700 63,400
Risk Material 34,400 31,800 28,100
Non Risk Material 43,800 39,900 35,300
Volume used as boiler fuel within rendering industry
42,000 38,000 34,000
Lower grade non risk material with biofuel potential
21,900 20,000 17,600
Source: A Resource study on Recovered Vegetable Oil and Animal Fats (Compiled by Clearpower Ltd on behalf
of SEI, 2003)
Waste Vegetable Oil
Energy can also be obtained from waste vegetable oil arising from the catering industry. A portion of
this goes into animal feed production but the rest is dumped. Waste oil can be processed to produce
biodiesel and the successful use of this as a transport biofuel has been demonstrated in light vehicles
at Teagasc, Oakpark, Co. Carlow.
A resource study for the SEAI assessed the availability of recovered vegetable oil for biofuel
production. In 2003, they estimated a possible 5,300 tonnes of RVO. The potential RVO predicted to
be available increases towards 2020 with 21,900 tonnes and 25,400 tonnes in 2010 and 2020
respectively.
Table 0-13 RVO Available for Bioenergy to 2020
RVO (all figures in tonnes) 2003 2010 2020
Waste Vegetable Oil Supply 29,200 32,300 37,500
RVO 14,500 17,900 24,000
Potential Surplus 14,700 14,400 13,500
Realistically Collectable Surplus
5,300 4,000 1,400
RVO available for biofuel 5,300 21,900 25,400 Source: A Resource study on Recovered Vegetable Oil and Animal Fats (Compiled by Clearpower Ltd on behalf
of SEI, 2003)
The figures estimated in the above table are seen to rise in line with predicted economic and
population growth. In 2003, 14,500 tonnes of waste vegetable oil was recovered as RVO. This left a
surplus of 14,700 tonnes of waste oil with potential for further conversion to RVO. At the time of the
study 97% of RVO was channelled into animal feed in the domestic market or in the UK however this
was prohibited after 2004.
The realistically collectable surplus thus takes into account the potential for growth in the bioenergy
market for RVO, whereas the RVO available for biofuel incorporates the collectable surplus and that
RVO which is already being produced.
Other Agri-food Effluents
There may be future potential in the expansion of agri-food feedstocks in bioenergy production. The
use of whey in the Carbery, bioethanol facility in Cork raises questions of whether other such facilities
could be installed around Ireland.
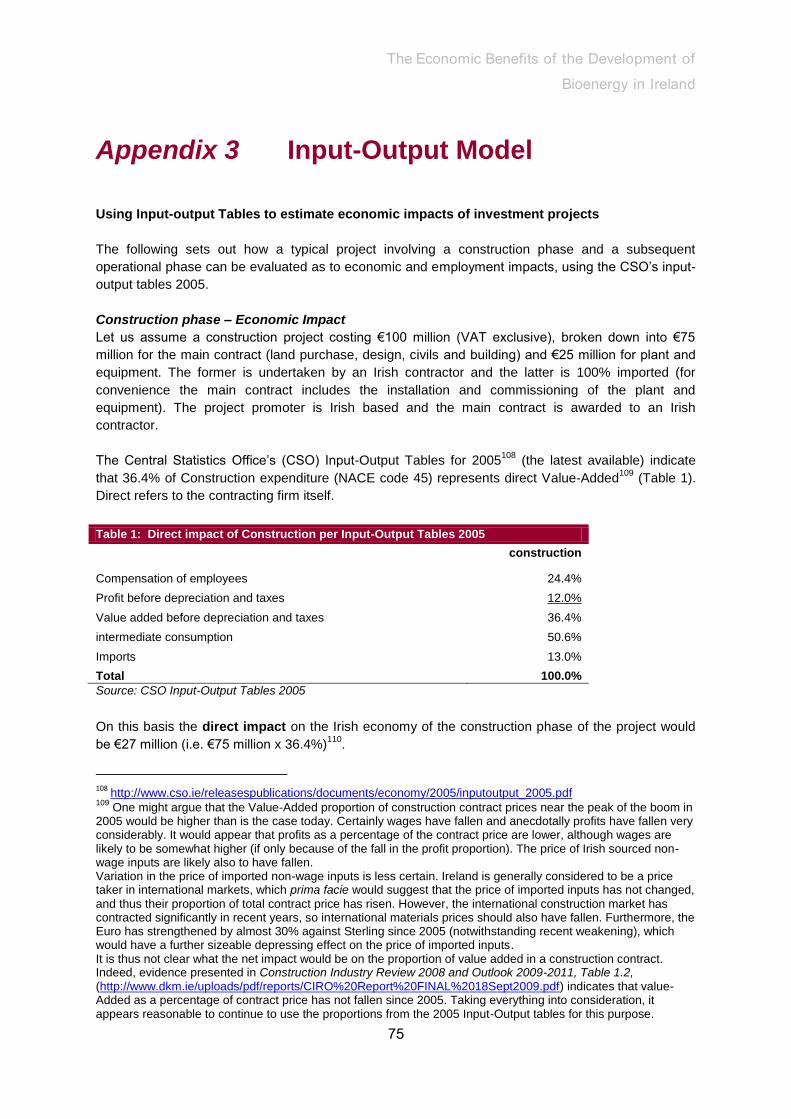
The Economic Benefits of the Development of
Bioenergy in Ireland
75
Appendix 3 Input-Output Model Using Input-output Tables to estimate economic impacts of investment projects
The following sets out how a typical project involving a construction phase and a subsequent
operational phase can be evaluated as to economic and employment impacts, using the CSO’s input-
output tables 2005.
Construction phase – Economic Impact
Let us assume a construction project costing €100 million (VAT exclusive), broken down into €75
million for the main contract (land purchase, design, civils and building) and €25 million for plant and
equipment. The former is undertaken by an Irish contractor and the latter is 100% imported (for
convenience the main contract includes the installation and commissioning of the plant and
equipment). The project promoter is Irish based and the main contract is awarded to an Irish
contractor.
The Central Statistics Office’s (CSO) Input-Output Tables for 2005108
(the latest available) indicate
that 36.4% of Construction expenditure (NACE code 45) represents direct Value-Added109
(Table 1).
Direct refers to the contracting firm itself.
Table 1: Direct impact of Construction per Input-Output Tables 2005
construction
Compensation of employees 24.4%
Profit before depreciation and taxes 12.0%
Value added before depreciation and taxes 36.4%
intermediate consumption 50.6%
Imports 13.0%
Total 100.0%
Source: CSO Input-Output Tables 2005
On this basis the direct impact on the Irish economy of the construction phase of the project would
be €27 million (i.e. €75 million x 36.4%)110
.
108
http://www.cso.ie/releasespublications/documents/economy/2005/inputoutput_2005.pdf 109
One might argue that the Value-Added proportion of construction contract prices near the peak of the boom in 2005 would be higher than is the case today. Certainly wages have fallen and anecdotally profits have fallen very considerably. It would appear that profits as a percentage of the contract price are lower, although wages are likely to be somewhat higher (if only because of the fall in the profit proportion). The price of Irish sourced non-wage inputs are likely also to have fallen. Variation in the price of imported non-wage inputs is less certain. Ireland is generally considered to be a price taker in international markets, which prima facie would suggest that the price of imported inputs has not changed,
and thus their proportion of total contract price has risen. However, the international construction market has contracted significantly in recent years, so international materials prices should also have fallen. Furthermore, the Euro has strengthened by almost 30% against Sterling since 2005 (notwithstanding recent weakening), which would have a further sizeable depressing effect on the price of imported inputs. It is thus not clear what the net impact would be on the proportion of value added in a construction contract. Indeed, evidence presented in Construction Industry Review 2008 and Outlook 2009-2011, Table 1.2, (http://www.dkm.ie/uploads/pdf/reports/CIRO%20Report%20FINAL%2018Sept2009.pdf) indicates that value-Added as a percentage of contract price has not fallen since 2005. Taking everything into consideration, it appears reasonable to continue to use the proportions from the 2005 Input-Output tables for this purpose.

The Economic Benefits of the Development of
Bioenergy in Ireland
76
The Input-Output Tables for 2005 also allow us to estimate the direct plus indirect impact combined,
by analysing all expenditure back through the supply chain (Table 2). Indirect impact relates to the
Irish suppliers of the contractor.
Table 2: GDP Impact of Expenditure in Construction Sector (Direct & Indirect
Impacts Combined)
NACE Code 45
Construction
Compensation of employees 42.2%
Net operating surplus 24.4%
Consumption of fixed capital 4.7%
Taxes less subsidies 2.1%
Value added before depreciation and taxes 73.5%
Imports 26.5%
Total 100.0%
Source: CSO Input-Output Tables 2005, Leontief Inverse of domestic product flows
All the expenditure, with the exception of imports, adds to GNP in Ireland (including taxes and
subsidies for convenience). Thus, for €75 million for the main contract, the direct and indirect impact
combined on Irish GDP can be estimated as €55 million (€75 million x (1-.265).
Given that the direct impact is €27 million, this implies that the indirect impact is €28 million.
There will also be an induced impact, as part of this €55 million is spent in shops and other
businesses elsewhere in the Irish economy. To calculate the induced effect we must strip out imports
and savings from consumption.
The savings ratio at the moment in Ireland is estimated at 10.6%111
. While this is high by historical
standards, it reflects current economic difficulties and debt deleveraging by households and
businesses. We take the import content of consumption as equal to the import content of the
manufacturing sector per the Input-Output Tables, i.e. 57.6%. Thus, of the additional expenditure in
the economy, the first round of the induced effect equals
1 x (1 - 0.106) x (1 - 0.576) = 38%
The second induced round represents 38% of 38%, and so on. Accumulating the rounds gives a full
induced figure of 61%. Applying this to the direct and indirect impact of €55 million gives an induced
impact of €34 million (€55 million x 61%).
Thus the total direct, indirect and induced impacts on the Irish economy of the construction
element of the project equal €89 million (€27 million + €28 million + €34 million).
110
Based on the weighted average for NACE codes 10 – 37, including depreciation in value added as we are
measuring Gross Domestic Product or Gross Value Added (as opposed to Net Domestic Product or Net Value Added). For convenience taxes and subsidies are also included. Strictly speaking we should strip out taxes, and then include the propensity to consume by the Government as these taxes are spent. However, for convenience we include them in our measure of Values Added, which amounts to assuming that the propensity to consume Irish goods and services by consumers and by the State is the same. 111
ESRI Quarterly Economic Commentary Summer 2011, p.19.

The Economic Benefits of the Development of
Bioenergy in Ireland
77
In 2011 Irish GNP is estimated at €127 billion112
, which implies that the construction phase of the
project presented here will add 0.07% to national GDP (€89 million ÷ €127 billion, on the basis that all
of the construction occurs in one year).
Operational Phase – Economic Impact
We are concerned here with the economic impacts of the operational phase of projects in the biomass
sector. The methodology is similar to evaluating the construction phase.
Let us assume for sake of argument that the project has an output value (i.e. sales or turnover) of €10
million per annum VAT exclusive. The estimated value added from this would depend on the sector in
the Input-output tables that most closely matches the actual sector in question.
Table 3 overleaf sets out the direct impacts (i.e. those impacts generated directly by the operator of
the facility in question) for a range of sectors. Thus, for example, a project that was most closely
related to agriculture would generate €3.67 million of direct value added for every €10 million of
turnover, while in a sector most closely related to recycling the figure would be €2.6 million.
Using the same methodology as above, we can also use the input-output tables to generate the
combined direct, indirect (in Irish suppliers of the project operator), induced (as the direct and indirect
value added is spent in the wider economy) for a project with an annual turnover of €10 million in the
relevant sectors (Table 4 overleaf). Again, taking the example of a project most closely related to
agriculture, the total economic impact of a project with a turnover of €10 million per annum would be
€10.7 million per annum.
Construction phase – Employment Impact
As with the impact on GDP, the employment impacts can be considered under the direct, indirect and
induced headings.
A recent study by the Construction Industry Council113
estimates that on average:
100 work years (i.e., employment for 100 persons for one year) are generated for every €10 million spent on construction in Ireland.
This splits into a direct and indirect impact (i.e. in the construction firms building the development and in their Irish suppliers respectively), in the ratio 71:29.
A further 40 work years are generated through the induced impact for every €10 million spent.
The estimate of 100 work years per €10 million spent is an average over a wide range of construction contracts, varying from approximately 80 for a civil engineering contract to 128 for an office block. On this basis, the direct, indirect and induced employment impacts of a construction project costing €75 million can be summarised as per Table 5 overleaf.
112
ESRI QEC Summer 2011, p.4. 113
Construction Industry Council (2009), Submission to the Government by Construction Industry Council Jobs
and Infrastructure – A Plan for National Recovery. http://www.scs.ie/press_submissions/submissions_files/29-04-
09-CIC-Submission-to-Government.pdf.

The Economic Benefits of the Development of Bioenergy in Ireland
78
Table 3: Direct Economic impact of Operational Phase in Various sectors per Input-Output Tables 2005
NACE Code 1-5 10-13 14 20 23, 36 37 40 90 10-37
Sector Agriculture, forestry
and fishing
Coal, peat, petroleum and metal
ore extraction
Other mining
and quarrying
Wood and wood
products (excl
furniture)
Petroleum and other
manufacturing products
Recycling
Electricity and
gas
Sewage and refuse
disposal services
manufacturing
Compensation of employees 6.4% 21.3% 8.9% 19.9% 12.8% 12.7% 14.1% 16.7% 0.0%
Profit before depreciation and taxes 30.3% 20.4% 3.8% 15.9% 4.3% 13.3% 21.5% 6.7% 29.3% Value added before depreciation & taxes
36.7% 41.7% 12.6% 35.8% 17.1% 26.0% 35.6% 23.3% 29.3% intermediate consumption
45.0% 42.3% 80.5% 43.1% 26.4% 35.3% 40.3% 68.4% 19.8% Imports
18.3% 16.0% 6.9% 21.1% 56.5% 38.6% 24.1% 8.2% 50.9% Total
100.0% 100.0% 100.0% 100.0% 100.0% 100.0% 100.0% 100.0% 100.0% Implied direct value added for a turnover of €10m €3.67 €4.17 €1.26 €3.58 €1.71 €2.60 €3.56 €2.33 €2.93
Source: CSO Input-Output Tables 2005
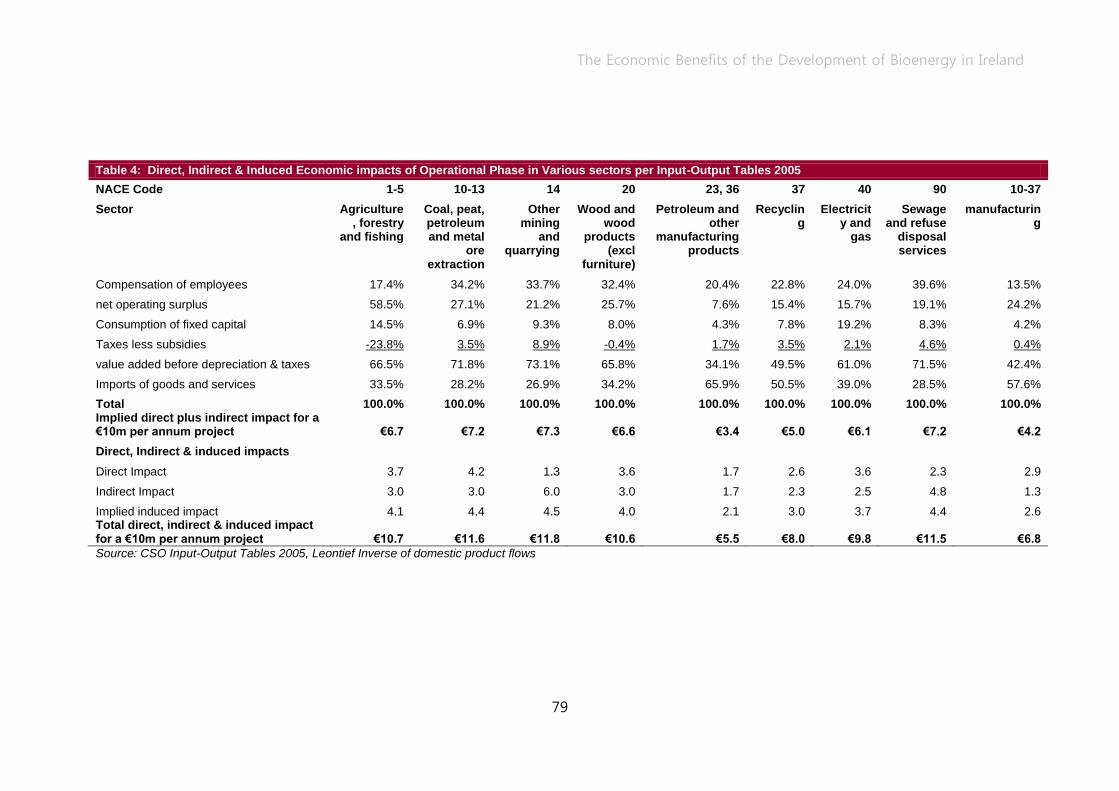
The Economic Benefits of the Development of Bioenergy in Ireland
79
Table 4: Direct, Indirect & Induced Economic impacts of Operational Phase in Various sectors per Input-Output Tables 2005
NACE Code 1-5 10-13 14 20 23, 36 37 40 90 10-37
Sector Agriculture, forestry
and fishing
Coal, peat, petroleum and metal
ore extraction
Other mining
and quarrying
Wood and wood
products (excl
furniture)
Petroleum and other
manufacturing products
Recycling
Electricity and
gas
Sewage and refuse
disposal services
manufacturing
Compensation of employees 17.4% 34.2% 33.7% 32.4% 20.4% 22.8% 24.0% 39.6% 13.5%
net operating surplus 58.5% 27.1% 21.2% 25.7% 7.6% 15.4% 15.7% 19.1% 24.2%
Consumption of fixed capital 14.5% 6.9% 9.3% 8.0% 4.3% 7.8% 19.2% 8.3% 4.2%
Taxes less subsidies -23.8% 3.5% 8.9% -0.4% 1.7% 3.5% 2.1% 4.6% 0.4%
value added before depreciation & taxes 66.5% 71.8% 73.1% 65.8% 34.1% 49.5% 61.0% 71.5% 42.4%
Imports of goods and services 33.5% 28.2% 26.9% 34.2% 65.9% 50.5% 39.0% 28.5% 57.6%
Total 100.0% 100.0% 100.0% 100.0% 100.0% 100.0% 100.0% 100.0% 100.0% Implied direct plus indirect impact for a €10m per annum project €6.7 €7.2 €7.3 €6.6 €3.4 €5.0 €6.1 €7.2 €4.2
Direct, Indirect & induced impacts
Direct Impact 3.7 4.2 1.3 3.6 1.7 2.6 3.6 2.3 2.9
Indirect Impact 3.0 3.0 6.0 3.0 1.7 2.3 2.5 4.8 1.3
Implied induced impact 4.1 4.4 4.5 4.0 2.1 3.0 3.7 4.4 2.6 Total direct, indirect & induced impact for a €10m per annum project €10.7 €11.6 €11.8 €10.6 €5.5 €8.0 €9.8 €11.5 €6.8
Source: CSO Input-Output Tables 2005, Leontief Inverse of domestic product flows
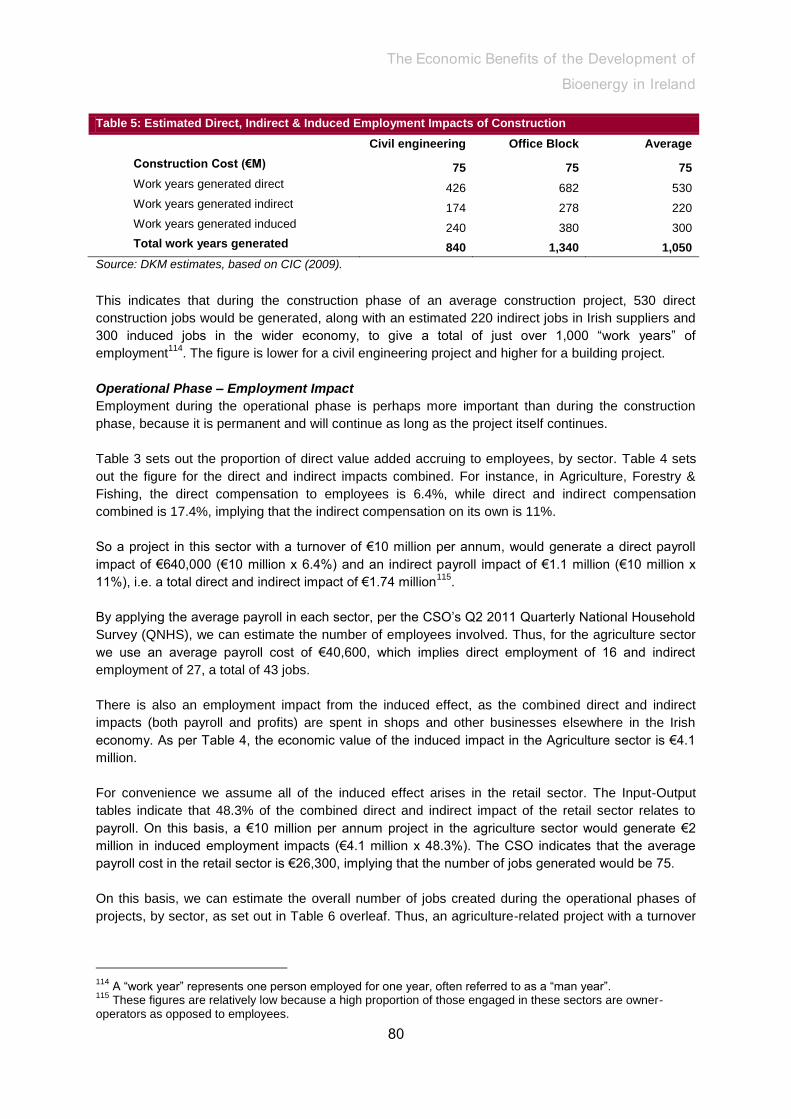
The Economic Benefits of the Development of
Bioenergy in Ireland
80
Table 5: Estimated Direct, Indirect & Induced Employment Impacts of Construction
Civil engineering Office Block Average
Construction Cost (€M) 75 75 75
Work years generated direct 426 682 530
Work years generated indirect 174 278 220
Work years generated induced 240 380 300
Total work years generated 840 1,340 1,050
Source: DKM estimates, based on CIC (2009).
This indicates that during the construction phase of an average construction project, 530 direct
construction jobs would be generated, along with an estimated 220 indirect jobs in Irish suppliers and
300 induced jobs in the wider economy, to give a total of just over 1,000 “work years” of
employment114
. The figure is lower for a civil engineering project and higher for a building project.
Operational Phase – Employment Impact
Employment during the operational phase is perhaps more important than during the construction
phase, because it is permanent and will continue as long as the project itself continues.
Table 3 sets out the proportion of direct value added accruing to employees, by sector. Table 4 sets
out the figure for the direct and indirect impacts combined. For instance, in Agriculture, Forestry &
Fishing, the direct compensation to employees is 6.4%, while direct and indirect compensation
combined is 17.4%, implying that the indirect compensation on its own is 11%.
So a project in this sector with a turnover of €10 million per annum, would generate a direct payroll
impact of €640,000 (€10 million x 6.4%) and an indirect payroll impact of €1.1 million (€10 million x
11%), i.e. a total direct and indirect impact of €1.74 million115
.
By applying the average payroll in each sector, per the CSO’s Q2 2011 Quarterly National Household
Survey (QNHS), we can estimate the number of employees involved. Thus, for the agriculture sector
we use an average payroll cost of €40,600, which implies direct employment of 16 and indirect
employment of 27, a total of 43 jobs.
There is also an employment impact from the induced effect, as the combined direct and indirect
impacts (both payroll and profits) are spent in shops and other businesses elsewhere in the Irish
economy. As per Table 4, the economic value of the induced impact in the Agriculture sector is €4.1
million.
For convenience we assume all of the induced effect arises in the retail sector. The Input-Output
tables indicate that 48.3% of the combined direct and indirect impact of the retail sector relates to
payroll. On this basis, a €10 million per annum project in the agriculture sector would generate €2
million in induced employment impacts (€4.1 million x 48.3%). The CSO indicates that the average
payroll cost in the retail sector is €26,300, implying that the number of jobs generated would be 75.
On this basis, we can estimate the overall number of jobs created during the operational phases of
projects, by sector, as set out in Table 6 overleaf. Thus, an agriculture-related project with a turnover
114
A “work year” represents one person employed for one year, often referred to as a “man year”. 115
These figures are relatively low because a high proportion of those engaged in these sectors are owner-operators as opposed to employees.

The Economic Benefits of the Development of
Bioenergy in Ireland
81
of €10 million per annum would generate permanent employment for 117 persons throughout the
economy, made up 16 direct jobs, 27 indirect jobs and 74 induced jobs.

The Economic Benefits of the Development of Bioenergy in Ireland
82
Table 6: Direct, Indirect & Induced Employment Impact of Expenditure in various Sectors, for project with turnover of €10 million per annum
NACE Code 1-5 10-13 14 20 23, 36 37 40 90 10-37
Sector Agriculture, forestry
and fishing
Coal, peat, petroleum and metal
ore extraction
Other mining
and quarrying
Wood and
wood products
(excl furniture)
Petroleum and other
manufacturing products
Recycling
Electricity and
gas
Sewage and refuse
disposal services
Manu -facturing
Direct payroll impact (€ million) 0.64 2.13 0.89 1.99 1.28 1.27 1.41 1.67 0.00
Indirect payroll impact (€ million) 1.09 1.29 2.48 1.25 0.76 1.01 0.99 2.29 1.35
Direct plus indirect payroll impact (€ million) 1.74 3.42 3.37 3.24 2.04 2.28 2.40 3.96 1.35
Average earnings in sector (€'000 per annum) 40.6 50.4 50.4 40.6 40.6 40.6 54.6 54.6 40.6
Implied number of direct employees 16 42 18 49 32 31 26 31 0
Implied number of indirect employees 27 26 49 31 19 25 18 42 33
Implied number of direct & indirect employees 43 68 67 80 50 56 44 72 33
Induced payroll impact (€ million)* 2.0 2.1 2.2 1.9 1.0 1.5 1.8 2.1 1.2
Avg earnings in retail sector (€'000 per annum) 26.3 26.3 26.3 26.3 26.3 26.3 26.3 26.3 26.3
Implied number of induced employees 74 81 82 74 38 56 69 80 48 Total number of direct, indirect and induced employees 117 149 149 154 88 112 113 153 81
*48.3% of the induced economic impact per Table 4, based on the %age payroll in the retail sector.
Columns may not sum due to rounding.
Source: CSO Input-Output Tables 2005, earnings data Q2 2011.

The Economic Benefits of the Development of
Bioenergy in Ireland
83
Appendix 4 Glossary of Terms & Energy
Conversion Factors
Glossary of Terms
Anaerobic Digestion (AD) – is the breakdown of organic waste by bacteria in an oxygen-free
environment. The waste/feedstock is placed in an airtight container (digester) along with bacteria.
Depending on the waste and system design biogas typically contains 55-75% pure methane. This
biogas can be upgraded to fossil (“natural”) gas, which typically contains 70-96% methane. The liquid
fraction of the remaining digested feedstock can be returned to the land as a fertiliser and solid fibre
used as a soil conditioner.
Biofuel Obligation – A government obligation to ensure that fuel distributors sell a minimum of
proportion of biofuels
Co-firing – The combined burning of bioenergy feedstocks with conventional fuels e.g. wood with
peat. The government has in place a target of 30% co-firing at 3 peat stations by 2015
Combined heat and power (CHP) – or ‘cogeneration’ shall mean the simultaneous generation in one
process of thermal energy and electrical and/or mechanical energy
Combustion – This is the simplest way to produce heat energy from biomass. The heat, often in the
form of steam, can be converted to electricity and/or it can be used for heating houses and buildings.
DDGS - Distillers' Dried Grains with Solubles
District heating (DH) – is a local heating network usually facilitated through underground pipes and a
centralised heat source
Energy Demand – The total sum of the amount of energy consumers require for use. It includes
electricity, heat and transport.
EPSSU – Energy Policy Statistical Support Unit, develops national and sectoral statistics for energy
production, transmission and usage
Esterification – The process of producing biodiesel from resources such as oils and fats
Fermentation – The conventional process used in beer and wine production that can be used to
produce bioethanol from sugar and starch feedstocks
Gasification – is an advanced conversion process that offers a method of power generation with
higher efficiencies than combustion-based steam cycles. It is a process in which biomass is converted
to higher grade fuels prior to combustion. Biomass is partially oxidised at high temperatures to
produce biogas. This biogas contains a mixture of carbon monoxide, hydrogen and methane.
Incineration – see combustion
ktoe – Thousand tonnes of oil equivalent, unit of energy representing that obtained from burning one
thousand metric tonnes of oil
kWh – Kilowatt-hour
MW – Megawatt
PCRW - Post consumer recovered wood
Pyrolysis – is a means of converting solid organic material into a liquid biofuel by heating at high
temperatures in the absence of oxygen. The resulting pyrolytic or ‘bio-oil’ can be refined to products in
a manner similar to refining crude oil and can be used for electricity production in diesel engines.
Roundwood - wood in its natural state as felled, with or without bark. It may be round, split, roughly
squared or in other forms.
REFIT – Renewable Energy Feed in Tariff scheme provides monetary support and incentives to
producers of renewable electricity

The Economic Benefits of the Development of
Bioenergy in Ireland
84
Renewable Energy –means energy from renewable non-fossil sources, namely wind, solar, aerothermal, geothermal, hydrothermal and ocean energy, hydropower, biomass, landfill gas, sewage treatment plant gas and biogases RES – Renewable Energy Share
RES-E – is the renewable energy contribution to electricity, Irish target is 40%.
RES-H – is the renewable energy contribution to thermal heating, Irish target is 12%.
RES-T – is the renewable energy contribution to transport, Irish target is 10%.
SEAI – Sustainable Energy Authority of Ireland, Ireland’s national energy authority
Total Final Consumption (TFC) – is the total energy used by the final end users. It excludes that
used in the energy sector such as electricity generation or heat production.
Waste to Energy (WtE) – facilities use municipal waste as a feedstock for incineration can produce
electricity and/or heat
Conversion Factors
To: toe MWh GJ
From: Multiply by
toe 1 11.63 41.868
MWh 0.086 1 3.6
GJ 0.02388 0.2778 1
Source: SEAI website

The Economic Benefits from the Development of BioEnergy in Ireland to meet 2020 Targets Published by the Irish BioEnergy Association | February 2012 | www.irbea.iePromoting anaerobic digestion, wood fuels, biofuel and biomass since 1999