the economic and fiscal challenges of population aging · the economic and fiscal challenges of...
TRANSCRIPT
The Economic and Fiscal Challenges of Population Aging Canada will face a significant economic challenge in the coming decades. At the heart of this challenge is the gradual but inexorable increase in the average age of the popu-lation, caused mainly by a steady decline in the fertility rate. Such “population aging” is predicted to have important effects on the economy, in particular the growth rate of the labour force and real per capita income. As a result, average Canadian living stan-dards are predicted to rise significantly less quickly over the next forty years than they have over the past forty. Most other developed economies will face this same challenge in the coming decades.
The aging of the population will also have significant effects on the fiscal position of Canadian governments. On the one hand, growth in the tax base will slow due to the decline in labour-force participation. At the same time, however, the rising average age of the population will create rising demands for health-care expenditures and income-support programs designed to support the elderly. These fiscal challenges will force governments to make difficult decisions, involving restraints on expenditure growth, higher rates of taxation, and greater government borrowing.
We begin by presenting some basic demographic projections for Canada, which show how the declining fertility rate and rising life expectancy will lead to an aging of Canada’s population. We then discuss how this population aging is predicted to cause declines in the labour-force participation rate and the growth rate of average per capita income. This slowdown in per capita income (and hence in our material living stan-dards) underlines the importance of increasing the rate of productivity growth, so we briefly review some policies that might have this effect, even at some direct fiscal cost. This takes us to the final section which addresses the fiscal challenge Canadian gov-ernments will face as a result of population aging. The increased demands for health-care spending and elderly benefits will likely create fiscal tensions between the provin-cial and federal governments.
The Causes of Population Aging To begin the discussion, let’s use a simple equation showing how a country’s popula-tion changes over time. Population will increase in any given year if the births plus the net immigration (the number of new immigrants minus the number of emigrants) ex-ceeds the number of deaths,
∆Population = Births + Net Immigration – Deaths
where ∆ means “the change in.” We can divide this equation through by population to express the same relationship in terms of rates,
Population growth rate = Birth rate + Net immigration rate – Death rate (1)
1
Copyright © 2011 Pearson Canada Inc.
Changes in the three rates on the right-hand side of Equation (1) tell us not only how the population growth rate will change but also, depending on which rates are changing and by how much, how the average age of the population will change. For example, an increase in the net immigration rate, other things being equal, will clearly lead to a rise in the overall population growth rate. But depending on the age of the immigrants and emigrants, the effect on the average age of the population is unclear.
In contrast, changes in the birth rate have a clear effect on the average age. An in-crease in a country’s birth rate, other things being equal, will not only increase the population growth rate, but since people are always born at age zero, an increase in the birth rate must also decrease the average age of the population. Conversely, and more importantly for Canada’s future, a decrease in the birth rate reduces the population growth rate and increases the average age of the population.
In the discussion that follows, we focus on changes in the Canadian birth and death rates, for the simple reason that changes in the net immigration rate have played only a modest role in the changing demographic structure of the Canadian population. The two key demographic forces at play are declini g fertility and rising life expectancy. n
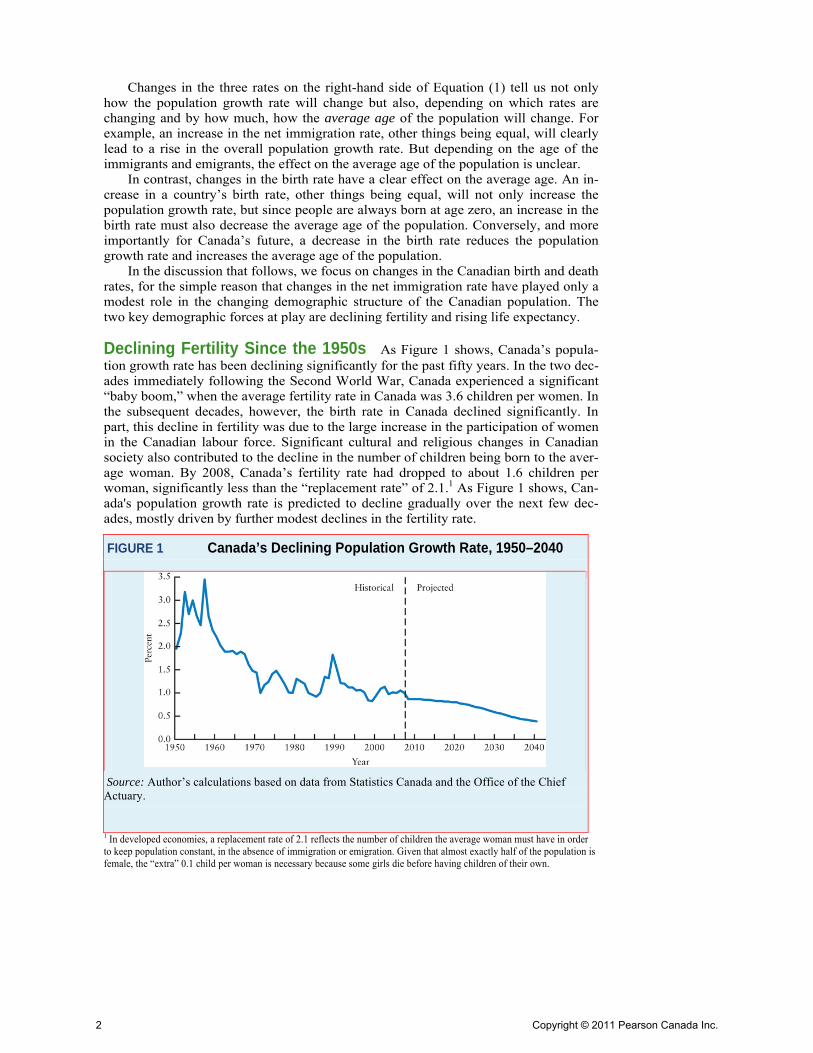
Declining Fertility Since the 1950s As Figure 1 shows, Canada’s popula-tion growth rate has been declining significantly for the past fifty years. In the two dec-ades immediately following the Second World War, Canada experienced a significant “baby boom,” when the average fertility rate in Canada was 3.6 children per women. In the subsequent decades, however, the birth rate in Canada declined significantly. In part, this decline in fertility was due to the large increase in the participation of women in the Canadian labour force. Significant cultural and religious changes in Canadian society also contributed to the decline in the number of children being born to the aver-age woman. By 2008, Canada’s fertility rate had dropped to about 1.6 children per woman, significantly less than the “replacement rate” of 2.1.1 As Figure 1 shows, Can-ada's population growth rate is predicted to decline gradually over the next few dec-ades, mostly driven by further modest declines in the fertility rate.
1 In developed economies, a replacement rate of 2.1 reflects the number of children the average woman must have in order to keep population constant, in the absence of immigration or emigration. Given that almost exactly half of the population is female, the “extra” 0.1 child per woman is necessary because some girls die before having children of their own.
FIGURE 1 Canada’s Declining Population Growth Rate, 1950–2040
Source: Author’s calculations based on data from Statistics Canada and the Office of the Chief Actuary.
2
Copyright © 2011 Pearson Canada Inc.

Increasing Life Expectancy Over the same half-century, there has been a steady but gradual increase in Canadians’ life expectancy. In 1950, the average new-born Canadian child was expected to live for 71 years, whereas today that number is 81 years. This rising life expectancy has been due partly to an increase in healthier life-styles on the part of the average Canadian—including a reduction in smoking and alco-hol consumption, modification of eating habits, and increases in regular exercise. It has also been due to improvements in medical and pharmaceutical technology that have enabled doctors to diagnose and treat illnesses and medical traumas more easily and effectively than was previously possible. For example, some cardiac surgeries that are performed on a routine basis today and that clearly extend the lives of the patients were not technologically possible even two decades ago, when patients would almost surely die from their condition.
Taken by itself, the effect of increasing life expectancy is to reduce Canada’s death rate in any given year. While it is still clearly true that each Canadian will eventually die, the fraction of Canadians dying in any given year has declined gradually over the past fifty years, from about 0.9 percent of the population in 1950 to about 0.7 percent today.
The Inevitable Aging of the Population With these two key demographic forces at play, it is inevitable that the average age of the Canadian population has been rising. A falling birth rate implies that fewer young people are entering the population, and this effect alone tends to increase the average Canadian’s age. Rising life expec-tancy implies that Canadians are growing older before they die, and this effect alone also tends to increase the average Canadian’s age. As these two forces continue, they will together drive Canada’s population aging over the next several decades.
Figure 2 shows how the fraction of the total Canadian population accounted for by seniors (65 years and over) is predicted to rise over the next three decades. This frac-
FIGURE 2 The Aging of Canada’s Population, 2005–2040
Source: Author’s calculations based on data from Statistics Canada and Office of the Chief Actuary (23rd Actuarial Report on the Canada Pension Plan).
3
Copyright © 2011 Pearson Canada Inc.
tion is currently at 14 percent and will rise inexorably with the aging of the baby-boom generation. By 2050, when most baby boomers will have died (as even the youngest members of the baby boom, born in the early 1960s, will then be 85–90 years old), the seniors’ fraction of the population is predicted to stabilize at roughly 27 percent.
equation shows that per capita output in any year is made u of thre
OP = GDP/POP, which is obviously always true. (Thus, Equ
ratio declines while the other two com
d ver long periods of time. We begin with a discussion of labour-force participation.
t usually think in terms of the E/LF ratio; they think instead in terms of the unemployment rate, which is equal to 1- (E/LF)
The Economic Challenges of Population Ag-ing As we discuss in several chapters of the textbook, a simple measure of Canadians’ av-erage material living standards is per capita real GDP—that is, the amount of output (or income) available for the average Canadian. This is measured as real GDP divided by the Canadian population (POP). The following
p e component parts:
GDP/POP = (GDP/E) × (E/LF) × (LF/POP) (2)
where E is the number of people employed and LF is the number of the people in the labour force (which is the sum of those employed and those not working but actively seeking a job). If you look carefully at Equation (2), you will notice that it is always true, by definition of the various terms; you could cancel out the Es and the LFs on the right-hand side to get GDP/P
ation (2) is an identity.) The three components on the right-hand side of Equation (2) have economic mean-
ing. The first component is the ratio of output to employment (GDP/E), a simple meas-ure of labour productivity. The second component is E/LF, which is the ratio of employment to the size of the labour force.2 The third component is LF/POP, the frac-tion of the total population that is in the labour force—this is called the labour-force participation rate. Overall, the equation shows that changes in these three separate components determine the overall change in per capita output. For example, if labour productivity rises while the other two components are constant, per capita GDP must increase. Similarly, if the labour-force participation
ponents are constant, per capita GDP must fall. In what follows, we focus on the first and third components, productivity and la-
bour-force participation, because they are most relevant to the discussion of population aging. Except for short-run cyclical fluctuations, the E/LF ratio shows no clear treno
2 Economists do no
4
Copyright © 2011 Pearson Canada Inc.
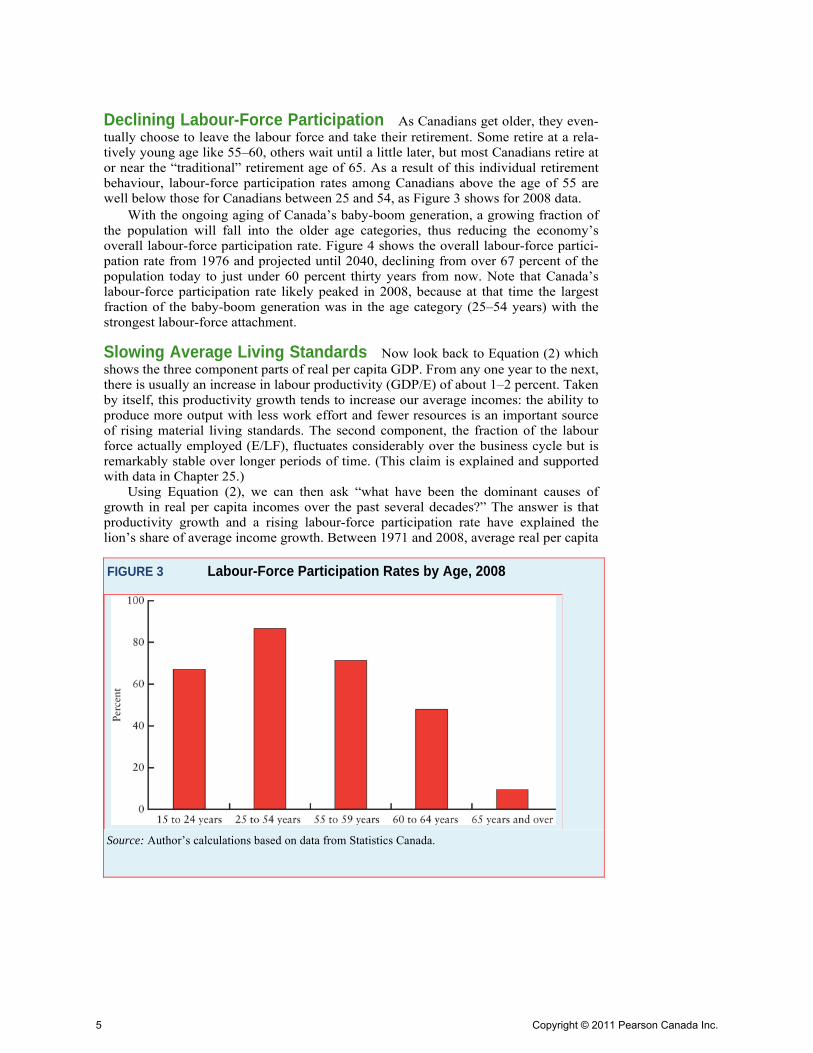
Declining Labour-Force Participation As Canadians get older, they even-tually choose to leave the labour force and take their retirement. Some retire at a rela-tively young age like 55–60, others wait until a little later, but most Canadians retire at or near the “traditional” retirement age of 65. As a result of this individual retirement behaviour, labour-force participation rates among Canadians above the age of 55 are well below those for Canadians between 25 and 54, as Figure 3 shows for 2008 data.
With the ongoing aging of Canada’s baby-boom generation, a growing fraction of the population will fall into the older age categories, thus reducing the economy’s overall labour-force participation rate. Figure 4 shows the overall labour-force partici-pation rate from 1976 and projected until 2040, declining from over 67 percent of the population today to just under 60 percent thirty years from now. Note that Canada’s labour-force participation rate likely peaked in 2008, because at that time the largest fraction of the baby-boom generation was in the age category (25–54 years) with the strongest labour-force attachment.
Slowing Average Living Standards Now look back to Equation (2) which shows the three component parts of real per capita GDP. From any one year to the next, there is usually an increase in labour productivity (GDP/E) of about 1–2 percent. Taken by itself, this productivity growth tends to increase our average incomes: the ability to produce more output with less work effort and fewer resources is an important source of rising material living standards. The second component, the fraction of the labour force actually employed (E/LF), fluctuates considerably over the business cycle but is remarkably stable over longer periods of time. (This claim is explained and supported with data in Chapter 25.)
Using Equation (2), we can then ask “what have been the dominant causes of growth in real per capita incomes over the past several decades?” The answer is that productivity growth and a rising labour-force participation rate have explained the lion’s share of average income growth. Between 1971 and 2008, average real per capita
FIGURE 3 Labour-Force Participation Rates by Age, 2008
Source: Author’s calculations based on data from Statistics Canada.
5
Copyright © 2011 Pearson Canada Inc.

income grew by 98 percent. Over the same period, labour productivity increased by 48 percent and the labour-force participation rate increased by 34 percent. In contrast, the (E/LF) component has been roughly constant. The rising labour-force participation caused by the maturing of the baby-boom generation has played a central role in raising Canadian living standards.
What does the future hold as the life-cycle of the baby-boom generation drives Canada’s population aging? Other things being equal, the future decline in the labour-force participation rate shown in Figure 4 will lead to a reduction in the growth rate of Canadian average incomes. Over the past forty years, the coming-of-age of the baby-boom generation has tended to increase Canadian average incomes because it increased the fraction of the overall population who worked and thus generated income. But the continuing aging and eventual retirement of this same generation will have the opposite effect in the future. The declining fraction of the population at work will tend to offset the effects of ongoing productivity growth on the growth of per capita incomes.
Figure 5 shows how markedly the sources of real per capita income growth will change from the past to the future. Between 1971 and 2008, real per capita income in-creased by about 1.9 percent annually, and this growth came more-or-less equally from productivity growth and a rising labour-force participation rate. For the next thirty years, however, the decline in the labour-force participation rate will be a significant drag on growth; with productivity growth predicted to be roughly similar to that ob-served in the recent past, the result is that real per capita income will grow by only 1.0 percent annually.3
For the next few decades, Canadians and their governments will need to think more carefully about how the rate of productivity growth can be increased. Growth in their future living standards will depend much more on productivity growth than it has in the past.
FIGURE 4 Canada’s Labour-Force Participation Rate, 1976–2040
Source: Author’s calculations based on data from Statistics Canada.
3 The difference between 1.9 and 1.0 percent per year may seem small, but even this difference in growth rates sustained over many years will make a large difference in the future level of real income. At an annual growth rate of 1.9 percent, income doubles after roughly 36 years; at an annual growth rate of 1.0 percent, income doubles only after 72 years
6
Copyright © 2011 Pearson Canada Inc.
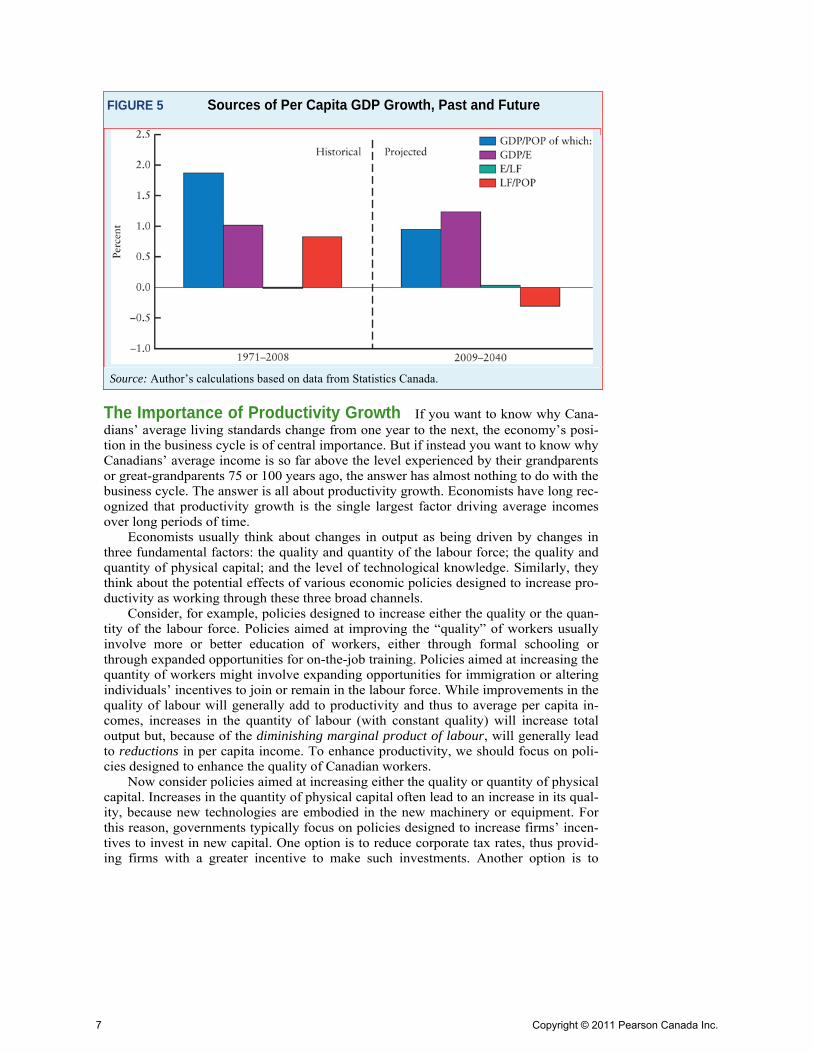
The Importance of Productivity Growth If you want to know why Cana-dians’ average living standards change from one year to the next, the economy’s posi-tion in the business cycle is of central importance. But if instead you want to know why Canadians’ average income is so far above the level experienced by their grandparents or great-grandparents 75 or 100 years ago, the answer has almost nothing to do with the business cycle. The answer is all about productivity growth. Economists have long rec-ognized that productivity growth is the single largest factor driving average incomes over long periods of time.
FIGURE 5 Sources of Per Capita GDP Growth, Past and Future
Source: Author’s calculations based on data from Statistics Canada.
Economists usually think about changes in output as being driven by changes in three fundamental factors: the quality and quantity of the labour force; the quality and quantity of physical capital; and the level of technological knowledge. Similarly, they think about the potential effects of various economic policies designed to increase pro-ductivity as working through these three broad channels.
Consider, for example, policies designed to increase either the quality or the quan-tity of the labour force. Policies aimed at improving the “quality” of workers usually involve more or better education of workers, either through formal schooling or through expanded opportunities for on-the-job training. Policies aimed at increasing the quantity of workers might involve expanding opportunities for immigration or altering individuals’ incentives to join or remain in the labour force. While improvements in the quality of labour will generally add to productivity and thus to average per capita in-comes, increases in the quantity of labour (with constant quality) will increase total output but, because of the diminishing marginal product of labour, will generally lead to reductions in per capita income. To enhance productivity, we should focus on poli-cies designed to enhance the quality of Canadian workers.
Now consider policies aimed at increasing either the quality or quantity of physical capital. Increases in the quantity of physical capital often lead to an increase in its qual-ity, because new technologies are embodied in the new machinery or equipment. For this reason, governments typically focus on policies designed to increase firms’ incen-tives to invest in new capital. One option is to reduce corporate tax rates, thus provid-ing firms with a greater incentive to make such investments. Another option is to
7
Copyright © 2011 Pearson Canada Inc.
reduce specific sales taxes or tariffs that apply to business inputs, thus reducing the costs for firms that choose to invest in new capital. Increases in the quantity (or quality) of physical capital will generally lead to increases in the productivity of labour because workers will then have more or better capital with which to work. The overall result is an increase in average per capita income.
Finally, consider policies designed to increase the level of technological knowl-edge, the hard-to-measure concept representing firms’ and workers’ overall ability to generate output from a given amount of labour and capital inputs. First, governments can directly support research in universities and private-sector laboratories, thus in-creasing the economy’s overall stock of knowledge. Second, tax-related policies de-signed to reduce firms’ direct costs of conducting expensive research and development (R&D) activities can be used, thus encouraging more R&D activities and thus, hope-fully, an improvement in the overall level of knowledge. Finally, policies aimed at en-hancing the degree of competition between firms may have the effect of spurring technological development as firms realize that only with new inventions and innova-tions can they hope to succeed against their corporate rivals. All such policies, if suc-cessful in increasing the level of productive knowledge in the economy, will have the effect of increasing productivity and average per capita incomes.
Though many potential policies exist to increase productivity and thus average per capita incomes, it is worth noting that all such policies come with some opportunity cost. These policies require the use of real resources, and in most cases involve a direct cost to governments (and the taxpayers they represent). Improving training to workers, for example, involves a direct expenditure of taxpayers’ resources, as does a reduction in tax rates designed to induce firms’ investment and the government’s direct support of university-based research. As important as future increases in productivity growth will be to the average Canadian, we must keep in mind that such increases do not come for free. This brings us to the last major topic of this essay—the fiscal challenges that Canadian governments will face in the future as a direct result of population aging.
The Fiscal Challenges of Population Aging The aging of the Canadian population will force Canadian governments to face a sig-nificant fiscal challenge in the years ahead. There are two parts to this challenge. First, the aging of the population will lead to a decline the growth rate of governments’ tax base. Second, key Canadian government spending programs will become more costly as the population ages—in particular, programs providing health care and income sup-port for the elderly. Confronting this fiscal challenge will likely create political ten-sions between provincial and federal governments and will force governments at all levels to make some difficu t decisions. l
A Slowing Tax Base Canadian governments levy all kinds of taxes, including personal and corporate income taxes, the federal Goods and Services Tax (GST), pro-vincial sales taxes, municipal property taxes, and various excise taxes such as those that apply to the sales of gasoline, cigarettes, and liquor. For the federal and provincial governments, however, by far the most important taxes are the personal and corporate income taxes and the GST and provincial sales taxes. The income taxes apply to per-sonal income and corporate profits, respectively. The GST and provincial sales taxes, in contrast, apply to the level of consumption expenditure, which tends to move in tan-
8
Copyright © 2011 Pearson Canada Inc.
dem with national income, although with less volatility. Thus the revenues raised by the most important Canadian taxes are closely tied to the level of national income, and we can therefore view national income (GDP) as a good approximation to the govern-ments’ tax base. Government tax revenues tend to rise quickly when national income rises quickly; they tend to slow down (or fall) when national income slows down (or falls).
We have already seen that an important effect of Canada’s population aging will be a significant decline in the labour-force participation rate over the next thirty years, with the important consequence that real per capita income will grow more slowly than it did over the past half-century. The implications for government tax revenue are clear: in the absence of changes in the governments’ various tax rates, the slowing of the growth in per capita income will lead to a slowing of Canadian governments’ per capita tax revenues. From Figure 5, it is predicted that the annual growth rate of per capita income for the next thirty years will be lower by about 1 percentage point than it was over the past few decades; the implication is that, for unchanged tax rates, the annual growth rate of governments’ per capita tax revenues will also fall by about 1 percent-age point.4
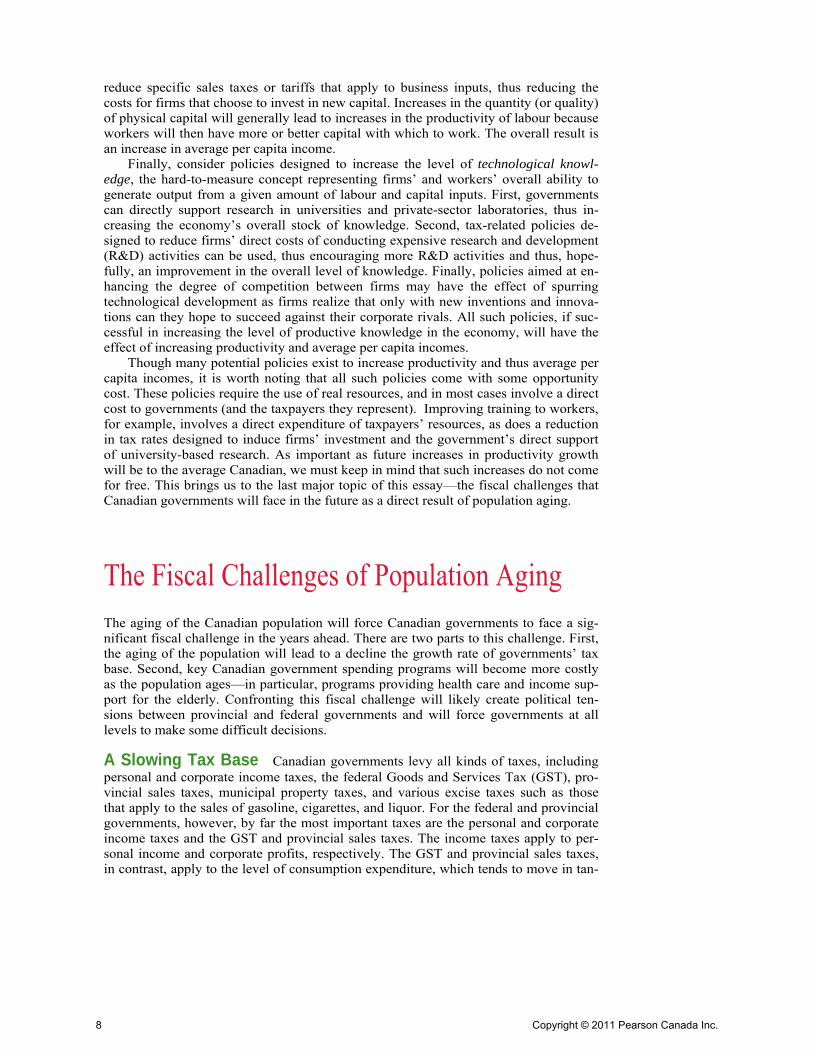
Rising Age-Related Spending It should not be surprising to learn that the average amount of resources spent on health care per person rises significantly as that person ages. In general, older people suffer more from illnesses than do the young. They also require more hospitalization and recover more slowly from accidents of var-ious kinds than do younger people. Using data from 2006, Figure 6 shows how per cap-ita health-care spending varies by age category, with the amount of public spending for people aged 75 and above several times larger than the spending for those under the age of 55.
4 Even though the growth of government tax revenues is predicted to slow in per capita terms, tax revenues will still be roughly constant as a share of GDP if governments hold tax rates constant.
FIGURE 6 Per Capita Public Health-Care Spending by Age Category, 2006
Source: Author’s calculations based on data from the Canadian Institute for Health Information
9
Copyright © 2011 Pearson Canada Inc.

The aging of the baby-boom generation implies that, for the next thirty years or so, there will be a steadily increasing fraction of the Canadian population over the age of 65 (look back to Figure 2). Government spending on health care will also increase over this period, since a greater share of the population will reside in the higher-cost age categories from Figure 6. The projected increase in overall public spending on health care between 2020 and 2040, measured in percentage points of GDP, is shown in Fig-ure 7. Over this period, public spending on health care is projected to increase by roughly 2.9 percentage points of GDP.
Notice, however, that population aging is not the only force driving the increase in expenditures in Figure 7. Two other factors, taken together, are estimated to account for slightly over half of the overall increase. First, as real per capita incomes continue to increase, it is estimated that the demand for health care will also rise, and more than in proportion to the increase in income. In the terminology of Chapter 4, most empiri-cal evidence suggests that health care is a luxury good in the sense that its income elas-ticity is greater than one. This large elasticity suggests that health-care spending will grow faster than real GDP, other things being equal. The second additional factor driv-ing greater expenditure on health care comes from the continuing development of new and expensive medical technologies. In some cases, new medical technologies allow doctors to do existing procedures in lower-cost ways. But in many cases, new medical technologies allow doctors to do things that they could not do before at any cost—to perform operations or to treat diseases that no technology formerly permitted. In other words, an important source of rising health-care expenditures is that technological ad-vances give us new ways to spend money on health care that were simply not available in the past.
The aging of the Canadian population will also lead to increased demands for pub-lic spending on old-age benefits. Programs such as the Old Age Security (OAS) and Guaranteed Income Supplement (GIS) provide direct income assistance to the elderly, especially those with incomes below a specified threshold. As the baby-boom genera-tion continues to age and more of them enter their golden years, there will inevitably be greater demands on these existing programs. Between 2020 and 2040, spending on such programs is predicted to increase by approximately 0.6 percentage of points of
FIGURE 7 Projected Increase in Public Health-Care Spending, 2020–2040
Source: Author’s calculations based on data from the OECD.
10
Copyright © 2011 Pearson Canada Inc.
GDP. Overall, the effect of population aging is expected to significantly increase de-
mands on public expenditure.5 Rising spending on health care and elderly benefits is expected to add roughly 3.5 percentage points to annual government spending between 2020 and 2040. These coming fiscal challenges will present Canadian governments with some interesting challenges, two of which we address here.
Fiscal Tensions Between Levels of Government In terms of overall tax revenues, Canada’s provincial governments taken together are roughly equal in size to the federal government. For example, in 2008, Canadian provincial governments collected $250 billion in tax revenues whereas the federal government collected $253 billion. As we discuss in Chapter 18, however, the British North America Act of 1867 specifies clear jurisdictions for the spending powers of governments, and these lead in some cases to large spending imbalances between different levels of government. For example, education and health care are clear provincial jurisdictions, and thus direct federal spending is (almost) absent; in contrast, national defence and foreign policy are clear federal jurisdictions in which provincial spending is absent.
For many years, an important aspect of Canada’s system of “fiscal federalism” has been the existence of financial transfers from the federal government to the various provincial governments. In some cases these transfers are made to the provinces as “block” funding, which the province can spend in any way it chooses. In other cases the funds are earmarked for specific spending areas, such as health care, but even in these cases the provinces are free to choose the details of how the money is spent. With such transfers, the federal government can assist the provinces in financing some of the country’s most important social programs while at the same time honouring Canada’s long-established jurisdictional divisions.
The aging of the Canadian population, and thus the increased demands for health-care spending, will create significant fiscal tensions between the federal and provincial governments for the simple reason that the lion’s share of the increased spending will come directly from the provincial budgets. At the same time, however, nothing will generate an automatic transfer of taxing power toward the provinces. Thus, as popula-tion aging drives the increase in age-related spending, there will likely be an increased demand for financial transfers from the federal government to the provinces. Political tensions will be created. How these tensions are resolved will depend on the personali-ties and the political landscape of the time.
The Need to Make Difficult Fiscal Choices Provincial governments will increase their demands for financial transfers from Ottawa because getting such a trans-fer is easier and more popular (within the province) than the alternative methods of financing the rising health-care expenditures. One alternative is to reduce provincial spending on items other than health care, but this is unpopular because it implies re-duced levels of services being provided to provincial residents. The other alternative is to increase provincial taxes to pay for the increases in the health-care budget, but few voters ever embrace the idea of higher taxes. If the federal government can be con-vinced to increase transfer payments, the provinces can avoid making these difficult fiscal decisions.
5 Population aging is also predicted to lead to decreases in the growth of public spending on programs designed for the young, especially primary and secondary education and programs that provide financial benefits to parents of young chil-dren. This effect, however, is predicted to be far smaller than the combined effects on health care and elderly benefits, and so it is ignored in what follows.
11
Copyright © 2011 Pearson Canada Inc.
But as population aging adds to the demands for greater age-related spending, someone will need to make some difficult fiscal choices. They simply cannot be avoided. Greater financial transfers to the provinces would certainly make life easier for provincial governments, but the burden would then be squarely on the federal gov-ernment to make the tough decisions. The federal government would only be able to make larger transfers to the provinces if it could either restrain other types of spending or increase taxes.
From the perspective of the country as a whole, it may be useful to focus on the overall need for fiscal adjustment—apart from the difficult issue of how the adjustment will be apportioned between the various levels of government. For Canada as a whole, the aging of the population is predicted to increase demands for health-care spending and for income-support programs designed for the elderly. Governments will need to respond to these new demands, and the broad choices are clear. First, if governments can sufficiently reduce the growth rate of non-age-related spending, they can make room in their budgets for the coming increases in age-related spending without the need for higher taxes. Restraining spending is certainly possible, but is usually difficult and politically controversial.
Second, if governments can sufficiently restrain the growth of health-care spending itself, they may be able to accommodate the effects of population aging without resort-ing to higher taxes or cuts to other spending programs. In this case, governments must find ways to significantly restrain the growth in health-care spending that comes from technological change and income growth (as opposed to the part that comes from popu-lation aging). There is currently a great deal of debate as to whether this is possible and, if it is, how best to achieve it.
Third, governments can choose to accommodate the rising demands for health-care spending by raising taxes. In this way, Canadians can simply be asked to pay for the greater services that they will be receiving. Apart from the unpopularity of higher tax-es, an important choice would then need to be made concerning which taxes would be raised and by how much—a choice which would affect not only the distribution of Ca-nadian income but also the future growth rate of average real income.
None of these three broad options will be pleasant for the Canadian governments faced with the need to make the decisions, but some combination of these choices will be inevitable. If governments try to avoid these unpleasant fiscal realities by increasing their borrowing, they would only be delaying an inevitable fiscal adjustment. Any debt incurred now must ultimately be repaid (with interest) with future resources raised ei-ther through higher taxes or lower spending. Only time will tell how our governments choose to confront the challenge of population aging. Hopefully, they will start think-ing about it very soon.
12
Copyright © 2011 Pearson Canada Inc.