the e ect of banning a rmative action on human capital
TRANSCRIPT

Antonovics and Backes
ORIGINAL ARTICLE
The effect of banning affirmative action on
human capital accumulation prior to college entryKate Antonovics1 and Ben Backes2*
*Correspondence: [email protected]
2American Institutes for Research
/ CALDER, 1050 Thomas
Jefferson St NW, 20007
Washington, DC
Full list of author information is
available at the end of the article
Abstract
This paper examines how banning affirmative action in university admissions
affects both overall academic achievement and the racial gap in academic
achievement prior to college entry. Focusing on college-bound high school
students, we use a difference-in-difference methodology to analyze the impact of
the end of race-based affirmative action at the University of California in 1998 on
both the overall level of SAT scores and high school GPA, and the racial gap in
SAT scores and high school GPA. We find little evidence of either a decline in
academic achievement or a widening of the racial gap in academic achievement
after the ban.
Keywords: Education; Inequality; Education Policy; Affirmative Action
JEL Classification: I210; I240
1 Introduction
Universities in the United States are increasingly limited in their ability to
practice race-based affirmative action. In the last two decades, public universities
in a growing number of states have stopped practicing race-based affirmative
action due to various court rulings, voter initiatives, and administrative
decisions.1 In addition, the United States Supreme Court’s 2013 decision in Fisher
v. Texas makes it more difficult for universities to justify using race as a factor in
admissions, and its 2014 ruling in Schuette v. Coalition leaves the door open for
additional states to implement statewide bans on affirmative action. The
implications of eliminating race-based affirmative action in college admissions are
far-reaching and have been the subject of considerable legal, political, and

Antonovics and Backes Page 2 of 30
scholarly debate. In this paper, we focus on the potential effects of banning
affirmative action on academic achievement prior to college entry.
Economic theory suggests that eliminating affirmative action could have
important implications for human capital accumulation. There are a number of
channels through which this effect could operate. First, the removal of racial
preferences directly affects admissions probabilities, which in turn affects the
return to studying prior to college application. Second, banning affirmative action
could lead underrepresented minorities to feel institutionally discouraged from
attending college, and they could respond by putting forth less effort in preparing
for postsecondary education. Finally, if colleges react to bans on affirmative action
by changing their admissions process more broadly, then this too could lead
students to shift the focus of their efforts in high school.
While economic theory clearly predicts that ending affirmative action could
affect human capital investment, it does not yield definitive predictions about
whether the overall level of human capital investment or the racial gap in human
capital investment will rise of fall.2 Thus, the effect of banning affirmative action
on human capital investment is largely an empirical question.
In an attempt to answer this question, this paper explores the impact of
Proposition 209, which prohibited public universities in California from practicing
race-based affirmative action, on both the SAT scores and high school GPA of
college-bound high school students. In particular, using data from the College
Board, we examine how these measures of academic achievement changed in
California relative to other states (a difference-in-difference estimate), and how
the racial gap in these measures changed in California relative to other states (a
triple-difference estimate). We find little evidence that the ban had a negative
impact on either overall academic achievement or the racial gap in academic
achievement. This finding is consistent with previous research documenting a
limited behavioral response to California’s ban on affirmative action in terms of
both college application behavior and college enrollment behavior (see, for
example, Antonovics and Backes (2013) and Antonovics and Sander (2013)).
Our paper proceeds as follows. Section 2 discusses the related literature,
and Section 3 presents an overview California’s affirmative action ban. Section 4

Antonovics and Backes Page 3 of 30
discusses our empirical strategy and gives a short overview of our data. Section 5
presents our results, and Section 6 concludes.
2 Related Literature
The theoretical literature on affirmative action in college admissions emphasizes
the distinction between “color-sighted affirmative action”, wherein colleges use
explicit racial preferences in admissions, and “color-blind affirmative action”,
wherein colleges implicitly favor minorities by using admissions rules that favor
students who possess characteristics that are positively correlated with being a
minority (see, for example, Fryer et al. (2008), Ray and Sethi (2010) and Fryer
and Loury (2013)).3 Both forms of affirmative action stand in contrast to
laissez-faire admission regimes in which race is not considered either explicitly or
implicitly. In the case of California, it seems clear that Prop 209 shifted most
University of California (UC) schools from color-sighted to color-blind affirmative
action. That is, the UC administration openly acknowledged that diversity
remained a high priority even after Prop 209, and Antonovics and Backes (2014)
provide evidence that, after Prop 209, UC schools changed their admissions
process to implicitly favor minorities.
In their seminal paper, Coate and Loury (1993) show that affirmative
action in the labor market has an ambiguous theoretical effect on human capital
investment. In the context of college admissions, Fryer et al. (2008) establish that
moving from color-sighted to color-blind affirmative action alters students’
incentives to invest in human capital, but their model does not yield definitive
predictions about whether investment will go up or down. For example, if the
move from color-sighted to color-blind affirmative action lowers minorities’
admission rate (as was the case for California), then this could dampen minorities’
incentives to invest in human capital since there is no point in investing if you
have no chance of being admitted. On the other hand, reducing minorities’
chances of admission could increase human capital investment since it may
become more important to distinguish yourself as the field becomes more
competitive. Finally, Hickman (2012) and Hickman (2013) also model the link
between different admissions regimes and human capital investment, but do not

Antonovics and Backes Page 4 of 30
consider color-blind affirmative action, which we feel is essential to understanding
the effects of Prop 209.4
A substantial number of papers examine the effect of affirmative action on
academic achievement (for a recent survey, see Arcidiacono and Lovenheim
(2014)). Of these, only a handful use data from before and after a ban on
affirmative action, with most focussing on academic achievement after college
entry (see, for example, Arcidiacono et al. (2014), Backes (2012), Cortes (2010)
and Hinrichs (2012)). To our knowledge, only two previous studies have directly
examined the effect of a ban on affirmative action on academic achievement prior
to college entry, Furstenberg (2010) and Caldwell (2010). Both find evidence that
banning affirmative action increases the racial test score gap. We discuss these
papers in greater detail when we present our results in Section 5.
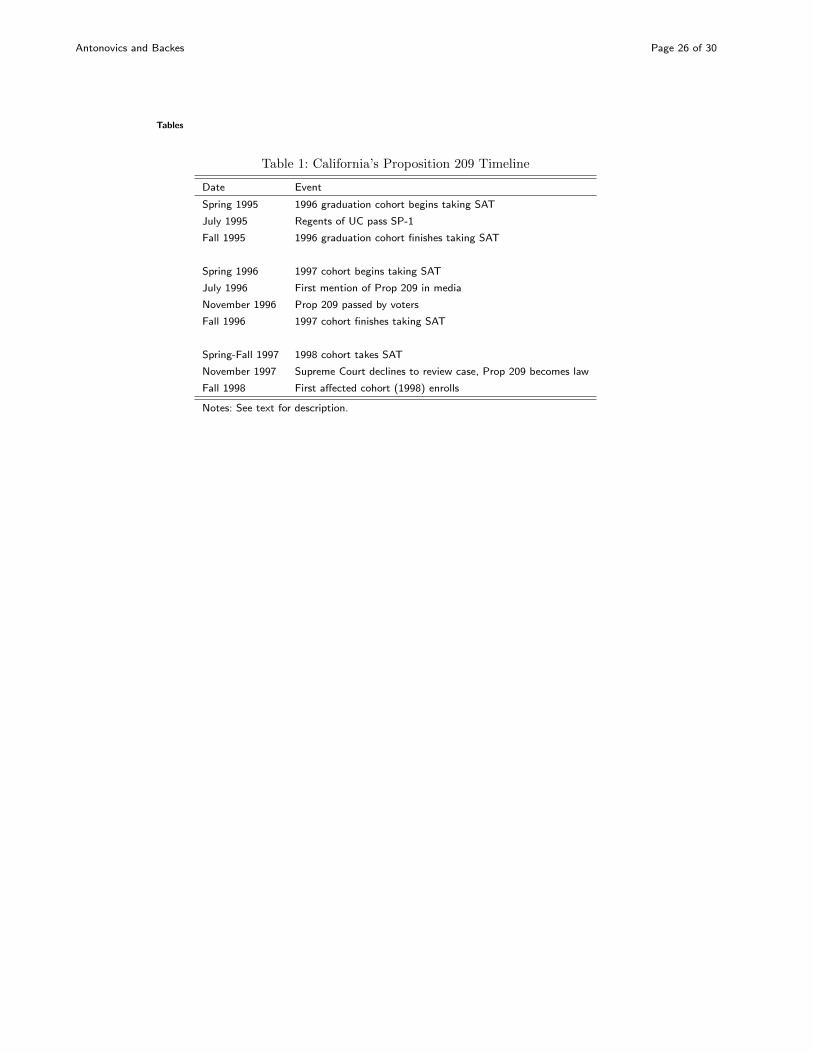
3 Background on California’s Ban on Affirmative Action
The first threat to affirmative action in California was in July 1995, when the
Board of Regents of the University of California passed a resolution (SP-1), which
stipulated that the UC would discontinue considering race in admissions by the
beginning of 1997. The implementation of SP-1, however, was delayed. Then, in
November 1996, California voters approved Prop 209, which banned the use of
racial preferences at public universities.5 Prop 209 underwent various legal
challenges until the Supreme Court denied further appeals in November 1997.
Thus, the incoming class of 1998 was the first to be admitted under the statewide
ban on affirmative action. Table 1 presents a timeline of the events leading up to
the ban.
Although the prohibition against affirmative action applied to all public
universities in California, in practice it only affected UC schools because at the
time most Cal State schools were not very selective, admitting the vast majority
of applicants, regardless of race. Given that one in six Californian high school
graduates apply to at least one UC campus, however, it is reasonable to think that
major policy changes at the UC could affect the human capital investment for the
state as a whole.6 In addition, because it was so controversial, Proposition 209
received a tremendous amount of coverage in the media. For example, between
July 1996 and July 2001, over 900 articles in the Los Angeles Times contained the

Antonovics and Backes Page 5 of 30
phrase “Proposition 209” (roughly one every other day). Thus, it seems likely that
high school students were aware of Prop 209.
Prop 209 also had an enormous impact on the admission rate of
underrepresented minorties (or URMs), especially at the more selective UC
schools.7 For example, the fraction of URM applicants admitted to Berkeley
plummeted from 52 percent to 25 percent between the three-year period
immediately before and the three-year period immediately after the ban. In
contrast, the admission rates of non-minority applicants to Berkeley only fell from
32 percent to 28 percent over that same time period.
Evidence that students’ human capital investment decisions respond to the
incentives created by college admissions policies is evident in Cortes and Friedson
(2014) and Cullen et al. (2012), both of which find evidence of students moving to
lower quality high schools after Texas introduced its top ten percent plan, which
guaranteed admission to any public university in Texas for students who
graduated in the top ten percent of their high school class.
Nonetheless, isolating the effect of the end of race-based affirmative action
at the UC is complicated by a number of concomitant policy changes. First, in an
effort to minimize the effects of Prop 209 on minority enrollment, the UC system
substantially increased minority outreach efforts.8 It is unclear, however, how
much of an effect the new outreach programs had on the applicant pool in the
years immediately following Prop 209 since many of these programs took years to
fully develop and were long-term in nature. To the extent that increased outreach
had an effect on academic achievement, our estimates represent the net effect of
ending race-based affirmative action and the accompanying change in outreach.
In addition to the increase in outreach, there were two major policy changes
in California around the same time as Prop 209. First, the 1999 passage of the
Public Schools Accountability Act brought about substantial changes to the
public K-12 schools in California. In particular, beginning in 2000, schools were
eligible for rewards if all ethnic subgroups within schools either scored above a
certain threshold or met targets for test score growth. In addition, schools with
low test scores could opt into an intervention program designed for schools not
meeting growth targets. Second, in 2001, the UC implemented Eligibility in the
Local Context (ELC), guaranteeing any student in the top four percent of his or

Antonovics and Backes Page 6 of 30
her high school class admission to at least one UC school (conditional on
completing specified coursework). The new policy was designed to attract students
from high schools that did not typically send many students to the UC, giving the
UC a way to potentially increase minority enrollment. Since both of these policy
changes are likely to have affected human capital accumulation, we perform
robustness checks by removing observations from 2000 and later from our analysis
and find no substantial impact on our main results.
Finally, we note that the long-run effects of Proposition 209 on SAT scores
and high school GPA are likely to be larger than the short-run effects. In the short
run, any change in students’ SAT scores or high school GPA is likely to primarily
reflect a change in student effort. In the long run, however, changes in students’
SAT scores and high school GPA additionally may reflect changes in accumulated
knowledge and skill. Since our data only allow us to examine students graduating
from high school in the four-year period immediately following the
implementation of Prop 209 (1998-2001), our results are likely to reflect the
intermediate-run effects Prop 209.
4 Estimation and Data
Antonovics and Backes (2014) provide evidence that Prop 209 led to widespread
shifts in the entire admission process at many UC schools. In particular, the more
selective UC schools appear to have decreased the weight placed on SAT scores
and increased the weight given to high school GPA and family background
characteristics in order to boost minority admission rates after Prop 209 went into
effect. This is important because the apparent reduced emphasis on SAT scores
and increased emphasis on high school GPA might have led to a shift away from
human capital investments that increase SAT scores towards those that increase
high school GPA. For this reason, we separately examine the effect of Prop 209 on
these two measures of academic achievement.
In addition, we measure the effects of the policy change in two ways. First,
we explore the reaction of Californians relative to the rest of the country. Second,
we document how the gap between whites and underrepresented minorities
(URMs) changed in California relative to the rest of the country.9 Each of the two
measures is important. Since Californians of all races were affected by the changes

Antonovics and Backes Page 7 of 30
in the admissions policies at UC schools, they may be thought of as one treated
group. Comparing Californians to those in other states reveals the extent to which
Prop 209 changed academic achievement for all Californians. On the other hand,
affirmative action policies are generally thought of as a way to address the gap
between white and minority students. Viewed in this way, it is natural to ask how
the removal of explicit racial preferences affected the racial gap in academic
achievement.
4.1 Empirical Strategy
To examine the effect of Prop 209 on academic achievement, we estimate the
following:
Outcomeist = β0CAs + β1Postst + β2URMi
+ β01CAsPostst + β02CAsURMi + β12PoststURMi (1)
+ β012CAsPoststURMi
+ βXi + εist,
where Outcomeist is the outcome (SAT score or high school GPA) for student i in
state s in year t. Postst is an indicator for whether the affirmative action ban was
in place in state s in year t, CAs is an indicator for whether the student resides in
California, and URMi is an indicator for an individual’s race. Finally, Xi includes
controls for parental income, education, gender, whether English is the student’s
first language, citizenship status, and a constant term. Following the discussion at
the beginning of this section, there are two coefficients of interest. First, to the
extent that Californians had a common response to Prop 209, it would be
captured by β01, which represents the change in the dependent variable for white
Californians relative to the rest of the country. Second, β012 represents the change
in the minority-white test score gap in California relative to the rest of the
country.
There are two important choices that must be made in estimating Equation
(1). The first is which cohorts to include. As discussed above, there was an
extended period of uncertainty surrounding the end of race-based affirmative
action at the UC. Table 1 shows the timing of events leading up to the

Antonovics and Backes Page 8 of 30
implementation of Prop 209 along with the timing of when various graduation
cohorts are likely to have taken the SAT. As the table indicates, the first major
threat to affirmative action at the UC came in July 1995 when the Regents of
California passed SP-1, which committed the UC system to an eventual ban on
the use of racial preference in admissions. It was not until over two years later,
however, in November 1997, when Prop 209 officially became law that the UC
stopped the use of explicit racial preferences. Thus, students who took the SAT
between July 1995 and November 1997 (those in the 1996-1998 graduation
cohorts) did so during a time of considerable uncertainty about the future of
race-based affirmative action. As a result, we experiment with two different pre
and post period definitions: (i) 1994-1996 vs 1998-2001 and (ii) 1994-1995 vs
1999-2001. The first choice of sample years drops only the 1997 cohort, which took
the SAT during the election cycle in which Prop 209 was on the ballot. The second
choice of sample years takes a more conservative approach by dropping any cohort
that could have taken the SAT during a period of uncertainty about Prop 209.
However, it leaves only two years in the pre period and three in the post period.
The second important choice is whether to include an interaction term
between the post period and demographic characteristics. By not including such
an interaction, time-varying changes in the relationship between demographic
characteristics and the outcome variable would be picked up by the coefficient on
Post*URM, due to the correlation between race and demographic characteristics.
However, if the effects of the policy operated in part through changes in the
relationship between demographic characteristics and the outcome variable (due
to, for example, changes in the weights placed on different student characteristics
in determining admissions), the researcher may be interested in omitting the
interaction between the post period and demographics to allow the changes to
load onto the URM*Post coefficient. We present results from both specifications.
In practice, we also expand our estimating equation to include the full set
of interactions for blacks, Hispanics, and Asians, with whites as the excluded
group. We also use year fixed effects and state fixed effects, and we include
state-specific linear time trends. We drop observations from Florida, Louisiana,
Mississippi, Texas, and Washington, which were affected by their own affirmative
action policy changes during our sample period. We also drop North Dakota and

Antonovics and Backes Page 9 of 30
Wyoming due to small sample sizes of minority SAT test takers.10 Finally, we
normalize test scores and GPA to be mean zero with standard deviation one.
Asians, who constitute a large portion of the college-going population in
California, are not considered URMs for the purposes of admissions to the UC.
We estimate effects on Asians separately but generally do not focus on their
results because blacks and Hispanics were the intended beneficiaries of affirmative
action policy at the UC and because the outcomes for Asians and whites are
generally similar.11
4.2 Estimation of Standard Errors with Limited Treated Units
A growing number of papers have documented the inadequacy of typical methods
of obtaining standard errors when the number of treated units is small (see
Moulton (1990), Wooldridge (2006), Donald and Lang (2007), Abadie et al.
(2010), and Buchmueller et al. (2011)). To illustrate the problem, consider SAT
scores as the outcome variable and suppose we are interested in β01, which
measures the change in test scores for Californians relative to the rest of the
country. Since SAT scores naturally fluctuate from year to year within a state
even in the absence of a policy change, it is important to distinguish these
fluctuations from the true policy effect. This is done in the typical DD setting by
assuming that these state-specific, year-to-year fluctuations average out to a mean
of zero over a large number of treatment and control states. In our case, there is
only one treated unit, so there is little reason to believe this assumption holds.
We follow an established method of dealing with the problem of only one
treated state by using the remaining untreated states to conduct a permutation
test in which we construct the empirical distribution of β01 by estimating β̂01 for
each of the control states, treating each control state as the treated state (see
Abadie et al. (2010) and Buchmeuller et al. (2011)).12 Thus, the control states are
used to estimate the variability of β̂01 that is driven by year-to-year variation in
test scores. The null hypothesis – that Prop 209 had no effect on academic
achievement in California – is rejected when β̂California01 is large relative to the
estimated empirical distribution of β̂j01 for the control states (j indexes the control
states). This procedure tests whether the change in test scores in California is
large relative to the naturally occurring variation in test scores observed in other

Antonovics and Backes Page 10 of 30
states. We also estimate β̂California012 and β̂j
012 for each of the states in our data to
measure whether the change in the minority-white gap in California was extreme
relative to the change in states that did not ban affirmative action in the same
time period. This correction reveals substantial within-state year-to-year
variability in SAT scores.
Of course, one solution to the above problem would be to include more
treated states. However, most states that banned affirmative action have done so
too recently to be contained in our data.13 Two states that banned affirmative
action during the period for which we have data are Texas and Florida; however,
each introduced top x% plans in which the top x% of students within a high
school were guaranteed admission to an in-state public university.14 Louisiana and
Mississippi were both affected by the court ruling that ended affirmative action in
Texas, but both states were under desegregation orders, so they may not have
been under pressure to comply with the ruling.15 In addition, neither state’s
public universities are as selective as the institutions typically affected by bans on
racial preferences (see Blume and Long (2014)). Of the affirmative action banning
states, the sole remainder is Washington, which voted to ban affirmative action in
1999. In principle, Washington could be included with our analysis; however, using
two policy change states instead of one would still be insufficient for classical
estimation of standard errors.16 Finally, there are several advantages to using
California. First, it is a large state with a significant URM population. In
addition, it has been well-established that the more selective UC schools practiced
significant race-based affirmative action prior to Prop 209, and finally, the
measurement of how admissions rules changed at the UC after Prop 209 has been
documented by Antonovics and Backes (2014).
4.3 Data
Our College Board data consist of SAT test takers who are expected to graduate
from high school between 1994 and 2001.17 The sample consists of all black and
Hispanic test takers nationwide, all Californian test takers, and a 25 percent
random sample of the rest of the country. The College Board includes a range of
descriptive variables that are generated when students fill out the Student
Descriptive Questionnaire before taking the exam. These include race, gender,

Antonovics and Backes Page 11 of 30
parental characteristics, college aspirations, high school GPA, and many other
variables. Our data also identify each students’ high school graduation cohort, and
we assume that students in a given graduation cohort took the SAT between the
spring and fall of the preceding year. In addition, to the extent that students took
the SAT multiple times, our data only reveal students’ last SAT score. Vigdor and
Clotfelter (2003) show that students’ SAT scores tend to increase when they
retake the SAT. Thus, if Prop 209 lowered students’ incentive to retake the SAT
(perhaps because SAT scores became less important in determining admission),
then this is likely to show up as a decline in average SAT scores.
One advantage of using the College Board sample is that nearly all SAT
takers are interested in going to college, so they should be the ones most readily
affected by the affirmative action ban. On the other hand, a potential problem
with using the College Board is that a student’s decision about whether to take
the SAT could be affected by Prop 209, leading to possible sample selection bias.
Dickson (2006) finds that removal of affirmative action in Texas led to a decline in
the percentage of minority high school graduates who take either the ACT or SAT
of roughly 3-4 percent. If Prop 209 led to a similar drop in the fraction of URMs
who took the SAT in California, then to the extent that these students were
differentially likely to score poorly on the SAT, this could lead us to understate
the true drop in the relative performance of URMs. We discuss this issue in a later
section below.
Basic summary statistics for our College Board sample are displayed in
Table 2. Californians are quite similar to the rest of the country in terms of SAT
scores and high school GPA, but, as might be expected, a smaller fraction are U.S.
citizens and a larger fraction speak English as a second language. In both
California and the rest of the U.S., blacks and Hispanics tend to score lower on
the SAT, have lower GPAs, and have parents with lower levels of education.
5 Results
5.1 Overview of Trends in Test Scores
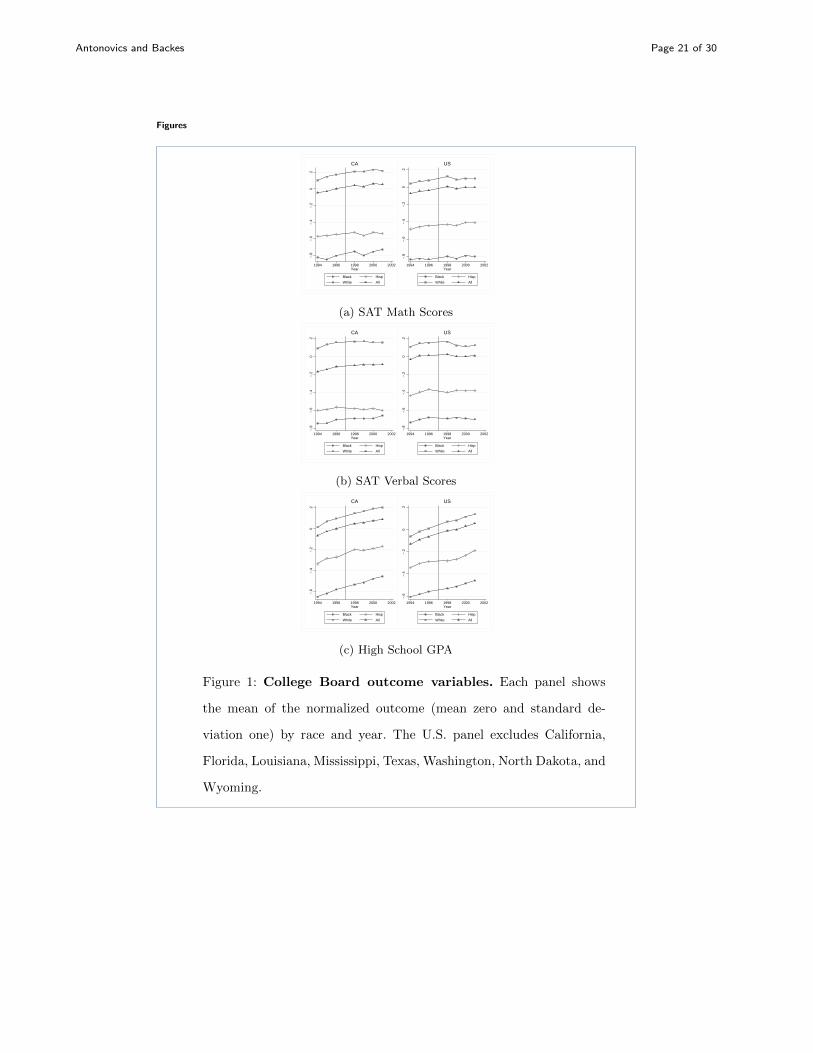
As a first pass at gauging the effects of Prop 209 on SAT scores and high school
GPA, we plot normalized (mean zero and standard deviation one) average SAT
scores by race and year in Figure 1. Panels (a) and (b) show normalized SAT math

Antonovics and Backes Page 12 of 30
and verbal scores for Californians and the rest of the U.S. Although whites tend to
score higher than URMs, the gap appears to be roughly stable over time. Panel
(c) shows normalized high school GPA. The patterns in the figure underscore the
importance of controlling for state-specific time trends: there was a gradual rise in
GPA over time that began before the implementation of the preference ban.
5.2 Regression Results
Panel 1 of Table 3 presents results when including all but the 1997 cohort. The
first three columns display our results when we include controls for demographic
characteristics but not for the interaction between demographic characteristics
and the post-Prop 209 indicator. In terms of the effect of Prop 209 on the overall
level of academic achievement, for California relative to the rest of the country, we
find that after Prop 209 there was a 0.003 standard deviation increase in SAT
math scores and a 0.020 standard deviation increase in SAT verbal scores. We also
find a 0.019 standard deviation relative increase in high school GPA. While the
direction of these point estimates indicates an overall increase in academic
achievement in California relative to the rest of the country, we note that the
magnitudes are small and, on balance, suggest that Prop 209 had no meaningful
impact on the overall level of academic achievement.
In terms of the racial gap in academic achievement, for California relative
to the rest of the country, we find a reduction in both the black-white SAT gap
and the black-white GPA gap. In addition, while we find an increase in
Hispanic-white SAT gap (with the estimated 0.026 standard deviation increase in
the Hispanic-white SAT math gap, for example, representing about 3.5 SAT
points, or about 4 percent of the Hispanic-white SAT math gap in California), we
also find a reduction in the Hispanic-white high school GPA gap. Thus, our
findings do not generally support the notion that banning affirmative action
widens racial gaps in academic achievement.
Columns (4)-(6) present results when allowing the coefficients on the
demographic controls to vary in the post period. Results are generally similar but
smaller in magnitude since part of the effect that was previously captured by the
URM*Post coefficient is now contained in the Demographics*Post coefficients.

Antonovics and Backes Page 13 of 30
Panel 2 further restricts the sample by dropping each of the 1996 through
1998 cohorts from the analysis. Many coefficients become larger in magnitude,
especially when comparing Californians to the rest of the country. For example,
the estimated performance gain of Californians on the SAT verbal section
increases from .02 standard deviations to .046 standard deviations when dropping
the additional years. Again, the estimates become somewhat smaller in magnitude
when including Post*Demographic interactions as shown in columns (4) - (6).
The standard errors in Table 3 are generated by clustering at the state
level. However, as discussed above, the presence of one policy change state may
result in standard errors that are misleadingly small. As a result, we conduct
permutation tests in which we generate a coefficient ‘estimate’ for each of the 44
states in our data using the specification which resulted in the largest point
estimates – columns (1) - (3) of panel 2. Figure 2 plots histograms of these
placebo coefficient estimates, with the red line indicating the coefficient estimate
for California. In addition, the confidence intervals obtained by the permutation
tests are shown in brackets in each of the regression tables. The point estimates
for California are generally extremely small relative to the other states. However,
given the wide range of coefficient estimates from other states, we would be unable
to detect even a large change in California.
In seeking to understand the imprecision of our estimates, we plot average
SAT math scores by state and year for the first eight states alphabetically.18 The
plot is displayed in Figure 3, with California represented by the dashed line.19 A
naive look at the graphic would suggest a very small increase in the Californian
SAT math scores in the post period. However, two factors prevent being able to
make a definitive causal statement about the change in Californian performance
due to Prop 209. First, the small increase in SAT math scores was part of a
general upward trend in both California and the rest of the country (see Panel (a)
of Figure 1). Second, the other states shown in Figure 3 generally have substantial
year-to-year variability, which does not show up in the “U.S.” panel of Figure 1a
since all the states are averaged together. Thus, considerable year-to-year variation
within each state makes it difficult to make definitive statements about the causal
effect of the policy change despite the very large sample sizes in the College Board.

Antonovics and Backes Page 14 of 30
Despite the inherent problem with performing a difference-in-difference
estimation with one policy change state, we believe that the small point estimates
are noteworthy in themselves. As discussed above, Prop 209 led to substantial
changes in URM admissions rates and in the UC admissions process. However,
despite these changes, we find that the performance of Californians as a whole and
of black students relative to white students was relatively stable. Even Hispanics,
who appear to have performed worse on the SAT in the post period, saw an
increase in their high school GPAs. Thus, for neither Californians as a whole nor
for any minority group within California do we find consistent evidence of lower
academic achievement in response to Prop 209.
It is possible that our small estimated effect sizes are the result of including
many students who would be unaffected by Prop 209 because they are unlikely to
attend the top-tier UC campuses where the effects of Prop 209 were strongest. In
our sample, only one in six Californians applies to a UC campus, and even fewer
to a selective campus where the effects of Prop 209 were strongest. In an effort to
isolate a sample of students likely to be most affected by the policy change, we
predict which students would have a high likelihood of sending an SAT score to
either Berkeley or UCLA. Specifically, for cohorts in the pre-Prop 209 period, we
regress the likelihood of score-sending to at least one of Berkeley or UCLA on
demographic characteristics that plausibly were not affected by Prop 209, which
consist of parental education and income, race, gender, whether English was the
first language spoken, and citizenship status. We then use the coefficients to
predict score-sending for the entire sample, both in the pre and post periods. The
density of predicted Berkeley or UCLA score-sending is shown in Figure 4, with
the vertical lines denoting cutoff points between quartiles of score-sending
likelihood. We keep the top quartile of predicted score-senders to generate a
sample of students likely to be most affected by Prop 209.
We then run the same regressions as previously on this selected sample.
Results for these likely Berkeley or UCLA score-senders are shown in Table 4.
Coefficient estimates continue to be small, with the possible exception of an
estimated reduction in the Hispanic-white GPA gap.20

Antonovics and Backes Page 15 of 30
5.3 Robustness to Selection of SAT Test Takers
As mentioned earlier, a potential concern about using a sample of SAT test takers
is that if Prop 209 led to a drop in the fraction of URMs who took the SAT in
California, then to the extent that these students were disproportionately drawn
from the low end of the SAT distribution (conditional on observable
characteristics), this would lead us to understate the true drop in the relative
performance of URMs.
To explore this issue, we examine the trend in the number of SAT takers
from California as a fraction of the number of California public high school
graduates from 1995-2001 using data from the 1997-2003 Digest of Education
Statistics.21 Results are shown in Figure 5. There is some evidence that black
students were relatively less likely to take the SAT after Prop 209, especially in
1998. Relative to white students, black students were two percentage points less
likely to take the SAT in the post period (authors’ calculation), which is
equivalent to about four percent of black SAT test takers. On the other hand,
relative to white students, there was no change in the share of Hispanic students
who took the SAT.
As mentioned above, if it were the case that the fall in the fraction of black
SAT takers was driven by blacks at the bottom end of the SAT score distribution,
our estimates would understate the drop in the relative SAT scores of blacks. In
order to gauge the magnitude of this potential bias, we conduct a simulation in
which we artificially increase the number of black SAT test takers in the post
period in California by identifying the bottom one percent of Californian
post-period black SAT scorers and replicating each four times (to “recover” the
estimated 4 percent drop suggested by Figure 5).
Results with these “extra” low-achieving Californian post-period black
students are shown in Table 5. Not surprisingly, we now find a drop in the relative
SAT scores of blacks after Prop 209. Overall, the results for blacks now mirror
those for Hispanics, with an increase in the minority-white SAT gap and decrease
in the minority-white GPA gap. This pattern is interesting as it suggests that
blacks and Hispanics may have responded to the new post-Prop 209 admissions
rules at the UC, which placed less weight on SAT scores and more weight on high

Antonovics and Backes Page 16 of 30
school GPA. Importantly, however, we do not find evidence of a uniform drop in
relative minority achievement.
As a second way of addressing potential selection into taking the SAT, we
note that high-achieving students likely to apply to Berkeley and UCLA are
unlikely to have reduced the rate at which they took the SAT after Prop 209. As
shown in Table 4, when we restrict our sample to students with a high probability
of applying to Berkeley or UCLA, we find no evidence on an increase in either the
minority-white SAT gap or the minority-white GPA gap.
5.4 Why Our Findings Differ from Previous Work
Standing in contrast to the results presented here, Furstenberg (2010) finds a
statistically significant widening of the black-white SAT gap in California
following Prop 209. However, our analysis improves upon his in several ways.
First, his College Board sample only includes the 1996-2000 cohorts; his paper
compares the 1996-1997 cohorts to the 1998-2000 cohorts. However, interpreting
results from 1996-1998 is difficult since, as discussed above, the UC Regents first
announced their intention to end their use of racial preferences in July 1995. Thus,
it is possible that students began responding to the policy change long before
1998, his first post-policy change year. Second, Furstenberg’s data consist of a
30-percent sample of SAT takers, while we have obtained a more comprehensive
dataset containing all Californian test takers, all black and Hispanic test takers
nationwide, and a 25-percent sample of the remaining non-Californian whites. All
together, our sample contain 51 percent of test takers during the 1994 to 2001
period. As a result, our estimates are obtained from a much larger sample.
An additional previous empirical study of the impact of affirmative action
bans on human capital accumulation, Caldwell (2010), examines PIAT math test
scores using the Children of the NLSY 79 (CNLSY). Caldwell finds that Prop 209
increased the racial test score gap. We obtained the same restricted version of the
CNLSY used by Caldwell and successfully replicated his findings. However, there
are several issues with his analysis.
First, the CNLSY was not designed to yield a representative sample at the
state level. From the NLS FAQ,22

Antonovics and Backes Page 17 of 30
The National Longitudinal Surveys are designed to represent specific birth
cohorts at the national level. The surveys cannot provide representative
estimates for States [...] NLS data files with geographic variables are
available on a restricted basis for authorized researchers to use, but the
permitted uses do not include producing estimates for States.
Thus, it may be difficult to generalize the findings obtained from the
CNLSY because it is not a randomly selected sample of Californians. While the
College Board data used in this paper is also not representative of all Californian
high school students, it does include all Californian SAT test takers and these are
the most likely to respond to Prop 209.
Compounding the non-representativeness of the CNLSY sample are the
relatively small sample sizes in the panel. For example, one of Caldwell’s strongest
results – suggesting that the PIAT math scores of 13 and 14 year olds fell
considerably for blacks in California relative to blacks in the rest of the country –
is estimated from only 62 Californian blacks, with 17 of these from the period
after Prop 209. This is important because, as noted in Wooldridge (2006), small
sample sizes exacerbate the problems inherent to estimation with only one policy
change state.23
Finally, neither Furstenberg nor Caldwell takes into account the limited
number of treated states in evaluating the statistical significance of their results.
6 Conclusion
Much of the popular debate surrounding affirmative action in higher education
focuses on how it affects the allocation of students to universities, taking the
achievement of high school graduates as fixed. However, the disparities in
educational preparation which drive racial differences in enrollment at selective
colleges arise early in the education process and are formed well before college
admissions come into play. As affirmative action was originally conceived to
mitigate these gaps in racial achievement, it is natural to ask whether and how the
removal of racial preferences affects these gaps. In addition, a number of scholars
have pointed out that since policies such as Prop 209 give colleges and universities
an incentive to place a greater weight on non-academic factors in determining

Antonovics and Backes Page 18 of 30
admissions, they could lower student quality by weakening all students’ incentives
to invest in their academic qualifications prior to college entry.
Our results provide little support for the idea that the end of raced-based
affirmative action at the UC lowered either overall academic achievement or the
academic achievement of minorities relative to whites. This finding is consistent
with several previous studies that have shown a minimal response to Prop 209 in
terms of both application behavior and enrollment behavior.
Competing interests
The authors declare that they have no competing interests.
Acknowledgements
We thank Rick Sander, David Card and Julian Betts for their help obtaining the data we use. We also thank Eric
Furstenberg for sharing the details of his analysis of the effects of Prop 209 on SAT scores. We thank Terrance
August, Julie Cullen, Zoltan Hajnal, Rick Hanushek, Valerie Ramey, two anonymous referees, and seminar
participants at UC San Diego for their helpful comments.
Ben Backes was supported in part by grants from both the Bill & Melinda Gates Foundation and the Smith
Richardson Foundation to CALDER at the American Institutes for Research. The opinions expressed are those of the
authors and do not represent views of the Institute or the funders.
Author details
1Department of Economics, UC San Diego, 9500 Gilman Drive #0508, 92093-0508 La Jolla, CA. 2American
Institutes for Research / CALDER, 1050 Thomas Jefferson St NW, 20007 Washington, DC.
References
1. Abadie, A., Diamond, A., Hainmueller, J.: Synthetic Control Methods for Comparative Case Studies:
Estimating the Effect of California’s Tobacco Control Program. Journal of the American Statistical Association
105(490), 493–505 (2010)
2. Antonovics, K., Backes, B.: Were Minority Students Discouraged From Applying to University of California
Campuses After the Affirmative Action Ban? Education Finance and Policy 8(2), 208–250 (2013)
3. Antonovics, K., Sander, R.H.: Affirmative Action Bans and the ‘Chilling Effect’. American Law and Economics
Review 15(1), 252–299 (2013)
4. Antonovics, K., Backes, B.: The Effect of Banning Affirmative Action on College Admissions Policies and
Student Quality. Journal of Human Resources 49(2), 295–322 (2014)
5. Arcidiacono, P., Aucejo, E., Coate, P., Hotz, J.: Affirmative Action and University Fit: Evidence from
Proposition 209. Duke Working Paper and NBER Working Paper w18523 (2014)
6. Arcidiacono, P., Lovenheim, M.: Affirmative Action and the Quality-Fit Tradeoff. Duke Working Paper.
http://public.econ.duke.edu/ psarcidi/aa.pdf. Accessed 14 May 2014 (2014)
7. Backes, B.: Do Affirmative Action Bans Lower Minority College Enrollment and Attainment? Evidence from
Statewide Bans. Journal of Human Resources 47(2), 435–455 (2012)
8. Blume, G., Long, M.: Changes in Levels of Affirmative Action in College Admissions in Response to Statewide
Bans and Judicial Rulings. Educational Evaluation and Policy Analysis 36(2), 228–252 (2014)
9. Buchmueller, T.C., DiNardo, J.E., Valletta, R.G.: The Effect of an Employer Health Insurance Mandate on
Health Insurance Coverage and the Demand for Labor: Evidence from Hawaii. American Economic Journal:
Economic Policy 3(4), 25–51 (2011)
10. Caldwell, R.: The Effects of University Affirmative Action Policies on the Human Capital Development of
Minority Children: Do Expectations Matter? RePEc Working Paper.
http://ideas.repec.org/p/kan/wpaper/200812.html. Accessed 14 May 2014 (2010)

Antonovics and Backes Page 19 of 30
11. Coate, S., Loury, G.C.: Will affirmative-action policies eliminate negative stereotypes? The American Economic
Review 83(5), 1220–1240 (1993)
12. Cortes, K.E.: Do Bans on Affirmative Action Hurt Minority Students? Evidence from the Texas Top 10% Plan.
Economics of Education Review 29(6), 1110–1124 (2010)
13. Cortes, K.E., Friedson, A.I.: Ranking Up by Moving Out: the Effect of the Texas Top 10% Plan on Property
Values. National Tax Journal 67(1), 51–76 (2014)
14. Cullen, J.B., Long, M.C., Reback, R.: Jockeying for Position: Strategic High School Choice Under Texas’ Top
Ten Percent Plan. Journal of Public Economics (2012)
15. Dickson, L.M.: Does Ending Affirmative Action in College Admissions Lower the Percent of Minority Students
Applying to College? Economics of Education Review 25(1), 109–119 (2006)
16. Donald, S.G., Lang, K.: Inference with Difference-in-Differences and Other Panel Data. The Review of
Economics and Statistics 89(2), 221–233 (2007)
17. Fryer, R.G., Loury, G.C.: Valuing Diversity. Journal of Political Economy 121(4), 747–774 (2013)
18. Fryer, R.G., Loury, G.C., Yuret, T.: An Economic Analysis of Color-Blind Affirmative Action. Journal of Law,
Economics, and Organization 24(2), 319–355 (2008)
19. Furstenberg, E.: College Admissions Reform and Racial SAT Score Gaps: An Empirical Analysis. Working Paper
(2010)
20. Hickman, B.R.: Using Auction Theory to Study Human Capital Investment in Matching Markets: a Look at
Affirmative Action in College Admissions. Working Paper (2012)
21. Hickman, B.R.: Pre-College Human Capital Investment and Affirmative Action: A Structural Policy Analysis of
US College Admissions,. Working Paper (2013)
22. Hinrichs, P.: The Effects of Affirmative Action Bans on College Enrollment, Educational Attainment, and the
Demographic Composition of Universities. Review of Economics and Statistics 94(3), 712–722 (2012)
23. Moulton, B.R.: An Illustration of a Pitfall in Estimating the Effects of Aggregate Variables on Micro Unit. The
Review of Economics and Statistics 72(2), 334–38 (1990)
24. Ray, D., Sethi, R.: A Remark on Color-Blind Affirmative Action. Journal of Public Economic Theory 12(3),
399–406 (2010)
25. Vigdor, J.L., Clotfelter, C.T.: Retaking the SAT. Journal of Human Resources 38(1), 1–33 (2003)
26. Wooldridge, J.W.: Cluster Sample Methods in Applied Econometrics: An Extended Analysis. Michigan State
University. Unpublished Manuscript. (2006)
Endnotes
1Establishing the list of states in which race-based affirmative action has been prohibited is compli-
cated by ambiguities in case law, but arguably includes Alabama, Arizona, California, Florida, Georgia,
Louisiana, Michigan, Mississippi, Nebraska, New Hampshire, Oklahoma, Texas and Washington. See
Blume and Long (2014) for a nice discussion of the policy environment surrounding affirmative action.
2We discuss the theoretical literature in greater detail below.
3In this paper, we use the terms “color-sighted affirmative action” and “race-based affirmative
action” interchangeably.
4Hickman’s color-blind admission policy (in which universities do not consider race at all) differs
from color-blind affirmative action (in which colleges implicitly favor minorities).
5Searching the LexisNexis article database gives the first mention of Prop 209 in July 1996.
6Calculation made using UC application data
(http://www.ucop.edu/news/archives/2001/applications 2001/table1.pdf) and California high
school graduation data (http://www.cpec.ca.gov/completereports/2003reports/03-09/Display1.PDF).
7The UC uses the term underrepresented minority to refer to blacks, Hispanics and Native Americans.
8For example, “In an attempt to improve minority access to UC without the help of affirmative
action, the university’s investment in kindergarten-through-12th-grade outreach has rocketed from
about $60 million in 1995 to $180 million last year and a planned $250 million this year” (2000, January
21). UC Regents Urged to Step Up Minority Outreach at Schools. The San Francisco Chronicle.
9At the UC, URMs include Hispanics, blacks and Native Americans.

Antonovics and Backes Page 20 of 30
10In principle, these two states could be included in our base specification estimated by Equation 1.
However, including these states in the permutation tests we discuss below is problematic because the
limited number of minority students cause wildly variable estimates within those states.11Adding Asians to the excluded group in the DDD regressions gives similar results.12When estimating β01 for states other than California, California is treated as a control state.13These states include Alabama (2002), Arizona (2010), Georgia (2002), Michigan (2006), Nebraska
(2008), and Oklahoma (2012).14In Texas, students could attend a university of their choice while in Florida, admission was guar-
anteed to at least one public university.15For example: Healy, Patrick (1998, April 24). Affirmative Action Survives at Colleges in
Some States Covered by Hopped Ruling. The Chronicle of Higher Education. Retrieved from
http://www.chronicle.com.16The results for the black-white and Hispanic-white gaps presented in this paper are similar when
including Texas and Washington with the treatment group.17In April 1995, the College Board recentered the SAT score scales to reestablish a mean score of
about 500. To ensure consistency over time, we use College Board-provided recentered scores for all
years.18The other control states are similar to those shown here but are not displayed in the figure due to
lack of clarity when too many states are plotted at once.19The relative ranking of the states shown in Figure 3 is largely driven by SAT participation rates,
with low participation rates generally corresponding to high average scores. For example, Alabama has
relatively high average SAT scores despite its poor performance on most standardized tests, such as
the NAEP, because only about 10% of high school graduates in Alabama take the SAT.20We also investigated children of parents who attended at least some college. Unsurprisingly, these
results are similar to the full sample since about 80% of the sample has at least one parent who attended
at least some college.21Published by the National Center for Education Statistics, Institute of Education Sciences, U.S. De-
partment of Education. Washington, DC. Available at http://nces.ed.gov/programs/digest/; Accessed:
05/18/201222http://www.bls.gov/nls/nlsfaqs.htm#anch1423The authors also obtained restricted-use data from the eighth grade math sample of the National
Assessment of Educational Progress (NAEP), which has the advantage of being designed to be repre-
sentative at the state level. However, the NAEP suffers from two serious drawbacks. First, background
information is relatively sparse: for example, parental education but not income is available. Second,
smaller sample sizes result in estimates that are considerably less precise than those from the College
Board data.
Antonovics and Backes Page 21 of 30
Figures
−.8
−.6
−.4
−.2
0.2
1994 1996 1998 2000 2002Year
Black Hisp
White All
CA
−.8
−.6
−.4
−.2
0.2
1994 1996 1998 2000 2002Year
Black Hisp
White All
US
(a) SAT Math Scores−
.8−
.6−
.4−
.20
.2
1994 1996 1998 2000 2002Year
Black Hisp
White All
CA
−.8
−.6
−.4
−.2
0.2
1994 1996 1998 2000 2002Year
Black Hisp
White All
US
(b) SAT Verbal Scores
−.6
−.4
−.2
0.2
1994 1996 1998 2000 2002Year
Black Hisp
White All
CA
−.6
−.4
−.2
0.2
1994 1996 1998 2000 2002Year
Black Hisp
White All
US
(c) High School GPA
Figure 1: College Board outcome variables. Each panel shows
the mean of the normalized outcome (mean zero and standard de-
viation one) by race and year. The U.S. panel excludes California,
Florida, Louisiana, Mississippi, Texas, Washington, North Dakota, and
Wyoming.

Antonovics and Backes Page 22 of 30
05
1015
−.4 −.2 0 .2
SAT Math
05
1015
−.4 −.2 0 .2 .4
SAT Verbal
05
1015
−.3 −.2 −.1 0 .1 .2
GPA
Fre
quen
cy
(a) CA*Post
05
1015
2025
−.2 0 .2 .4 .6
SAT Math
05
1015
2025
−.2 0 .2 .4 .6 .8
SAT Verbal
05
1015
−.2 0 .2 .4 .6
GPA
Fre
quen
cy
(b) CA*Post*Black
05
1015
20
−.4 −.2 0 .2 .4
SAT Math
05
1015
20
−.2 0 .2 .4
SAT Verbal
05
1015
20
−.2 0 .2 .4
GPA
Fre
quen
cy
(c) CA*Post*Hispanic
Figure 2: Placebo Test Coefficients. Distribution of DDD coeffi-
cient estimates for each of the 44 states in the sample, with California
represented by red line. See text.

Antonovics and Backes Page 23 of 30
−.2
0.2
.4.6
Nor
mal
ized
Mat
h S
core
1994 1996 1998 2000 2002year
CA ALAK AZAR COCT DE
SAT Math Scores in Various States
Figure 3: Mean of normalized SAT math scores. Mean zero and
standard deviation one.

Antonovics and Backes Page 24 of 30
01
23
Den
sity
0 .2 .4 .6 .8Probability
Density of Predicted Score−Sending Likelihood
Figure 4: Density of predicted score-sending. Predicted score-
sending obtained by regressing the likelihood of score-sending for Cal-
ifornian pre-period cohorts to at least one of Berkeley or UCLA on de-
mographic characteristics consisting of parental education and income,
race, gender, first language spoken, and citizenship status. Details in
text. Each vertical line represents the boundary of a quartile.

Antonovics and Backes Page 25 of 30
0.20
0.30
0.40
0.50
0.60
0.70
0.80
1995 1996 1997 1998 1999 2000 2001
California SAT Takers as a Frac2on of California High School Graduates by Year and Race
Asian
Black
Hispanic
White
Figure 5: Share of SAT Takers. Fraction of high school graduates
by race in California who took the SAT.
Antonovics and Backes Page 26 of 30
Tables
Table 1: California’s Proposition 209 Timeline
Date Event
Spring 1995 1996 graduation cohort begins taking SAT
July 1995 Regents of UC pass SP-1
Fall 1995 1996 graduation cohort finishes taking SAT
Spring 1996 1997 cohort begins taking SAT
July 1996 First mention of Prop 209 in media
November 1996 Prop 209 passed by voters
Fall 1996 1997 cohort finishes taking SAT
Spring-Fall 1997 1998 cohort takes SAT
November 1997 Supreme Court declines to review case, Prop 209 becomes law
Fall 1998 First affected cohort (1998) enrolls
Notes: See text for description.

Antonovics and Backes Page 27 of 30
Table 2: College Board Summary Statistics
California Rest of Country
All Black Hispanic White Asian All Black Hispanic White Asian
SAT Math 514 427 453 536 548 513 424 464 524 559
(114) (101) (101) (102) (120) (110) (96.5) (106) (104) (120)
SAT Verbal 495 434 445 529 485 511 435 467 525 502
(114) (103) (103) (102) (123) (107) (98.4) (108) (101) (128)
GPA 3.26 2.89 3.1 3.33 3.38 3.22 2.9 3.04 3.26 3.37
(.627) (.624) (.624) (.602) (.612) (.659) (.661) (.659) (.645) (.64)
Male .41 .43 .42 .46 .47 .46 .41 .43 .46 .48
U.S. citizen .86 .96 .83 .95 .67 .95 .94 .83 .98 .68
ESL .20 .03 .36 .05 .43 .05 .02 .28 .02 .38
Income ($10,000s) 5.31 3.96 3.65 6.54 4.54 5.65 3.7 3.97 6.06 5.09
(3.5) (2.93) (2.75) (3.46) (3.37) (3.27) (2.7) (3.03) (3.21) (3.46)
Mom educ (yrs) 13.9 14.5 10.6 15.4 13.6 14.8 14.3 13 15 14.1
(4.32) (3.1) (5.28) (2.88) (4.54) (3.18) (3.11) (4.26) (2.98) (4.33)
Dad educ (yrs) 14.4 14.3 10.8 15.9 14.4 15.1 13.9 13.1 15.4 15.1
(4.49) (3.28) (5.51) (3.1) (4.43) (3.43) (3.33) (4.62) (3.22) (4.29)
Observations 829336 56636 172424 410050 190226 1608725 490165 186190 867729 64641
Notes: Standard deviations in parentheses. Rest of country excludes California, Florida, Louisiana,
Mississippi, Texas, Washington, North Dakota, and Wyoming. Sample includes 1994-1996 and
1998-2001.

Antonovics and Backes Page 28 of 30
Table 3: College Board SAT and GPA DDD Estimates
SAT M SAT V GPA SAT M SAT V GPA
(1) (2) (3) (4) (5) (6)
Panel 1: 1994-6 (pre) vs 1998-2001 (post)
Post*CA 0.003 0.020*** 0.019*** 0.001 0.016*** 0.018***
(0.005) (0.004) (0.005) (0.004) (0.003) (0.005)
[-.13, .14] [-.11, .14] [-.13, .18] [-.14, .13] [-.11, .13] [-.13, .18]
Post*Black*CA 0.022** 0.011 0.069*** 0.024** 0.013* 0.067***
(0.010) (0.007) (0.013) (0.010) (0.007) (0.012)
[-.29, .22] [-.2, .2] [-.19, .29] [-.29, .23] [-.22, .2] [ -.18, .28]
Post*Hispanic*CA -0.026*** -0.029*** 0.062** -0.016*** -0.018*** 0.073***
(0.006) (0.008) (0.027) (0.005) (0.007) (0.025)
[-.15, .32] [-.18, .37] [-.13, .3] [-.16, .3] [-.17, .36] [-.13, .28]
Observations 2488390 2488390 2574569 2488390 2488390 2574569
R-squared 0.255 0.239 0.136 0.255 0.239 0.136
Panel 2: 1994-5 (pre) vs 1999-2001 (post)
Post*CA 0.001 0.046*** 0.014 -0.001 0.042*** 0.013
(0.008) (0.008) (0.009) (0.008) (0.007) (0.009)
[-.22, .14] [-.26, .22] [-.23, .24] [-.23, .13] [-.26, .21] [-.24, .24]
Post*Black*CA 0.023 0.004 0.082*** 0.025* 0.008 0.080***
(0.014) (0.009) (0.015) (0.014) (0.009) (0.014)
[-.24, .22] [-.15, .35] [-.16, .39] [-.25, .21] [-.17, .35] [-.16, .38]
Post*Hispanic*CA -0.040*** -0.045*** 0.062* -0.028*** -0.034*** 0.073**
(0.005) (0.007) (0.035) (0.005) (0.006) (0.034)
[-.16, .35] [-.16, .27] [-.16, .34] [-.18, .32] [-.16, .26] [-.16, .32]
Observations 1845603 1845603 1907498 1845603 1845603 1907498
R-squared 0.257 0.241 0.138 0.257 0.242 0.138
Demographics x x x x x x
Post*Demographics x x x
Notes: Each column shows the coefficient estimates from a regression of the outcome variable listed at
the top of each column on an indictor for whether the student was from California, an indictor for whether
they took the SAT in the post period, and an indicator for the student’s race, along with the full set
of interactions between these variables. Additional controls for parental education and income, gender,
first language spoken, and citizenship status are also included in the regressions. All outcome variables
normalized to have mean zero and standard deviation one. Included time trends are linear state-specific
time trends. The excluded racial group includes white, other, and unknown. Excludes Louisiana, Florida,
Mississippi, Texas, Washington, North Dakota, and Wyoming.
Clustered standard errors shown in parenthesis. Confidence intervals generated by permutation tests
displayed in brackets.
Significance indicators associated with clustered standard errors: *** p<0.01, ** p<0.05, * p<0.10.

Antonovics and Backes Page 29 of 30
Table 4: College Board SAT and GPA DDD Estimates for Students in
Top Quartile by Likelihood of Score-sending to Berkeley or UCLA
SAT M SAT V GPA SAT M SAT V GPA
(1) (2) (3) (4) (5) (6)
1994-6 (pre) vs 1998-2001 (post)
Post*CA 0.009 0.017 0.028 0.017 0.021 0.036**
(0.013) (0.015) (0.017) (0.013) (0.014) (0.018)
[-.6, .31] [-1.1, .28] [-.85, .56] [-.6, .3] [-1.1, .27] [-.86, .55]
Post*Black*CA 0.014 0.033** -0.014 -0.006 0.031** -0.016
(0.013) (0.014) (0.016) (0.012) (0.014) (0.015)
[-.5, .55] [-.51, .76] [-.51, .61] [-.52, .55] [-.51, .76] [-.51, .61]
Post*Hisp*CA 0.002 0.011 0.078*** -0.001 0.012 0.072***
(0.019) (0.013) (0.022) (0.016) (0.013) (0.018)
[-.38, .78] [-.32, .77] [-.38, .38] [-.4, .75] [-.31, .74] [-.38, .37]
Observations 347122 347122 353738 347122 347122 353738
R-squared 0.183 0.269 0.088 0.187 0.272 0.090
1994-5 (pre) vs 1999-2001 (post)
Post*CA -0.015 0.026 0.052 -0.006 0.030 0.062*
(0.029) (0.030) (0.034) (0.029) (0.030) (0.034)
[-.92, .6] [-1.1, .39] [-1.2, .72] [-.93, .59] [-1.1, .4] [-1.2, .71]
Post*Black*CA -0.002 0.029 -0.014 -0.023 0.024 -0.012
(0.017) (0.018) (0.022) (0.018) (0.018) (0.021)
[-.39, .52] [-.4, .71] [-.82, .87] [-.37, .51] [-.4, .69] [-.82, .86]
Post*Hisp*CA -0.003 -0.000 0.065** -0.009 0.003 0.061**
(0.023) (0.015) (0.030) (0.017) (0.014) (0.023)
[-.56, 1.1] [-.53, .66] [-.42, .55] [-.55, 1.1] [-.52, .64] [-.43, .54]
Observations 252871 252871 257127 252871 252871 257127
R-squared 0.184 0.269 0.088 0.189 0.272 0.091
Demographics x x x x x x
Post*Demographics x x x
Notes: Compares Californians in the top predicted quartile of score-sending to Berkeley or UCLA with
students in other states who would have been predicted to be in that quartile had they been in California.
See notes from Table 3.
Significance indicators associated with clustered standard errors: *** p<0.01, ** p<0.05, * p<0.10.

Antonovics and Backes Page 30 of 30
Table 5: Sensitivity of Estimates to Selection by Black Students
SAT M SAT V GPA SAT M SAT V GPA
(1) (2) (3) (4) (5) (6)
Panel 1: 1994-6 (pre) vs 1998-2001 (post)
Post*CA 0.005 0.022*** 0.019*** 0.003 0.019*** 0.019***
(0.005) (0.004) (0.005) (0.004) (0.003) (0.005)
[-.13, .14] [-.11, .14] [-.13, .18] [-.14, .13] [-.11, .13] [-.13, .18]
Post*Black*CA -0.049*** -0.065*** 0.057*** -0.047*** -0.063*** 0.055***
(0.010) (0.007) (0.013) (0.010) (0.007) (0.012)
[-.28, .23] [-.19, .21] [-.19, .29] [-.29, .24] [-.21, .21] [-.18, .29]
Post*Hispanic*CA -0.026*** -0.029*** 0.062** -0.016*** -0.018*** 0.073***
(0.006) (0.008) (0.027) (0.005) (0.007) (0.025)
[-.15, .32] [-.18, .37] [-.13, .3] [-.16, .3] [-.17, .36] [-.13, .28]
Observations 2488390 2488390 2574569 2488390 2488390 2574569
R-squared 0.256 0.239 0.136 0.256 0.240 0.136
Panel 2: 1994-5 (pre) vs 1999-2001 (post)
Post*CA 0.003 0.048*** 0.014 0.001 0.044*** 0.014
(0.008) (0.008) (0.009) (0.008) (0.007) (0.009)
[-.22, .14] [-.26, .22] [-.23, .24] [-.23, .13] [-.26, .21] [-.24, .24]
Post*Black*CA -0.052*** -0.076*** 0.070*** -0.050*** -0.072*** 0.068***
(0.014) (0.009) (0.015) (0.014) (0.009) (0.015)
[-.23, .22] [-.14, .36] [-.16, .39] [-.24, .21] [-.17, .35] [-.16, .38]
Post*Hispanic*CA -0.040*** -0.045*** 0.062* -0.028*** -0.034*** 0.073**
(0.005) (0.007) (0.035) (0.005) (0.006) (0.034)
[-.16, .34] [-.16, .27] [-.16, .34] [-.18, .32] [-.16, .26] [-.16, .32]
Observations 1845603 1845603 1907498 1845603 1845603 1907498
R-squared 0.258 0.242 0.138 0.258 0.242 0.139
Demographics x x x x x x
Post*Demographics x x x
Notes: See notes from Table 3.
The observations of the lowest 1 percent of SAT scores for Californian post-period blacks are replicated
an additional four times to test for sensitivity to selection. See text.
Significance indicators associated with clustered standard errors: *** p<0.01, ** p<0.05, * p<0.10.