the dynamics of relations between systematic risk
TRANSCRIPT

International Journal of Business Economics (IJBE) Vol, 1 Issue 2, pp 102-116, March 2020 http://jurnal.umsu.ac.id/index.php/ijbe eISSN 2686-472X
102
Keywords: : systematic risk, earnings per share, price to earnings ratio, return on equity, return on assets and stock prices
The Dynamics of Relations Between Systematic Risk,
Fundamental Variables and Stock Prices in Pharmaceutical
Companies
Sri Wahyuni Jamal
ABSTRACT
This study aims to analyze systematic risk, earnings per share, price to earnings
ratio, return on equity, and return on assets on stock prices in pharmaceutical
companies listed on the Indonesia Stock Exchange. The method used in this
research is quantitative method. Data collection techniques are carried out
through secondary data that is data obtained indirectly by studying documents
related to research. This study uses SPSS 22. Data analysis techniques with
multiple linear regression. After conducting research with the hypothesis test
found that partially the Return on Equity and Return on Assets variables
significantly influence the stock price while the systematic risk variable, Earning
per Share and Price Earning Ratio do not significantly influence the stock price.
Then simultaneously using the F test, found systematic risk variables, Earning
per Share, Price Earning Ratio, Return on Equity and Return on Assets
simultaneously or simultaneously have a significant effect on stock prices on
Pharmaceutical companies listed on the Indonesia Stock Exchange. This is a
factor that should be considered by investors and companies alike, to pay more
attention to the factors that contribute to the share price for the long-term
sustainability of the company.
.
DOI : https://doi.org/ 10.30596/ijbe.v1i2.4438
JEL Classification: G00, G14
Published by International Journal of Business Economics
(IJBE), Indonesia | Copyright © 2020 by the Author(s) | This is an open access article distributed under the Creative Commons Attribution License http://creativecommons.org/licenses/by/4.0),
which permitsunrestricted use, distribution, and reproduction in any medium, provided the original work is properly cited.
Cite this article as:
Sri Wahyuni Jamal, S. W. (2020). The Dynamics Of Relations Between Systematic
Risk, Fundamental Variables And Stock Prices in Pharmaceutical Companies.
International Journal of Business Economics (IJBE), 1(2), 102-116.
Universitas Muhammadiyah Kalimantan Timur
Jl. Ir. H. Juanda No.15, Sidodadi, Samarinda, Kalimantan Timur, Indonesia
Corresponding Author: [email protected]
ORIGINAL ARTICLE

International Journal of Business Economics (IJBE) Vol, 1 Issue 2, pp 102-116, March 2020 http://jurnal.umsu.ac.id/index.php/ijbe eISSN 2686-472X
103
INTRODUCTION
Pharmaceutical companies are certainly already familiar to us, especially to the people
of Indonesia. The company is built to fulfil the community’s needs of medicine. There have
been many pharmacies established in all regions so that they are accessible to everyone.
But, whether the pharmaceutical companies listed on the Indonesia Stock Exchange are
able to perform their financial performance well is the question. There are many investors
who still doubt the performance of pharmaceutical companies in Indonesia because they do
not know how the operational activities of the companies. The investor's doubts in investing
as they consider the risks that might arise will affect the price on the stocks they have
invested.
Therefore, investors should take into account some very important things in the investment
decision making, such as how much the stock price is instilled, how much risk level is
incurred and how much financial performance level (in the case of a fundamental variable) on
the investment.
Risk will always be present in every investment, because investors must project how much
revenue will be received during the investment period. The estimation of expected revenue is
not necessarily the same as the real revenue due to certain factors that influence. If these
factors can be predicted beforehand then it will be referred to as a risk. But, if the situation to
be faced cannot be predicted beforehand, it is called uncertainty.
Basically, investors will always pay attention to the level of stock risk, in this case, stock risk
that cannot be eliminated by diversification by investors is called systematic risk, symbolized
as a determinant variable of expected stock returns, because high stock risk will provide a
high rate of return, so that will also affect the price of the shares. Since a high stock risk will
provide a high level of return, and vice versa, the lower the risk of a stock, it will provide a
low rate of return as well. However, there are other variables that also affect the level of stock
prices, called fundamental variables such as EPS, PER, ROA and ROE.
The development of pharmaceutical companies in Indonesia has a positive impact on
Indonesian people. With the development of pharmaceutical companies, people’s needs of
medicines will be fulfilled. Indonesian do not have to go out of Indonesia to find medicine
and it also can reduce the cost. However, along with the development of this pharmaceutical
company, research needs to be done on how the fundamental factors affect the price of stocks
in pharmaceutical companies. Then, what strategies to be done by the company to improve its
performance in the field of pharmacy can be estimated, especially its financial performance.
As research conducted by (Angela, 2018), with the title “The Analysis of Stock Price in
Tourism Industry Listed in Indonesia Stock Exchange 2012-2016”, the results show that from
5 independent variables, DER had negative significant to the stock price, CR had negative
significant to the price, EPS positive significant to the stock price, PBV positive significant to
the stock price and ROA negative significant to the stock price. DER, CR, EPS, PBV and
ROA simultaneously had a significant relationship to the stock price.
In the research conducted by (Sulistyowati, 2011), with the title "The influence of
earning per share (EPS), price earning ratio (PER) and dividend payout ratio (DPR) on the
price of shares (empirical study of the Food & Beverages companies listed In IDX),
indicating that partially and simultaneously, EPS, PER and DPR variables have significant
effect on the stock price.
In a study on the effect of fundamental variables on the stock prices of public
companies in the Indonesian stock exchange conducted by (Pasaribu & Gunadarma, 2008), it

International Journal of Business Economics (IJBE) Vol, 1 Issue 2, pp 102-116, March 2020 http://jurnal.umsu.ac.id/index.php/ijbe eISSN 2686-472X
104
shows simultaneous and partial results that growth variable, profitability of leverage position,
liquidity and efficiency of the company significantly affects the share price.
In the research conducted by (Hatta & Dwiyanto, 2012), with the title “The Company
Fundamental Factors and Systematic Risk In Increasing Stock Price” , the results of
estimation stock prices, it is discovered that EPS, PER and HSM variables have positive and
significant effects to stock prices, while DER and NPM variables have negative and
significant effects.
Tamuntuan, (2015), with the title “Analysing the Effect of Return on Equity, Return on
Assets and Earnings per share toward share price:an empirical study of food and beverage
companies listed on Indonesia Stock Exchange” tests conducted show that ROE, ROA and
EPS simultaneously have significant effect toward the share price, yet partially only EPS
does significantly affect the share price, both ROE and ROA don’t have significant effect to
the share price. Talamati & Pangemanan, (2014) with the title “The Effect of Earnings per
Share (EPS) & Return on Equity (ROE) on Stock Price of Banking Company Listed in
Indonesia Stock Exchange (IDX) 2010-2014”, tests conducted show aimultaneously both
EPS and ROE variables affect stock price. Partially, EPS have significant positive effect on
Stock Price while ROE does not affect partially on Stock Price. Mogonta & Pandowo,
(2016) the title “Analyzing the Effect Return on Assets, Return on Equity and Earning Per
Share on Market Share Price: A Study of LQ-45 Mining Companies Listed on Indonesia
Stock Exchange” the results of partially, ROA has positive significant effect on market share
price, ROE has negative effect on market share price and EPS not have significant effect on
market share price. Issah & Ngmenipuo, (2015) the title “An Empirical Study Of The
Relationship Between Profitability Rations and Market Share Prices of Publicly Traded
Banking Financial Institutions in Ghana” these findings a significant linear relationship
between the ROA, ROE and ROI together the market prices per share, with the ROE
contributing more than the ROA. Kabajeh, et al., (2012) the title “The Relationship between
the ROA, ROE and ROI Ratios with Jordanian Insurance Public Companies Market Share
Prices” the results also showed a positive but low relationship between each of ROA ratio
separately and ROI ratio separately with Jordanian insurance public companies share
prices.Anwaar, (2016) “Impact of Firms’ Performance on Stock Returns (Evidence from
Listed Companies of FTSE-100 Index London, UK)” results shows that net profit margin,
return on assets has got significant positive impact on stock returns while earnings per share
has got significant negative impact on stock returns. “The Effect of Earnings Per Share
Categories on Share Price Behaviour: Some South African Evidence” by Robbetze, Villiers,
& Harmse, (2017), results shows that basic EPS correlated best with the changing behavior of
share prices.
“Fundamental Determinants affecting Equity Share Prices on BSE-200 Companies in
India” by Sukhija, (2014), it can be concluded that Earning Per Share is emerged as
significant determinant with the positive sign in three years out of seven years while
Dividend Per Share is significantly negative in two years. Book Value Per Sharehas
influenced the market price of share significantly in five out of seven years. Price Earning
Ratio has emerged a significant positive determinant in two years out of seven years.
Dividend Payout Ratio has emerged as significant determinant of market price of share with
the negative sign in two out of the seven years of study.
Menaje, (2012) the title “Impact of Selected Financial Variables on Share Price of
Publicly Listed Firns in the Philippines”, result of the Spearman Rank order Correlation

International Journal of Business Economics (IJBE) Vol, 1 Issue 2, pp 102-116, March 2020 http://jurnal.umsu.ac.id/index.php/ijbe eISSN 2686-472X
105
disclosed strong positive correlation of EPS with share price. ROA disclosed a weak negative
correlation with share price.
“Corporate Attribute and Share Value Of Listed Pharmaceutical Firms In Nigeria” by
Abba & Suleiman, (2016), the study reveals that firm size, leverage, profitability and growth
have positive and significant relationship with share price implying that they have impact in
increasing share price.
Koluku, Pet al., (2015), “Analysis Of Market Risk, Financial Leverage and Firm Size
Toward Stock Return On Non-Banking Companies Listed in LQ45 Index of IDX”, the results
showed firm size and market risk have significant effect on stock return, while financial
leverage has no significant effect on stock return. Kumar, (2017) “Impact Of Earning per
Share and Price Earning Ratio on Market Price of Share: A Study on Auto Sector in India”
the result of the study concludes that earning per share has found to be a very strong
forecaster of market price of share, while price earnings ratio impact significantly on the
prediction of market price of share of select companies of auto sector as whole. Musyoki,
(2012) “Changes in Share Prices as a Predictor of Acoounting Earning for financial firms
listed in Nairobi Securities Exchange” the result Eleven companies were analyzed and all
ofthem had positive change towards the accounting earnings in relation to the share price.
Additionally,the relationship between accounting variables and the Nairobi Stock Exchange
information indicated mixed results, with some companies showing a strong positive
correlation and others weak correlation.
Inyiama, (2015) with the title “Does Earning per Share Determine Market Price of
Ordinary Shares? Evidence From Nigeria Banking Sector (2000-2013)”, the implication of
the findings is that an increase in earnings has the tendency of increasing significantly the
market price of shares and earnings per share is one of the key factors responsible for
fluctuations in market price of ordinary shares in Nigerian banking sector. Vora, (2018),
“Influence of Financial Performance Indicators on Market Price of Shares of Nifty 50
Companies” that result of the Pearson’s Correlation revealed a very strong and positive
correlation of EPS and market share price. ROA, ROI and ROE unveiled a weak correlation
with market share price.
However, as indicated above several studies have also identified other factors which are
not only covered by fundamental variables and have a strong relationship with stock prices.
In this case, this study combines not only the components of fundamental variables but also
systematic risks in addition to what was considered important by previous studies.
METHODS
This study analyzed the price of shares in pharmaceutical companies listed on the
Indonesia Stock Exchange during the 2013-2017 period. This type of research is a
quantitative approach to examine the effect of systematic risk, EPS, PER, ROA and ROE on
the stock prices of pharmaceutical companies listed on the Indonesia Stock Exchange.
The population in this study were 10 pharmaceutical companies listed on the Indonesia
Stock Exchange.
Table 1. Population of Pharmaceutical Companies
NO STOCK CODE COMPANY
1 DVLA Darya Varia Laboratoria Tbk
2 INAF Indofarma (Persero) Tbk
3 KAEF Kimia Farma (Persero) Tbk

International Journal of Business Economics (IJBE) Vol, 1 Issue 2, pp 102-116, March 2020 http://jurnal.umsu.ac.id/index.php/ijbe eISSN 2686-472X
106
NO STOCK CODE COMPANY
4 KLBF Kalbe Farma Tbk
5 MERK Merck Indonesia Tbk
6 PYFA Pyridam Farma Tbk
7 SCPI Merck Sharp Dohme Pharma Tbk
8 SIDO Industri Jamu & Farmasi Sido Muncul Tbk
9 SQBB Taisho Pharmaceutical Indonesia Tbk
10 TSPC Tempo Scan Pasific Tbk
Source: www.idx.co.id (2019)
For the sample, itwas using probability sampling technique to choose 6 companies with
several criteria as follows:
1. Pharmaceutical companies listed on the Indonesia Stock Exchange during the 2013-
2017 period.
2. The financial statements used were limited to the financial statements of
pharmaceutical companies which were uploaded on the official website of the
Indonesia Stock Exchange for the period 2013-2017.
3. Pharmaceutical companies that had the highest share price in the 2013-2017 period.
4. Companies that sell products that are already well known and familiar among the
Indonesian people.
Table 2. Sample of Pharmaceutical Companies
NO STOCK CODE COMPANY
1 DVLA Darya Varia Laboratoria Tbk
2 INAF Indofarma (Persero) Tbk
3 KAEF Kimia Farma (Persero) Tbk
4 KLBF Kalbe Farma Tbk
5 MERK Merck Indonesia Tbk
6 TSPC Tempo Scan Pasific Tbk
Source: www.idx.co.id (2019)
The data used in this study was a secondary data. Secondary data is data obtained by
people who conduct research from existing sources. In this study, the data was derived from
the official website of Indonesia Stock Exchange: www.idx.co.id. Data collection technique
used in this study was documentation, in which documentation is the collection of data
obtained from existing documents or records that are stored, whether in the form of transcript
notes, books, newspapers and so forth. This study aims to look at the effect of systematic risk,
EPS, PER, ROA and ROE on stock prices. For this reason, data analysis techniques are used
as follows: Multiple Linear Regression. With the formula:
Y = α+ β1 X1 + β2 X2 + β3 X3 + β4 X4+ β5X5 e Description:
Y : Stock Price; α : Constant; β : Regression Coefficient; X1 : Systematic Risk; X2:
EPS; X3 : PER; X4 : ROE; X5 : ROA; e: Error Standard
Classical Assumption Test

International Journal of Business Economics (IJBE) Vol, 1 Issue 2, pp 102-116, March 2020 http://jurnal.umsu.ac.id/index.php/ijbe eISSN 2686-472X
107
This is a requirement in parametric analysis in which the distribution of data must be
normal. For the test, the Kolmogorof-Smirnov One Sample test is used to determine whether
the data distribution for each variable is normal or not. To detect the presence or absence of
multicollinearity by looking at the tolerance and VIF value. The smaller the tolerance valueis,
the greater the VIF will be, the higher the multicollinearity problem will occur. Most studies
mentioned that if tolerance is more than 0.1 and VIF is less than 10 then multicollinearity
does not occur. To recognize the presence or absence of heteroscedasticity by looking at the
pattern of points in scatterplots regression. If the points spread with unclear patterns above
and below the number 0 on the Y axis then there is no heteroscedasticity problem.
To find the presence or absence of autocorrelation the Durbin-Watson test is performed
with the rule if the value of dL< DW > dU and dL< (4-DW) > dU that means autocorrelation
do not occur.
T test, used to determine the effect of partially independent variables on the dependent
variable, whether the effect is significant or not. If a probability of > 0.05 is obtained, it can
be said that the independent variable has no effect on the dependent variable and if a
probability of < 0.05 is obtained, the independent variable significantly influences the
dependent variable. F test or commonly called the Simultaneous Regression Coefficient Test,
which is to find out the independent variables simultaneously against the independent
variables, whether the effect is significant or not. If a probability of > 0.05 is obtained, it can
be said that the independent variable has no effect on the dependent variable and if a
probability of < 0.05 is obtained, the independent variable significantly influences the
dependent variable. Coefficient of determination (R2), to find out how much the ability of the
independent variable to explain the dependent variable.
RESULT AND DISCUSSION
The research data used are as follows:
1. Systematic Risk is a market risk that is general and applies to all shares in the capital
market. The formula is as follows:
Description:
Rm =Market Return
Ri =Stock Return
N =Total of Data
Β =Stock Beta
Table 3. Systematic Risk of Pharmaceutical Companies
No Stock
Code
Period
2013 2014 2015 2016 2017
1 DVLA -8,7350 -1,0019 1,8620 2,2844 0,4993
2 SIDO -14,9112 -0,5557 0,7936 -0,3560 0,2055
3 KAEF 5,8673 6,4098 3,2771 14,1041 -0,0777
4 KLBF -5,1883 2,0054 2,2487 0,9642 0,4938
5 MERK -7,0459 -0,6632 1,2355 2,3362 -0,3253
6 TSPC 3,6951 -0,4498 2,9434 0,8205 -0,3689
(Source: secondary data, www.idx.co.id from 2013-2017,data was processed in 2019)

International Journal of Business Economics (IJBE) Vol, 1 Issue 2, pp 102-116, March 2020 http://jurnal.umsu.ac.id/index.php/ijbe eISSN 2686-472X
108
2. Earning Per Share (EPS), a ratio that describes the portion of earnings for each share
obtained by investors. With the following formula:
Tabel 4. Earning Per Share (EPS) of Pharmaceutical Companies
No Stock
Code
Period
2013 2014 2015 2016 2017
1 DVLA 149 72.26 96.33 135.79 144.87
2 SIDO 27.06 27.68 29.17 32.04 35.59
3 KAEF 38.63 42.24 44.81 48.15 58.84
4 KLBF 41 44.08 42.76 49.06 51.28
5 MERK 1264 8101.44 6363.64 343.4 328.99
6 TSPC 141 128.75 155.99 119.17 120.85
(Source: secondary data, www.idx.co.id from 2013-2017,data was processed in 2019)
3. Price Earning Ratio (PER) shows the amount of money that investors are willing to pay
for each dollar of reported profit. The formula is as follows:
PER =
Table 5. Price Earning Ratio (PER) of Pharmaceutical Companies
No
Stock
Code
Period
2013 2014 2015 2016 2017
1 DVLA 14,77 23,39 13,50 12,92 13,53
2 SIDO 25,87 22,04 18,85 16,23 15,31
3 KAEF 15,27 34,68 19,42 57,11 45,89
4 KLBF 30,49 41,52 30,87 30,88 32,96
5 MERK 8,88 0,99 1,06 26,79 25,84
6 TSPC 21,81 21,40 11,22 16,43 14,89
(Source: secondary data, www.idx.co.id from 2013-2017,data was processed in 2019)
4. Return on Equity (ROE), to measure how much profit or profit belongs to the owner of
his own capital. The formula is as follows:
ROE =
Table 6. Return On Equity (ROE) of Pharmaceutical Companies
No Stock Code Period
2013 2014 2015 2016 2017
1 DVLA 13,75 8,41 11,08 14,09 14,53
2 SIDO 15,46 15,76 16,84 17,42 18,43
3 KAEF 13,28 13,06 13,59 11,96 12,89
4 KLBF 23,18 21,74 18,81 18,86 17,66
5 MERK 34,25 32,78 30,10 26,40 23,95
6 TSPC 11,81 14,14 12,20 11,77 10,97
(Source: secondary data, www.idx.co.id from 2013-2017,data was processed in 2019)
International Journal of Business Economics (IJBE) Vol, 1 Issue 2, pp 102-116, March 2020 http://jurnal.umsu.ac.id/index.php/ijbe eISSN 2686-472X
109
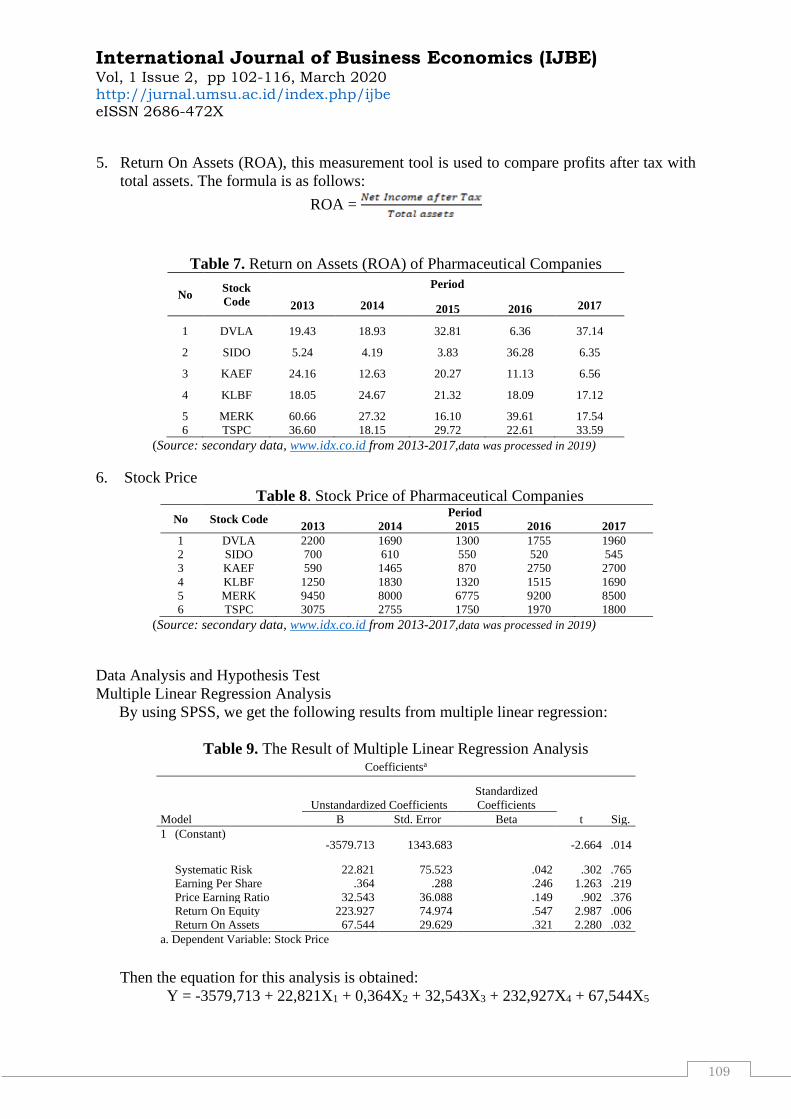
5. Return On Assets (ROA), this measurement tool is used to compare profits after tax with
total assets. The formula is as follows:
ROA =
Table 7. Return on Assets (ROA) of Pharmaceutical Companies
No Stock
Code
Period
2013 2014 2015 2016 2017
1 DVLA 19.43 18.93 32.81 6.36 37.14
2 SIDO 5.24 4.19 3.83 36.28 6.35
3 KAEF 24.16 12.63 20.27 11.13 6.56
4 KLBF 18.05 24.67 21.32 18.09 17.12
5 MERK 60.66 27.32 16.10 39.61 17.54
6 TSPC 36.60 18.15 29.72 22.61 33.59
(Source: secondary data, www.idx.co.id from 2013-2017,data was processed in 2019)
6. Stock Price
Table 8. Stock Price of Pharmaceutical Companies
No Stock Code Period
2013 2014 2015 2016 2017
1 DVLA 2200 1690 1300 1755 1960
2 SIDO 700 610 550 520 545
3 KAEF 590 1465 870 2750 2700
4 KLBF 1250 1830 1320 1515 1690
5 MERK 9450 8000 6775 9200 8500
6 TSPC 3075 2755 1750 1970 1800
(Source: secondary data, www.idx.co.id from 2013-2017,data was processed in 2019)
Data Analysis and Hypothesis Test
Multiple Linear Regression Analysis
By using SPSS, we get the following results from multiple linear regression:
Table 9. The Result of Multiple Linear Regression Analysis Coefficientsa
Model
Unstandardized Coefficients
Standardized
Coefficients
t Sig. B Std. Error Beta
1 (Constant) -3579.713 1343.683 -2.664 .014
Systematic Risk 22.821 75.523 .042 .302 .765
Earning Per Share .364 .288 .246 1.263 .219
Price Earning Ratio 32.543 36.088 .149 .902 .376
Return On Equity 223.927 74.974 .547 2.987 .006
Return On Assets 67.544 29.629 .321 2.280 .032
a. Dependent Variable: Stock Price
Then the equation for this analysis is obtained:
Y = -3579,713 + 22,821X1 + 0,364X2 + 32,543X3 + 232,927X4 + 67,544X5
International Journal of Business Economics (IJBE) Vol, 1 Issue 2, pp 102-116, March 2020 http://jurnal.umsu.ac.id/index.php/ijbe eISSN 2686-472X
110
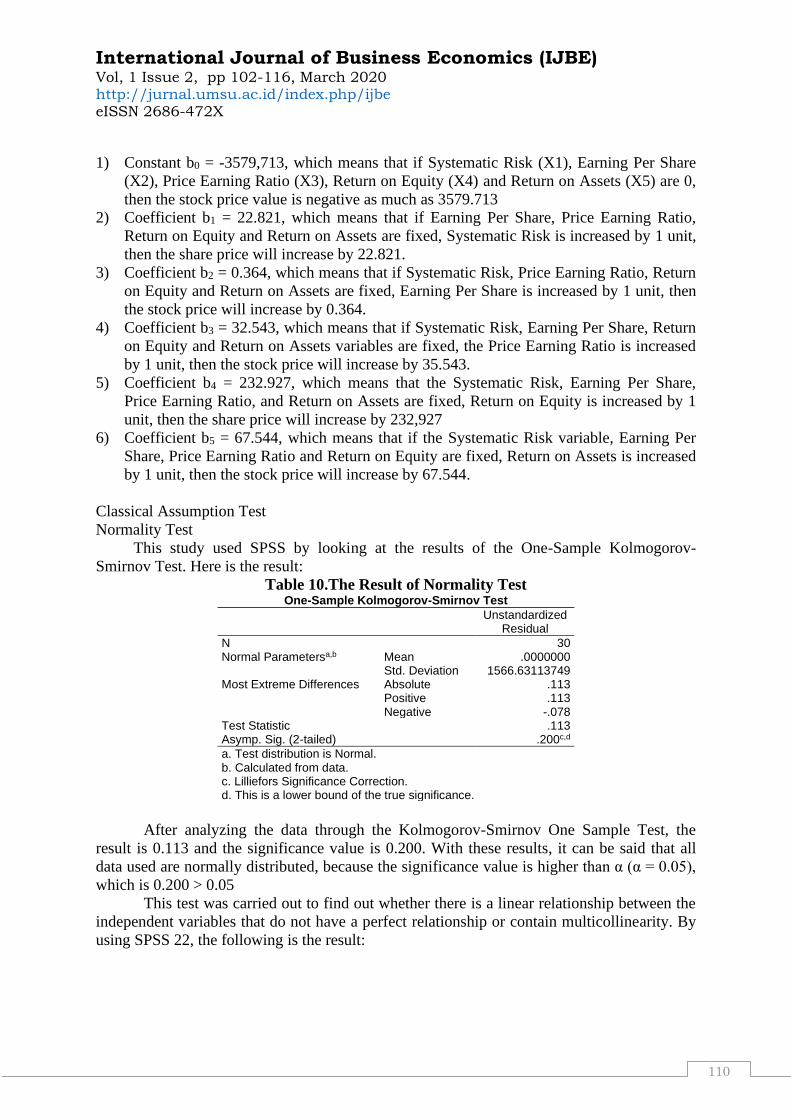
1) Constant b0 = -3579,713, which means that if Systematic Risk (X1), Earning Per Share
(X2), Price Earning Ratio (X3), Return on Equity (X4) and Return on Assets (X5) are 0,
then the stock price value is negative as much as 3579.713
2) Coefficient b1 = 22.821, which means that if Earning Per Share, Price Earning Ratio,
Return on Equity and Return on Assets are fixed, Systematic Risk is increased by 1 unit,
then the share price will increase by 22.821.
3) Coefficient b2 = 0.364, which means that if Systematic Risk, Price Earning Ratio, Return
on Equity and Return on Assets are fixed, Earning Per Share is increased by 1 unit, then
the stock price will increase by 0.364.
4) Coefficient b3 = 32.543, which means that if Systematic Risk, Earning Per Share, Return
on Equity and Return on Assets variables are fixed, the Price Earning Ratio is increased
by 1 unit, then the stock price will increase by 35.543.
5) Coefficient b4 = 232.927, which means that the Systematic Risk, Earning Per Share,
Price Earning Ratio, and Return on Assets are fixed, Return on Equity is increased by 1
unit, then the share price will increase by 232,927
6) Coefficient b5 = 67.544, which means that if the Systematic Risk variable, Earning Per
Share, Price Earning Ratio and Return on Equity are fixed, Return on Assets is increased
by 1 unit, then the stock price will increase by 67.544.
Classical Assumption Test
Normality Test
This study used SPSS by looking at the results of the One-Sample Kolmogorov-
Smirnov Test. Here is the result:
Table 10.The Result of Normality Test One-Sample Kolmogorov-Smirnov Test
Unstandardized
Residual
N 30 Normal Parametersa,b Mean .0000000
Std. Deviation 1566.63113749 Most Extreme Differences Absolute .113
Positive .113 Negative -.078
Test Statistic .113 Asymp. Sig. (2-tailed) .200c,d
a. Test distribution is Normal. b. Calculated from data. c. Lilliefors Significance Correction. d. This is a lower bound of the true significance.
After analyzing the data through the Kolmogorov-Smirnov One Sample Test, the
result is 0.113 and the significance value is 0.200. With these results, it can be said that all
data used are normally distributed, because the significance value is higher than α (α = 0.05),
which is 0.200 > 0.05
This test was carried out to find out whether there is a linear relationship between the
independent variables that do not have a perfect relationship or contain multicollinearity. By
using SPSS 22, the following is the result:

International Journal of Business Economics (IJBE) Vol, 1 Issue 2, pp 102-116, March 2020 http://jurnal.umsu.ac.id/index.php/ijbe eISSN 2686-472X
111
Table 11. The Result of Multicollinearity Test
Model Collinearity Statistics
Tolerance VIF
(Constant)
Systematic Risk ,735 1,361
Earning Per Share ,368 2,718
Price Earning Ratio ,515 1,940
Return on Equity ,417 2,398
Return on Assets ,704 1,421
From the result of this test, it can be seen that the (5) five independent variables have
a Tolerance Value such as, Systematic Risk (X1) is 0.735, Earning Per Share (X2) is 0.368,
Price Earning Ratio (X3) is 0.515, Return on Equity (X4) is 0.417 and Return on Assets (X5)
is 0.704. From these data, all of the independent variable have a tolerance value > 0.1 and a
VIF value < 10, so it can be concluded that there are no signs of multicollinearity.
Similar to the normality test and multicollinearity test, the heteroscedasticity test also
uses SPSS 22. Here is the result:
Figure 1.The Result of Heteroscedasticity Test
It can be seen on Figure 1, the data points are found scattered in the lower and upper
regions of the number 0 and the points do not make a particular pattern. Hence, the regression
model that was formed and the researcher concluded that the heteroscedasticity does not
occur.
this is the result of autocorrelation test:
Table 12.The Result of Autocorrelation Test Model Summaryb
Model R R Square Adjusted R
Square Std. Error of the
Estimate Durbin-Watson
1 .815a .664 .595 1722.107 2.280
a. Predictors: (Constant), Systematic Risk, Earning Per Share, Price Earning Ratio, Return On Equity, Return on Assets b. Dependent Variable: Stock Price

International Journal of Business Economics (IJBE) Vol, 1 Issue 2, pp 102-116, March 2020 http://jurnal.umsu.ac.id/index.php/ijbe eISSN 2686-472X
112
Based on these test results, it is found that the DW value is 2.280 in which dL< DW >
dU or 1.0706 < 2.280 > 1.8326. dL and dU are obtained from the Durbin-Watson table with n
= 30 and k = 5. So it can be said that autocorrelation in multiple linear regression does not
occur.
To test the hypothesis in this study, the researcher was using two methods, partially by
t-test and simultaneously by applying the F-test. The t-test is used to determine the partial
effect between independent variables on the dependent variable. Here is the result:
Table 14. The Result of t-test Coefficientsa
Model
Unstandardized Coefficients
Standardized Coefficients
T Sig. Collinearity Statistics
B Std. Error Beta Tolerance VIF
1 (Constant) -3579.713 1343.683 -2.664 .014
Systematic Risk 22.821 75.523 .042 .302 .765 .735 1.361 Earning Per Share .364 .288 .246 1.263 .219 .368 2.718 Price Earning Ratio 32.543 36.088 .149 .902 .376 .515 1.940 Return On Equity 223.927 74.974 .547 2.987 .006 .417 2.398 Return On Assets 67.544 29.629 .321 2.280 .032 .704 1.421
a. Dependent Variable: Stock Price
From these results, it can be concluded that:
1) Partial test between the independent variable Systematic Risk (X1) and the stock price
(Y) with a significance value of 0.765. Because the significance value is 0.765 > 0.05, it
can be said that systematic risk partially has no significant effect on stock prices.
2) Partial test between the independent variable Earning Per Share (X2) and the stock price
(Y) with a significance value of 0.219. Because the significance value is 0.219 > 0.05, it
means that Earning Per Share partially has no significant effect on stock prices.
3) Partial test between the independent variable Price Earning Ratio (X3) and stock price
(Y) with a significance value of 0.376. Because the significance value is 0.376> 0.05, it
means that Price Earning Ratio partially has no significant effect on stock prices.
4) Partial test between the independent variable Return on Equity (X4) and the stock price
(Y) with a significance value of 0.006. Because the significance value is 0.006 < 0.05, it
can be concluded that Return on Equity partially has a significant effect on stock prices.
5) Partial test between the independent variable Return on Assets (X5) and stock prices (Y)
with a significance value of 0.032. Because the significance value of 0.032 < 0.05 which
means that Return on Assets partially has a significant effect on stock prices.
the following table is the result of simultaneous :
Table 15. Uji F ANOVAa
Model Sum of Squares Df Mean Square F Sig.
1 Regression 140935873.659 5 28187174.732 9.505 .000b
Residual 71175660.508 24 2965652.521 Total 212111534.167 29
a. Dependent Variable: Stock Price
b. Predictors: (Constant), Systematic Risk, Earning Per Share, Price Earning Ratio, Return On Equity, Return On Assets

International Journal of Business Economics (IJBE) Vol, 1 Issue 2, pp 102-116, March 2020 http://jurnal.umsu.ac.id/index.php/ijbe eISSN 2686-472X
113
It can be seen clearly from F-test result that the significant value is0.000, in which if the
significant value 0.000 < 0.05 that means Systematic Risk, Earning per Share, Price Earning
Ratio, Return on Equity and Return on Assets simultaneously have significant effect on stock
price.
The following table is the result of Determination Coefficient calculated by using SPSS
22:
Table16. Coefficient of Determination Model Summaryb
Model R R Square Adjusted R
Square Std. Error of the
Estimate Durbin-Watson
1 .815a .664 .595 1722.107 2.280
a. Predictors: (Constant), Systematic Risk, Earning Per Share, Price Earning Ratio, Return On Equity, Return On Assets b. Dependent Variable: Stock Price
It can be concluded based on the table that the coefficient of determination (R2) is
0.595 or 59.5%. This means that systematic risk, earnings per share, price earning ratio,
return on equity and return on assets simultaneously influence the stock price by 59.5% while
the remaining 40.5% is influenced by other variables outside of the scope of this study.
DISCUSSION
This study found 59.5% of the dependent variable stock price explained by the
independent variable systematic risk, earnings per share, price earning ratio, return on equity
and return on assets. The remaining 40.5% is influenced by other variables outside of the
scope of this study.
H1:Partially, systematic risk does not significantly affect stock prices. This is because
systematic risk is a general risk that always exists and cannot be eliminated by
diversification. Hence, any systematic risk situation will not affect the stock price. The results
of this study are also in accordance with the results of (Darmayanti, 2015) which states that
there is no significant effect between the systematic risk of the stock price. So is the same
with research of (Hatta & Dwiyanto, 2012) that there is no significant effect of CR, DPR,
ROA and β (systematic risk) variables to stock price. H2: Earning per share variable also
does not significantly affect the stock price. Though, we all know in theory, earning per share
is very influential on stock prices. This is because earning per share in pharmaceutical
companies for the 4 years that was being studied have decreased in several pharmaceutical
sub-sectors. So, this does not affect the interests of investors. The results of this are also in
accordance with the results of (Meythi, Kwang En, & Rusli, 2011) which states that earnings
per share doesn’t have significant impact on stock price. So is the same with research of
(Askar, 2016) that there is no significant effect of earning per share variables to stock price.
H3: Price earning ratio variable is found to have no significant effect on stock prices. The
results of this are also in accordance with the results of (Yuliyanti, 2014), shows that PER has
no significant effect on stock prices. So is the same with research of (Suryadi, 2017), which
states that Price Earning Ratio (PER) no significant effect on stock prices. H4: The return on
equity variable is found to have a significant effect on stock prices. This is because the
profitability of pharmaceutical companies is quite above average so that it attracts investors
to invest their capital. Hence, return on equity affects the stock price. The results of this study
are also in accordance with the results of (Octavianty & Aprilia, 2014) which states that the
ROE variable significant affect on stock price. So is the same with research of (Darmayanti,

International Journal of Business Economics (IJBE) Vol, 1 Issue 2, pp 102-116, March 2020 http://jurnal.umsu.ac.id/index.php/ijbe eISSN 2686-472X
114
2015) that there is significant influence between ROE on stock prices. H5: The variable of
return on assets is found to have a significant effect on stock prices. This is because good
ROA reflects the use and management of a company's assets optimal so that it will increase
profitability and the company's stock price.. The results of this study are also in accordance
with the results of (Issah & Ngmenipuo, 2015) which states that there is a positive linear
relationship between ROA, ROE, ROI and the market price of shares of banking financial
institutions quoted on the Ghana Stock Exchange (GSE). So is the same with research of
(Anwaar, 2016) that there is ROA significant effect on stock return.
CONCLUSION
For the F test result (simultaneous test), the researcher found that systematic risk,
earnings per share, price earning ratio, return on equity and return on assets simultaneously
have a significant effect on stock prices on Pharmaceutical companies listed on the Indonesia
Stock Exchange and for the results of t-test (partial test) the researcher found out that the
variable of return on equity and return on assets have a significant effect on stock price. For
other variables such as systematic risk, earnings per share and price earnings ratio, they do
not significantly affect the price of shares listed on the Indonesia Stock Exchange.
REFERENCES
Abba, M., & Suleiman, U. (2016). Corporate Attribute and Share Value Of Listed
Pharmaceutical Firms In Nigeria. Journal of Arts, Science & Commerce, VII(1(1)), 88–
98.
Angela, N. K. (2018). The Analysis of Stock Price in Tourism Industry Listed in Indonesia
Stock Exchange 2012-2016 Abstrak. Journal of Applied Accounting and Finance, 2(2),
153–162.
Anwaar, M. (2016). Impact of Firms’ Performance on Stock Returns (Evidence from Listed
Companies of Ftse-100 Index London, UK). Global Journal of Management and
Business Research (D), 16(1), 31–39.
Askar. (2016). Sistem Informasi Akuntansi Berdasarkan EPS, PBV dan ROA terhadap Harga
Saham. Jurnal Ekonomi, Manajemen Dan Akuntansi, 6(1), 11–22.
Darmayanti, N. (2015). The Effect of Systematic Risk Model of Fundamental and Stock
Company Study Food and Beverage Firm Listing in Indonesia Stock Exchange ( BEI )
Year 2008 - 2012. Research Journal of Finance and Accounting, 6(9), 113–128.
Hatta, A. J., & Dwiyanto, B. S. (2012). The Company Fundamental Factors and Systematic
Risk In Increasing Stock Price. Journal of Economics, Business, and Accountancy
Ventura, 15(110), 245–256.
Inyiama, O. I. (2015). Does Earning per Share Determine Market Price of Ordinary Shares?
Evidence From Nigeria Banking Sector (2000-2013). European Journal of Accounting
Auditing and Finance Research, 3(6), 91–102.
Issah, O., & Ngmenipuo, I. M. (2015). An Emipiral Study Of The Relationship Between
Profitability Rations and Market Share Prices Of Publicly Traded Banking Financial
Institutions in Ghana. International Journal of Economics, Commerce and Management,
III(12), 27–42.
Kabajeh, M. A. ., Al Nu’aimat, S. M. ., & Dahmash, F. . (2012). The Relationship between
the ROA, ROE and ROI Ratios with Jordanian Insurance Public Companies Market
Share Prices. International Journal of Humanities and Social Science, 2(11).
Koluku, R. ., Pengemanan, S. ., & Tumewu, F. (2015). Analysis Of Market Risk, Financial

International Journal of Business Economics (IJBE) Vol, 1 Issue 2, pp 102-116, March 2020 http://jurnal.umsu.ac.id/index.php/ijbe eISSN 2686-472X
115
Leverage and Firm Size Toward Stock Return On Non-Banking Companies Listed in
LQ45 Index of IDX. Jurnal Riset Ekonomi, Manajemen, Bisnis Dan Akuntansi, 3(2),
528–536.
Kumar, P. (2017). Impact Of Earning per Share and Price Earning Ratio on Market Price of
Share: A Study on Auto Sector in India. International Journal of Research-
Granthaalayah, 5(2), 113–118.
Menaje, P. M. (2012). Impact of Selected Financial Variables on Share Price of Publicly
Listed Firms in the Philippines. American International Journal of Contemporary
Research, 2(9), 98–104.
Meythi, Kwang En, T., & Rusli, L. (2011). The effect of liquidity and profitability on the
stock prices of manufacturing companies listed on the Indonesia Stock Exchange. Jurnal
Bisnis Manajemen Dan Ekonomi, 10(2).
Mogonta, K., & Pandowo, M. (2016). Analyzing The Effect Of Return on Assets, Return On
Equity and Earning Per Share on Market Share Price: A Study of LQ-45 Mining
Companies Listed On Indonesia Stock Exchaneg. Jurnal Riset Ekonomi, Manajemen,
Bisnis Dan Akuntansi, 4(2), 703–713.
Musyoki, D. (2012). Changes in share prices as a predictor of accounting earnings for
financial firms listed in Nairobi Securities Exchange. International Journal of Buniess
and Public Management, 2(2l), 1–11.
Octavianty, E., & Aprilia, F. (2014). Pengaruh Earning per Share ( EPS), Book Value per
Share (BVS), Return on Equity (ROE), dan Debt to Equity Ratio (DER) terhadap Harga
Saham Perusahaan BUMN yang Terdaftar di BEI. Jurnal Ilmiah Manajemen Fakultas
Ekonomi, Semester I, 7–15.
Pasaribu, R., & Gunadarma, U. (2008). Pengaruh Variabel Fundamental Terhadap Harga
Saham Perusahaan Publik Di Bursa Efek Indonesia. Jurnal Ekonomi Dan Bisnis, 2(2),
101–113.
Robbetze, N., Villiers, R. De, & Harmse, L. (2017). The Effect Of Earnings Per Share
Categories On Share Price Behaviour: Some South African Evidence. The Journal of
Applied Busniess Research, 33(1), 141–152.
Sukhija, M. S. (2014). Fundamental Determinants affecting Equity Share Prices of BSE- 200
Companies in India. European Journal of Business and Management, 6(31), 160–171.
Sulistyowati, Y. (2011). Pengaruh Earning Per Share ( EPS ), Price Earning Ratio ( PER ),
dan Dividend Payout Ratio ( DPR ) terhadap Harga Saham ( Studi Empiris Pada
Perusahaan Food & Beverages Yang Terdaftar di BEI ). Jurnal Ekonomi Modernisasi,
247–255.
Suryadi, H. (2017). Analisis Pengaruh ROI, DTA, QR, TATO, PER pada Harga Saham
Perusahaan Batubara di BEI. Jurnal Ilmiah Ekonomi Bisnis, 3(1), 16–23.
Talamati, M. R., & Pangemanan, S. S. (2014). The Effect Of Earnings per Share (EPS) &
Return on Equity (ROE) On Stock Price Of Banking Company Listed In Indonesia
Stock Exchange (IDX) 2010-2014. Jurnal Riset Ekonomi, Manajemen, Bisnis Dan
Akuntansi, 3(2), 2010–2014.
Tamuntuan, U. (2015). Analysing The Effect Of Return On Equity, Return On Assets and
Earnings Per Share Toward Share Price: An Emperical Study of Food and Beverage
Companies Listed On Indonesia Stock Exchange. Jurnal Berkala Ilmiah Efisiensi,
15(05), 446–457.
Vora, K. (2018). Influence of Financial Performance Indicators on Market Price of Shares of
Nifty 50 Companies. International Journal of Advance Research in Computer Science

International Journal of Business Economics (IJBE) Vol, 1 Issue 2, pp 102-116, March 2020 http://jurnal.umsu.ac.id/index.php/ijbe eISSN 2686-472X
116
and Management Studies, 6(2), 67–75.
Yuliyanti, L. (2014). Pengaruh Kinerja Perusahaan Terhadap Harga Saham Perusahaan
Automotif and Component di Bursa Efek Indonesia. Jurnal Dinamika Akuntansi Dan
Bisnis, 1(1), 1–11.
www.finance.com
www.idx.co.id