the dynamic visualization technology in brain deceleration injury
TRANSCRIPT
12
The Dynamic Visualization Technology in Brain Deceleration Injury Research
Zhiyong Yin1, Shengxiong Liu2, Daiqin Tao1 and Hui Zhao1 1Chongqing Key Laboratory of Vehicle, Biological Crash Security, Department 4, Institute
of Surgery Research, Daping Hospital, Third Military Medical University, Chongqing 2Department of Biomedical Engineering, School of Pharmacy & Bioengineering
Chongqing University of Technology, Chongqing China
1. Introduction
Road traffic injuriy (RTI) is a serious threat to human life and health. Currently, there are about 130 million people died and about 200 to 500 million people injured in road traffic accidents worldwide each year [1]. In the developing country, for example, in China, there are 10 million people died and 50 million people injured in road traffic accidents each year [2]. With social progress and development of medicine, many diseases (such as some infectious diseases) have been effectively controlled, but the road traffic injury is increasing [3]. The biomechanics of head impact injury has become a research focus in the impact injury biomechanics. The study aims to understand the mechanical response of brain tissue to the impact, and to determine the dose-effect relationship between the brain injury and the mechanical load. It can clarify the mechanism of brain injury and provide a theoretical basis for the development of head injury protection and injury indicators. Besides brain tissue outside the body wrapped in the scalp, there is other non-transparent tissue covering the skull. And brain tissue itself is non-transparent organization. Therefore, it is extremely difficult to research the stress-strain for brain tissue under deceleration impact. In this regard, scholars of various countries have done a lot of meaningful exploration and research. In order to observe the impact stress wave propagation of the skull and brain tissue, Yanping Jiang [4], has developed a brain static and dynamic photoelastic model (Fig.1). As the model deformed by the collision, with the light reflectivity and angle changing accordingly, and the formation of photoelastic fringes, the changes can be calculated by the stripes of the force of brain tissue, for photoelastic fringe dense area with larger force. However, for the mechanical properties of the model and the response calibration and other reasons, it is difficult to conduct quantitative research on stress and strain. In order to produce the same size with the real head of the head model, in 2005, Johnson and Young [5] applied rapid prototyping technology to produce a true copy of the skull (Fig.2). It has been used in the research of the brain impact response, confirming that the effective impact time decreases with the decrease of hammer quality. The model is made with opaque material. However, because of it, it can be only used for the skull study, and not suitable for the force characteristics of brain tissue.
www.intechopen.com

Brain Injury – Pathogenesis, Monitoring, Recovery and Management
246
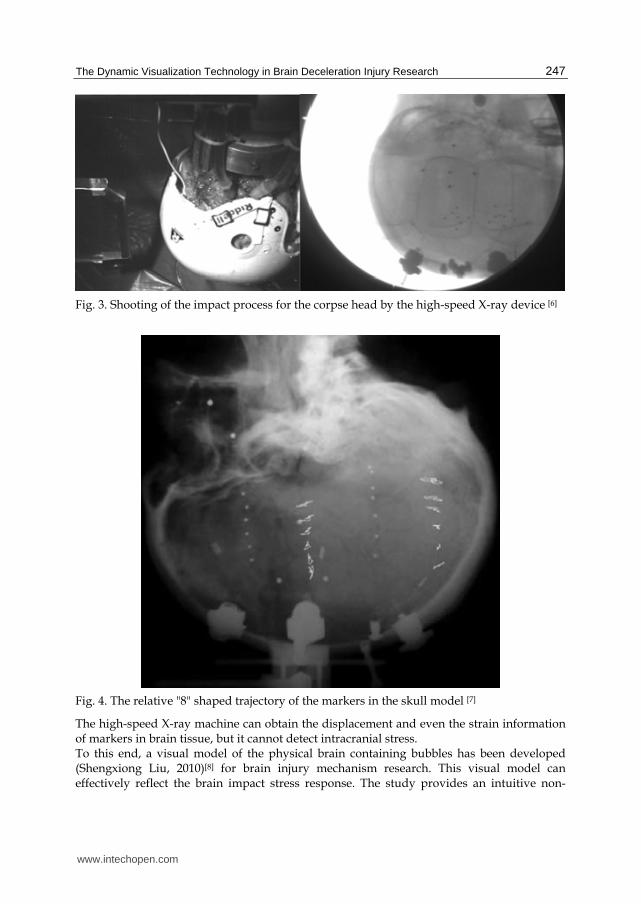
In 2007, there was a very classic corpse occipital head impact experiment finished by Wayne State University and other research organizations (Fig.3) [6,7]. Before the experiment, markers had been made by metal balls and thin-walled tubes whose density was close to the brain tissue. During the impact, markers had been placed in the brain model as well as mini markers planted into the skull, then the high-speed X-ray machine (250 frames/sec) was used to record the impact process. After analyzing for the captured images, it concluded the "8" shaped trajectory (Fig.4) of markers relative to the skull and its laws. It is a new means of measurement and it has provided valuable raw data for the study of injury mechanism of injury provide valuable raw data.
Fig. 1. Stripes of the sagittal photoelastic model in the simulation of collision
Fig. 2. The rapid prototyping skull model
www.intechopen.com
The Dynamic Visualization Technology in Brain Deceleration Injury Research
247
Fig. 3. Shooting of the impact process for the corpse head by the high-speed X-ray device [6]
Fig. 4. The relative "8" shaped trajectory of the markers in the skull model [7]
The high-speed X-ray machine can obtain the displacement and even the strain information of markers in brain tissue, but it cannot detect intracranial stress. To this end, a visual model of the physical brain containing bubbles has been developed (Shengxiong Liu, 2010)[8] for brain injury mechanism research. This visual model can effectively reflect the brain impact stress response. The study provides an intuitive non-
www.intechopen.com
Brain Injury – Pathogenesis, Monitoring, Recovery and Management
248
invasive intracranial stress wave detection and analysis method. It is a non-destructive and non-contact testing method, as an innovation test concept. The following will introduce the visualize brain model, the experimental device and the stress wave detection experiments. In addition, it provides conditions for the body digital model and the study of brain injury by the development of electronics technology, computer science, and computational mathematics. Finite element (FE) method is a numerical analysis method developed from the analysis of engineering structures for solving problems of continuum mechanics. In 1969, Fridenbery applied finite element theory to the medical field for the first time, which has provided new methods and theories for human biomechanics research. FE model of human first started from the local model, and the earliest FE model is the human head model. By the head finite element model, it has greatly promoted the study of head injury biomechanics. With the increasing development of science and technology, computer simulation is more and more likely to replace the traditional biomechanical studies on the biological impact test. Finite element model of the skull has been built [9] to study the intracranial stress and strain distribution of the brain during the deceleration impact, as well as the reproduction of traumatic brain injury.
2. The dynamic visualization technology of head injury based on the transparent physical model
2.1 Physical model 2.1.1 Screening of brain tissue substitute materials It can generate pure bubbles anywhere within the model with a syringe by plant hydro gel to simulate brain tissue before gel solution. During the collision process, the bubble locations are fixed without interfere movement. Bubble deformations are uniform that it is helpful for calculating the bubble volume changes.
2.1.2 Screening of skull alternative materials The glass and PC resins are all optional alternative materials to the skull. The glass is of good transparency and drawing easy, which is easy to observe the morphological changes of markers in the brain impact. PC resin is of good impact resistance, good transparency and low water absorption, that its mechanical properties are relatively close to the skull.
2.1.3 Model development In this study, the transparent skull physical model (Fig.5) has been produced with the real skull and the PC resin by the molds technology. Molds technology ensures the high degree of geometric similarity to the real skull. PC resin ensures the transparency of the model that it has good impact resistance and mechanical properties. It reaches the same level of magnitude to the real skull with low water absorption as the research foundation. The brain model is of well transparency for the markers observation that it can get a clear bubble deformation by high-speed camera during the impact course. Since the model has similar geometry to the real skull, it is a very effective way for quantitative analysis of the deceleration injury mechanism.
2.2 Deceleration impact device It needs firstly to solve about the initial velocity of the skull model for the deceleration injury impact experiments, then the model fixation during the experiments. If the subjects
www.intechopen.com

The Dynamic Visualization Technology in Brain Deceleration Injury Research
249
Fig. 5. The visualization skull model by the PC resin on the molds technology [8]
were fixed on the pulley, then let the pulley "free" fall along the track, its final fall speed (test speed) can be controlled by the fall height (h). The experimental principle is shown in Figure 6, and the specific principles can be derived based on Newton's laws of motion. According to Newton's laws of motion it has the following formula:
20 2tv v as (1)
Where: vt as the speed for experimental subjects falling from the height h; v0 as the initial velocity for subjects before falling; s as the acceleration distance, where calculated by the fall height h; a as the acceleration, here as the acceleration of gravity g;
www.intechopen.com

Brain Injury – Pathogenesis, Monitoring, Recovery and Management
250
Since the subject falling from height h with initial velocity (0m/s), its immediate speed is:
2tv gh (2)
Fig. 6. The schematic diagram of deceleration injury simulation device
It can be seen from Figure 6 that the pulley is located between the upper platform and the lower platform where is the falling space for the pulley. The pulley rolling along the guiders which are two vertical stainless guide rails parallelled to each other are set up in the space. Their upper ends are fixed to the upper platform while their lower ends to the lower platform. Tightness of guiders can be adjusted as needed to prevent the obstruction disturbances during the experiment. In addition, the four poles are connected with the movable platform by the groove mode. The spacing among the poles can be adjusted to adapt to different sizes and shapes for the skull model.
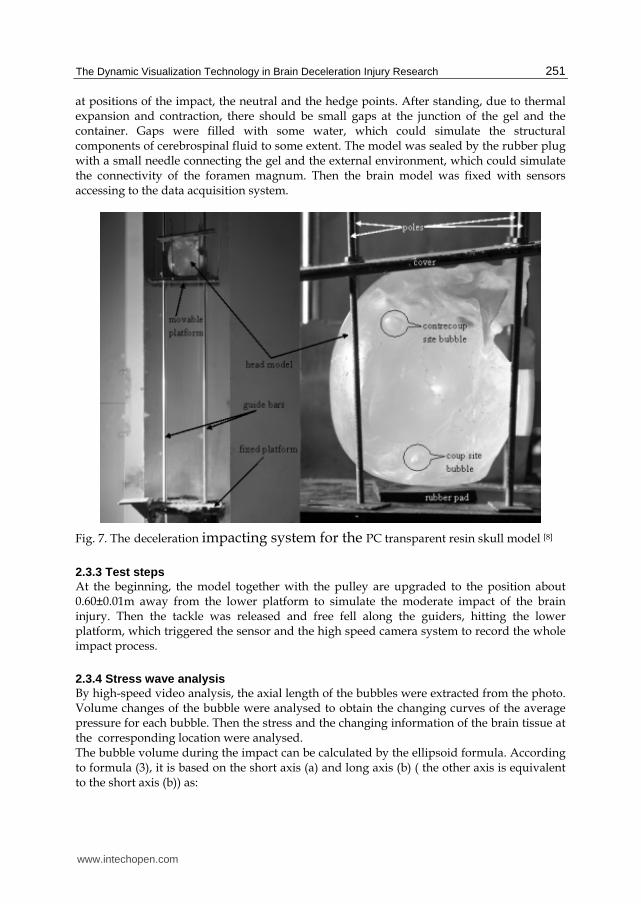
2.3 Intracranial stress wave detection experiments 2.3.1 Experimental platform Experimental platform as shown below (Fig.7), the device made by a transparent head
model of the PC resin material geometrically consisted with the real brain and a deceleration
impact test device.
2.3.2 Experiment preparation First, the warm plant hydrogel was put into the model waiting for cool. During the cool process, three bubbles were injected into the semi-liquid and -solid gel by the special syringe
www.intechopen.com
The Dynamic Visualization Technology in Brain Deceleration Injury Research
251
at positions of the impact, the neutral and the hedge points. After standing, due to thermal expansion and contraction, there should be small gaps at the junction of the gel and the container. Gaps were filled with some water, which could simulate the structural components of cerebrospinal fluid to some extent. The model was sealed by the rubber plug with a small needle connecting the gel and the external environment, which could simulate the connectivity of the foramen magnum. Then the brain model was fixed with sensors accessing to the data acquisition system.
Fig. 7. The deceleration impacting system for the PC transparent resin skull model [8]
2.3.3 Test steps At the beginning, the model together with the pulley are upgraded to the position about 0.60±0.01m away from the lower platform to simulate the moderate impact of the brain injury. Then the tackle was released and free fell along the guiders, hitting the lower platform, which triggered the sensor and the high speed camera system to record the whole impact process.
2.3.4 Stress wave analysis By high-speed video analysis, the axial length of the bubbles were extracted from the photo. Volume changes of the bubble were analysed to obtain the changing curves of the average pressure for each bubble. Then the stress and the changing information of the brain tissue at the corresponding location were analysed. The bubble volume during the impact can be calculated by the ellipsoid formula. According to formula (3), it is based on the short axis (a) and long axis (b) ( the other axis is equivalent to the short axis (b)) as:
www.intechopen.com

Brain Injury – Pathogenesis, Monitoring, Recovery and Management
252
π 24
3n n nV a b (3)
Here, Vn is the volume of the bubble at the frame of n; an is the short axis of the bubble at the frame of n; and bn is the long axis of the bubble at the frame of n. Therefore, the mean stress for the brain tissue, that is the average bubble pressure, can be calculated by the following formula (4):
0 0n
n
P VP
V (4)
Here, P0 is the initial pressure of the bubble before the collision, which is approximately equal to a standard atmosphere pressure, in order to make Pn easy to calculate and compare with each other. V0 is the initial volume of the bubble before the collision; Vn is the volume of the bubble at the frame of n during the collision; and Pn is the average pressure of the bubble at the frame of n.
2.3.5 Results There were 28 photographs extracted from the video from the crash on the first frame to bubbles returning to its initial size. Then the average pressures of each bubble were calculated and compared with the average stresses of the two bubbles at the impact point and the hedging point.
2.3.5.1 Overview of photograph series
Figure 8 shows the sequence of 28 photographs about bubbles from the crash on the first frame (0 ms) to bubbles back to its original volume (5.4 ms).
Fig. 8. Twenty eight serial frames from the onset frame of the impact to the frame in which the air bubbles came near to their original volumes [8]
www.intechopen.com
The Dynamic Visualization Technology in Brain Deceleration Injury Research
253
As can be seen from Figure 8, in the upper pictures, the volume of small bubbles at the hedge points is increasing; while in the lower pictures, it is decreasing. In contrast, in the upper pictures, the volume of small bubbles at the impact points is decreasing; while in the lower pictures, it is increasing. It illustrates the different changing trends of the average stress for the hedging point and bubbles during the impact.
2.3.5.2 The average pressure and transmission characteristics for the hedging point and bubbles
Figure 9 shows the details of the average pressure, the changing process and the transmission characteristics for the hedging point and the bubble pressure:
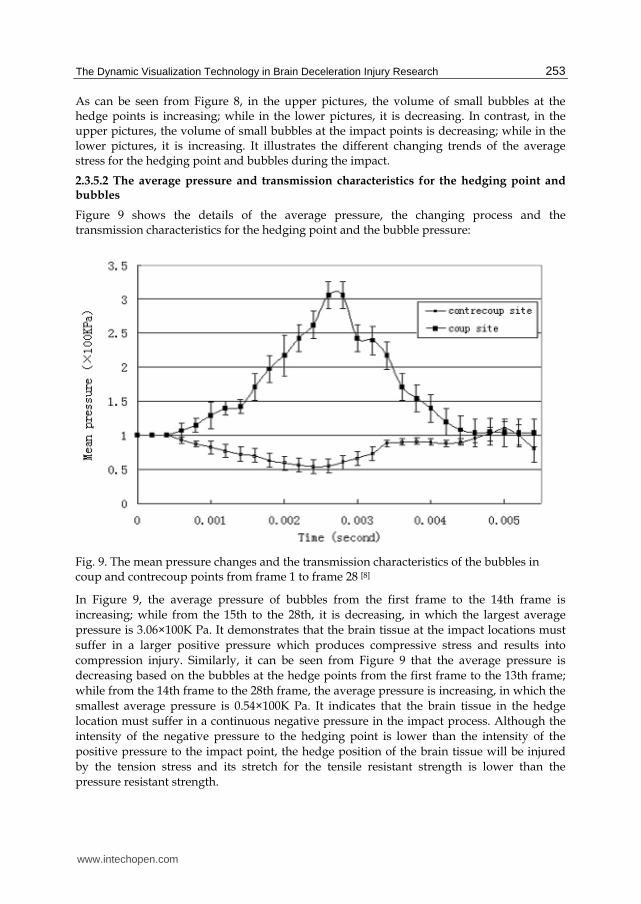
Fig. 9. The mean pressure changes and the transmission characteristics of the bubbles in coup and contrecoup points from frame 1 to frame 28 [8]
In Figure 9, the average pressure of bubbles from the first frame to the 14th frame is
increasing; while from the 15th to the 28th, it is decreasing, in which the largest average
pressure is 3.06×100K Pa. It demonstrates that the brain tissue at the impact locations must
suffer in a larger positive pressure which produces compressive stress and results into
compression injury. Similarly, it can be seen from Figure 9 that the average pressure is
decreasing based on the bubbles at the hedge points from the first frame to the 13th frame;
while from the 14th frame to the 28th frame, the average pressure is increasing, in which the
smallest average pressure is 0.54×100K Pa. It indicates that the brain tissue in the hedge
location must suffer in a continuous negative pressure in the impact process. Although the
intensity of the negative pressure to the hedging point is lower than the intensity of the
positive pressure to the impact point, the hedge position of the brain tissue will be injured
by the tension stress and its stretch for the tensile resistant strength is lower than the
pressure resistant strength.
www.intechopen.com
Brain Injury – Pathogenesis, Monitoring, Recovery and Management
254
3. The dynamic visualization technology based on the skull FE model
3.1 Establishment of FE model 3.1.1 Data sources and working platform The data is from the second case in the CVH data. It has taken the from the 1049th to the 1791st level of the continuous thin layer of cross-sectional images from the registration data set. The layer spacing is 0.25mm and the resolution is 3072 × 2048 pixels. The image
format is the uncompressed ". tiff" format. Choose the singular images as the objects in total of 372 layers to do image process in the HP xw9300 graphics workstation of high performance. The following FE skull model was built on the platforms of the 64-bit WindowsXP operating system, three-dimensional image reconstruction software Amira 4.1 (TGS French company), Photoshop (Adobe, USA) and Hypermesh8.0 (U.S. Altair's).
3.1.2 The finite element modeling of the skull It was identified and done segmentation on thesuccessive layers of the cross-section images on the brain, ventricular system, brain stem, cerebellum, falx, tentorium, sinus, calvarial, facial bone and mandible and other parts of the relevant structures through Photoshop (CS4, USA) software. layers of the same structure was filled with the same RGB color values (red, green and blue). Any two structures should not be in the same RGB color value and the image background was removed. Different gray values were given to each structuire of the segmentations which was then changed into the grayscale. These images were input into the HP image workstations. The software of Amira 4.1 was applied to do the 3D reconstruction of the skull. The trias unit was used to fit the anatomy of the 3D skull reconstruction. The model was simplified and smoothed according to the complexity of the anatomical structure of the model. The various parts of the shell head unit were stored as the hmascii format. The face was reconstructed by the semi-automatic way and it was by the closed surface for the brain, the cerebellum, the brain stem and other brain structures. The surface triangulation of the skull structure was splited according to the radius of curvature of the anatomy. Then the 2D grids were splited on these surfaces. At last, the 3D meshes were splited from the 2D surfaces. They were checked on the skewness (Skew), Warp (Warpage), Jacoby number (Jacobian), aspect ratio (Aspect), the grid unit length (length) and other grid qualities. The penetration inspection was done on the grid belonging to different structures. The self-contact inspection was done on the single structures. Ignore penetrations were set to 0. The penetrating grids were zoomed or adjusted in the penetrating direction until all the self-exposure structures were eliminated.
3.1.3 Skull FE model The partition structure can be automatically extracted by the specified gray value through the thresholding function without segmentation leakage and fault. In the software of Amira, the 3D images of each partition structure can be clearly distinguished after the 3D reconstruction of the extracted segmentation information. These images are smooth and lifelike in which the small structure can be observed completely like the maxillofacial and skull base (Fig. 11). Can be constructed based on the observed need to rotate images at any angle. Image angels can be rotated arbitrarily by the observing need.
www.intechopen.com
The Dynamic Visualization Technology in Brain Deceleration Injury Research
255
(a) (b)
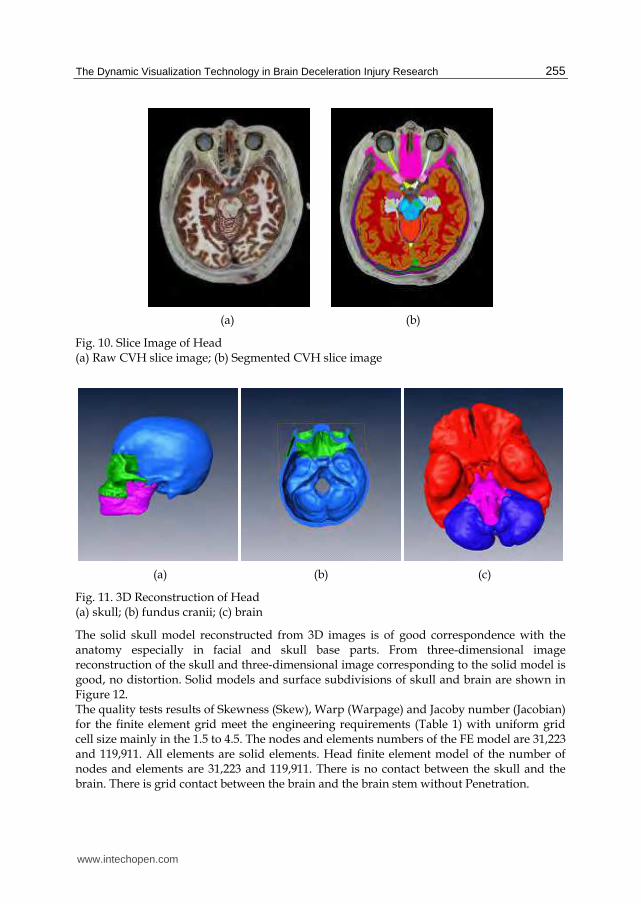
Fig. 10. Slice Image of Head (a) Raw CVH slice image; (b) Segmented CVH slice image
(a) (b) (c)
Fig. 11. 3D Reconstruction of Head (a) skull; (b) fundus cranii; (c) brain
The solid skull model reconstructed from 3D images is of good correspondence with the anatomy especially in facial and skull base parts. From three-dimensional image reconstruction of the skull and three-dimensional image corresponding to the solid model is good, no distortion. Solid models and surface subdivisions of skull and brain are shown in Figure 12. The quality tests results of Skewness (Skew), Warp (Warpage) and Jacoby number (Jacobian) for the finite element grid meet the engineering requirements (Table 1) with uniform grid cell size mainly in the 1.5 to 4.5. The nodes and elements numbers of the FE model are 31,223 and 119,911. All elements are solid elements. Head finite element model of the number of nodes and elements are 31,223 and 119,911. There is no contact between the skull and the brain. There is grid contact between the brain and the brain stem without Penetration.
www.intechopen.com

Brain Injury – Pathogenesis, Monitoring, Recovery and Management
256
(a) (b) (c)
Fig. 12. Reconstruction of Solid Model and Partition (a) skull; (b) inferior maxilla; (c) cerebrum
Checking items Engineering requirements
Actual values
Nodes —— 31223
Elements —— 119911
Length Distribution 1.5~4.5
Skew <600 <500
Warpage <500 <500
Jacobian >0.7 >0.95
Aspect <5.0 <2.8
Table 1. Mesh Quality Check for Finite Element Model of Head
The finite element mesh of the skull includes two parts as skull and brain. The skull includes three parts as the cranium, the facial bones and the mandible bones. The FE grid of the cranium contains the frontal skull, the temporal bone, the occipital bone, the sphenoid, the ethmoid, the parietal bone and the maxillofacial bone and other anatomical structures in detail. Fine structure of the skull FE model has been carved out in detail as shown in Figure 13.
3.2 The brain deceleration injury research based on the finite element (FE) model
3.2.1 A case for the brain deceleration injury A male of 19 years old, height 1.70 m and weight 55 kg fell accidentally in the work from 4.0
m to the cement floor grounded with right occipital and immediately coma for 3.5 hours
with cerebrospinal fluid rhinorrhea not accompanied by incontinence and no vomiting. He
had been head injured and in disturbance of consciousness for 1 day and waked severe
headache with vomiting 2 times. Specialist examination: inspection cooperation, a right
occipital palpable size of about 1 × 2 cm scalp hematoma, lethargy, poor time orientation,
memory loss, calculated power loss and hallucinations. GCS score: Opening eyes responses
4, language 5, movement 6, total scores 15.
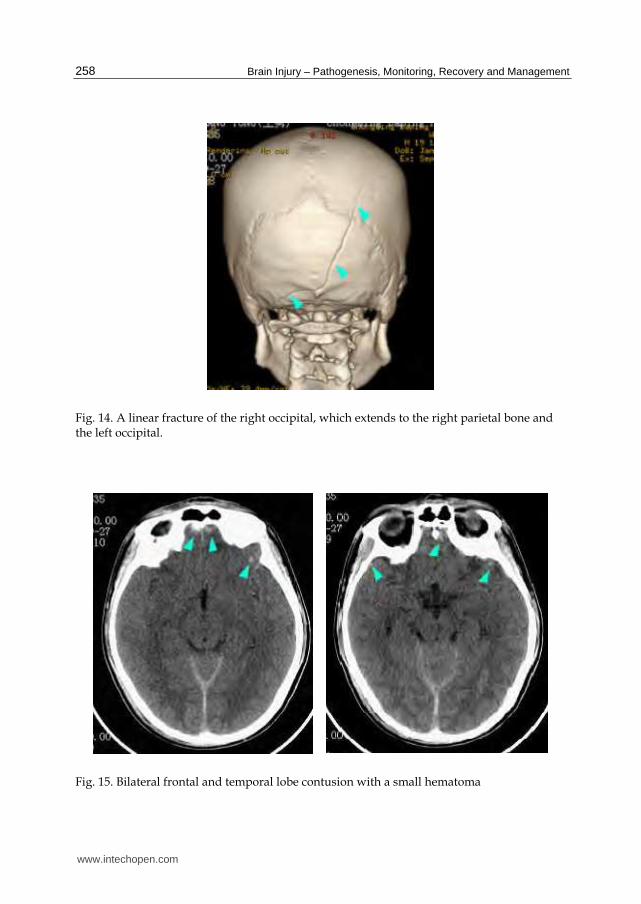
Brain CT images after injury: the right occipital scalp hematoma, linear fracture of the right
occipital whose fracture line extended to the right parietal bone and the left occipital, right
anterior and middle cranial fossa fracture, bilateral frontal lobe contusion with a small
www.intechopen.com
The Dynamic Visualization Technology in Brain Deceleration Injury Research
257
(a) (b)
(c) (d)
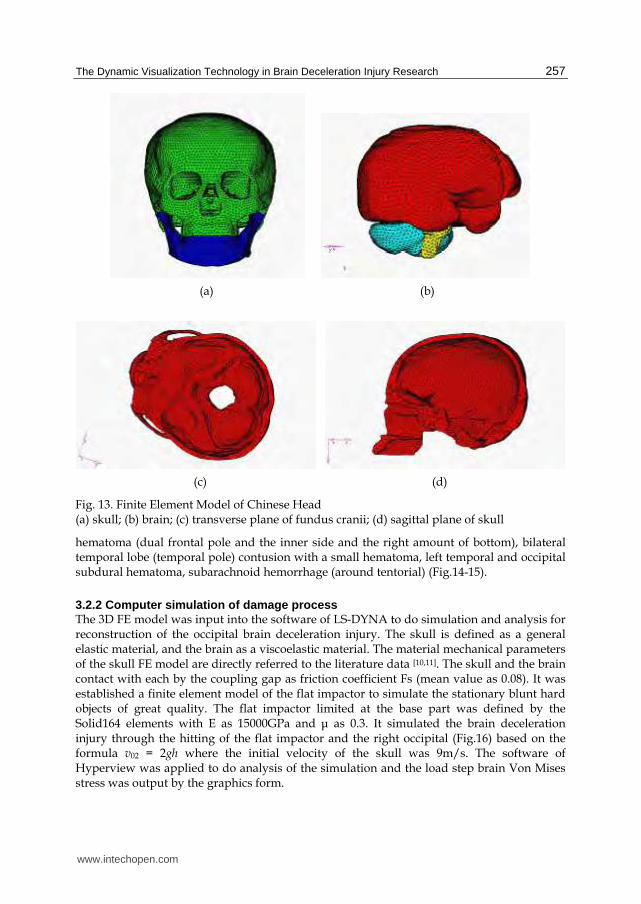
Fig. 13. Finite Element Model of Chinese Head (a) skull; (b) brain; (c) transverse plane of fundus cranii; (d) sagittal plane of skull
hematoma (dual frontal pole and the inner side and the right amount of bottom), bilateral temporal lobe (temporal pole) contusion with a small hematoma, left temporal and occipital subdural hematoma, subarachnoid hemorrhage (around tentorial) (Fig.14-15).
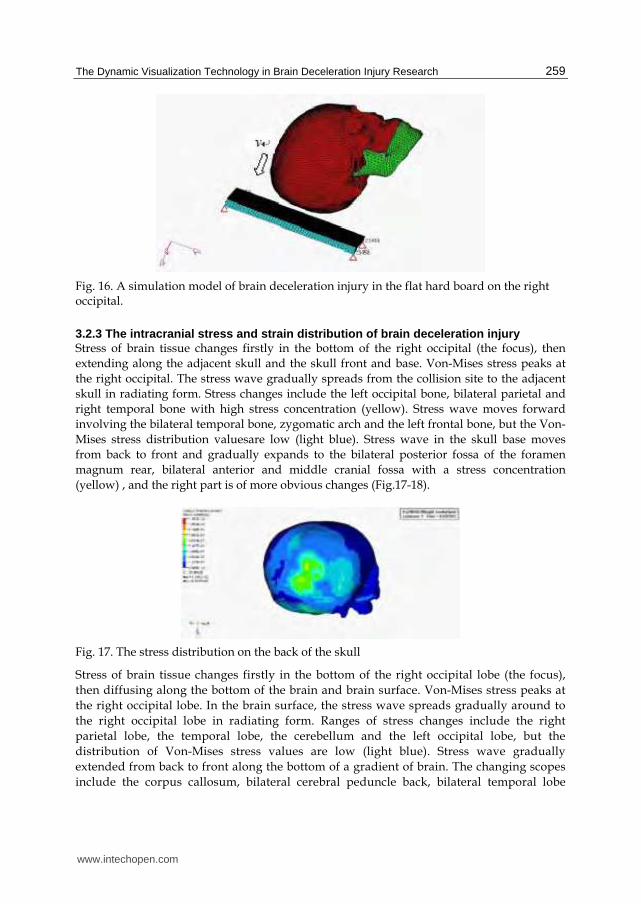
3.2.2 Computer simulation of damage process The 3D FE model was input into the software of LS-DYNA to do simulation and analysis for reconstruction of the occipital brain deceleration injury. The skull is defined as a general elastic material, and the brain as a viscoelastic material. The material mechanical parameters of the skull FE model are directly referred to the literature data [10,11]. The skull and the brain contact with each by the coupling gap as friction coefficient Fs (mean value as 0.08). It was established a finite element model of the flat impactor to simulate the stationary blunt hard objects of great quality. The flat impactor limited at the base part was defined by the Solid164 elements with E as 15000GPa and μ as 0.3. It simulated the brain deceleration injury through the hitting of the flat impactor and the right occipital (Fig.16) based on the formula v02 = 2gh where the initial velocity of the skull was 9m/s. The software of Hyperview was applied to do analysis of the simulation and the load step brain Von Mises stress was output by the graphics form.
www.intechopen.com
Brain Injury – Pathogenesis, Monitoring, Recovery and Management
258
Fig. 14. A linear fracture of the right occipital, which extends to the right parietal bone and the left occipital.
Fig. 15. Bilateral frontal and temporal lobe contusion with a small hematoma
www.intechopen.com
The Dynamic Visualization Technology in Brain Deceleration Injury Research
259
Fig. 16. A simulation model of brain deceleration injury in the flat hard board on the right occipital.
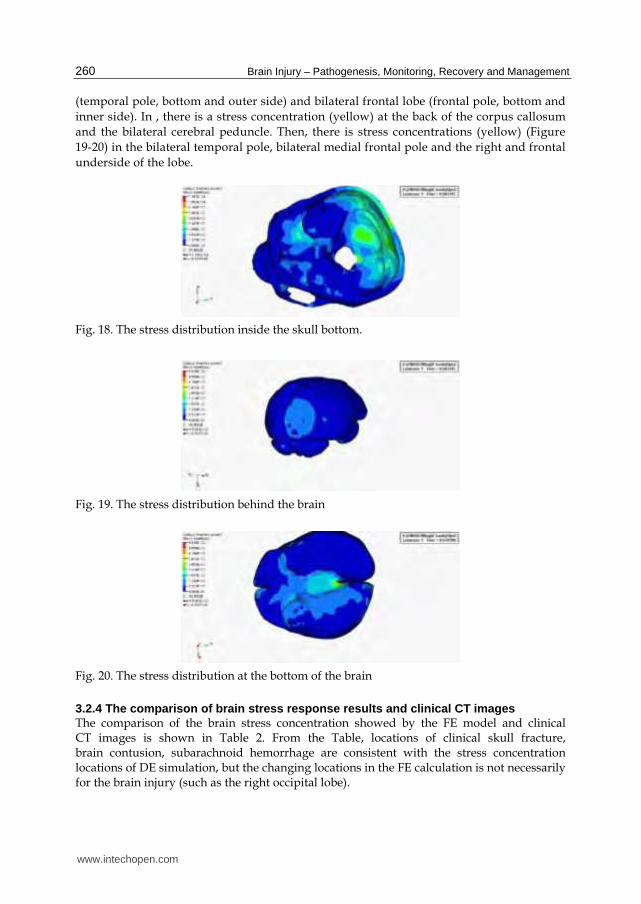
3.2.3 The intracranial stress and strain distribution of brain deceleration injury Stress of brain tissue changes firstly in the bottom of the right occipital (the focus), then
extending along the adjacent skull and the skull front and base. Von-Mises stress peaks at
the right occipital. The stress wave gradually spreads from the collision site to the adjacent
skull in radiating form. Stress changes include the left occipital bone, bilateral parietal and
right temporal bone with high stress concentration (yellow). Stress wave moves forward
involving the bilateral temporal bone, zygomatic arch and the left frontal bone, but the Von-
Mises stress distribution valuesare low (light blue). Stress wave in the skull base moves
from back to front and gradually expands to the bilateral posterior fossa of the foramen
magnum rear, bilateral anterior and middle cranial fossa with a stress concentration
(yellow) , and the right part is of more obvious changes (Fig.17-18).
Fig. 17. The stress distribution on the back of the skull
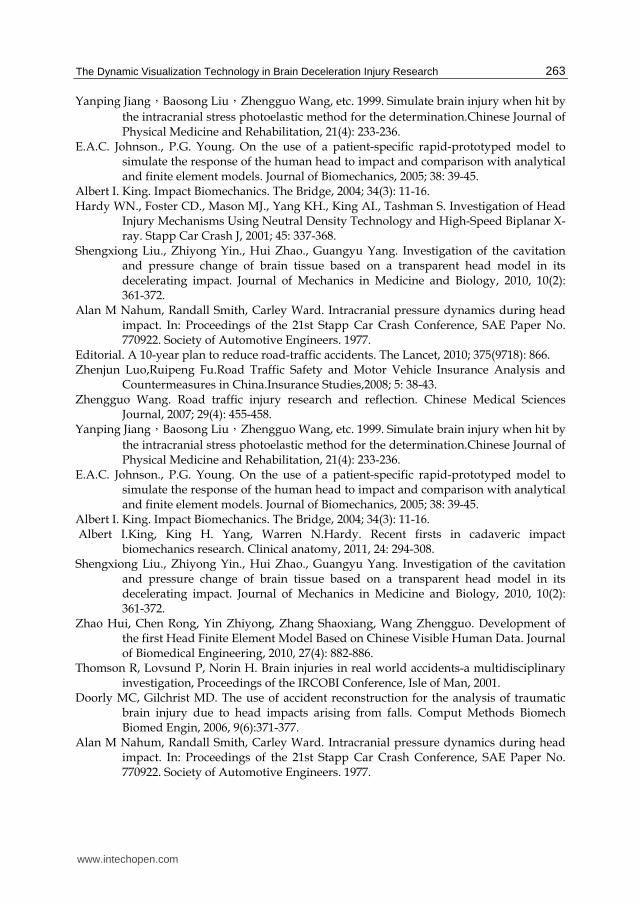
Stress of brain tissue changes firstly in the bottom of the right occipital lobe (the focus),
then diffusing along the bottom of the brain and brain surface. Von-Mises stress peaks at
the right occipital lobe. In the brain surface, the stress wave spreads gradually around to
the right occipital lobe in radiating form. Ranges of stress changes include the right
parietal lobe, the temporal lobe, the cerebellum and the left occipital lobe, but the
distribution of Von-Mises stress values are low (light blue). Stress wave gradually
extended from back to front along the bottom of a gradient of brain. The changing scopes
include the corpus callosum, bilateral cerebral peduncle back, bilateral temporal lobe
www.intechopen.com
Brain Injury – Pathogenesis, Monitoring, Recovery and Management
260
(temporal pole, bottom and outer side) and bilateral frontal lobe (frontal pole, bottom and
inner side). In , there is a stress concentration (yellow) at the back of the corpus callosum
and the bilateral cerebral peduncle. Then, there is stress concentrations (yellow) (Figure
19-20) in the bilateral temporal pole, bilateral medial frontal pole and the right and frontal
underside of the lobe.
Fig. 18. The stress distribution inside the skull bottom.
Fig. 19. The stress distribution behind the brain
Fig. 20. The stress distribution at the bottom of the brain
3.2.4 The comparison of brain stress response results and clinical CT images The comparison of the brain stress concentration showed by the FE model and clinical CT images is shown in Table 2. From the Table, locations of clinical skull fracture, brain contusion, subarachnoid hemorrhage are consistent with the stress concentration locations of DE simulation, but the changing locations in the FE calculation is not necessarily for the brain injury (such as the right occipital lobe).
www.intechopen.com

The Dynamic Visualization Technology in Brain Deceleration Injury Research
261
Skull
FE anlaysis Stress concentration
Right occipital, right parietal bone, left occipital, bilateral posterior fossa of the foramen magnum rear, bilateral anterior and middle cranial fossa
CT performance
Skull fracture Right occipital, right parietal bone, left occipital, right anterior and middle cranial fossa
Subarachnoid hemorrhage
Around the posterior fossa transtentorial
Brain tissue
FE anlaysis Stress concentration
Right occipital lobe, corpus callosum, bilateral cerebral peduncle back, bilateral temporal pole, bilateral medial frontal pole and the right frontal lobe underside
CT performance
Brain contusion Bilateral temporal pole, bilateral medial frontal pole and the right frontal lobe underside
Table 2. The comparison of the stress concentration calculated by the FE simulation and the clinical head CT images
4. Discussion
4.1 The dynamic visualization technology of head injury based on the transparent physical model In the classic experiment (Nahum, 1977 ) [12], a columnar load unit with a circular contact
surface has been used to hit the forehead of the body head. Although the experiment is
limited to the acceleration impact, it is more similar to the bubble experiments than other
known experiments. From both the experimental data, their results are consistent. The
absolute value of head acceleration and the HIC value in the bubble experiment are slightly
larger than in the Nahum experiment (experiment 43). These differences lead to the more
severity of the pressure values for the impact point and the hedging point in the bubble
experiments than in the Nahum experiment (experiment 43). Through these two
experiments and their results, it has compared and further demonstrated the feasibility of
the bubble model.
4.2 Dynamic visualization technology of brain injury based on FE model 4.2.1 Skull FE model based on the Chinese visual figure set Since the early 1990s, a new research has begin by Ruan, et al [13], to establish the FE model
of head injury. The model simulates a 50-year-old male head totally weighted 5.059 kg.
Structural organization of the head included: the scalp, the skull (including the plate, in
plate and intermediate layers), the meninges (including the dural membrane and sickle), the
cerebrospinal fluid, the left and right cerebral hemispheres, the cerebellum, the midbrain
and the brain stem. Other series of head models established based on Ruan's have achieved
a lot of progress in the application, such as Zhou [14], Zhang [15], Prasad [16] and so on. FE
researches on the brain injury have also made some progress in China, such as Lai Man[17],
Yang Ji-hong [18] and Nguyen [19,20] and so on.
The accuracy and the reasoning of the structure directly affects the accuracy of FE analysis.
So it is one of the conditions that it has the similar geometry of the FE skull model with the
object. The constructed FE skull models are taken the CT or MRI slice images as the primary
data sources to build the FE model that they are not of good accuracy in details because of
the blurred scanning boundary limitations of CT/MRI.
www.intechopen.com

Brain Injury – Pathogenesis, Monitoring, Recovery and Management
262
In recent years, the human visualization technology has become a high tech integrated of anatomy, computers and virtual reality. Digitized visible human (DVH) relyies on the computer 3D technology showing the structure of real human organs. Professor Zhang Shaoxiang (Third Military Medical University, China) has completed the CVH image data acquisition after other researchers in the United States and South Korea [21,22]. The FE skull modelin this study has selected data from the second case of CVH. The data set selected was of no organic disease and defects in the human body; the entire specimen cross-section was of no segmental defects; the layer spacing was 0.25mm; the resolution were 3072 × 2048 pixels; the uncompressed digital image resolution were cross-section 6.3 million pixels; and each section of the image file size was 36MB. The detail results were more accurate and reliable. Therefore, it has more advantages in data integrity, and accuracy of representation than the currently reported FE skull model.
4.2.2 Brain deceleration injury research based on the head finite element model It has successfully simulated and reproduced the distribution and characteristics of skull and brain tissue in the occipital deceleration shock by the brain 3D FE model materialized with CVH to hit the plate impactor by the right occipital in falls-style head deceleration injury. From the finite element simulation, it can be found that the stress wave pass in all directions along the skull and brain tissue at the focal point. In the path of the stress wave, the brain tissue may be damaged. The stress wave passes along two ways in the brain at the same time: one way is from the impact side to the contra-side along the skull; the other way is from the impact side to the contra-side along the brain tissue. In the occipital deceleration shock, in addition to impact parts of the skull and brain tissue under stress concentration, the hedge position is also apparent stress concentration area. For the distribution of stress concentration, it is not only of good correlation of clinical CT images, but also significant for the common clinical brain injuries.
5. Conclusion
With the achievements of materials science and computer science, researches on the head deceleration injury has achieved the dynamic visualization in the biomechanics research. Through dynamic visualization techniques, it can be visually observed and analysed for the intracranial pressure distribution in the brain and the transmission process of the stress wave. It is also an important supplement for the modern testing technology. It is a non-destructive and non-contact testing method which can reveal the mechanism of the brain deceleration injury from a different angle, and to provide biomechanical basis for its prevention and treatment.
6. References
Editorial. A 10-year plan to reduce road-traffic accidents. The Lancet, 2010; 375(9718): 866. Zhenjun Luo,Ruipeng Fu.Road Traffic Safety and Motor Vehicle Insurance Analysis and
Countermeasures in China.Insurance Studies,2008; 5: 38-43. Zhengguo Wang. Road traffic injury research and reflection. Chinese Medical Sciences
Journal, 2007; 29(4): 455-458.
www.intechopen.com
The Dynamic Visualization Technology in Brain Deceleration Injury Research
263
Yanping Jiang,Baosong Liu,Zhengguo Wang, etc. 1999. Simulate brain injury when hit by
the intracranial stress photoelastic method for the determination.Chinese Journal of Physical Medicine and Rehabilitation, 21(4): 233-236.
E.A.C. Johnson., P.G. Young. On the use of a patient-specific rapid-prototyped model to simulate the response of the human head to impact and comparison with analytical and finite element models. Journal of Biomechanics, 2005; 38: 39-45.
Albert I. King. Impact Biomechanics. The Bridge, 2004; 34(3): 11-16. Hardy WN., Foster CD., Mason MJ., Yang KH., King AI., Tashman S. Investigation of Head
Injury Mechanisms Using Neutral Density Technology and High-Speed Biplanar X-ray. Stapp Car Crash J, 2001; 45: 337-368.
Shengxiong Liu., Zhiyong Yin., Hui Zhao., Guangyu Yang. Investigation of the cavitation and pressure change of brain tissue based on a transparent head model in its decelerating impact. Journal of Mechanics in Medicine and Biology, 2010, 10(2): 361-372.
Alan M Nahum, Randall Smith, Carley Ward. Intracranial pressure dynamics during head impact. In: Proceedings of the 21st Stapp Car Crash Conference, SAE Paper No. 770922. Society of Automotive Engineers. 1977.
Editorial. A 10-year plan to reduce road-traffic accidents. The Lancet, 2010; 375(9718): 866. Zhenjun Luo,Ruipeng Fu.Road Traffic Safety and Motor Vehicle Insurance Analysis and
Countermeasures in China.Insurance Studies,2008; 5: 38-43. Zhengguo Wang. Road traffic injury research and reflection. Chinese Medical Sciences
Journal, 2007; 29(4): 455-458. Yanping Jiang,Baosong Liu,Zhengguo Wang, etc. 1999. Simulate brain injury when hit by
the intracranial stress photoelastic method for the determination.Chinese Journal of Physical Medicine and Rehabilitation, 21(4): 233-236.
E.A.C. Johnson., P.G. Young. On the use of a patient-specific rapid-prototyped model to simulate the response of the human head to impact and comparison with analytical and finite element models. Journal of Biomechanics, 2005; 38: 39-45.
Albert I. King. Impact Biomechanics. The Bridge, 2004; 34(3): 11-16. Albert I.King, King H. Yang, Warren N.Hardy. Recent firsts in cadaveric impact
biomechanics research. Clinical anatomy, 2011, 24: 294-308. Shengxiong Liu., Zhiyong Yin., Hui Zhao., Guangyu Yang. Investigation of the cavitation
and pressure change of brain tissue based on a transparent head model in its decelerating impact. Journal of Mechanics in Medicine and Biology, 2010, 10(2): 361-372.
Zhao Hui, Chen Rong, Yin Zhiyong, Zhang Shaoxiang, Wang Zhengguo. Development of the first Head Finite Element Model Based on Chinese Visible Human Data. Journal of Biomedical Engineering, 2010, 27(4): 882-886.
Thomson R, Lovsund P, Norin H. Brain injuries in real world accidents-a multidisciplinary investigation, Proceedings of the IRCOBI Conference, Isle of Man, 2001.
Doorly MC, Gilchrist MD. The use of accident reconstruction for the analysis of traumatic brain injury due to head impacts arising from falls. Comput Methods Biomech Biomed Engin, 2006, 9(6):371-377.
Alan M Nahum, Randall Smith, Carley Ward. Intracranial pressure dynamics during head impact. In: Proceedings of the 21st Stapp Car Crash Conference, SAE Paper No. 770922. Society of Automotive Engineers. 1977.
www.intechopen.com

Brain Injury – Pathogenesis, Monitoring, Recovery and Management
264
Jesse Ruan, T. Khalil, King AI. Finite Element Modeling of Direct Head Impact. Proc. 37th STAPP Car Crash Conf.,1993.
Zhou C, Khalil TB, King AI. A new model comparing impact response of the homogeneous and inhomogeneous human brain[C]. Proc. 39th STAPP Car Crash Conf.,1995.
Zhang L, Hardy W, Omori K, et al. Recent advances in brain injury research: a new human head model development and validation. Stapp Car Crash Journal, 2001, 45.
Jesse Ruan, Prasad. The effects of skull thickness variations on human head dynamic impact response[J]. Stapp Car Crash Journal, 2001, 45.
Limin He, Yicheng Lu, Jianguo Wu, et al. Validation of a three-dimensional finite element skull model. Biomedical Engineering and Clinical Medicine, 2005, 9(6): 320-325.
YANG Ji-kuang, XU Wei, WAN Xin-ming. Development and Validation of a Head-Neck Finite Element Model for the Study of Neck Dynamic Responses in Car Impacts. Journal of Hunan University(Natural Sciences),2005, 32(2): 6-12.
Shijie Ruan, Haiyan Li, Xuekui Wang, et al. A New Exploration of the Applicability of the Head Injury Criterion. Journal of Biomedical Engineering, 2007, 24(6):1373-1377.
RUAN Shi-Jie, HE Pei, LU Jun-Peng, et al. Simulation Based Investigation on Injury Biomechanics of the Human Head by Finite Element Method. Chnese Journal of Biomedical Engineering, 2007, 26(1): 99-104.
Shaoxiang Zhang, Pingan Wang, Zhengjin Liu, et al. Number one of Chinese digitized visible human completed. ACTA Academiae Medicinae Militaris Tertiae,2003,25(7): 563-565.
Zhang SX, Heng PA, Liu ZJ. Chinese Visible Human Project[J]. Clinical Anatomy, 2006, 19:204-215.
www.intechopen.com
Brain Injury - Pathogenesis, Monitoring, Recovery andManagementEdited by Prof. Amit Agrawal
ISBN 978-953-51-0265-6Hard cover, 522 pagesPublisher InTechPublished online 23, March, 2012Published in print edition March, 2012
InTech EuropeUniversity Campus STeP Ri Slavka Krautzeka 83/A 51000 Rijeka, Croatia Phone: +385 (51) 770 447 Fax: +385 (51) 686 166www.intechopen.com
InTech ChinaUnit 405, Office Block, Hotel Equatorial Shanghai No.65, Yan An Road (West), Shanghai, 200040, China
Phone: +86-21-62489820 Fax: +86-21-62489821
The present two volume book "Brain Injury" is distinctive in its presentation and includes a wealth of updatedinformation on many aspects in the field of brain injury. The Book is devoted to the pathogenesis of braininjury, concepts in cerebral blood flow and metabolism, investigative approaches and monitoring of braininjured, different protective mechanisms and recovery and management approach to these individuals,functional and endocrine aspects of brain injuries, approaches to rehabilitation of brain injured and preventiveaspects of traumatic brain injuries. The collective contribution from experts in brain injury research area wouldbe successfully conveyed to the readers and readers will find this book to be a valuable guide to furtherdevelop their understanding about brain injury.
How to referenceIn order to correctly reference this scholarly work, feel free to copy and paste the following:
Zhiyong Yin, Shengxiong Liu, Daiqin Tao and Hui Zhao (2012). The Dynamic Visualization Technology in BrainDeceleration Injury Research, Brain Injury - Pathogenesis, Monitoring, Recovery and Management, Prof. AmitAgrawal (Ed.), ISBN: 978-953-51-0265-6, InTech, Available from: http://www.intechopen.com/books/brain-injury-pathogenesis-monitoring-recovery-and-management/the-dynamic-visualization-technology-in-brain-deceleration-injury-research

© 2012 The Author(s). Licensee IntechOpen. This is an open access articledistributed under the terms of the Creative Commons Attribution 3.0License, which permits unrestricted use, distribution, and reproduction inany medium, provided the original work is properly cited.