the dry-erase cube: making three-dimensional … to each other by moving the cubes in figure 2a...
TRANSCRIPT
ABSTRACT
The 10 cm dry-erase cube is an effective tool forillustrating the three-dimensionality of geologicalfeatures in maps, cross sections and block diagrams, andit aids in the understanding of stereographic projectionsand orientated samples. It is ideal for use in classes andlabs of structural geology and geological field methodscourses. The cube is useful for demonstrating thethree-dimensional relationships among any planar orlinear features in geoscience courses at any level.
INTRODUCTION
Many students are challenged by the three-dimensionalproblems they have to solve in courses such as structuralgeology and field mapping. Commonly, they have nothad much training in three-dimensional thinking, andespecially for students who do not have a naturalaptitude for such thinking, structural geology, mappingand construction of cross sections and block diagramscan be a real struggle. There are many tools available toinstructors from science education supply stores that aredesigned to assist them in teaching three-dimensionalrelationships, including paper models, wooden blockdiagrams, and plastic replicas. However, these tools aregenerally static and typically designed to illustrate aspecific geological relationship. More dynamic computermodeling programs have been developed that aredesigned to aid in three-dimensional visualization ofgeological relationships in research and teaching (Jessell,1981, 2001; Reynolds et al., 2001). Block diagrams can berotated, and they can be made transparent or parts can becut out of the blocks so that the internal structure of theblocks is visible. Three-dimensional visualizationabilities and associated mental processes in humans havebeen studied by various authors (e.g. Shepard andMetzler, 1971; Shepard, 1978; Kali and Orion, 1996;Ishakawa and Kastens, 2005) and Piburn et al. (2005)demonstrated that students' three-dimensionalvisualization skills can be improved by using thesecomputer modeling programs. Whereas the computermodels have proven to be helpful, the diagrams are stilltwo-dimensional projections of three-dimensionalmodels and important concepts such as apparent dips ofgeological layers can still be difficult to understand.
A simple cube constructed from white high-densityplastic provides a solution to many of the limitations ofthe various teaching aids mentioned above. Thedry-erase cube is a dynamic, three-dimensional,instructional tool that is capable of being adapted todemonstrations of multiple geological relationships.Dry-erase cubes can quickly be reconfigured to illustratea limitless number of complex three-dimensionalgeological relationships. The cubes serve as athree-dimensional model for two-dimensional maps,cross sections and block diagrams and the relationshipsbetween them. They can be used in classroom and fieldsettings. From my observations in class so far, studentsseem to solve problems involving block diagrams, maps
and cross sections at greater ease when they are using thedry-erase cubes than they did without them. Perhaps ofequal importance, they just love working with them!
THE CONCEPT
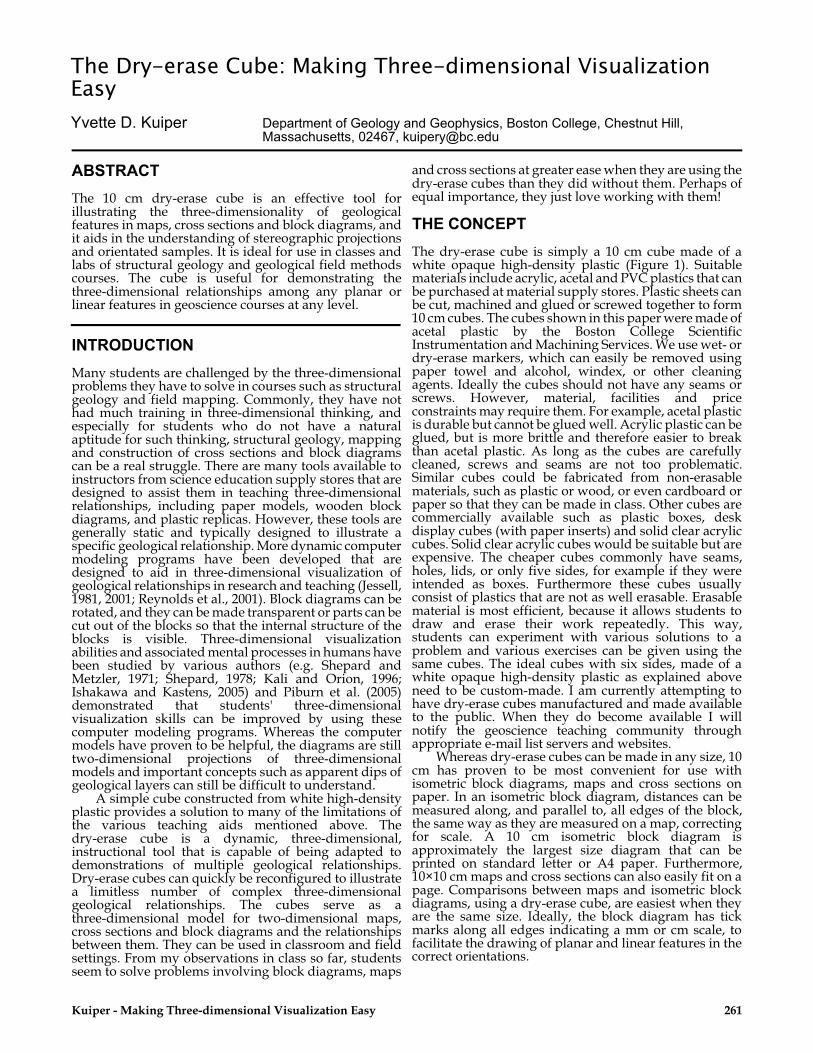
The dry-erase cube is simply a 10 cm cube made of awhite opaque high-density plastic (Figure 1). Suitablematerials include acrylic, acetal and PVC plastics that canbe purchased at material supply stores. Plastic sheets canbe cut, machined and glued or screwed together to form10 cm cubes. The cubes shown in this paper were made ofacetal plastic by the Boston College ScientificInstrumentation and Machining Services. We use wet- ordry-erase markers, which can easily be removed usingpaper towel and alcohol, windex, or other cleaningagents. Ideally the cubes should not have any seams orscrews. However, material, facilities and priceconstraints may require them. For example, acetal plasticis durable but cannot be glued well. Acrylic plastic can beglued, but is more brittle and therefore easier to breakthan acetal plastic. As long as the cubes are carefullycleaned, screws and seams are not too problematic.Similar cubes could be fabricated from non-erasablematerials, such as plastic or wood, or even cardboard orpaper so that they can be made in class. Other cubes arecommercially available such as plastic boxes, deskdisplay cubes (with paper inserts) and solid clear acryliccubes. Solid clear acrylic cubes would be suitable but areexpensive. The cheaper cubes commonly have seams,holes, lids, or only five sides, for example if they wereintended as boxes. Furthermore these cubes usuallyconsist of plastics that are not as well erasable. Erasablematerial is most efficient, because it allows students todraw and erase their work repeatedly. This way,students can experiment with various solutions to aproblem and various exercises can be given using thesame cubes. The ideal cubes with six sides, made of awhite opaque high-density plastic as explained aboveneed to be custom-made. I am currently attempting tohave dry-erase cubes manufactured and made availableto the public. When they do become available I willnotify the geoscience teaching community throughappropriate e-mail list servers and websites.
Whereas dry-erase cubes can be made in any size, 10cm has proven to be most convenient for use withisometric block diagrams, maps and cross sections onpaper. In an isometric block diagram, distances can bemeasured along, and parallel to, all edges of the block,the same way as they are measured on a map, correctingfor scale. A 10 cm isometric block diagram isapproximately the largest size diagram that can beprinted on standard letter or A4 paper. Furthermore,10×10 cm maps and cross sections can also easily fit on apage. Comparisons between maps and isometric blockdiagrams, using a dry-erase cube, are easiest when theyare the same size. Ideally, the block diagram has tickmarks along all edges indicating a mm or cm scale, tofacilitate the drawing of planar and linear features in thecorrect orientations.
Kuiper - Making Three-dimensional Visualization Easy 261
The Dry-erase Cube: Making Three-dimensional VisualizationEasy
Yvette D. Kuiper Department of Geology and Geophysics, Boston College, Chestnut Hill,Massachusetts, 02467, [email protected]
THE DRY-ERASE CUBE AS A MODEL FORMAPS AND CROSS SECTIONS
Students often encounter difficulties visualizing therepresentation of geological features on maps and thoseon cross sections, and the relationship between the two.One concept that is especially confusing to students isthat of apparent dips. Apparent dips are essential in theconstruction of cross sections and block diagrams. Anapparent dip (γ) can be calculated from the true dip (α) ofa planar feature, and the angle between the dip directionof that planar feature and the trend of the cross section(β): tan(γ) = tan(α) × cos(β) (derived below; cf. Marshakand Mitra, 1988; Rowland et al., 2007). An apparent dipcan also be found by plotting the planar feature ofinterest and the cross section on a stereographicprojection, and by taking the plunge of the line ofintersection. Even students who have a goodunderstanding of these methods may have somedifficulty plotting the apparent dip on a cross section orblock diagram. The dry-erase cube can make this mucheasier for them to visualize, because the map can besketched on an actual horizontal plane and the crosssection or vertical faces of the block diagram can besketched on actual vertical planes. Therefore the entireplane can be made visible. The students' understandingcan be further enhanced by the combination of severaldry-erase cubes (Figure 2). This allows for e.g. (1)construction of several parallel cross sections, (2)construction of perpendicular cross sections, (3)extension of cross sections above the given map level bypiling up blocks on top of the map, and (4) constructionof several parallel maps at various elevations.
The dry-erase cubes are easily incorporated into awide variety of individual and group exercises. Theadvantage of having the students do the exercise in smallgroups is that it creates discussion amongst the students.Students can be provided with dry-erase cubes with
262 Journal of Geoscience Education, v. 56, n. 3, May, 2008, p. 261-268
Figure 1. Photograph of a 10 cm dry-erase cube.
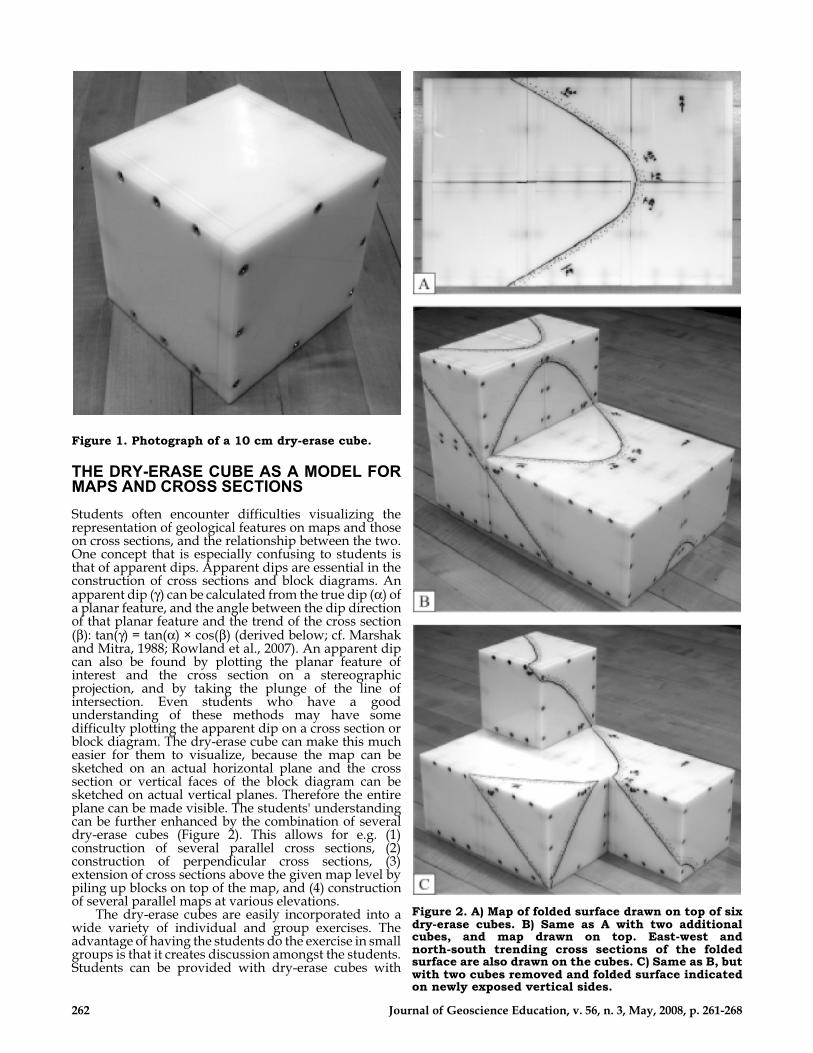
Figure 2. A) Map of folded surface drawn on top of sixdry-erase cubes. B) Same as A with two additionalcubes, and map drawn on top. East-west andnorth-south trending cross sections of the foldedsurface are also drawn on the cubes. C) Same as B, butwith two cubes removed and folded surface indicatedon newly exposed vertical sides.
maps already drawn on top (Figure 2), or they can begiven blank cubes and asked to transfer data from anexisting map onto the cubes. The map in Figure 2Ashows an upright 40° east-plunging cylindrical fold. Inthis example, students could be asked to complete anumber of tasks. First, they can be asked to constructcross sections on the vertical faces of the cubes. Severalcross sections can be constructed parallel and/or
perpendicular to each other by moving the cubes inFigure 2A apart. They need to determine the apparentdips using trigonometry or stereographic projection.They also need to take into account that the surface iscurved around the hinge area, so they need to curve thesurface on the cross sections according to the given map.The exercise can be made easier by giving a more angularfolded surface such as a chevron fold, so that the limbs
Kuiper - Making Three-dimensional Visualization Easy 263
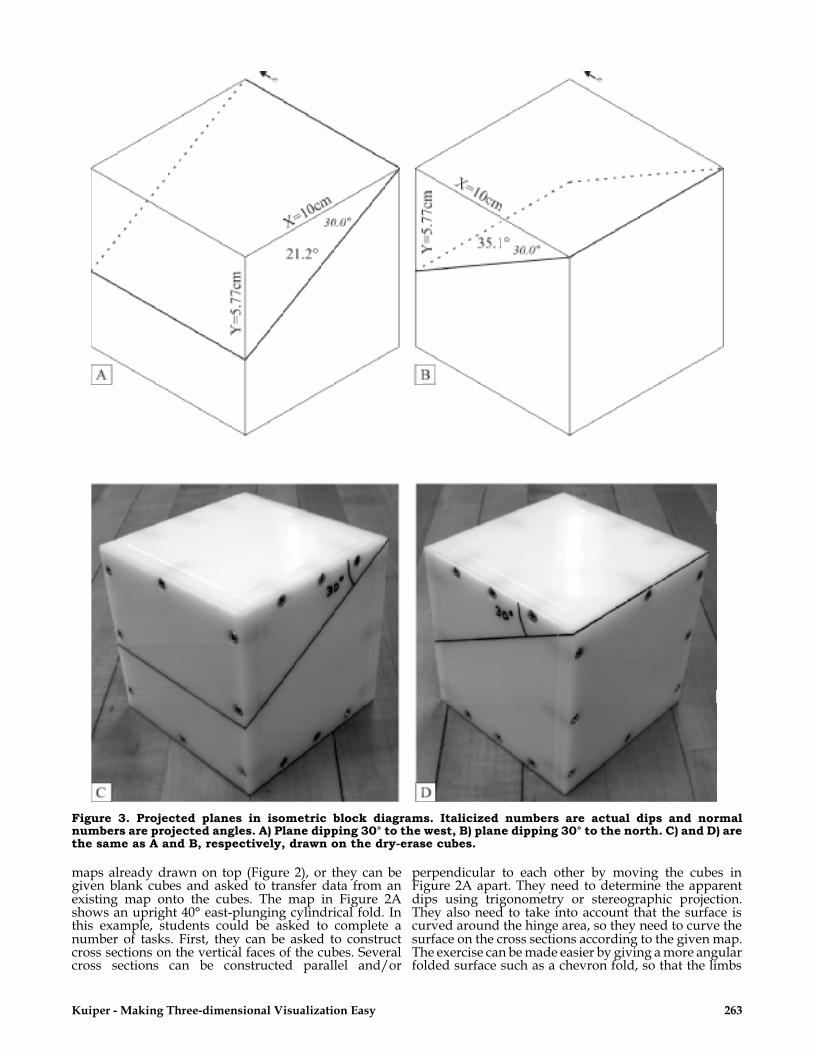
Figure 3. Projected planes in isometric block diagrams. Italicized numbers are actual dips and normalnumbers are projected angles. A) Plane dipping 30° to the west, B) plane dipping 30° to the north. C) and D) arethe same as A and B, respectively, drawn on the dry-erase cubes.
are planar and the hinge area is very small.Subsequently, they can draw the folded surface on anyfaces of the cubes on which it would be visible (includingthe bottoms!), so that a three-dimensional visualization is
created. Additional cubes can be added on top of thearrangement given in Figure 2A, so that the crosssections can be extended above the map level, and a newmap can be drawn on top of the added cubes (Figures 2Band C). I give the students six dry-erase cubes on top ofthe ones shown in Figure 2A. The four cubes in the front(omitted in Figure 2B) do not show the folded surface ontheir top faces, but they do show it on some of theirvertical faces. A great variety of maps of different levelscan be given, including those showing inclined parallelplanar geological contacts, angular unconformities,non-plunging or plunging folds with vertical, horizontalor inclined axial planes, or even refolded folds. Whenrelatively simple maps are given, such as the exampleshown in Figure 2, the students can be asked toaccurately construct the folded surface on various facesof the block diagrams by accurately determiningapparent dips. If more complex geometries are given,such as refolded folds, it may be more suitable to askthem to sketch the surfaces of interest on the remainingfaces of the cubes.
THE DRY-ERASE CUBE AS A MODEL FORISOMETRIC BLOCK DIAGRAMS
An isometric block diagram (all block diagrams in thispaper) is a projection of a block, such that the anglebetween each edge of the block and the projected surfaceis equal. Students benefit from learning how to showgeological features on (isometric) block diagrams inpreparation for potential careers in the petroleum ormining industries, geotechnical consulting, or academia.However, perhaps more importantly, working withthese diagrams greatly enhances the students'three-dimensional thinking skills.
In an isometric block diagram, all angles and lengthsof lines are distorted, except the lengths of linesmeasured parallel to the edges of the block (correctingfor scale). On the dry-erase cube nothing is distorted,which makes it an excellent instructional aid for thethree-dimensional visualization of two-dimensionalprojections. The students can draw planes on thesurfaces of the cube, and then visualize how these planeswill project through the cube, e.g. by holding a piece ofpaper in the right orientation close to the cube.
To visualize what the drawings on the cube wouldlook like on an isometric block diagram, the students canlook at the cube in the direction of projection and seewhat it would look like on paper. The effectiveness ofthis exercise can be further reinforced by simply taking aphotograph of the completed cube. This adds anadditional challenge in that the students have todetermine the vantage point from which the photographmust be taken to get the best correspondence betweenthe photo and the isometric diagram. They will discoverthat the photograph is always different from theisometric block diagram, because the photograph showsa perspective projection, in which parallel lines convergeaway from the viewer, as illustrated by the woodenplanks behind the cubes in Figures 3C and D. Somedistortion in addition to the perspective projection iscaused by camera lens effects, but these distortions aresufficiently small that the exercise can still be performed.The isometric block diagram is an orthogonal projection,in which parallel lines remain parallel (compare Figures3A and B with Figures 3C and D). The bestapproximation to orthographic projection is achievedwhen the photograph is taken at a great distance from the
264 Journal of Geoscience Education, v. 56, n. 3, May, 2008, p. 261-268
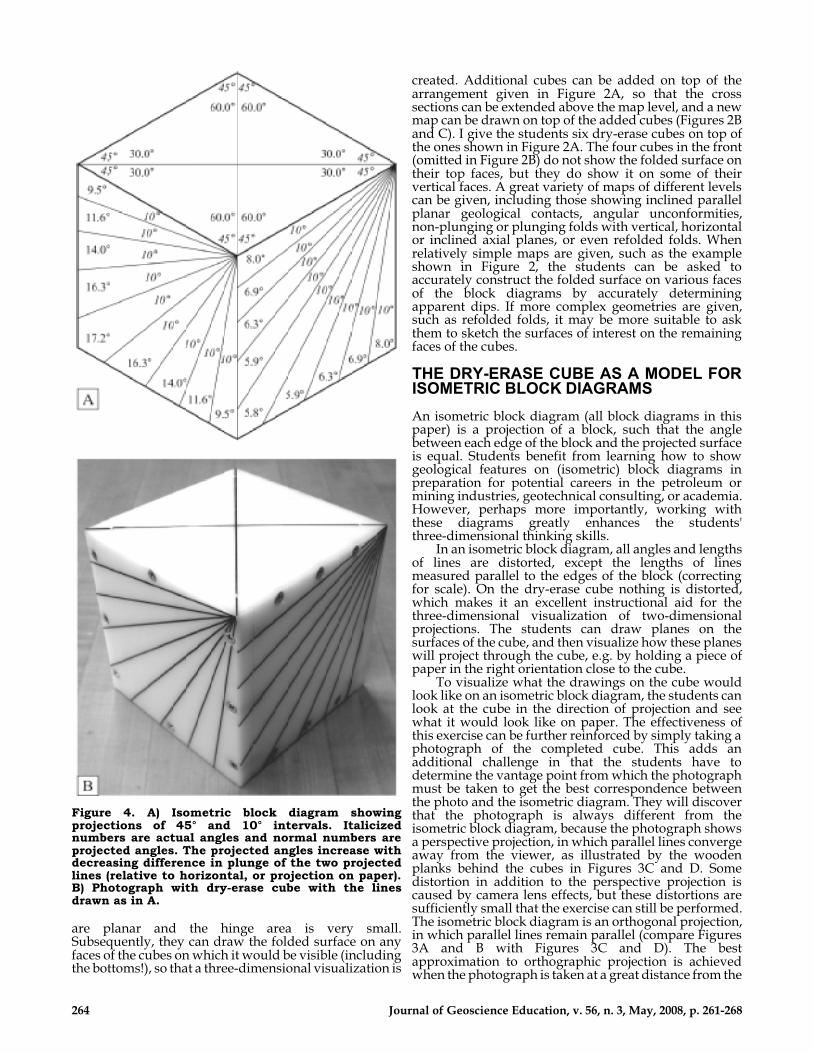
Figure 4. A) Isometric block diagram showingprojections of 45° and 10° intervals. Italicizednumbers are actual angles and normal numbers areprojected angles. The projected angles increase withdecreasing difference in plunge of the two projectedlines (relative to horizontal, or projection on paper).B) Photograph with dry-erase cube with the linesdrawn as in A.
cube, so that convergence of parallel lines away from theviewer is reduced to a minimum. Furthermore the photoshould be taken so that the angles between the viewingdirection and all edges of the cube are equal, as is true foran isometric block diagram.
Example 1: Plotting true dips on an isometric blockdiagram - Whereas the plotting of true dips on crosssections is straightforward, because angles can bemeasured on the cross section, plotting true dips on thevertical faces of an isometric block diagram may becomplicated, because of the distortion of angles. The 90°
Kuiper - Making Three-dimensional Visualization Easy 265
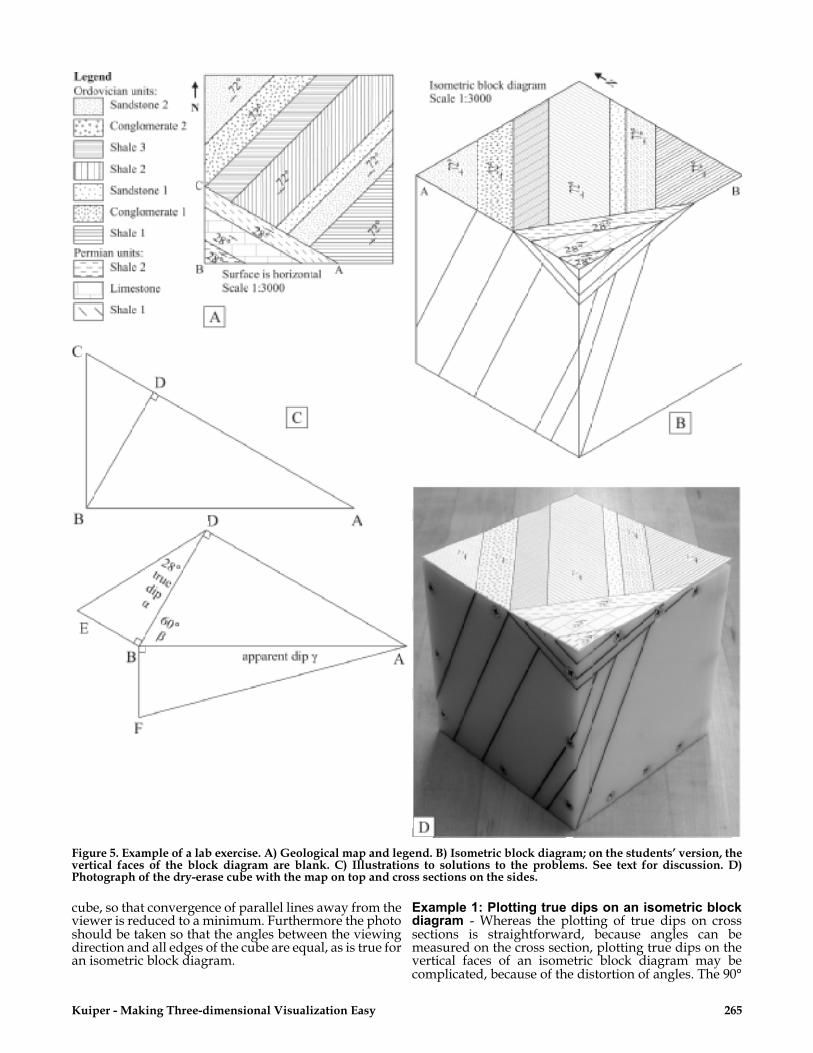
Figure 5. Example of a lab exercise. A) Geological map and legend. B) Isometric block diagram; on the students’ version, thevertical faces of the block diagram are blank. C) Illustrations to solutions to the problems. See text for discussion. D)Photograph of the dry-erase cube with the map on top and cross sections on the sides.
angles between edges of a three-dimensional blockappear as 60° or 120° on the two-dimensional isometricblock diagram. A common mistake is that angles withinthe faces of the block diagram are plotted proportionallywith the distortion of the 90° angles. For example, inFigure 3A, the angle of a plane dipping 30° to the westwith the horizontal surface would be 30°×60°/90° = 20°on paper, where 60° is the angle between the two edgesof the cube in the projection and 90° is the actual anglebetween the two edges of the cube. However, the correctprojected angle is 21.2°. Similarly, in Figure 3B, the angleon paper of a plane dipping 30° to the north would be30°×120°/90° = 40°, but the correct projected angle is35.1°. The correct angle can be found by trigonometry.Because distances can be measured along the edges ofthe block diagram, the length of Y in Figures 3A and Bcan be found by Y=X×tan(30°). The projected dips of theplanes can then be measured off the paper. To convincethe students that their projected dips represent a 30° dip,they can do the same trigonometry exercise on thedry-erase cubes and measure the dip off the cube(Figures 3C and D). It should be 30°.
Figure 4A can be used in combination with adry-erase cube (Figure 4B) to make the projectionproblem more clear to the students. On the vertical facesof the diagram the angles between the lines are 10°. Bylooking onto the corner of the dry-erase cube, the anglesactually appear different in reality, the same way as theyshow on the isometric block diagram (compare Figures4A and B).
Example 2: Plotting apparent dips on an isometricblock diagram - Plotting apparent dips on isometricblock diagrams builds upon skills developed in theprevious exercise. First, the students need to determinethe apparent dip of a plane on a face of the block diagram(as explained above for cross sections) before they cancalculate the projected angle on the isometric block
diagram (as explained above). An example is given inFigure 5. A map with a legend (Figure 5A) and this samemap on top of an isometric block diagram (Figure 5B) aregiven. Questions can be posed such as:
(a) What is the nature of the surface between theOrdovician and the Permian rocks?
(b) Determine the apparent dip of the geologicalcontacts in faces (A) and (B), given that the Permianbeds dip 28º to 210º and the Ordovician beds dip 72ºto 315º.
(c) Complete the block diagram and briefly describe thegeological history of the area.
The nature of the surface between the Ordovician and thePermian rocks is an angular unconformity. The apparentdips of the beds on the two vertical faces of the blockdiagram can be determined by using stereographicprojection, or by using the formula tan(γ) = tan(α) ×cos(β) (symbols explained above). However, to avoid'cook-book' style application of these methods withoutthoroughly understanding the methods, I prefer havingthe students develop their own method by usingtrigonometry. This approach refreshes theirtrigonometry skills, but most importantly forces them tothink three-dimensionally.
In Figure 5C, the triangle ABC is the same as inFigure 5A. BD can be measured off the map (Figure 5A)and BE can be calculated: BE = BD × tan(28º) = 3.55 cm ×tan(28º) = 1.89 cm. The angular unconformity willtherefore show on the front edge on the block diagram at1.89 cm below the front corner of the diagram. The planeof the unconformity can then be drawn withoutcalculating the apparent dip. The other contacts betweenthe Permian rocks can be drawn parallel to theunconformity. The apparent dips of the Ordovician bedscan be determined the same way.
A more general way to calculate apparent dips isessentially a derivation of the formula tan(γ) = tan(α) ×cos(β) (e.g. Marshak and Mitra, 1988; Rowland et al.,2007), which is a useful exercise to do in a lab. Nothing ismeasured off the map. Combination of BE = BD ×tan(28º) and BE = BF = AB × tan(γ) yields tan(γ)/tan(28º)= BD/AB. Also, cos(60º) = BD/AB and thereforetan(γ)/tan(28º) = cos(60º) or tan(γ) = tan(28º) × cos(60º) =0.266, yielding γ = 14.9 º, which is the apparent dip onface B of the isometric block diagram. The other apparentdips can be found the same way. The apparent dipcannot be measured on the block diagram. Thereforedistances along the vertical edges of the block diagramstill need to be calculated, e.g., BF = AB × tan(14.9º) = 7.1cm × tan(14.9º) = 1.89 cm. The dry-erase cube (Figure 5D)is illustrative in this case, because the apparent dips canbe measured and drawn directly on the cube. The mapcan be cut out and be placed on top of the cube (Figure5D). Using the cube makes it easier to visualize what thecontacts look like in three dimensions. On the cube it isalso possible to draw the contacts on the back and thebottom of the cube, so the contacts can be followed allaround it, further enhancing the three-dimensionalvisualization.
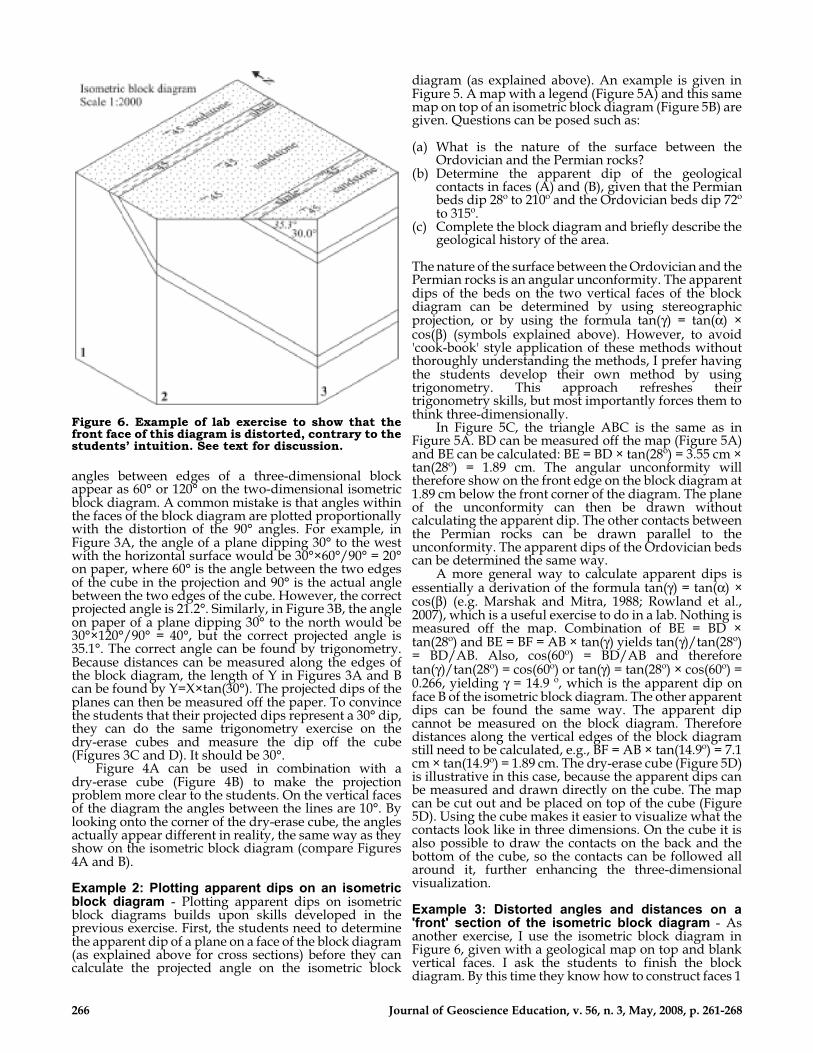
Example 3: Distorted angles and distances on a'front' section of the isometric block diagram - Asanother exercise, I use the isometric block diagram inFigure 6, given with a geological map on top and blankvertical faces. I ask the students to finish the blockdiagram. By this time they know how to construct faces 1
266 Journal of Geoscience Education, v. 56, n. 3, May, 2008, p. 261-268
Figure 6. Example of lab exercise to show that thefront face of this diagram is distorted, contrary to thestudents’ intuition. See text for discussion.

and 3. However, completion of face 2 is a surprise. Itlooks like the face is parallel to the plane of its projection,but in reality, the front face is dipping away from theviewer in the same way as the vertical edges of the blockdiagram are plunging away from the viewer. Also, thehorizontal and vertical scales on this face are differentdue to the projection. The vertical edges of the front faceare parallel to the edges of the block diagram andtherefore distances can be measured parallel to theseedges. The horizontal edges actually lie within the plane
of projection, but because the scale is adjusted such thatdistances can be measured along the edges of the blockdiagram, distances measured parallel to these horizontaledges are longer on paper than they are in reality(compare the real and projected diagonals of the mapand the isometric block). The width of the front face is 8.7cm on paper. However, in reality it is 7.1 cm. Thestudents can convince themselves of this by measuringthe width on paper and on the dry-erase cube. Thehorizontal 'stretch' of this face on paper also explainswhy the apparent dip of 35.3º actually measures 30.0º onpaper. This exercise emphasizes once more that on anisometric block diagram, distances can only be measuredparallel to the edges of the diagram and all angles aredistorted (the exception is when the corner of the cube iscut such that the new face is parallel to the plane ofprojection; in this case angles are not distorted, butdistances are).
THE DRY-ERASE CUBE AS AN AID INUNDERSTANDING STEREOGRAPHICPROJECTIONS
A common goal in structural geology labs is to trainstudents to relate planar and linear structures in variousformats, including: (1) symbol on a map, (2) dip directionand dip (3) strike and dip, (4) planes or lines on anisometric block diagram and (5) planes and lines inreality (three dimensions) and (6) planes and lines instereographic projection. To aid the students in theirattempts to understand stereographic projections, I haveexperimented with numerous three-dimensional modelsfor stereographic projections varying from sophisticatedplastic models with rotatable planes and lines to simplesoup bowls with home-made card-board planes andlines drawn on them. Still, the students have difficultyrelating the planar and linear features drawn onstereographic projections, to those in reality. Thedry-erase cube with the plane or line of interest drawn onit can be viewed side by side with the stereographicprojection and any of their three-dimensional models.Seeing the plane in three dimensions helps the studentsrelate stereographic projections to the measurements,symbols and diagrams they have on paper.
THE DRY-ERASE CUBE AS AN ANALOGUEFOR ORIENTATED SAMPLES
The dry-erase cubes can also be used as an analogue fororientated samples, and to illustrate the relationshipbetween lineations on the foliation plane and shear senseindicators on sections perpendicular to the lineation(Figure 7). The students can be asked to place the 'sample'in a sandbox in the correct position, using an orientationalready drawn on the cube (Figure 7B). Alternatively, adry-erase cube can be placed in a certain position, so thata student can determine its orientation. For the latterexample, a second student can try to place that same'sample' in the correct position and test if the firststudent's orientation was correct.
Students can also be asked to indicate on the cubeswhere they would cut a thin section if they wereinterested in shear sense indicators. In Figure 7A, thelineation is an intersection between an S-foliation(oblique on the right vertical face) and a C-foliation (topface), and therefore perpendicular to the shear direction.A thin section would need to be perpendicular to both
Kuiper - Making Three-dimensional Visualization Easy 267
Figure 7. Dry-erase cubes used as an analogue fororientated rock samples. A) An S-C fabric that isespecially clearly shown on the right side indicatesthat the lineation on top is an intersection lineation.Foliation dips 85° degrees towards 165°. The shearsense is sinistral. B) Dry-erase cube placed in itscorrect orientation according to the measurement onthe foliated surface (dipping 70° degrees towards350°). Marker points north. The lineation is astretching or mineral lineation and the shear sense isdextral, north-side-up.
foliation and lineation. In Figure 7B, the lineation is astretching or mineral lineation, which is parallel to theshear direction. The best orientation for a thin sectionwould thus be perpendicular to the foliation and parallelto the lineation. With the help of a piece of paper, whichwould represent a rock chip, students could practicewhat to write on the rock chip or thin section to be able toorient it relative to the rock sample.
Once the students are able to identify the shear senseindicators, the type of lineation and the orientation of thesample, they should be able to find the shear sense. InFigure 7A the lineation is down dip and the shear sense issinistral. In Figure 7B, the lineation is oblique and theshear sense is dextral, north-side-up.
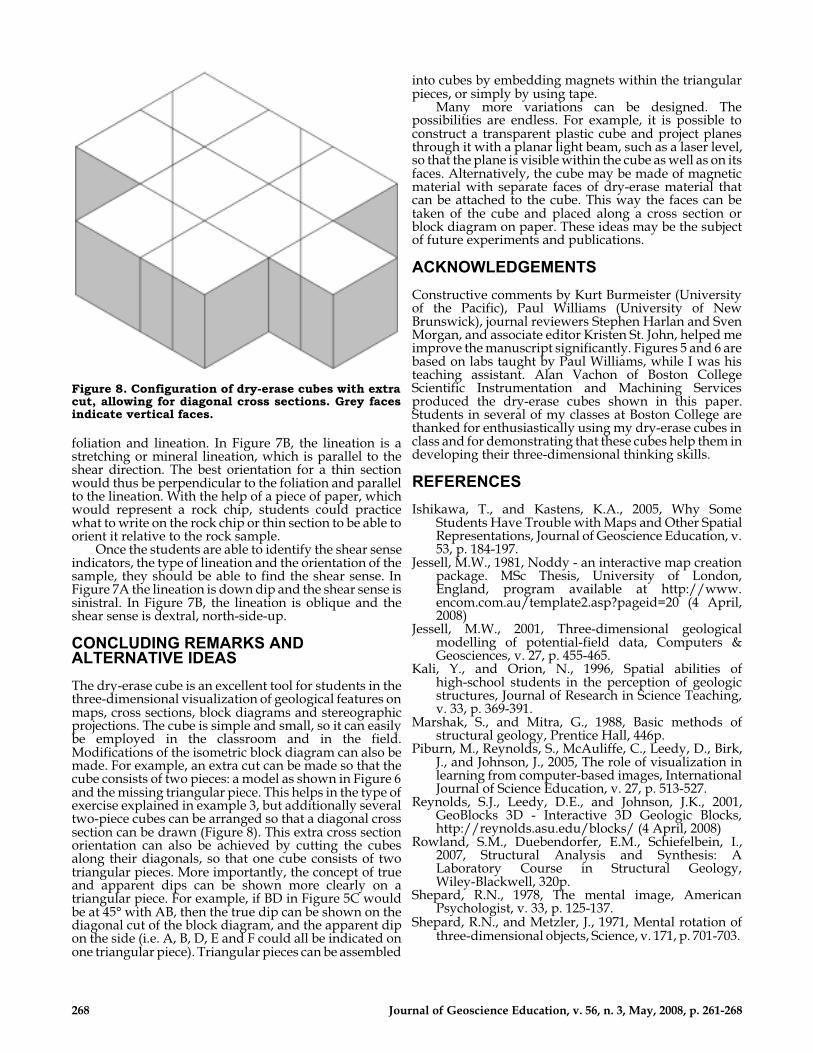
CONCLUDING REMARKS ANDALTERNATIVE IDEAS
The dry-erase cube is an excellent tool for students in thethree-dimensional visualization of geological features onmaps, cross sections, block diagrams and stereographicprojections. The cube is simple and small, so it can easilybe employed in the classroom and in the field.Modifications of the isometric block diagram can also bemade. For example, an extra cut can be made so that thecube consists of two pieces: a model as shown in Figure 6and the missing triangular piece. This helps in the type ofexercise explained in example 3, but additionally severaltwo-piece cubes can be arranged so that a diagonal crosssection can be drawn (Figure 8). This extra cross sectionorientation can also be achieved by cutting the cubesalong their diagonals, so that one cube consists of twotriangular pieces. More importantly, the concept of trueand apparent dips can be shown more clearly on atriangular piece. For example, if BD in Figure 5C wouldbe at 45° with AB, then the true dip can be shown on thediagonal cut of the block diagram, and the apparent dipon the side (i.e. A, B, D, E and F could all be indicated onone triangular piece). Triangular pieces can be assembled
into cubes by embedding magnets within the triangularpieces, or simply by using tape.
Many more variations can be designed. Thepossibilities are endless. For example, it is possible toconstruct a transparent plastic cube and project planesthrough it with a planar light beam, such as a laser level,so that the plane is visible within the cube as well as on itsfaces. Alternatively, the cube may be made of magneticmaterial with separate faces of dry-erase material thatcan be attached to the cube. This way the faces can betaken of the cube and placed along a cross section orblock diagram on paper. These ideas may be the subjectof future experiments and publications.
ACKNOWLEDGEMENTS
Constructive comments by Kurt Burmeister (Universityof the Pacific), Paul Williams (University of NewBrunswick), journal reviewers Stephen Harlan and SvenMorgan, and associate editor Kristen St. John, helped meimprove the manuscript significantly. Figures 5 and 6 arebased on labs taught by Paul Williams, while I was histeaching assistant. Alan Vachon of Boston CollegeScientific Instrumentation and Machining Servicesproduced the dry-erase cubes shown in this paper.Students in several of my classes at Boston College arethanked for enthusiastically using my dry-erase cubes inclass and for demonstrating that these cubes help them indeveloping their three-dimensional thinking skills.
REFERENCES
Ishikawa, T., and Kastens, K.A., 2005, Why SomeStudents Have Trouble with Maps and Other SpatialRepresentations, Journal of Geoscience Education, v.53, p. 184-197.
Jessell, M.W., 1981, Noddy - an interactive map creationpackage. MSc Thesis, University of London,England, program available at http://www.encom.com.au/template2.asp?pageid=20 (4 April,2008)
Jessell, M.W., 2001, Three-dimensional geologicalmodelling of potential-field data, Computers &Geosciences, v. 27, p. 455-465.
Kali, Y., and Orion, N., 1996, Spatial abilities ofhigh-school students in the perception of geologicstructures, Journal of Research in Science Teaching,v. 33, p. 369-391.
Marshak, S., and Mitra, G., 1988, Basic methods ofstructural geology, Prentice Hall, 446p.
Piburn, M., Reynolds, S., McAuliffe, C., Leedy, D., Birk,J., and Johnson, J., 2005, The role of visualization inlearning from computer-based images, International Journal of Science Education, v. 27, p. 513-527.
Reynolds, S.J., Leedy, D.E., and Johnson, J.K., 2001,GeoBlocks 3D - Interactive 3D Geologic Blocks,http://reynolds.asu.edu/blocks/ (4 April, 2008)
Rowland, S.M., Duebendorfer, E.M., Schiefelbein, I.,2007, Structural Analysis and Synthesis: ALaboratory Course in Structural Geology,Wiley-Blackwell, 320p.
Shepard, R.N., 1978, The mental image, AmericanPsychologist, v. 33, p. 125-137.
Shepard, R.N., and Metzler, J., 1971, Mental rotation ofthree-dimensional objects, Science, v. 171, p. 701-703.
268 Journal of Geoscience Education, v. 56, n. 3, May, 2008, p. 261-268
Figure 8. Configuration of dry-erase cubes with extracut, allowing for diagonal cross sections. Grey facesindicate vertical faces.