the drivers of tropical speciation - lsu · the drivers of tropical speciation brian tilston...
TRANSCRIPT

LETTERdoi:10.1038/nature13687
The drivers of tropical speciationBrian Tilston Smith1,2*, John E. McCormack1{, Andres M. Cuervo1,3{, Michael. J. Hickerson4,5, Alexandre Aleixo6,Carlos Daniel Cadena7, Jorge Perez-Eman8,9, Curtis W. Burney1,3{, Xiaoou Xie4, Michael G. Harvey1,3, Brant C. Faircloth10{,Travis C. Glenn11, Elizabeth P. Derryberry1{, Jesse Prejean1,3, Samantha Fields1,3 & Robb T. Brumfield1,3*
Since the recognition that allopatric speciation can be induced bylarge-scale reconfigurations of the landscape that isolate formerlycontinuous populations, such as the separation of continents by platetectonics, the uplift of mountains or the formation of large rivers, land-scape change has been viewed as a primary driver of biological diver-sification. This process is referred to in biogeography as vicariance1.In the most species-rich region of the world, the Neotropics, the sun-dering of populations associated with the Andean uplift is ascribedthis principal role in speciation2–5. An alternative model posits thatrather than being directly linked to landscape change, allopatric spe-ciation is initiated to a greater extent by dispersal events, with theprincipal drivers of speciation being organism-specific abilities topersist and disperse in the landscape6,7. Landscape change is not anecessity for speciation in this model8. Here we show that spatial andtemporal patterns of genetic differentiation in Neotropical birds arehighly discordant across lineages and are not reconcilable with a modellinking speciation solely to landscape change. Instead, the strongestpredictors of speciation are the amount of time a lineage has persistedin the landscape and the ability of birds to move through the land-scape matrix. These results, augmented by the observation that mostspecies-level diversity originated after episodes of major Andean upliftin the Neogene period, suggest that dispersal and differentiation ona matrix previously shaped by large-scale landscape events was a majordriver of avian speciation in lowland Neotropical rainforests.
In the species-rich Neotropics, the origins of biodiversity are usuallylinked to changes to the Earth’s landscape over geological time2–5,9,10. Pal-aeogeographic studies indicate that Andean mountain building duringthe Neogene catalysed tumultuous changes in the lowlands, includingformation of the Amazon River system, closure of the Isthmus of Panama,and the isolation of humid lowland forests east and west of the Andesby montane habitats and the aridification of the Caribbean lowlands innorthern South America4. These large-scale landscape changes are hypoth-esized to have driven speciation by fragmenting species distributions thatwere formerly continuous, a process that can generate congruent spatialand temporal patterns of genetic differentiation in co-distributed lineages,especially for lineages with similar ecological characteristics. Bolsteringsupport for the importance of landscape change driving isolation in thisregion, time-calibrated phylogenies of a taxonomically diverse group oforganisms encompassing a broad range of ecologies and dispersal abil-ities indicate that many modern Neotropical lineages originated duringtime periods associated with major reconfigurations of the landscape,presumably signifying a shared response to landscape history9.
An alternative hypothesis is that the principal effect of Andean mountainbuilding in the Neogene on speciation was the formation of a geographi-cally structured landscape matrix upon which subsequent diversification
occurred. Within the humid lowland forests of the Neotropics the landscapecontains mountains and rivers that restrict the movement of individualsacross them (we use the term dispersal for these movements). Under thismodel, lineages with a longer occupation of the landscape have ahigher likelihood of dispersing across geographical barriers and diver-sifying. In addition, lineages with lower dispersal ability are expected toaccrue genetic differentiation between populations at a relatively higherrate than more dispersive lineages, leading to a higher rate of speciation7.In this model, lineage-specific attributes are predicted to be the primarydeterminants of species diversity within lineages11.
These two models of diversification in the Neotropics have been dif-ficult to evaluate empirically because: (1) large-scale comparative dataare needed from multiple co-distributed lineages; (2) each lineage needsto be sampled densely across its range to identify phylogeographic breaksand to estimate within-lineage species diversity; (3) the sampled lineagesmust encompass a range of quantifiable dispersal abilities and ecologicalguilds in order to test how these variables affect speciation; and (4) thephylogenetic position of each lineage must be known to approximate lin-eage age. We assessed the relative support for these two models in explain-ing standing species-level variation by characterizing recent large-scalediversification using a comparative phylogeography data set containingover 2,500 individuals from 27 widespread bird lineages in the species-rich Neotropics (Supplementary Table 17 and Figs 1 and 2). Biological spe-cies often represent an inaccurate estimate of the true diversity in avianrainforest communities because the alpha taxonomies of most groups stillrequire formal revision using modern methods. To minimize biases asso-ciated with species limits based on current taxonomy, we defined eachlineage as all populations of a given taxon that represent, on the basis ofavailable evidence, a monophyletic group, regardless of whether the lineageis currently treated as a single species or as a species complex that includesseveral closely related species. By examining relatively recent diversifica-tion at the phylogeographic scale, where extinction is less likely to haveoccurred, we minimized the confounding effects of extinction. Extinctionis difficult to account for analytically and typically increases with time12.
The Andes, the Isthmus of Panama and large rivers of the AmazonBasin (the Amazon, Madeira and Negro rivers) are prominent featuresof the Neotropical landscape that interrupt the distributions of the 27focal lineages to varying degrees (Fig. 1 and Supplementary Figs 1–27).The effect of the landscape on diversification is evident taxonomically,with distinct taxa usually located on opposite banks of Amazonian rivers,the Isthmus of Panama and the Andes. Biogeographers often treat regionsdelimited by these dispersal barriers as areas of endemism because ofthe accumulation within them of distinct taxa having common distri-butional ranges (Extended Data Fig. 1). The exact time of origin of thedispersal barriers separating these areas is debated4,5,13–16, but most data
*These authors contributed equally to this work.
1Museum of Natural Science, Louisiana State University, Baton Rouge, Louisiana 70803, USA. 2Department of Ornithology, American Museum of Natural History, New York, New York 10024, USA.3Department of Biological Sciences, Louisiana State University, Baton Rouge, Louisiana 70803, USA. 4Biology Department, City College of New York, New York, New York 10031, USA. 5Division ofInvertebrate Zoology, American Museum of Natural History, New York, New York 10024, USA. 6Coordenaçao de Zoologia, Museu Paraense Emılio Goeldi, Caixa Postal 399, CEP 66040-170, Belem, Brazil.7Laboratorio de Biologıa Evolutiva de Vertebrados, Departamento de Ciencias Biologicas, Universidad de los Andes, Bogota, Colombia. 8Instituto de Zoologıa y Ecologıa Tropical, Universidad Central deVenezuela, Av. Los Ilustres, Los Chaguaramos, Apartado Postal 47058, Caracas 1041-A, Venezuela. 9Coleccion Ornitologica Phelps, Apartado 2009, Caracas 1010-A, Venezuela. 10Department of Ecologyand Evolutionary Biology, University of California, Los Angeles, California 90095, USA. 11Department of Environmental Health Science, University of Georgia, Athens, Georgia 30602, USA. {Presentaddresses: Moore Laboratory of Zoology, Occidental College, 1600 Campus Road, Los Angeles, California 90041, USA (J.E.M.); Department of Ecology and Evolutionary Biology, Tulane University, NewOrleans, Louisiana 70118, USA (A.M.C. & E.P.D.); Department of Biology, 2355 Faculty Drive, Suite 2P483, United States Air Force Academy, Colorado 80840, USA (C.W.B.); Department of BiologicalSciences, Louisiana State University, Baton Rouge, Louisiana 70803, USA (B.C.F.).
0 0 M O N T H 2 0 1 4 | V O L 0 0 0 | N A T U R E | 1
Macmillan Publishers Limited. All rights reserved©2014

indicate that they achieved their modern configuration during the Neogene(23–2.6 million years (Myr) ago)4. Subsequent landscape changes duringthe Quaternary period (2.6 Myr ago to present) were marked by fluctua-tions in forest cover driven by glacial–interglacial cycles4,17, but Amazoniaremained forested even during the cooler and drier glacial periods18.
Genealogies of the 27 lineages exhibited substantial variation in thetiming and spatial sequence of diversification associated with barriers(Fig. 3a, Supplementary Figs 1–27 and Supplementary Table 17). To testwhether divergence events across the major dispersal barriers structuringthese genealogies were consistent with a single episode of vicariance asso-ciated with barrier formation we used hierarchical approximate Bayesiancomputation (hABC)19, which is able to account for differences in geneticdrift among the 27 lineages (Extended Data Fig. 2 and Supplementary
Tables 3–7). Instead of supporting a single event, the genetic data wereconsistent with 9 to 29 divergence events across the Andes, with eachevent occurring at a different time (Bayes factor (Bf)50 when comparings2/ �t # 0.01 and s2/�t . 0.01; Extended Data Fig. 2 and SupplementaryInformation). The timing (t) of most of these divergence events was inthe Pleistocene. These results suggest the Andean uplift did not have adirect cross-lineage effect on biological diversification via vicariance, butrather had an indirect role in divergence by acting as a semi-permeablebarrier to post-uplift dispersal. We corroborated the above result ofasynchronous cross-Andes divergences (Bf 5 0.13) using hABC ana-lyses on multi-locus data sets (that is, .100 loci) generated from targetcapture and next-generation sequencing on a selected sample of lineages,indicating the pattern was robust to possible bias associated with infer-ring population history from single-locus data (Extended Data Fig. 3and Supplementary Information). The numbers of temporally spacedevents also did not support synchronous divergence across the Isthmusof Panama and the Amazonian rivers (Isthmus: 1–7 divergence events,Bf 5 0.00; Amazon River: 1–3 divergence events, Bf 5 0.01; Negro River:8–17 divergence events, Bf 5 0.63; Madeira River: 3–8 divergence events,Bf 5 0.66; Extended Data Fig. 2 and Supplementary Information), apattern consistent with the permeability of these barriers20.
We next examined to what extent speciation was influenced by thehistories and ecologies of the 27 lineages. We selected two historical andtwo ecological summary variables previously implicated in avian diver-sification: (1) lineage age (a measure of evolutionary persistence), whichwe measured as the timing of a lineage’s divergence from its sister taxon(stem age); (2) ancestral area of a lineage’s origin (east or west of theAndes); (3) foraging stratum, a measure of dispersal ability linked to thebehaviour of birds (canopy, high dispersal ability or understorey, lowdispersal ability); and (4) niche breadth (an indirect measure of dispersalability based on habitat preference), estimated from climate-based ecol-ogical niche models (Supplementary Information). We then used phy-logenetic generalized least-squares analyses to test the effects of thesevariables on the number of species within each of the 27 lineages, as definedby a coalescent-based Bayesian species-delimitation method (Supplemen-tary Information and Extended Data Fig. 4).
We found that a lineage’s intrinsic ability to persist in the landscapewas an important driver of speciation. The number of species within alineage was strongly predicted by lineage age (DAICc 5 6.9586, whereDAICc refers to the change in the sample size-corrected Akaike informa-tion criterion when a predictor variable was removed from the modelcontaining all predictor variables; Fig. 3b, Table 1 and SupplementaryTables 12 and 16). This relationship is consistent with the idea that thelonger a lineage occupies the landscape the more opportunities it hasto disperse and differentiate across geographical barriers. Although asequence of vicariant events acting on a set of co-distributed lineagescould produce a similar association between lineage age and species diver-sity, most of the species diversity we identified originated during thePleistocene epoch (Fig. 2 and Supplementary Table 17; n 5 142; 75%of species # 2.6 Myr ago), after the Neogene formation of the landscapematrix, but before the Last Glacial Maximum (26,500–19,000 years ago).At deeper phylogenetic timescales, a positive association between diverlevels and lineage age has been used to explain greater species richnessin areas having had more time to accumulate species21. It remains an openquestion whether the phylogeographic-scale processes we documentedscale up to shape large-scale biodiversity patterns. To put our results intoa broader temporal and spatial context would require a comparison ofrecent diversification events between temperate and tropical lineages22.
Ecologically, we found that foraging stratum had a significant effecton species diversity (DAICc 5 4.0122; Fig. 3, Table 1 and SupplementaryTables 12 and 16), with the more dispersal-limited lineages restricted tothe forest understorey exhibiting significantly higher species diversity thanthe more dispersive canopy lineages. This result corroborates previouswork that documented the greater dispersal ability of canopy species, pre-sumably due to the physiognomy of the canopy and the patchier distri-bution of food resources within it23,24. The ability of individuals to move
Figure 2 | Gene tree composed of 27 lineages of Neotropical birds, withspecies at tips inferred using a Bayesian coalescent model. An exemplartaxon for each lineage is illustrated30. Yellow bars correspond to the 95% highestposterior density for divergence times of each species. The Quaternary (2.6 Myrago–present) and the Neogene (23–2.6 Myr ago) periods are shaded in greyand light blue, respectively. Mean stem ages for 25 of the lineages occurredwithin the Neogene and for two lineages within the Quaternary. Outgroups foreach lineage are not included in the depicted phylogeny.
Isthmus ofIsthmus ofPanamaPanama
NegroNegroRiverRiver
AmazonAmazonRiverRiver
MadeiraMadeiraRiverRiver
And
es
And
es
Isthmus ofPanama
NegroRiver
AmazonRiver
MadeiraRiver
And
es
Figure 1 | Sampling within the landscape matrix. Sampling points of the 27bird lineages (circles) and prominent dispersal barriers within the landscapematrix, including the Andes (and associated arid habitats in the Caribbeanlowlands of South America), the Isthmus of Panama and three major rivers inthe Amazon Basin (Amazon, Negro and Madeira Rivers).
RESEARCH LETTER
2 | N A T U R E | V O L 0 0 0 | 0 0 M O N T H 2 0 1 4
Macmillan Publishers Limited. All rights reserved©2014
through the landscape matrix has long-term consequences for the accu-mulation of diversity within lineages, assuming the lineage persists overevolutionary timescales.
Studies of biological diversification have sought a general mechanismto explain the origins of the extraordinary diversity in Amazonia2,4,25, withmost concluding that landscape change by geological, climatic or marineforces is the principal driver of speciation. Using a comparative phylo-geographic approach and incorporating the variability in ecology andevolutionary history among co-distributed lineages, we found that geneticpatterns in birds are not easily reconcilable with a model in which diver-sification is a direct response to landscape change. Instead of finding thepredicted shared response among lineages, our comparative analysis,and phylogeographic studies of other Amazonian organisms26, foundextensive spatial and temporal discordance in genetic differentiation tobe the norm. For example, divergence levels across the Andes were con-sistent with 9 to 29 distinct divergence events (Extended Data Fig. 2).Although highly suggestive of multiple dispersal events, this variation
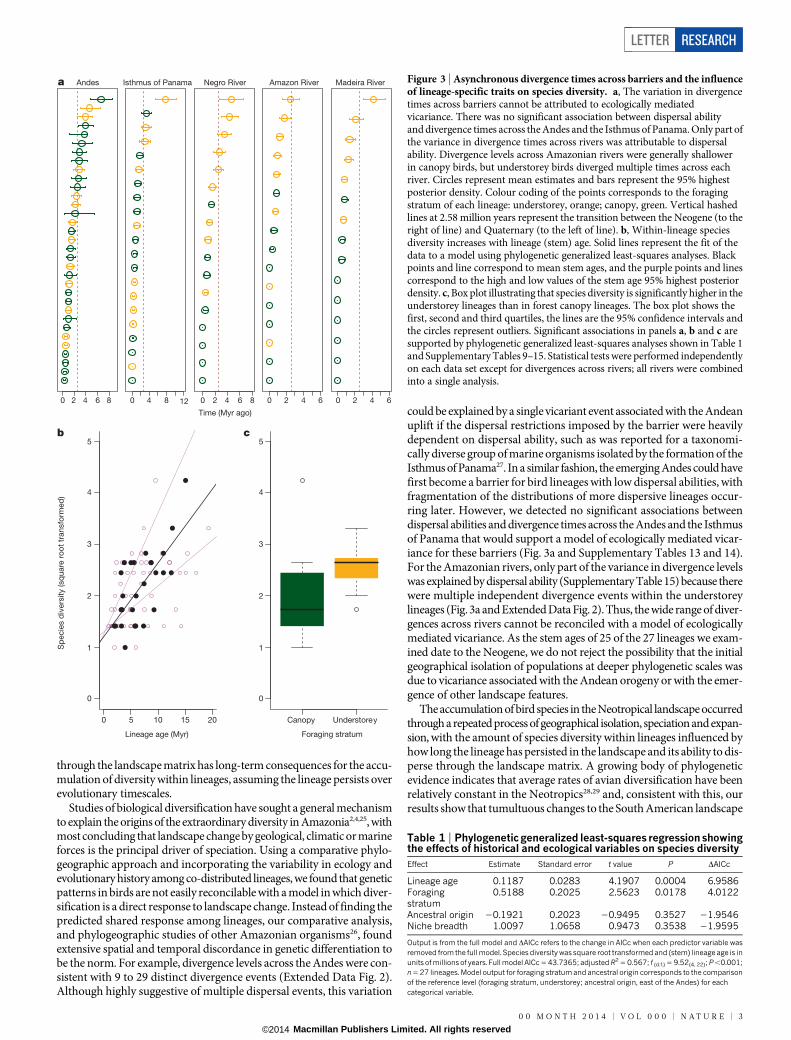
could be explained by a single vicariant event associated with the Andeanuplift if the dispersal restrictions imposed by the barrier were heavilydependent on dispersal ability, such as was reported for a taxonomi-cally diverse group of marine organisms isolated by the formation of theIsthmus of Panama27. In a similar fashion, the emerging Andes could havefirst become a barrier for bird lineages with low dispersal abilities, withfragmentation of the distributions of more dispersive lineages occur-ring later. However, we detected no significant associations betweendispersal abilities and divergence times across the Andes and the Isthmusof Panama that would support a model of ecologically mediated vicar-iance for these barriers (Fig. 3a and Supplementary Tables 13 and 14).For the Amazonian rivers, only part of the variance in divergence levelswas explained by dispersal ability (Supplementary Table 15) because therewere multiple independent divergence events within the understoreylineages (Fig. 3a and Extended Data Fig. 2). Thus, the wide range of diver-gences across rivers cannot be reconciled with a model of ecologicallymediated vicariance. As the stem ages of 25 of the 27 lineages we exam-ined date to the Neogene, we do not reject the possibility that the initialgeographical isolation of populations at deeper phylogenetic scales wasdue to vicariance associated with the Andean orogeny or with the emer-gence of other landscape features.
The accumulation of bird species in the Neotropical landscape occurredthrough a repeated process of geographical isolation, speciation and expan-sion, with the amount of species diversity within lineages influenced byhow long the lineage has persisted in the landscape and its ability to dis-perse through the landscape matrix. A growing body of phylogeneticevidence indicates that average rates of avian diversification have beenrelatively constant in the Neotropics28,29 and, consistent with this, ourresults show that tumultuous changes to the South American landscape
0
Andes
12
Isthmus of Panama Negro River
Time (Myr ago)
Amazon River Madeira River
0 10 15 20
Lineage age (Myr)
Sp
ecie
s d
ivers
ity (sq
uare
ro
ot
transfo
rmed
)
Canopy Understorey
Foraging stratum
a
b c
2 4 6 8 0 4 8 0 2 4 6 8 0 2 4 6 0 2 4 6
0
1
2
3
4
5
5
0
1
2
3
4
5
Figure 3 | Asynchronous divergence times across barriers and the influenceof lineage-specific traits on species diversity. a, The variation in divergencetimes across barriers cannot be attributed to ecologically mediatedvicariance. There was no significant association between dispersal abilityand divergence times across the Andes and the Isthmus of Panama. Only part ofthe variance in divergence times across rivers was attributable to dispersalability. Divergence levels across Amazonian rivers were generally shallowerin canopy birds, but understorey birds diverged multiple times across eachriver. Circles represent mean estimates and bars represent the 95% highestposterior density. Colour coding of the points corresponds to the foragingstratum of each lineage: understorey, orange; canopy, green. Vertical hashedlines at 2.58 million years represent the transition between the Neogene (to theright of line) and Quaternary (to the left of line). b, Within-lineage speciesdiversity increases with lineage (stem) age. Solid lines represent the fit of thedata to a model using phylogenetic generalized least-squares analyses. Blackpoints and line correspond to mean stem ages, and the purple points and linescorrespond to the high and low values of the stem age 95% highest posteriordensity. c, Box plot illustrating that species diversity is significantly higher in theunderstorey lineages than in forest canopy lineages. The box plot shows thefirst, second and third quartiles, the lines are the 95% confidence intervals andthe circles represent outliers. Significant associations in panels a, b and c aresupported by phylogenetic generalized least-squares analyses shown in Table 1and Supplementary Tables 9–15. Statistical tests were performed independentlyon each data set except for divergences across rivers; all rivers were combinedinto a single analysis.
Table 1 | Phylogenetic generalized least-squares regression showingthe effects of historical and ecological variables on species diversityEffect Estimate Standard error t value P DAICc
Lineage age 0.1187 0.0283 4.1907 0.0004 6.9586Foragingstratum
0.5188 0.2025 2.5623 0.0178 4.0122
Ancestral origin 20.1921 0.2023 20.9495 0.3527 21.9546Niche breadth 1.0097 1.0658 0.9473 0.3538 21.9595
Output is from the full model and DAICc refers to the change in AICc when each predictor variable wasremoved from the full model. Species diversity was square root transformed and (stem) lineage age is inunits of millions of years. Full model AICc 5 43.7365; adjusted R2 5 0.567; f (d.f.) 5 9.52(4, 22); P ,0.001;n 5 27 lineages. Model output for foraging stratum and ancestral origin corresponds to the comparisonof the reference level (foraging stratum, understorey; ancestral origin, east of the Andes) for eachcategorical variable.
LETTER RESEARCH
0 0 M O N T H 2 0 1 4 | V O L 0 0 0 | N A T U R E | 3
Macmillan Publishers Limited. All rights reserved©2014

may not have led to marked pulses in speciation. Correlations betweenlineage ages and the Andean uplift or Quaternary climatic events reportedelsewhere9,25 are suggestive of landscape and environmental change beinga component of the diversification process, but the details of how, whenand to what extent these changes drove the origin of standing species-level diversity remain unclear. Our phylogeographic-scale analysis indi-cated most species-level variation postdates the Andean uplift, and ourresults contribute to a growing number of studies reporting dispersalevents as the primary initiators of geographical isolation and speciation6.Our results also have an important conservation implication. Anthro-pogenic alterations of the landscape matrix by deforestation and climatechange affect not only the evolutionary persistence of rainforest line-ages, but also the occurrence of cross-barrier dispersal events withinlineages that lead to new biological diversity.
Online Content Methods, along with any additional Extended Data display itemsandSourceData, areavailable in theonlineversionof thepaper; referencesuniqueto these sections appear only in the online paper.
Received 6 April; accepted 17 July 2014.
Published online 10 September 2014.
1. Nelson,G. J.&Platnick,N. I.Systematics and Biogeography:Cladistics and VicarianceVol. 214 (Columbia Univ. Press, 1981).
2. Haffer, J. Speciation in Amazonian forest birds. Science 165, 131–137 (1969).3. Mayr, E. Systematics and the Origin of Species, from the Viewpoint of a Zoologist
No. 13 (Harvard Univ. Press, 1942).4. Hoorn, C. F. P. et al. Amazonia through time: Andean uplift, climate change,
landscape evolution and biodiversity. Science 330, 927–931 (2010).5. Ribas, C. C., Aleixo, A., Nogueira, A. C., Miyaki, C. Y. & Cracraft, J. A
palaeobiogeographic model for biotic diversification within Amazonia over thepast three million years. Proc. R. Soc. Lond. B 279, 681–689 (2012).
6. Sanmartın, I., van der Mark, P. & Ronquist, F. Inferring dispersal: a Bayesianapproach to phylogeny-based island biogeography, with special reference to theCanary Islands. J. Biogeogr. 35, 428–449 (2008).
7. Wakeley, J. & Aliacar, N. Gene genealogies in a metapopulation. Genetics 159,893–905 (2001).
8. Udvardy, M. D. F. & Papp, C. S. Dynamic Zoogeography (Van Nostrand ReiholdCompany, 1969).
9. Antonelli, A. et al. in Amazonia, Landscape and Species Evolution (eds Hoorn, C. &Wesselingh, F.P.) 386–404 (Blackwell, 2010).
10. Chapman, F. M. The Distribution of Bird-Life in Colombia: a Contribution to aBiological Survey of South America Vol. 36 (American Museum of Natural History,1917).
11. Burney, C. W. & Brumfield, R. T. Ecology predicts levels of genetic differentiation inneotropical birds. Am. Nat. 174, 358–368 (2009).
12. Rabosky, D. L. Extinction rates should not be estimated from molecularphylogenies. Evolution 64, 1816–1824 (2010).
13. Gregory-Wodzicki, K. M. Uplift history of the Central and Northern Andes: a review.Geol. Soc. Am. Bull. 112, 1091–1105 (2000).
14. Campbell, K. E. Jr, Frailey, C. D. & Romero-Pittman, L. The Pan-Amazonian UcayaliPeneplain, late Neogene sedimentation in Amazonia, and the birth of the modernAmazonriver system.Palaeogeogr.Palaeoclimatol.Palaeoecol.239,166–219(2006).
15. Latrubesse, E. M. et al. The late Miocene paleogeography of the Amazon Basin andthe evolution of the Amazon River system. Earth Sci. Rev. 99, 99–124 (2010).
16. Montes, C. et al. Evidence for middle Eocene and younger land emergence incentral Panama: implications for isthmus closure. Geol. Soc. Am. Bull. 124,780–799 (2012).
17. Cheng, H. et al. Climate change patterns in Amazonia and biodiversity. NatureCommun. 4, 1411 (2013).
18. Bush, M. B., Gosling, W. D. & Colinvaux, P. A. in Tropical Rainforest Responses toClimatic Change Ch. 3, 61–84 (Springer Praxis Books, 2011).
19. Hickerson, M. J., Stahl, E. A. & Takebayashi, N. msBayes: pipeline for testingcomparative phylogeographic histories using hierarchical approximate Bayesiancomputation. BMC Bioinform. 8, 268 (2007).
20. Naka, L. N. N. et al. The role of physical dispersal barriers in the location of aviansuture zones in the Guiana Shield, northern Amazonia. Am. Nat. 179, E115–E132(2012).
21. Wiens, J. J. The causes of species richness patterns across space, time, and cladesand the role of ‘‘ecological limits’’. Q. Rev. Biol. 86, 75–96 (2011).
22. Weir, J. T. & Schluter, D. The latitudinal gradient in recent speciation and extinctionrates of birds and mammals. Science 315, 1574–1576 (2007).
23. Greenberg, R. The abundance and seasonality of forest canopy birds onBarro-Colorado Island, Panama. Biotropica 13, 241–251 (1981).
24. Loiselle, B. A. Bird abundance and seasonality in a Costa Rican lowland forestcanopy. Condor 90, 761–772 (1988).
25. Rull, V. Neotropical biodiversity: timing and potential drivers. Trends Ecol. Evol. 26,508–513 (2011).
26. Turchetto-Zolet, A. C., Pinheiro, F., Salgueiro, F. & Palma-Silva, C.Phylogeographical patterns shed light on evolutionary process in South America.Mol. Ecol. 22, 1193–1213 (2013).
27. Lessios, H. A. The great American schism: divergence of marine organisms afterthe rise of the Central American isthmus. Annu. Rev. Ecol. Evol. Syst. 39, 63–91(2008).
28. Jetz, W., Thomas, G. H., Joy, J. B., Hartmann, K. & Mooers, A. O. The global diversityof birds in space and time. Nature 491, 444–448 (2012).
29. Derryberry, E. P. et al. Lineage diversification and morphological evolution in alarge-scale continental radiation: the Neotropical ovenbirds and woodcreepers(Aves: Furnariidae). Evolution 65, 2973–2986 (2011).
30. del Hoyo, J., Elliott, A., Sargatal, J. & Christie D. A. (eds) Handbook of the Birds of theWorld (Lynx Edicions, 1992–2013).
Supplementary Information is available in the online version of the paper.
Acknowledgements We thank the collectors, preparators, collection managers andcurators of vouchered tissue samples who made this study possible. We thank thefollowing people and institutions for providing samples: D. Dittmann, F. Sheldon(LSUMZ), N. Rice (ANSP), M. Robbins (KU), D. Willard, S. Hackett (FMNH), G. Graves,J. Dean (USNM), J. Cracraft, P. Sweet, T. Trombone (AMNH), S. Birks, J. Klicka (UWBM),K. Bostwick, I. Lovette (CUMV), B. Hernandez-Banos, A. Navarro (MZFC), D. Lopez(IAvH-BT), F. G. Stiles (ICN), M. Lentino (COP), F. Raposo, C. Miyaki (LGEMA, USP) andMuseo de Historia Natural de la Universidad de los Andes. This study was supported byNSF awards to R.T.B. (DEB-0841729), M.J.H. (DEB 1253710; DEB 1343578) andCUNY HPCC (CNS-0855217), the Coypu Foundation, Brazilian Research Council(Conselho Nacional de Desenvolvimento Cientıfico e Tecnologico) (grant numbers:574008-2008-0; 490131/2009-3; 310593/2009-3; 574008/2008-0; 563236/2010-8 and 471342/ 2011-4) and FAPESPA awards (ICAAF 023/2011) to A.A., andsupport from CDCH and INPMA to J.P.-E. We thank G. Thomas, N. Gutierrez-Pinto,N. Reid, G. Bravo, J. Miranda, G. Seeholzer, C. Salisbury, C. Cooney, R. Bryson Jr, B.Riddle, N. Takebayashi, B. Winger, V. Chua and J. Weckstein for their assistance,comments and feedback. We thank Lynx Edicions and E. Badia for granting uspermission to reuse bird plates from the Handbook of Birds of the World in Fig. 2.
Author Contributions B.T.S. performed ecological niche modelling and conductedall statistical analyses except for hABCanalyses,whichwereperformedand interpretedby M.J.H. and X.X. J.E.M., A.M.C., A.A., C.D.C., J.P.-E., C.W.B., E.P.D., J.P. and S.F. assistedwith sampling and mitochondrial data collection. B.C.F., M.G.H., T.C.G. and B.T.S.collected ultraconserved element multi-locus sequence capture data. R.T.B. conceivedthe study. R.T.B., C.D.C., A.A., J.P.-E., B.T.S. and J.E.M. designed the study. B.T.S. andR.T.B. wrote the paper with help from M.J.H., M.G.H., C.D.C., J.E.M., A.M.C., A.A., J.P.-E.,B.C.F. and T.C.G.
Author Information Mitochondrial sequences generated for this study were depositedat GenBank under accession numbers KM079656–KM081611. This work wasconducted under Louisiana State University Institutional Animal Care and UseCommittee Protocol 09-001. Reprints and permissions information is available atwww.nature.com/reprints. The authors declare no competing financial interests.Readers are welcome to comment on the online version of the paper. Correspondenceand requests for materials should be addressed to R.T.B. ([email protected]).
RESEARCH LETTER
4 | N A T U R E | V O L 0 0 0 | 0 0 M O N T H 2 0 1 4
Macmillan Publishers Limited. All rights reserved©2014

Extended Data Figure 1 | Areas of endemism for lowland rainforest birds in Central and South America. A full description of the geographical limits of eacharea is available in the Supplementary Information.
LETTER RESEARCH
Macmillan Publishers Limited. All rights reserved©2014

Extended Data Figure 2 | hABC output showing estimates of meanand dispersion indices of population divergence times and times ofco-divergence pulses inferred from mitochondrial DNA. The left panelsillustrate the approximate joint posterior estimates of s2/ �t, the dispersion indexof t and �t, the mean of t across n population pairs, where ti is the divergencetime of the ith of n population-pairs and �t is scaled in coalescent time units of4 �N generations where �N is the mean effective population size averaged across
population-pairs. The right panels depict the posterior distributions of therelative times of the co-divergence pulses across barriers, scaled by coalescentunits. The shading intensity of each distribution is conditional on the posteriorprobability of y, the associated number of different pulses of co-divergenceacross each barrier. Sample sizes for each barrier: Andes, n 5 29; Isthmus ofPanama, n 5 14; Amazon River, n 5 14; Negro River, n 5 17; Madeira River,n 5 14.
RESEARCH LETTER
Macmillan Publishers Limited. All rights reserved©2014

Extended Data Figure 3 | hABC output showing estimates of mean anddispersion indices of population divergence times across the Andes inferredfrom ultraconserved elements (UCEs). Left panel illustrates the approximatejoint posterior estimates of s2/ �t, the dispersion index of t and �t, the mean of tacross n population-pairs, where ti is the divergence time of the ith of n
population-pairs and �t is scaled in coalescent time units of 4 �N generationswhere �N is the mean effective population size averaged across population-pairs.The right panel depicts the posterior distribution of the relative times of the co-divergence pulses across the Andes (n 5 5) scaled by coalescent units.
LETTER RESEARCH
Macmillan Publishers Limited. All rights reserved©2014

Extended Data Figure 4 | Bar plot showing the number of estimated speciesusing a Bayesian general mixed Yule-coalescent (bGMYC) model fromcomplete and randomly pruned data sets. The coloured columns for each
lineage correspond to the percentage (0–60%) of individuals randomly prunedfrom each data set.
RESEARCH LETTER
Macmillan Publishers Limited. All rights reserved©2014