the drivers of public expenditure on … drivers of public expenditure on health and long-term care:...
TRANSCRIPT

115
© OECD 2006
OECD Economic Studies No. 43, 2006/2
THE DRIVERS OF PUBLIC EXPENDITURE ON HEALTH AND LONG-TERM CARE: AN INTEGRATED APPROACH
Joaquim Oliveira Martins and Christine de la Maisonneuve
TABLE OF CONTENTS
Introduction ................................................................................................................................. 116Expenditure trends over the period 1970-2005 ...................................................................... 117Health care................................................................................................................................... 118
Demographic drivers of expenditure ................................................................................... 118Non-demographic drivers of expenditure ........................................................................... 121Projection model for health care........................................................................................... 122Alternative scenarios for OECD countries............................................................................ 123Sensitivity analysis.................................................................................................................. 128
Long-term care ............................................................................................................................ 130Demographic drivers of expenditure ................................................................................... 131Non-demographic drivers of expenditure ........................................................................... 133Projection model for long-term care..................................................................................... 134Alternative scenarios for OECD countries............................................................................ 135Sensitivity analysis.................................................................................................................. 138
An overview of cross-country results ........................................................................................ 140Conclusions.................................................................................................................................. 141Annex: Data sources and methods............................................................................................. 146
Bibliography ................................................................................................................................ 151
The authors both work in the OECD Economics Department. Contact: Joaquim Oliveira Martins([email protected]). Simen Bjørnerud from the Norwegian Ministry of Finance provideduseful inputs at an earlier stage of this project during a secondment at the OECD EconomicsDepartment. We received useful comments from Jean-Philippe Cotis, Jørgen Elmeskov,Michael P. Feiner, Vincent Koen, Gaetan Lafortune, François Lequiller, Giuseppe Nicoletti, Peter Schererand Hannes Suppanz as well as other OECD colleagues. The work also benefited from discussions inthe context of the Ageing Working Group of the European Commission, in particular Henri Bogaert,Declan Costello, Michel Englert and Bartosz Przywara. We also would like to thank Irene Sinha for herexcellent technical assistance. The views expressed are those of the authors and do not reflect thoseof the OECD or its member countries.

116
© OECD 2006
INTRODUCTION
Public expenditures on health and long-term care (hereafter, LTC) are a matterof concern for governments in most OECD countries. These expenditures haverecently accelerated and are putting pressure on public budgets, adding to that aris-ing from insufficiently reformed retirement schemes and other forms of social spend-ing. The growth of public spending on health and long-term care in OECD countrieshas been limited for some time via the implementation of cost-containment policies.These policies acted essentially through wage moderation, price controls andpostponement of investment in the case of health care. A large share of long-termcare has been informally provided by families. However, the scope for containinghealth and LTC expenditures along these lines is narrowing.
In trying to foresee how much health care spending could increase in thefuture and what policy can do about it, the different drivers of expenditure can bebroadly classified into demographic and non-demographic factors. Demographic factorswill put upward pressure on health and long-term care costs since they tend torise with age. Accordingly, previous projections of future health expenditures weremainly based on a given relation between health care spending and age (seeDang et al. 2001; EC-EPC, 2001; Health Canada, 2001). But this approach was essen-tially static, as it did not take into consideration a dynamic and positive linkbetween health status and longevity gains, reflecting a “healthy ageing” process.This will lower the average cost per individual in older age groups, all the more soas major health costs tend to come at the end of life. Healthy ageing should alsoreduce the share of dependents per older age group, thereby mitigating futurepressures on long-term care costs. On balance, however, ageing is expected topush health spending up.
Non-demographic factors will also push spending up. Empirical evidence onhealth care income elasticities is still inconclusive, though recent analysis(e.g. Dreger and Reimers, 2005) suggests that unit income elasticity for health carecould be a reasonable approximation. Against this background, health care costscan grow faster than income for two main reasons. First, technological progressincreases the variety and quality of products and treatments. Second, even whentechnological progress is cost-saving and reduces the relative price of healthproducts and services, overall expenditures may still rise because of the highprice elasticity of demand for health care. Because of lack of data, evidence con-cerning long-term care income elasticities is just not available, though these could

The Drivers of Public Expenditure on Health and Long-Term Care: an Integrated Approach
117
© OECD 2006
be low. Still, long-term care expenditures as a share of GDP are likely to increase,due to a “cost disease”. Limited scope for productivity gains, wage equalisationthroughout the economy and low price elasticity could drive LTC expenditures upin line with relative price increases.
Along these lines, this paper explores two alternative scenarios for futurepublic spending. In a “cost-pressure” scenario, non-demographic pressures onexpenditures are assumed to remain fully operative, resulting in spending trendsthat correspond to observed trends over the recent past. In a “cost-containment”scenario, policy action is assumed to curb non-demographic drivers of expendi-tures. The paper begins with a short overview of spending trends over the pastdecades. Then it turns to the projection method of health care expenditure,decomposing demographic and non-demographic drivers and discussing the mainmechanisms at work in each case. Alternative projection scenarios are presented,followed by a discussion of the sensitivity of the results to key assumptions. Thesame sequence of analysis applies to long-term care expenditures. The paperconcludes with a summary of the results and some policy conclusions.
EXPENDITURE TRENDS OVER THE PERIOD 1970-2005
As a share of GDP, public spending of health and long-term care grew bysome 50% between 1970 and the early 1980s (Figure 1). Governments started toreact to these trends in the course of the 1980s by putting in place a number ofcost-containment policies (see Docteur and Oxley, 2003). These policies actedmainly through macroeconomic mechanisms, such as wage moderation, price con-trols and postponement of investments. As a result, from mid-1980s to late 1990s,OECD public expenditure of health and long-term care remained roughly stable inper cent of GDP. Concomitantly, private health spending started to accelerate inthe early 1980s.
Public cost-containment policies could not be sustained forever. It is difficultto contain wages and, at the same time, attract young and skilled workers in thehealth care sector. The replacement of retiring staff in public sectors, such ashealth care, will create strong demand pressures in the context of diminishingcohorts of younger workers entering the labour markets (see Høj and Toly, 2005).Controlling prices is not easy when technical progress is permanently creating newproducts and treatments. Equipments also need to be renovated, especially inpresence of rapid technical progress. Thus, after a long period of cost contention,since 2000, the share of public health and long-term care expenditures to GDP isincreasing at a rate of over 3% per year for the OECD. In this context, an importantquestion is which factors will drive future expenditures, notably in relation to pro-jected demographic trends.

OECD Economic Studies No. 43, 2006/2
118
© OECD 2006
HEALTH CARE
Demographic drivers of expenditure
While the effect of ageing on public health expenditures per capita has beenweak in the past,1 it is commonly expected that it will increase in the future. Thisassessment is based on the combined effect of the projected increase in the shareof older people and the tendency for health expenditures per capita to increasewith age.2 The average expenditure profiles by age available for the year 1999(Figure 2) are relatively high for young children, decrease and remain stable formost of the prime-age period and then start to increase rapidly at older ages.3 Onthe basis of these expenditure profiles and population estimates, older people(age 65+) accounted for a significant share (around 35%) of public health careexpenditures by 2005.
Major health expenditures occur in the proximity to death.4 The shape of theaverage expenditure curves reflects the interaction between these “death-relatedcosts” and mortality rates. While mortality rates increase with age, the costs ofhealth care near death tend to be higher at young and prime age than for elderlypeople (April, 2004). This explains why expenditures first increase with age, thenpeak and after decline at very old ages. The little spike in health expenditures at
Figure 1. Evolution of public and private OECD total health spending1
As a % of GDP
1. Unweighted average of available OECD countries.2. OECD estimates.Source: OECD Health Database (2005).
Public expenditure Private expenditure (right scale)
3.0
3.5
4.0
4.5
5.0
5.5
6.0
6.5
7.0
1970 1975 1980 1985 1990 1995 2000 200521.5
1.7
1.9
2.1
2.3
2.5
2.7
2.9

The Drivers of Public Expenditure on Health and Long-Term Care: an Integrated Approach
119
© OECD 2006
the beginning of the curve is just related to early infant mortality being higherthan young and prime-age mortality.
For the purpose of projecting health expenditures it seems then convenientto disentangle the expenditures for survivors and non-survivors. The expendituresfor the non-survivors can be estimated by multiplying the health costs near to deathby the number of deaths per age group. Here, the proxy for the 'death-relatedcosts' is the health expenditure per capita for the group 95+ years old (assumingthat after 95 years, health expenditures are only related to death). This amountwas then multiplied by a factor, equal to 4 for an individual from 0 to 59 years old5
Figure 2. Public health care expenditure by age groups1
% of GDP per capita
1. Expenditure per capita in each age group for the year 1999 divided by GDP per capita.Source: ENPRI-AGRI, national authorities and authors’ calculations.
0
5
10
15
20
25
0-4 5-910
-1415
-1920
-2425
-2930-3
435-3
940-4
445-4
950-5
455-5
960-6
465-6
970
-7475
-7980-8
485-8
990-9
495+
Austria
France
Italy
Spain
Belgium
Germany
Luxembourg
Sweden
Denmark
Greece
Netherlands
UnitedKingdom
Finland
Ireland
Portugal
Australia
United States
OECD Economic Studies No. 43, 2006/2
120
© OECD 2006
and declining linearly to 1 afterwards, to reflect the decline of the death-relatedcosts with age. The survivors' cost curve can be derived from the differencebetween the total cost curve and the non-survivor curve (see Annex).
To be coherent, if health costs are mostly death-related, the projected increasein life expectancy must be accompanied by an equivalent gain in the numbers ofyears spent in good health. Otherwise, an increasing share of the population livingin bad health would emerge and health care expenditures would then cease to bemainly driven by the death-related costs, as initially assumed (q.e.d.).
In such a scenario, the expenditure curve for survivors is allowed to shift right-wards in line with longevity gains, progressively postponing the age-relatedincreases in expenditure.6 This development tends to reduce costs compared witha situation in which life expectancy would not increase. The baseline projectionspresented in this paper follow this "healthy ageing" scenario, but the sensitivity ofthe results to alternative assumptions (Box 1) is also tested below.
As regards non-survivors, two different effects are at play. On the one hand, thenumber of deaths is set to rise due to the transitory effect of the post-war babyboom.
Box 1. Longevity and health status scenarios
Different scenarios have been envisaged in the literature on the link betweenlongevity and health expectancy. In an “expansion of morbidity” scenario(Grunenberg, 1977), the share of life spent in bad health would increase as lifeexpectancy increases, while a “compression of morbidity" scenario (Fries, 1980)would mean the opposite. Manton (1982) put forward a "dynamic equilibrium”hypothesis where longevity gains are translated one-to-one into years in goodhealth (or "healthy ageing"). Under this scenario, health care expenditures wouldbe postponed over time in line with the increase in life expectancy. Michel andRobine (2004) proposed a general approach to explain why countries may shiftfrom an expansion to a contraction of morbidity regime, or achieve a balancedequilibrium between longevity gains and the reduction of morbidity. They identi-fied several factors at work: i) An increase in the survival rates of sick personswhich would explain the expansion in morbidity; ii) a control of the progression ofchronic diseases which would explain a subtle equilibrium between the fall inmortality and the increase in disability; iii) an improvement in the health statusand health behaviour of the new cohorts of old people which would explain thecompression of morbidity, and eventually; iv) the emergence of very old and frailpopulations which would explain a new expansion in morbidity. Depending on therelative size of each of these factors, countries could evolve from one morbidityregime to another.
The Drivers of Public Expenditure on Health and Long-Term Care: an Integrated Approach
121
© OECD 2006
On the other hand, if mortality falls over time, due to a permanent increase in lon-gevity, fewer will be at the very end of life in each given year, mitigating healthcare costs.7 The total effect on public health care expenditures will depend on therelative size of these effects.
Non-demographic drivers of expenditure
Income growth is certainly the main non-demographic driver of expenditures.However, the vast literature on this topic is still somewhat inconclusive on the pre-cise value for the income elasticity. First, income elasticity tends to increase withthe level of aggregation, implying that health care could be both “an individualnecessity and a national luxury” (Getzen, 2000). Second, the high income elastici-ties (above unity) often found in macro studies may result from the failure tocontrol for true price effects (Dreger and Reimers, 2005). In this context, a reason-able approach seems to assume unitary income elasticity and, subsequently, totest the sensitivity of the projections to this assumption.8
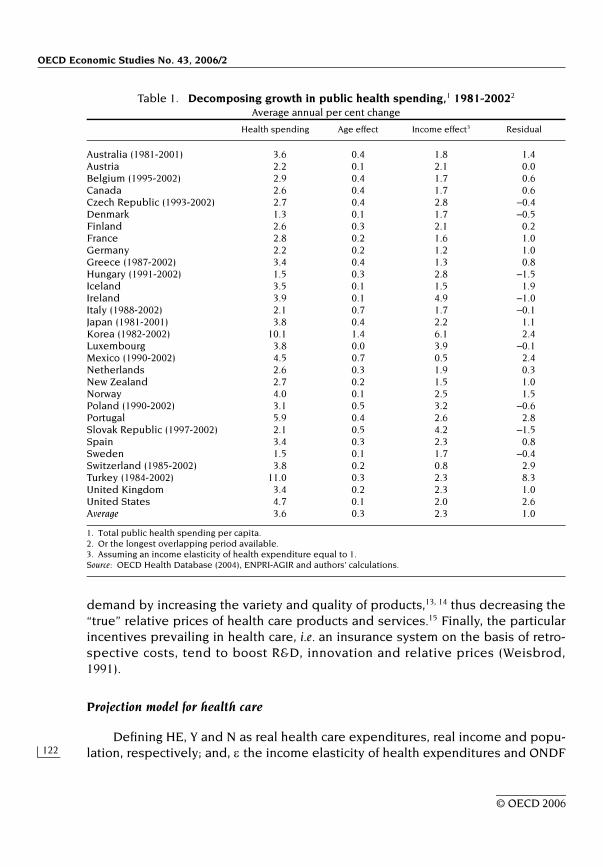
After controlling for demographic effects and conditional to the income elas-ticity, a residual expenditure growth can be derived. Between 1981 and 2002(Table 1), public health spending grew on average by 3.6% per year for OECDcountries,9 of which 0.3 percentage point was accounted by pure demographiceffects10 and 2.3 percentage points by income effects (with unitary income elastic-ity). Thus, the average residual growth can be estimated at around 1% per year.
The central expenditure projections assume this OECD average residualgrowth. There are at least two reasons for not using a country-specific residual inthe context of long-run projections. First, in countries where cost-containment pol-icies have resulted in a low or negative residual (e.g. Austria, Denmark, Ireland,Italy, Sweden) there could be a trend reversal, e.g. because new personnel has tobe attracted or run-down facilities renewed. Second, in countries where the resid-ual growth was very high (e.g. Portugal, Turkey, the United States) it may seemlikely that cost-containment policies will be implemented in the future. Theseeffects would lead to a certain cross-country convergence of the expenditureresidual over time.
What are the factors underlying the residual expenditure growth? The mainculprits are technology and relative prices.11 Indeed, the gains in health status dis-cussed above do not only arise from improvements in lifestyle (Sheehan, 2002;Cutler, 2001), but also from advances in medical treatment/technology. The latterdo not come free of economic cost. Technical progress can be cost-saving andreduce the relative price of health products and services, but its impact on expen-diture will depend on the price elasticity of the demand for health care. If it ishigh, a fall in prices will induce a more than proportionate rise in demand, increas-ing expenditures.12 Even if prices do not fall, new technologies may increase
OECD Economic Studies No. 43, 2006/2
122
© OECD 2006
demand by increasing the variety and quality of products,13, 14 thus decreasing the“true” relative prices of health care products and services.15 Finally, the particularincentives prevailing in health care, i.e. an insurance system on the basis of retro-spective costs, tend to boost R&D, innovation and relative prices (Weisbrod,1991).
Projection model for health care
Defining HE, Y and N as real health care expenditures, real income and popu-lation, respectively; and, ε the income elasticity of health expenditures and ONDF
Table 1. Decomposing growth in public health spending,1 1981-20022
Average annual per cent change
Health spending Age effect Income effect3 Residual
Australia (1981-2001) 3.6 0.4 1.8 1.4Austria 2.2 0.1 2.1 0.0Belgium (1995-2002) 2.9 0.4 1.7 0.6Canada 2.6 0.4 1.7 0.6Czech Republic (1993-2002) 2.7 0.4 2.8 –0.4Denmark 1.3 0.1 1.7 –0.5Finland 2.6 0.3 2.1 0.2France 2.8 0.2 1.6 1.0Germany 2.2 0.2 1.2 1.0Greece (1987-2002) 3.4 0.4 1.3 0.8Hungary (1991-2002) 1.5 0.3 2.8 –1.5Iceland 3.5 0.1 1.5 1.9Ireland 3.9 0.1 4.9 –1.0Italy (1988-2002) 2.1 0.7 1.7 –0.1Japan (1981-2001) 3.8 0.4 2.2 1.1Korea (1982-2002) 10.1 1.4 6.1 2.4Luxembourg 3.8 0.0 3.9 –0.1Mexico (1990-2002) 4.5 0.7 0.5 2.4Netherlands 2.6 0.3 1.9 0.3New Zealand 2.7 0.2 1.5 1.0Norway 4.0 0.1 2.5 1.5Poland (1990-2002) 3.1 0.5 3.2 –0.6Portugal 5.9 0.4 2.6 2.8Slovak Republic (1997-2002) 2.1 0.5 4.2 –1.5Spain 3.4 0.3 2.3 0.8Sweden 1.5 0.1 1.7 –0.4Switzerland (1985-2002) 3.8 0.2 0.8 2.9Turkey (1984-2002) 11.0 0.3 2.3 8.3United Kingdom 3.4 0.2 2.3 1.0United States 4.7 0.1 2.0 2.6Average 3.6 0.3 2.3 1.0
1. Total public health spending per capita.2. Or the longest overlapping period available.3. Assuming an income elasticity of health expenditure equal to 1.Source: OECD Health Database (2004), ENPRI-AGIR and authors' calculations.

The Drivers of Public Expenditure on Health and Long-Term Care: an Integrated Approach
123
© OECD 2006
the other non-demographic factors, the growth of health expenditures can bedecomposed as follows:
or expressed in share of expenditure to GDP:
Intuitively, the mechanical effect of population ageing on expenditures can beseen as moving up along the expenditure curve, assuming that the age profile ofexpenditures remains constant over time. This demographic effect is adjusted forthe “healthy ageing” by shifting the expenditure curve rightwards, implying thatolder people still cost more than the young, but at progressively older ages.Finally, the cost curve shifts upwards due to non-demographic drivers (incomeand other non-demographic effects).
In order to make the projections less sensitive to the starting year and allowfor some convergence of expenditures to GDP across countries,16 the total loga-rithmic growth rates derived from equation [2] for each country are applied to theOECD average expenditure share to GDP in 2005 (a sort of “representative” OECDcountry). The changes in expenditure shares calculated from this common baseare then added to the country-specific shares in 2005 to obtain the projectedratios of expenditure to GDP (see Annex).
Additional exogenous assumptions underlying the projections for both healthand long term care are listed in Box 2 (more details are also provided in theAnnex).
Alternative scenarios for OECD countries
The framework described above was used to project expenditures over theperiod 2005-50. In the main scenarios, the income elasticity is set to one, thusincome effects are not creating additional pressures in terms of expenditureshares to GDP.
Demographic effects
As shown in Panel A of Figure 3, demographic effects can be decomposed intothe health care spending for survivors, the adjustment for “healthy ageing” andthe death-related costs. Pure ageing effects can be quite large for some countries,but they tend to be compensated by a better health status, as longevity increases.The death-related costs account only for a small fraction of the increase in expen-ditures as a share of GDP (to around 7% of total health care spending by 2050). The
( )ONDFNYfactorageAdjusted
NHE loglog)log(log Δ+⎟
⎠⎞
⎜⎝⎛Δ⋅+Δ=⎟
⎠⎞
⎜⎝⎛Δ ε [1]
( )ONDFNYfactorageAdjusted
YHE loglog)1()log(log Δ+⎟
⎠⎞
⎜⎝⎛Δ⋅−+Δ=⎟
⎠⎞
⎜⎝⎛Δ ε [2]

OECD Economic Studies No. 43, 2006/2
124
© OECD 2006
net effect of demographics on health care expenditures ranges from virtually zeroin Sweden to 1.6 percentage points of GDP for Korea. This can be mapped to dif-ferences in evolving old-age dependency ratios (Panel B of Figure 3).
On average, demographic effects account for a small increase in expenditure,from 5.7% in 2005 to 6.3% by 2050, or 0.6 percentage points of GDP (Table 2).Admittedly, the “healthy ageing” assumption can be viewed as relatively optimis-tic, albeit in line with observed patterns of morbidity regimes in many OECDcountries. The sensitivity of the results to this assumption was tested (see below.)
A cost pressure scenario
In this scenario it is assumed that, on top of the demographic effects and uni-tary income effects, the expenditure residual continues to grow at 1% per yearover the projection period. This induces a substantial increase in the healthexpenditures, averaging nearly 4 percentage points of GDP from 2005 to 2050. In
Box 2. Exogenous variables and assumptions underlyingthe projections
The projections require a set of exogenous data, as follows:
1) Population projections (N). The population projections were gathered bythe OECD Directorate on Employment, Labour and Social Affairs, directly fromnational sources. Given that the underlying assumptions on fertility and lifeexpectancy are not necessarily uniform across countries (see Oliveira Martins et al.,2005 for a discussion), this paper also uses a population maquette (Gonand, 2005)to test the sensitivity of the results to uniform longevity assumptions for aselected group of countries.
2) Labour force participation projections (L/N) rely on previous OECD work(Burniaux et al., 2003). These projections are constructed on the basis of a, so-called,cohort approach. They correspond to a baseline scenario, i.e. the impact of currentpolicies is assumed to influence labour participation over the next decades, but noadditional assumptions are made concerning future policy changes.
3) Labour productivity (Y/L) growth is assumed to converge linearly from theinitial rate (1995-2003) to 1.75% per year by 2030 in all countries, except formertransition countries and Mexico where it converges only by 2050.
Summary statistics on the exogenous assumptions are provided inOECD (2006). The projected GDP per capita is directly derived from the aboveexogenous variables (Y/N = Y/L × L/N). This simple framework is not supposed tocapture in the best way productivity differentials across countries, but to isolate,as far as possible, the effect of ageing and other demographic factors on theprojections.

The Drivers of Public Expenditure on Health and Long-Term Care: an Integrated Approach
125
© OECD 2006
Figure 3. Demographic effects on health care expenditure
1. Ratio of population aged 65 and over to population aged 15-64.Source: Authors’ calculations.
Adjustment for healthy ageing
Death related costs
Pure age effect (survivors)
Total
A. Public health care expenditureIncrease in % points of GDP 2005-2050
B. Increase in the old-age dependency ratio between 2005 and 20501
(In percentage points of working age population)
-2.0
-1.5
-1.0
-0.5
0.0
0.5
1.0
1.5
2.0
2.5
3.0
3.5
Korea
Slovak
Rep
ublic
Mexico
Japa
n
Portug
al
Austra
lia
New Ze
aland
Czech
Rep
ublic
Poland
Spain
Turke
y
Canad
a
Irelan
d
Icelan
d
Greece
Netherl
ands
Austri
aIta
ly
Luxe
mbourg
Finlan
d
German
y
Hunga
ry
United
Kingdo
m
Denmark
Franc
e
Switzerl
and
Norway
United
States
Belgium
Sweden
0
10
20
30
40
50
60
Korea
Slovak
Rep
ublic
Poland Ita
lyJa
pan
Portug
al
Czech
Rep
ublic
Hunga
rySpa
in
Austra
lia
Finlan
d
Austri
a
Franc
e
Greece
New Ze
aland
Irelan
d
Canad
a
Mexico
German
y
Belgium
United
Kingdo
m
Luxe
mbourg
Turke
y
Norway
Icelan
d
Denmark
Netherl
ands
United
States
Switzerl
and
Sweden

OE
CD
Eco
no
micS
tud
ies N
o. 4
3, 2
00
6/2
126
© O
EC
D 2006
Table 2. Projection scenarios for public health care expenditure, 2005-20501
In % of GDP
20052
Demographic effect
Cost-pressure
Cost-containment
Sensitivity analysis
Country-specific
residuals
Income elasticity
= 0.8
Income elasticity
= 1.2
Residuals at 1.5%
Compression of morbidity
Expansion of morbidity
2050
Australia 5.6 6.5 9.7 7.9 8.5 7.1 8.9 8.7 7.1 8.7Austria 3.8 4.4 7.6 5.7 4.4 5.0 6.6 6.6 5.0 6.7Belgium 5.7 5.8 9.0 7.2 6.7 6.4 8.1 8.0 6.4 8.2Canada 6.2 7.0 10.2 8.4 7.8 7.6 9.3 9.2 7.9 9.1Czech Republic 7.0 8.0 11.2 9.4 7.5 8.9 9.9 10.2 8.5 10.3
Denmark 5.3 5.6 8.8 7.0 5.1 6.2 7.9 7.8 6.4 7.6Finland 3.4 3.8 7.0 5.2 4.1 4.3 6.3 6.0 4.4 6.1France 7.0 7.3 10.6 8.7 8.7 8.1 9.5 9.6 7.8 9.8Germany 7.8 8.2 11.4 9.6 9.6 8.9 10.3 10.4 9.0 10.4Greece 4.9 5.5 8.7 6.9 6.6 6.1 7.9 7.7 6.4 7.5
Hungary 6.7 7.1 10.3 8.5 5.4 7.5 9.6 9.3 7.6 9.6Iceland 6.8 7.5 10.7 8.9 10.5 7.9 10.1 9.7 8.5 9.3Ireland 5.9 6.8 10.0 8.2 5.6 6.9 9.8 9.0 7.7 8.8Italy 6.0 6.5 9.7 7.9 6.4 7.3 8.6 8.7 6.8 9.2Japan 6.0 7.1 10.3 8.5 8.7 7.9 9.1 9.3 7.9 9.0
Korea 3.0 4.6 7.8 6.0 8.6 5.3 6.9 6.8 4.8 7.3Luxembourg 6.1 6.6 9.9 8.0 6.6 6.9 9.4 8.9 7.5 8.6Mexico 3.0 4.3 7.5 5.7 8.3 4.4 7.3 6.5 4.9 6.5Netherlands 5.1 5.7 8.9 7.0 6.1 6.3 8.0 7.9 6.8 7.4New Zealand 6.0 6.9 10.1 8.3 8.4 7.6 9.1 9.1 7.7 9.1
Norway 7.3 7.5 10.7 8.9 9.6 8.1 9.8 9.7 8.1 9.7Poland 4.4 5.3 8.5 6.7 4.6 5.5 8.2 7.5 5.5 8.2Portugal 6.7 7.7 10.9 9.1 12.6 8.3 10.1 9.9 8.4 9.9Slovak Republic 5.1 6.5 9.7 7.9 4.9 7.2 8.6 8.7 6.8 9.0Spain 5.5 6.4 9.6 7.8 7.5 7.1 8.5 8.6 7.2 8.3

Th
e D
rivers o
f Pu
blic E
xpe
nd
iture
on
He
alth
an
d L
on
g-T
erm
Ca
re: a
n In
teg
rate
d A
pp
roa
ch
127
© O
EC
D 2006
Sweden 5.3 5.3 8.5 6.7 4.9 5.9 7.7 7.5 6.3 7.3Switzerland 6.2 6.4 9.6 7.8 11.4 7.1 8.6 8.6 7.4 8.4Turkey 5.9 6.7 9.9 8.1 n.a 7.3 9.1 8.9 7.3 9.2United Kingdom 6.1 6.5 9.7 7.9 7.9 7.1 8.8 8.7 7.1 8.7United States 6.3 6.5 9.7 7.9 10.8 7.1 8.9 8.7 7.3 8.6
Average 5.7 6.3 9.6 7.7 7.5 6.9 8.7 8.5 7.0 8.5
1. For the definition of the different scenarios see Table A1.2. Estimates, taking into account the observed expenditure growth between 2000 and 2003 (or 2002 if not available).Source: Authors' calculations.
Table 2. Projection scenarios for public health care expenditure, 2005-20501 (cont.)In % of GDP
20052
Demographic effect
Cost-pressure
Cost-containment
Sensitivity analysis
Country-specific
residuals
Income elasticity
= 0.8
Income elasticity
= 1.2
Residuals at 1.5%
Compression of morbidity
Expansion of morbidity
2050

OECD Economic Studies No. 43, 2006/2
128
© OECD 2006
most countries, health care expenditures would then approach or exceed 10% ofGDP by the end of the projection period. While these figures are a useful bench-mark, it is unlikely that public health care expenditures to GDP could continue togrow at such constant rate, without limit.
A cost-containment scenario
In a voluntarily optimistic “cost-containment” scenario, the residual expendi-ture growth is assumed to converge to zero by 2050,17 implicitly meaning thatsome policies in place are effective in controlling expenditure growth driven bysome of the non-demographic factors. These policies could progressively rein inthe expenditure residual, for example by ensuring that future technology improve-ments are mainly used in a cost-saving way. In the absence of additional ageingeffects, this would imply that public health care expenditure and income wouldevolve in parallel over the very long-run.18 It should be stressed, nevertheless,that a continuous cost-containment over such a long period would be ratherchallenging.
Under this scenario, public health care expenditures in the OECD area wouldstill increase on average by two percentage points between 2005 and 2050, from5.7% to 7.7% of GDP (cf. Table 2). Moreover, large increases (above 2.5 percentagepoints of GDP) by 2050 are found (in descending order) in Korea, the SlovakRepublic, Mexico and Japan, which are experiencing a rapid demographic change.
Sensitivity analysis
To assess the robustness of the results, a number of parameters werechanged compared with the “cost-containment scenario”. These include theincome elasticity, the magnitude of the residual, health status scenarios anddemographic projections. Overall, these sensitivity tests do not change dramati-cally the overall picture, although country by country large differences mayemerge. Moreover, combinations of a change in assumptions that influence theresults in the same direction could alter significantly the results.
Residuals, income elasticity and different health status
Applying country-specific expenditure residuals19 significantly change thespending projections for individual OECD countries (cf. right columns Table 2).Korea, Mexico, Portugal, Switzerland and the United States record increases above2 percentage points of GDP compared with the “cost-containment” scenario.20 Ifanything, this illustrates how unsustainable are current health expenditure trendsin some OECD countries. Conversely, in countries where cost-containment poli-cies were successful, the projected expenditure shares would tend to be moremoderate than in the cost-containment scenario (e.g. Denmark, Sweden). Other

The Drivers of Public Expenditure on Health and Long-Term Care: an Integrated Approach
129
© OECD 2006
countries would display large decreases in expenditures because the effect ofpast residual growth resulting from idiosyncratic conditions, such as the scalingback of former welfare systems during economic transition (the Czech Republic,Hungary, Poland and the Slovak Republic), would be prolonged in the future.
Concerning income elasticities, projections were run with values below andabove unity (0.8 and 1.2, respectively), while keeping the residual as in the cost-containment scenario.21 Under these alternative scenarios, average OECD publichealth care expenditure shares would range from around 7% to 8.7% of GDP. Thecountries with the largest projected GDP per capita growth (e.g. Ireland, Mexico,Poland) are obviously the most affected by changes in income elasticity.
As discussed above, the residual was derived from trends observed over thetwo past decades, a period characterised by efforts to contain costs. Assuming aresidual at 1.5% growth per year, in line with 1970-2002 average (but still decliningto zero over the projection period) would induce an average increase of less than1 percentage point of GDP compared with the cost-containment scenario.
Sensitivity to alternative health status was also explored. In a “compression ofmorbidity” scenario the shift in the cost curves is twice the adjustment applied inthe “healthy ageing” regime. Alternatively, a regime of “expansion of morbidity”corresponds to a scenario where longevity gains are not translated into “healthyageing”. Under these scenarios, average health expenditures by 2050 range from7 to 8.5% of GDP. This shows that alternative morbidity regimes matter for project-ing future expenditure trends, but their impact appear to be smaller than non-demographic effects.
Alternative population projections
As noted in Box 2, national population projections are not based on harmon-ised assumptions across countries. In particular, projected longevity gains can differwidely and, on average, are also lower than observed in the past decades.
To test the effect of alternative demographic assumptions, longevity wasassumed to increase in line with past trends (two years per decade).22 The simula-tions were carried out for five large OECD countries (France, Germany, Italy, Japanand the United States). As it could be expected in a world of “healthy ageing”, theimplied deviations are small (taking the cost-containment scenario as a bench-mark, see Table 3). But without this assumption, the results would be more sensi-tive to idiosyncrasies in national population projections. If an “expansion ofmorbidity” assumption is combined with higher longevity gains, the two effectsreinforce each other and generate an increase in expenditures (around1 percentage point, compared with the cost-containment scenario). This highlightsthe importance of the interaction effects.

OECD Economic Studies No. 43, 2006/2
130
© OECD 2006
LONG-TERM CARE
After analysing health care expenditures, a parallel projection method is usedfor long-term care (LTC). While health care services aim at changing a health condi-tion (from unwell to well), long-term care merely aims at making the current condi-tion (unwell) more bearable. Individuals may become dependent and need LTCdue to disability, chronic condition, trauma, or illness, which limit their ability tocarry out basic self care or personal tasks that must be performed every day. Suchactivities are defined as activities of daily living, ADLs (eating, dressing, bathing,getting in and out of bed, and incontinence) or instrumental activities of dailyliving, IADLs (preparing own meals, cleaning, laundry, taking medication, gettingto places beyond walking distance, shopping, managing money affairs and usingthe telephone/Internet).
Compared with health care, the importance of current public LTC spending isstill limited (only 1-2% of GDP). However, as LTC is heavily concentrated amongthe elderly (Wittenberg et al., 2002), given projected demographic changes, itsshare in the economy is set to increase. LTC expenditure profiles by age groupsare the foundation of the projection framework. In contrast with health care, theseexpenditure curves are basically close to zero up to age 60-65, and then increasesharply and monotonically, with different slopes across countries (Figure 4). Thesecharacteristics stem from different features, such as the mix between (expensive)formal and (inexpensive) informal care and the current prevalence of dependency(disability status).22 On the basis of the LTC expenditure profiles and populationestimates, older people (aged 65+) accounted for 82% of public LTC expendituresby 2005.
Table 3. Sensitivity analysis of health care expenditure to population projectionsAssuming longevity gains of 2 years per decade (In % of GDP)
Healthy ageingExpansion
of morbidity
Memo item: Cost-containment
scenario
20051 2050
France 7.0 8.8 9.8 8.7Germany 7.8 9.6 10.7 9.6Italy 6.0 8.1 9.2 7.9Japan 6.0 8.4 9.5 8.5United States 6.3 7.7 8.6 7.9
Average 6.6 8.5 9.6 8.5
1. Estimates, taking into account the observed expenditure growth between 2000 and 2003 (or 2002 if not available).Source: Authors' calculations.

The Drivers of Public Expenditure on Health and Long-Term Care: an Integrated Approach
131
© OECD 2006
Demographic drivers of expenditure
Whereas health care projections distinguished between survivors andnon-survivors, the LTC projections split each age group into dependants and non-dependants.24 Deriving the cost of LTC per dependant requires an estimate of the prev-alence of dependency by age group. One of the most comprehensive studies inthis area by Comas-Herrera et al. (2003) provides dependency figures only forGermany, Italy, Spain and the United Kingdom (Figure 5). As an approximation, itwas assumed here that dependency ratios are uniform across countries and areequal to average of the four countries above (this has the advantage of making theprojections less sensitive to initial conditions). By dividing the original expendi-ture profile by the average cross-country dependency ratio, the LTC expendituresper dependant person can be derived.
Figure 4. Public long-term care expenditure by age group1
1. Expenditure per capita in each age group divided by GDP per capita, 1999.Source: ENPRI-AGIR and authors’ calculations.
% of GDP per capita
0
10
20
30
40
50
60
70
80
0-4 5-910
-1415
-1920
-2425
-2930-3
435-3
940-4
445-4
950-5
455-5
960-6
465-6
970
-7475
-7980-8
485-8
990-9
495+
FinlandItaly
Austria
France
Netherlands
Belgium
Germany
Sweden
Denmark
Ireland
United Kingdom

OECD Economic Studies No. 43, 2006/2
132
© OECD 2006
Concerning disability regimes, there is a great deal of uncertainty (see Box 3).Internationally comparable data in this area are rather scarce (Lagergren and Batljan,2000; Jacobzone et al. 2000; Wittenberg et al. 2001). Moreover, disability is notnecessarily translated into dependency, as technical progress can help a disabled
Figure 5. Prevalence of dependency by age group1
1. Dependency is defined as the inability to accomplish one or several Activities of Daily Living (see text).Source: Comas-Herrera et al. (2003) and authors’ calculations.
Box 3. Has disability fallen over time?
Consistent cross-country data on disability rates do not exist. Disability isusually measured through the inability of performing one or more Activities ofDaily Living (ADL). Evidence for some OECD countries suggests that the share ofthe severely disabled has fallen over time, while no conclusion could be reachedconcerning the evolution of moderate disability. Studies on the United States, forwhich more data are available, show that disability rates may have declined some-what among the oldest but have increased among younger age groups, a phenom-enon that is often linked to obesity trends (cf. Rand Research Bulletin, 2004).
Nonetheless, downward trends in disability may not be accompanied by alower pressure on expenditures. On the contrary, increased spending on healthcare is rather the precondition for lower disability (Lichtenberg and Virabhak,2002; Lichtenberg, 2003; Jacobzone, 2003) and helping a chronically-ill person tobe autonomous may require access to the high-cost bio-technologies and drugs.
0
0.1
0.2
0.3
0.4
0.5
0.6
0.7
0.8
0-4 5-910
-1415
-1920
-2425
-2930-3
435-3
940-4
445-4
950-5
455-5
960-6
465-6
970
-7475
-7980-8
485-8
990-9
495+
Germany Italy Spain United Kingdom

The Drivers of Public Expenditure on Health and Long-Term Care: an Integrated Approach
133
© OECD 2006
person to work and take part in everyday life. Given the lack of hard evidence onthese phenomena, this paper adopts a conservative view by assuming that onlyhalf of the longevity gains are translated into a reduction in dependency. This lim-ited “healthy ageing” scenario for LTC could be justified on the grounds that forthe oldest old, where dependency is most prevalent, the potential for experiencingcomplete healthy longevity gains is decreasing.
Non-demographic drivers of expenditure
LTC expenditures are closely related to the shares of formal and informal25 careand how they will evolve over time.26 Currently, the bulk of LTC is providedinformally (at explicit no-cost) throughout the OECD, and it is especially domi-nant in southern European countries. As labour force participation is projectedto increase in the future, it is likely that less resources for informal care will beavailable and will have to be replaced by expensive formal care (OECD, 2005b;Comas-Herrera et al. 2005).27
Another major driver is labour costs of staff providing LTC. Data for the UnitedKingdom show that staff costs in public sector homes accounted for 85% of totalunit costs (Netten et al., 1998). Reinhold (2001) also found that staff costsaccounted for 70% to 90% of total unit costs of nursing homes in Germany.
While LTC is highly labour-intensive, room for productivity gains is probablylimited. This makes the ingredients for a potential “cost disease” (Baumol, 1967,1993). Reflecting a negative productivity differential and equalisation of wagesacross sectors, it implies that relative prices of LTC vis-à-vis other goods and ser-vices in the economy will tend to rise. With a low price-elasticity of demand, theshare of LTC expenditure in GDP will also increase over time. To capture thisBaumol effect it is assumed here that unit costs rise in line with aggregate labourproductivity, a proxy for wage growth of care staff (see Comas-Herrera et al., 2003).
Turning to income effects, empirical evidence on the income elasticity of LTCexpenditure is just not available. But, considering that LTC can be characterised asa necessity, the income elasticity is probably close to zero. This is another crudeassumption because the future development of long-term care services couldinduce more demand for higher quality services; therefore, an alternative value forthe income elasticity will be tested below.
To assess the impact of these drivers on observed differences of LTC expen-ditures per dependant across countries, the following simple econometric modelwas specified:28
uWZAgeNDLTCLog +⋅+⋅+⋅+=⎟
⎠⎞
⎜⎝⎛
321 βββα [3]

OECD Economic Studies No. 43, 2006/2
134
© OECD 2006
where LTC is total long-term care expenditure, ND, the number of dependants, Ageis the central point in each age bracket (2, 7, 12,…, 97), Z a proxy capturing the provi-sion of informal care and W a proxy for the other effects (relative prices and/orincome). This equation was estimated in a panel of eleven EU countries by twentyage groups (Table 4). Following alternative specification tests (not reported here),the availability of informal care appeared to be best captured by the participationratio of the population aged 50-64. The level of GDP per capita was included but itdid not appear significant, suggesting that the income elasticity could indeed besmall. Given the reduced size of the sample and co-linearity problems, it was notpossible to test for relative price (or wage inflation) effects. The estimates of theage and old-age participation coefficients are robust across different specifica-tions and display the expected sign.
Projection model for long-term care
Combining the different drivers, the logarithmic growth of long-term careexpenditures to GDP can be decomposed as follows:
where Y and N are income and population, as defined previously; ϕ is the incomeelasticity of LTC expenditures and γ the elasticity characterising the “Baumol
Table 4. Econometric estimates of long-term care costs per dependant
Log of long-term care cost per dependant
Fixed effects Robust OLS with age-invariant explanatory variables
Age 0.0335*** 0.0348*** 0.0345***(0.0014) (0.0025) (0.0023)
Participation ratio of people 0.0394*** 0.0378***aged 50-64 (0.0054) (0.0066)GDP per capita 0.0748
(0.0509)Constant 6.433*** 4.217*** 2.356*
(0.079) (0.380) (1.317)
Number of countries 11 11 11Number of age groups 20 20 20Number of observations 185 185 185
R-squared 0.77 0.62 0.62(within)
Notes: *** significant at 1% and * significant at 10%. Standard errors in parentheses.Source: Authors’ estimates.
( ) ( )areinformal cofShareeffectBaumolNYfactorageAdjusted
YLTC
loglog
log)1()log(log
Δ⋅+Δ⋅
+⎟⎠⎞
⎜⎝⎛Δ⋅−+Δ=⎟
⎠⎞
⎜⎝⎛Δ
ωγ
ϕ [4]

The Drivers of Public Expenditure on Health and Long-Term Care: an Integrated Approach
135
© OECD 2006
effect”, i.e. the extent to which an increase of average labour productivity in theeconomy (a proxy for wage growth) is translated into an increase of LTC costs perdependant.
Using this framework, the drivers are allowed to operate in several ways (seeAnnex for further details). The demographic effect is adjusted in such a way thathalf of the projected longevity gains are translated into years with lower depen-dency, shifting dependency curve rightwards.29
On non-demographic factors, the expenditure curve per dependant shiftsupwards due to the “cost-disease” effect. In most scenarios, the “Baumol elastic-ity” (γ) was assumed to be 0.5, probably a mild view on the extent to which theproductivity of LTC services could under-perform relatively to the rest of the econ-omy. The income elasticity was assumed in general to be zero, implying thatincome growth tends to drive down LTC expenditures as a share of GDP.
The second non-demographic effect aims at capturing the effect of a decreas-ing share of informal care in the total supply of LTC through the labour market par-ticipation rate of people aged 50-64. Using estimated equation [3], increasinglabour market participation induces an upward shift in the LTC cost curve. Thebaseline projections on participation rates are derived from Burniaux et al. (2003).The latter rely on a cohort approach, but the last cohort used to project participa-tion is the one entering the labour market in year 2000. The behaviour of subse-quent cohorts remains unchanged thereafter. This simplification could lead to adownward bias in the projections, especially in countries where participation rateswere well below the OECD average in 2000. Therefore, sensitivity analysis belowwill test for a more sanguine scenario on participation rates.
Alternative scenarios for OECD countries
Similar to the approach followed for the health care projections, LTC expendi-tures were projected under a range of scenarios over the period 2005-50.
Demographic effects
Because the prevalence of dependency increases sharply with age, demo-graphic effects contribute to a relatively much larger increase in LTC expendituresthan the one observed for health care. On average, LTC expenditures would reach2.3% of GDP by 2050 or an increase of 1.2 percentage points of GDP comparedwith 2005 (Table 5). Very large increases (from around 2 to close to 4 percentagepoints of GDP) are found in fast-ageing countries, such as Korea, the SlovakRepublic, Poland and Mexico.

OE
CD
Eco
no
micS
tud
ies N
o. 4
3, 2
00
6/2
136
© O
EC
D 2006
Table 5. Projection scenarios for public long-term care expenditure, 2005-20501
In % of GDP
20052
Demographic effect
Cost-pressureCost-
containment
Sensitivity analysis
Unitary income elasticity
Compression of disability
Expansion of disability
Increase in dependency
Increased participation
2050
Australia 0.9 2.2 2.9 2.0 2.6 1.5 2.4 3.1 3.2Austria 1.3 2.5 3.3 2.5 3.0 2.0 2.9 3.6 5.4Belgium 1.5 2.4 3.4 2.6 3.2 2.2 3.1 3.7 5.9Canada 1.2 2.3 3.2 2.4 3.0 1.9 2.9 3.6 2.9Czech Republic 0.4 2.0 2.0 1.3 1.7 0.9 1.8 2.4 3.2
Denmark 2.6 3.3 4.1 3.3 3.9 2.9 3.7 4.2 3.5Finland 2.9 4.3 5.2 4.2 4.8 3.7 4.6 5.4 4.9France 1.1 2.3 2.8 2.0 2.5 1.6 2.4 3.0 3.7Germany 1.0 1.9 2.9 2.2 2.7 1.7 2.7 3.4 3.2Greece 0.2 1.0 2.8 2.0 2.6 1.4 2.6 3.5 3.0
Hungary 0.3 1.5 2.4 1.0 1.6 0.6 1.3 1.8 5.4Iceland 2.9 3.5 4.4 3.4 4.1 3.1 3.8 4.3 3.5Ireland 0.7 1.7 4.6 3.2 3.9 2.5 3.9 4.9 3.7Italy 0.6 2.0 3.5 2.8 3.3 2.2 3.5 4.5 6.3Japan 0.9 2.3 3.1 2.4 2.8 1.9 2.9 3.7 2.3
Korea 0.3 4.1 4.1 3.1 3.7 2.3 3.9 5.1 5.1Luxembourg 0.7 1.6 3.8 2.6 3.3 2.0 3.1 4.0 4.9Mexico 0.1 2.0 4.2 3.0 3.8 2.2 3.9 5.1 3.7Netherlands 1.7 2.4 3.7 2.9 3.5 2.4 3.4 4.1 3.9New Zealand 0.5 2.0 2.4 1.7 2.2 1.2 2.1 2.8 2.1
Norway 2.6 3.3 4.3 3.5 4.1 3.1 3.9 4.5 3.6Poland 0.5 2.6 3.7 1.8 2.5 1.3 2.2 2.8 6.2Portugal 0.2 1.3 2.2 1.3 1.9 0.8 1.8 2.4 2.1Slovak Republic 0.3 2.6 2.6 1.5 2.0 1.1 2.0 2.6 6.6Spain 0.2 1.0 2.6 1.9 2.3 1.3 2.4 3.3 3.0

Th
e D
rivers o
f Pu
blic E
xpe
nd
iture
on
He
alth
an
d L
on
g-T
erm
Ca
re: a
n In
teg
rate
d A
pp
roa
ch
137
© O
EC
D 2006
Sweden 3.3 3.6 4.3 3.4 4.0 3.2 3.6 4.0 3.6Switzerland 1.2 1.7 2.6 1.9 2.4 1.5 2.3 2.8 1.9Turkey 0.1 1.8 1.8 0.8 1.4 0.5 1.2 1.7 6.8United Kingdom 1.1 2.1 3.0 2.1 2.7 1.7 2.6 3.2 2.6United States 0.9 1.8 2.7 1.8 2.4 1.4 2.2 2.8 1.9
Average 1.1 2.3 3.3 2.4 2.9 1.9 2.8 3.5 3.9
1. For the definition of the different scenarios see Table A2.
2. Estimates, taking into account the observed expenditure growth between 2000 and 2003 (or 2002 if not available).
Source: Authors’ calculations
Table 5. Projection scenarios for public long-term care expenditure, 2005-20501 (cont.)In % of GDP
20052
Demographic effect
Cost-pressureCost-
containment
Sensitivity analysis
Unitary income elasticity
Compression of disability
Expansion of disability
Increase in dependency
Increased participation
2050

OECD Economic Studies No. 43, 2006/2
138
© OECD 2006
A cost-pressure scenario
With a “full Baumol” effect, LTC costs per dependant increase in line withaverage labour productivity in the economy. This induces a steady increase in rel-ative prices, pushing LTC expenditures to 3.3% of GDP by 2050, or an increase of2.2 percentage points of GDP compared with 2005.
A cost-containment scenario
Policies could “contain” the cost pressures associated with the Baumol effect,although it is difficult to give a clear content for such policy lever. In practical termsit would mean that governments deploy a continuous effort to generate productiv-ity gains and/or contain upward pressures on wages of staff providing long-termcare. In the scenario simulated here, the supply of informal care remains relativelyabundant because mild baseline increases in the participation ratios are com-bined with an increase of the population in the group of 50-64 years old due to theageing trends. Even under these optimistic assumptions, the average LTC expen-ditures more than double from the current base to reach 2.4% of GDP by 2050. Thelarger effects are found in countries where the 50-64 participation ratios are pro-jected to increase significantly and demographic pressures are strong (Greece,Italy, Ireland and Spain).
Sensitivity analysis
Given the many uncertainties, sensitivity analysis is particularly important totest the robustness of LTC projections. A first simulation captures the possibility ofstronger income effects. With unit income elasticity, LTC expenditure to GDPby 2050 would increase by around ½ percentage point compared with the cost-containment scenario.
A scenario of “compression of disability” was tested, where the dependencycurve is shifted to the right twice as fast as in the cost-containment scenario. Thisreduces LTC expenditures by around ½ percentage point of GDP for the OECDgroup compared with “cost-containment” scenario. In an “expansion of disability”scenario, the dependency rates remain constant as life expectancy increases andthe effect would be symmetrically opposite.
Another alternative scenario captures a possible estimate of the impact of theworrying obesity trends on dependency.30 Indeed, between 1986 and 2000, theproportion of moderately obese individuals (those with a Body mass index of 30-35)merely doubled in the United States. In contrast, the proportion of individualswith a BMI of 40 or greater quadrupled. Sturm and Lakdawalla (2004) argue that ifcurrent trends in obesity continue, disability rates will increase by 1% a year morein the 50-59 age group than if there were no further weight gains. This effect was

The Drivers of Public Expenditure on Health and Long-Term Care: an Integrated Approach
139
© OECD 2006
captured here by an autonomous increase in the dependency rate by 0.5% peryear. On average LTC expenditures would reach 3.5% of GDP by 2050, a significantshift of above 1 percentage point of GDP compared with the cost-containmentcase.
In an “increased participation” scenario, the availability of informal care isdramatically reduced by assuming that all countries converge towards an old-ageparticipation ratio of at least 70% by 2050 (countries having already a participationratio above that level were supposed to follow their country-specific pattern). Thisis well above the baseline labour participation projections and would lead toaverage LTC costs roughly at 4% of GDP by 2050, or an additional expenditure of1.5 percentage points of GDP compared with the cost-containment scenario. Themost significant increases would occur in countries where old-age participationratios are currently particularly low (e.g. Austria, France, Italy, Turkey and formertransition countries).
The comparison between this scenario and the cost-containment one gives asense of the trade-offs involved with policies aiming at increasing participationrates, on the one hand, and the objective of containing future LTC expenditures,on the other hand. In this context, competing demands on the age group 50-64could be particularly strong.
The sensitivity to alternative population projections was also tested for fiveOECD countries (France, Germany, Italy, Japan and the United States). Under the“healthy ageing” assumption (i.e. the dependency curves are shifted by half of theincrease in life expectancy), higher longevity gains (two years per decade) per sedo not have a strong impact on expenditures (see Table 6). By contrast, a scenariowhere higher longevity gains are coupled with an ‘expansion of disability’ wouldpush average LTC expenditures to above 4% of GDP by 2050.
Table 6. Sensitivity analysis of long-term care expenditure to population projectionsAssuming longevity gains of 2 years per decade (In % of GDP)
Healthy ageingExpansion
of disability
Memo item: Cost-containment
scenario
20051 2050
France 1.1 2.2 3.1 2.0Germany 1.0 3.0 4.4 2.2Italy 0.6 3.5 5.3 2.8Japan 0.9 3.6 5.2 2.4United States 0.9 1.7 2.6 1.8
Average 0.9 2.8 4.1 2.3
1. Estimates, taking into account the observed expenditure growth between 2000 and 2003 (or 2002 if not available).Source: Authors' calculations.

OECD Economic Studies No. 43, 2006/2
140
© OECD 2006
To sum-up, the sensitivity analysis showed that the long-term care projec-tions presented here seem relatively robust to alternative specifications of theincome elasticity, health status and longevity assumptions. In contrast, increaseddependency associated with obesity trends or lower provision of informal care couldhave a much stronger impact on expenditures. A combination of these negativefactors would obviously generate a rather gloomy perspective for public budgets.
AN OVERVIEW OF CROSS-COUNTRY RESULTS
Combining health and long-term care projections, together with sensitivityanalysis generates striking differences across countries (Figure 6). A group of coun-tries stands out with increases of total spending at or above four percentage pointsof GDP over the period 2005-50, even in the optimistic ‘cost-containment’ scenario.It includes rapidly ageing countries (Italy, Japan and Spain), countries that will expe-rience a dramatic change in their population structure (Korea, Mexico and theSlovak Republic), and countries where labour participation is currently low and mayface a substantial increase in the demand for formal long-term care (Ireland, Italyand Spain). In contrast, Sweden is in the lowest range with an increase below two
Figure 6. Total increase in health and long-term care spending by country, 2005-20501
In percentage points of GDP
1. The vertical bars correspond to the range of the alternative scenarios, including sensitivity analysis. Countries areranked by the increase of expenditures between 2005 and 2050 in the cost-containment scenario. Turkey was notincluded because data limitations made it impossible to calculate one of the scenarios.
2. OECD average excluding Turkey.Source: Authors’ calculations.
Cost-pressure scenario Cost-containment scenario
-2
0
2
4
6
8
10
12
KORMEX IR
L ITA JPN
SVKES
PGRC
LUX
POLNZL PRT
CANAUS
CZE
OECD2
NLD FIN AUTDEU GBR ISL
FRA
BELNORUSA
HUNDNK
CHESWE
The Drivers of Public Expenditure on Health and Long-Term Care: an Integrated Approach
141
© OECD 2006
percentage points of GDP. This country is in a mature phase of its ageing processand already spends a relatively high share of GDP on health and long-term care.
CONCLUSIONS
This paper has shown that spending on health and long-term care is a first-order policy issue. Between now and 2050, public spending on health and long-term care could almost double as a share of GDP in the average OECD country inthe absence of policy action to break with past trends in this area. And that esti-mate takes into account that as people live longer, they also remain in good healthfor longer. Even with containment measures, public spending on health and long-term care could rise from the current average level of 6-7% of GDP to around 10%by 2050. In some countries, the increase could be dramatic.
Yet, these projections may be on the low side. For example, an expansion ofmorbidity – i.e. a scenario in which increases in longevity would translate into ahigher share of life in bad health, together with higher longevity gains, would pro-duce a more pessimistic outlook. Likewise, technology could exert greater pres-sures on health care demand than assumed in the projections, while dependencyrates could increase more than expected, reflecting inter alia a continuation ofrecent obesity trends and lower provision of informal care.
These heavy pressures on public finances call for policy action, which wouldinvolve curbing the impact of technology and prices on health care spending andmitigating the cost-disease effect in long-term care provision via productivitygains. These are not easy tasks. To improve cost-efficiency at the microeconomiclevel, reforms will have to be deeper and more sophisticated than those imple-mented so far. And in any event, policy makers will face difficult trade-offs. In par-ticular, reining in the impact of technological progress on health care demandwithout foregoing the benefits it provides to patients will be challenging. Like-wise, new ways will have to be found to minimise the pressures on long-term careexpenditures that may arise from an increased participation of women and olderworkers in the labour force, which yet is much needed for the sustainability of old-age social spending.

OECD EconomicStudies No. 43, 2006/2
142
© OECD 2006
Notes
1. See Culyer (1990), Gerdtham et al. 1992), Hitiris and Posnett (1992), Zewifel et al. (1999),Richardson and Roberston (1999), Moise and Jacobzone (2003), and Jönsson andEckerlund (2003).
2. Across all health expenditure types, expenditures per capita of those aged over 65 arearound four times higher than those under 65. The ratio rises to between six to ninetimes higher for the older groups (Productivity Commission, 2005; OECD Health Data-base, 2005a).
3. The data is based on the EU-AGIR Project; see Westerhout and Pellikaan (2005). Thecomplete expenditure profiles were only available for a subset of OECD countries. Anumber of different adjustments and estimations were made in order to derive thesecurves for other OECD countries. Moreover, for some countries only total costs wereavailable and thus health care had to be separated from long-term care. For12 countries, the data were simply not available. In this case, the expenditure curveswere estimated by adjusting expenditures as a spline function of age, based on avail-able data and were calibrated on the basis of total health expenditures derived fromOECD (2005a). These estimation procedures are described in detail in the Annex.
4. For a discussion and evidence on the “death-related costs”, see Seshamani and Gray(2004), Batljan and Lagergren (2004).
5. This proportion is based on April (2006) and some evidence gathered by the EC-AgeingWorking group (EC-EPC, 2005). The results are not very sensitive to the alternativeassumptions, because mortality rates are rather low for young and prime-age people.
6. By contrast, in “pure demographic” projections, the expenditure curves would not shiftrightwards with ageing, reflecting the implicit assumption of unchanged health status atany given age. When the cost curves stay put in presence of longevity gains, the shareof life lived in “bad health” increases when life expectancy increases.
7. See for example Fuchs (1984), Zwiefel et al. (1999), Jacobzone (2003) and Gray (2004).
8. See OECD (2006) for a discussion of the empirical literature and econometric estimatesof the income elasticity under alternative specifications for a panel of 30 OECD coun-tries for the period 1970-2002.
9. This estimate was carried out for total health spending given that the split betweenhealth care and long-term care expenditures is not available in time series for historicaldata. Given the low share of public long-term care expenditure to GDP in 2000 (typi-cally below 1% of GDP; OECD, 2005b), this approximation of the residual growth seemsreasonable.

The Drivers of Public Expenditure on Health and Long-Term Care: an Integrated Approach
143
© OECD 2006
10. To simplify calculations, the effect of past ageing does not incorporate “healthy longev-ity” and “death-related costs” as is done in the projections. In any event, the ageingeffect was small and would have been even smaller if a more sophisticated methodhad been applied. If anything, ceteris paribus, ignoring these past factors is likely to havelead to a downward bias in the estimated residual.
11. See Fuchs (1972), and Mushkin and Landefeld (1979). More recently, there has been arenewal of interest in this technology residual approach, see Newhouse (1992), KPMGConsulting (2001), Wanless (2001) and Productivity Commission (2005a-b).
12. For example, Dormont, Grignon and Huber (2006) found that in France the unit price ofcertain surgical treatments, such as cataract, decreased whereas the frequency of thetreatments increased significantly. Such effects can explain much of the recent upwardshift in the health care cost curves in France.
13. Some governments are attempting to introduce such quality adjustments in the mea-sure of output (and hence prices) of public services. See Grice (2005) for a discussionon this point based on the Atkinson Review, prepared for the UK Office for NationalStatistics.
14. For a comprehensive overview of key studies that explicitly estimate price elasticity forhealth services, see Ringel et al. (2002).
15. This is equivalent to say that the “true” relative price of health care vis-à-vis all othergoods in the economy decreases. Consider for example the case of a demand for vari-ety model with a CES utility function: , where σ >1 is the elasticity of sub-stitution among products. To simplify, let us assume price symmetry ( ). Thetrue composite price index is then equal to . With two types of compositegoods, say health (H) and all other goods (O), the true relative price would be:
. Thus, even if the usual price ratio ( ) remainsconstant, the “true” relative price would decrease when the pace of productcreation in the health sector is much faster than in the rest of the economy.
16. Without this specification, spending patterns of countries with equivalent expendituredrivers would diverge in terms of share of expenditure to GDP merely due to differentinitial expenditure to GDP ratios. Such a divergent scenario is not very appealing in thecontext of long-term projections.
17. This is roughly equivalent to assuming that the residual grows at a constant rate of½ per cent per year.
18. This convergence assumption (or transversality condition) may appear controversial inview of past experience. The assumption is justified by the fact that the expendituregrowth has to be financed by the public purse. Under perfect health market conditions,a continuing increase in the share of income going to health care spending could reflectindividual preferences. But the health care market is not perfect and governments arefooting most of the bill. Thus, rapid growth of the share of health care spending inincome would have to be compensated by reductions in other public spending items,which may be difficult to achieve and/or increased health care charges for individuals.Such cost sharing has already been introduced in most countries. Similar transversalityconditions have also been imposed in other projection exercises. For example, Englert(2004) assumes that income elasticity ultimately converges to one. For symmetry, nega-tive residuals are assumed to increase towards zero over the projection period, in thescenario with country-specific residuals.
∑ −=i
ixU σσ /)1(
ippi ∀= ,pnP ⋅= − )1(* σ
)/()/(/ )1(**OHOHOH ppnnPP ⋅= −σ
OH pp /** / OH PP

OECD Economic Studies No. 43, 2006/2
144
© OECD 2006
19. Note that the technology residual is still assumed to converge towards zero over theprojection period.
20. Given the very high historical growth rate of the residual for Turkey, this country wasexcluded from this simulation as it produced rather implausible shares of health careexpenditures to GDP by 2050.
21. Note that when the chosen income elasticity is assumed to be changed both in thepast and in the future, applying sub-unity elasticity would increase the residual whenexplaining past data. This means, when projecting, that the drag on expenditure growthfrom lower income elasticity would be offset by a higher residual, and vice versa. Byconstruction, such scenarios would not produce very different results.
22. These alternative population projections were derived from a stylised demographicmodel, which mimics national projections (see Gonand, 2005).
23. For comprehensive discussions of long-term care, see for example OECD (2005b),Lundsgaard (2005), Karlsson et al. (2004), Comas-Herrera et al. (2003), Norton (2000) andWittenberg et al. (1998). Interesting UK case studies are Davies et al. (1990) and Evan-drou et al. (1998). As an indication of the potential spending pressures, the average costper year of institutional long-term care for old persons in France is currently atEUR 35 000 per dependant, and in the range of $40 000-75 000 per dependant for theUnited States (Taleyson, 2003).
24. Indeed, even if the unit costs of long-term care per dependant are equal in, say,countries A and B, the expenditure curves by age group would still differ if the share ofdependants in each age group is different in each country.
25. Most informal care is provided by partners or children. To be considered informal, theprovision of care cannot be paid for as if purchasing a service. However, an informalcare giver may receive income transfers conditioned on his/her provision of informalcare and possibly, in practice, some informal payment from the person receiving care.On the other hand, formal care is provided by care assistants who are paid for provid-ing care under some form of employment contract. It includes care provided in institu-tions as well as care provided at home. The difference between formal and informalcare is first of all not about the type of care, but who provides it (Lundsgaard, 2005).
26. Due to lack of sufficiently comparable information across countries, this paper does notincorporate another important distinction, which is the subdivision of formal care intoinstitutional care and care delivered to the patient’s home. There are indeed funda-mental differences between countries in the way they organise their formal LTC. Institu-tional LTC is particularly widespread in the Nordic countries. Norway and Swedenstand out with substantially higher LTC spending than any other country due to gener-ous services (single rooms and well-equipped housing infrastructure) provided for resi-dents in nursing homes (OECD, 2005b). Whether this organisation is adopted by othercountries or a (cheaper) ambulatory help-at-home strategy is pursued could haveimportant consequences for public expenditures.
27. There are indications that the proportion of older people living alone increased up tothe early 1990s, although trends appear to have changed since (Tomassini et al., 2004and Borsch-Suppan, 2005).
28. Given that the shape of the expenditure curves by age is close to an exponential func-tion, a log-level specification was used.

The Drivers of Public Expenditure on Health and Long-Term Care: an Integrated Approach
145
© OECD 2006
29. Note that this method differs somewhat from what was presented earlier for health careexpenditures, where the cost profile for survivors was shifted directly in line with pro-jected longevity gains. Here the cost profile is shifted indirectly through the shift independency rates.
30. See also Olshansky et al. (2005) for a discussion on the effect of obesity trends on lifeexpectancy.

OECD EconomicStudies No. 43, 2006/2
146
© OECD 2006
Annex
Data Sources and Methods
Estimating death-related costs
The primary data for 18 OECD countries are drawn from the AGIR data set (Westerhoutand Pellikaan, 2005, based on EC-EPC, 2001) for EU15 countries and from national sources forAustralia, Canada and the United States.
The cost of death for the oldest group (95+) is assumed to be the lowest and was proxiedby their observed health expenditure per person when available. For France, Germany, Italy,the United Kingdom, Spain, the Netherlands and Australia for which the expenditure for theoldest group were not available, the cost of people aged 75-79 was taken as a proxy. In fact,when available, expenditure at age 95+ is roughly equal to the level of expenditure at age75-79. For the countries where no cost expenditures were available, the cost of death for theoldest group was estimated by taking three times the average health expenditure per capita.
The costs of death for other age groups are then derived by multiplying this estimate byan adjustment factor equal to four between ages 0-4 to 55-59, gradually decreasing to1 afterwards. Multiplying these costs of death by the estimated number of deaths by agegroup (using mortality data) gives the death-related cost (DRC) curve.
Estimating the survivors’ expenditure curves
The cost curve for survivors can be simply derived by subtracting the death-related costsjust described from the total expenditure curves, when available (18 OECD countries). Giventhe uncertainties surrounding these data, it seemed preferable to estimate an averageexpenditure curve for survivors and then calibrate this curve for each country (see below). Inthis way, the projections are less sensitive to initial conditions and to country-specific dataidiosyncrasies.
This average expenditure curve for survivors was estimated econometrically in a panel of18 countries by 20 age groups, using a spline function, as follows:
where age is the central point in each age bracket (e.g. 2, 7, 12,…, 97). All the estimated coef-ficients are significant.
6.122200002.0004.029.094.98.137Population
Exp.Health 5432 +⋅−⋅+⋅−⋅+⋅−= ageageageageagegroupage
The Drivers of Public Expenditure on Health and Long-Term Care: an Integrated Approach
147
© OECD 2006
Calibration of the expenditure curves on the OECD health database
The cost curves derived for the year 2000 were first calibrated in order to fit with levelsof 2005, the starting point of the projections. The total health and long-term care expendi-tures for 2005 being not yet available in the OECD Health Data (2005a), an estimate wasmade by applying the observed growth rate in expenditures 2000-03 (or 2002, depending onthe countries) for the whole period 2000-05. A second step was to split the total spending intohealth and long-term care. The details of this split are provided below and involved an esti-mate of the shares of long-term care expenditures using OECD (2005b).
The costs of death by age group for 2005 were derived by applying the same growth rateas the total health expenditures between 2000 and 2005. The total death-related costs in2005 were computed as the product of the cost of death by the projected number of deathsby age group in that year. The total survivor expenditures were then derived by subtractingthe total death-related costs from the total health spending. Using this information, the sur-vivor cost curve was calibrated proportionally for each age group.
Projecting the demographic effects under a “healthy ageing” scenario
Shifting the survivor cost curve according to longevity gains involves two steps:
• The survivor expenditure curve by five-year age groups is interpolated in order toderive a profile by individual age. In this way, the cost curve can be shifted smoothlyover time in line with life expectancy gains.
• An “effective age” is calculated by subtracting the increase in life expectancy at birthaccording to national projections from current age. For example, a 70-year old personin Germany is projected to have an effective age of 67 by 2025 and 64 by 2050.
The death-related cost curve remains constant over time (to isolate the demographiceffect) and the total costs of death are projected according to the number of deaths.
Deriving expenditure curves for long-term care (LTC)
Expenditure curves for 11 EU-countries were obtained from the AGIR data set (Wester-hout and Pellikaan, 2005, based on EC-EPC, 2001). An average dependency ratio (prevalenceof dependency by age group) was derived from Comas-Herrera (2003) study for four coun-tries (the United Kingdom, Spain, Italy and Germany). As the Comas-Herrera study only pro-vides dependency ratios for old ages, this ratio was assumed to start at 2% for younger ages.
More precisely, the LTC expenditures per dependant were derived as follows:
where
An average LTC expenditure curve per dependant and age group was estimated usingthe following equation (see Table 4, in the main text):
groupagegroupagegroupage ratiodependencypopulationLTC
dependantLTC 1
×=
groupagepopulationtotaldependantsofnumberratiodependency =
)(0394.00348.0217.4 6450ofratioionparticipatForceLabouragedependant
LTCLog −⋅+⋅+=⎟⎟⎠
⎞⎜⎜⎝
⎛

OECD Economic Studies No. 43, 2006/2
148
© OECD 2006
This equation was used to derive the shift in the LTC expenditure curve associated withchanges in the participation ratios. Having the expenditure curves per dependant in eachage group, the total LTC costs can be calculated as follows:
The total LTC expenditure in percentage of GDP in 2000 was calibrated to fit the esti-mates of the OECD Long-term Care study (OECD, 2005b), when available. Data for the coun-tries not available in this study were obtained by applying the ratios of LTC to GDP observedin “similar” benchmark countries, as indicated in the table below:
The starting point of the projections
The projected changes in spending expressed in percentage of GDP were calculatedfrom a common base applied to all OECD countries. This base was taken as the OECD aver-age of expenditure in 2005. These changes were added to the initial level of expenditures ineach country. This approach makes the projected changes (expressed in per cent of GDP)less dependent from the base year levels and also allows for a certain catch-up of expendi-ture ratios across countries. More precisely, the variation of the share of expenditure to GDPin country j between, say, 2005 and 2050, is calculated as:
Country estimated Benchmark countries
Belgium NetherlandsCzech Republic Average (Hungary, Poland)Slovak Republic Average (Hungary, Poland)Denmark Average (Norway, Sweden)Finland Average (Norway, Sweden)Iceland Average (Norway, Sweden)France GermanyGreece SpainItaly Average (Germany, Spain)Portugal SpainSwitzerland GermanyTurkey Mexico
∑⎥⎥⎦
⎤
⎢⎢⎣
⎡⋅=
iigroupage
igroupage
dependantsofnumberdependant
LTCLTCTotal
( )
⎟⎟⎠
⎞⎜⎜⎝
⎛
−⎥⎥⎦
⎤
⎢⎢⎣
⎡⎟⎟⎠
⎞⎜⎜⎝
⎛+Δ=⎟⎟
⎠
⎞⎜⎜⎝
⎛Δ
=
=− −
2005
200520052050loglogexp
20052050
yearaverageOECD
yearaverageOECDjcountry
GDPeExpenditur
GDPeExpenditurDrivers
GDPeExpenditur
jcountry

Th
e D
rivers o
f Pu
blic E
xpe
nd
iture
on
He
alth
an
d L
on
g-T
erm
Ca
re: a
n In
teg
rate
d A
pp
roa
ch
149
© O
EC
D 2006
Table A1. Assumptions underlying the alternative projection scenarios: Health care
Scenarios Health Status Income elasticity Expenditure residual
Demographic effect Healthy ageing: Longevity gains are translated into equivalent additional years in good health
Income elasticity is equal to 1 n.a.
Cost-pressure scenario Healthy ageing: Longevity gains are translated into equivalent additional years in good health
Income elasticity is equal to 1 The expenditure residual grows at 1% per year over the projection period
Cost-containment scenario Healthy ageing: Longevity gains are translated into equivalent additional years in good health
Income elasticity is equal to 1 Residual growth is equal to 1% in 2005 and converges to 0 by 2050 (transversality condition)
Country-specific residuals Healthy ageing: Longevity gains are translated into equivalent additional years in good health
Income elasticity is equal to 1 Residual growth is country-specific and converges to 0 by 2050 (transversality condition)
Income elasticity = 0.8 Healthy ageing: Longevity gains are translated into equivalent additional years in good health
Income elasticity is equal to 0.8
Residual growth is equal to 1% in 2005 and converges to 0 by 2050 (transversality condition)
Income elasticity = 1.2 Healthy ageing: Longevity gains are translated into equivalent additional years in good health
Income elasticity is equalto 1.2
Residual growth is equal to 1% in 2005 and converges to 0 by 2050 (transversality condition)
Residuals at 1.5% Healthy ageing: Longevity gains are translated into equivalent additional years in good health
Income elasticity is equal to 1 Residual growth is equal to 1.5% in 2005 and converges to 0 by 2050 (transversality condition)
Compression of morbidity Longevity gains are doubled into additional years in good health
Income elasticity is equal to 1 Residual growth is equal to 1% in 2005 and converges to 0 by 2050 (transversality condition)
Expansion of morbidity No healthy ageing adjustment, i.e. longevity gains do not translate into additional years in good health
Income elasticity is equal to 1 Residual growth is equal to 1% in 2005 and converges to 0 by 2050 (transversality condition)
Note: The key assumption changed in each scenario is in bold.

OE
CD
Eco
no
micS
tud
ies N
o. 4
3, 2
00
6/2
150
© O
EC
D 2006
Table A2. Assumptions underlying the alternative projection scenarios: Long-term care
Scenarios Health StatusParticipation rates(proxy for availability of informal care)
Income and “cost disease” effects
Demographic effect Healthy ageing: The prevalence of dependency per age is shifted by ½ year every 10 years (approximately half of the projected longevity gains)
n.a. Long-term care costs per dependent increase by half of average labour productivity (partial Baumol effect) Income elasticity equal to zero
Cost-pressure scenario
Healthy ageing: The prevalence of dependency per age is shifted by ½ year every 10 years
Participation rates of people aged 50-64 increase in line with baseline labour force projections
Long-term care costs per dependent increase in line with average labour productivity (full Baumol effect)Income elasticity equal to zero
Cost-containment scenario
Healthy ageing: The prevalence of dependency per age is shifted by ½ year every 10 years
Participation rates of people aged 50-64 increase in line with baseline labour force projections
Long-term care costs per dependent increase by half of average labour productivity (partial Baumol effect) Income elasticity equal to zero
Unitary income elasticity
Healthy ageing: The prevalence of dependency per age is shifted by ½ year every 10 years
Participation rates of people aged 50-64 increase in line with baseline labour force projections
Long-term care costs per dependent increase by half of average labour productivity (partial Baumol effect) Income elasticity equal to one
Compression of disability
The prevalence of dependency per ageis shifted by 1 year every 10 years
Participation rates of people aged 50-64 increase in line with baseline labour force projections
Long-term care costs per dependent increase by half of average labour productivity (partial Baumol effect) Income elasticity equal to zero
Expansion of disability
No healthy ageing adjustment, i.e. the prevalence of dependency remains constant over time
Participation rates of people aged 50-64 increase in line with baseline labour force projections
Long-term care costs per dependent increase by half of average labour productivity (partial Baumol effect) Income elasticity equal to zero
Increase in dependency
Healthy ageing: The prevalence of dependency per age is shifted by ½ year every 10 years, but dependency rates are assumed to increase by 0.5% per year
Participation rates of people aged 50-64 increase in line with baseline labour force projections
Long-term care costs per dependent increase by half of average labour productivity (partial Baumol effect) Income elasticity equal to zero
Increased participation
Healthy ageing: The prevalence of dependency per age is shifted by ½ year every 10 years
Participation rates of people aged 50-64 converge to at least 70% by 2050 in all countries
Long-term care costs per dependent increase by half of average labour productivity (partial Baumol effect) Income elasticity equal to zero
Note: The key assumption changed in each scenario is in bold.
The Drivers of Public Expenditure on Health and Long-Term Care: an Integrated Approach
151
© OECD 2006
BIBLIOGRAPHY
Aprile, R. (2004), “How to Take Account of Death-Related Costs in Projecting Health CareExpenditure – Updated Version”, Ragioneria Generale Dello Stato.
Batljan, I. and M. Lagergren (2004), “Inpatient/Outpatient Health Care Costs and RemainingYears of Life – Effect of Decreasing Mortality on Future Acute Health Care Demand”,Social Science and Medicine 59: 2459-2466.
Baumol, W.J. (1967), “Macroeconomics of Unbalanced Growth: The Anatomy of Urban Crisis”,American Economic Review 57: 415-426.
Baumol, W.J. (1993), “Health Care, Education and the Cost of Disease: A Looming Crisis forPublic Choice”, Public Choice 77:17-28.
Borsch-Suppan, A. (2005), Health, Ageing and Retirement in Europe, Manheim Research Institutefor the Economics of Ageing, Manheim.
Burniaux, J.-M., R. Duval and F. Jaumotte (2003), “Coping with Ageing: a Dynamic Approachto Quantify the Impact of Alternative Policy Options on Future Labour Supply in OECDCountries”, OECD Economics Department Working Papers No. 371.
Comas-Herrera, A. and R. Wittenberg (eds.) (2003), European study of Long-Term Care Expendi-ture: Investigating the Sensitivity of Projections of Future Long-Term Care Expenditure in Germany,Spain, Italy and the United Kingdom to Changes in Assumptions About Demography, Dependency,Informal Care, Formal Care and Unit Costs, PSSRU, LSE Health and Social Care, LondonSchool of Economics.
Comas-Herrera, A., R. Wittenberg and L. Pickard (2005), “Making Projections of PublicExpenditure on Long-Term Care for the European Member States: Methodological Pro-posals for Discussion”, LSE Health and Social Care, London.
Culyer, A.J. (1990), “Cost Containment in Europe”, Health Care Systems in Transition, OECD,Paris.
Cutler, D. (2001), “The Reduction in Disability among the Elderly”, Proceedings of the NationalAcademy of Science, Vol. 98, No. 12, June.
Dang, T.T., P. Antolin and H. Oxley (2001), “Fiscal Implications Ageing: Projections of Age-Related Spending”, OECD Economics Department Working Papers No. 305, Paris.
Davies, B., E. Ferlie, M. Hughes and J. Twigg (1990), Resources, Needs and Outcomes in Commu-nity-based care: a comparative study of the production of welfare for elderly people in ten local authori-ties in England and Wales, Avebury, Aldershot.
Dreger, C. and H.-E. Reimers (2005), “Health Care Expenditures in OECD Countries: A PanelUnit Root and Cointegration Analysis”, IZA Discussion Paper 1469, Bonn.
Docteur, E. and H. Oxley (2003), “Health-Care Systems: Lessons From the Reform Experi-ence”, OECD Economics Department Working Papers No. 374.

OECD Economic Studies No. 43, 2006/2
152
© OECD 2006
Dormont, B., M. Grignon and H. Huber (2006), “Health Expenditure Growth: Reassessing theThreat of Ageing”, Health Economics 15, pp. 947-963. Published on line in Wiley Inter-Science (www.interscience.wiley.com), DOI:10.1002/hec.1165.
Englert, M. (2004), “Assessing the Budgetary Cost of Ageing and Projecting Health Care (+ Carefor Elderly) Expenditure: The Belgian experience”, Federal Planning Bureau, Brussels.
Evandrou, M. and D. Winter (1998), The Distribution of Domiciliary and Primary Health Care in Britain:Preliminary Results on Modelling Resource Allocation in the Welfare State, LSE, Welfare State Pro-gramme, WSP/26, London.
EC-Economic Policy Committee (2001), Budgetary Challenges Posed by Ageing Populations: TheImpact on Public Spending on Pensions, Health and Long-term Care for the Elderly and Possible Indi-cators of the Long-term Sustainability of Public Finances, EPC/ECFIN/655/01-EN final, October.
EC-Economic Policy Committee (2005), “The 2005 EPC Projection of Age-Related Expendi-ture: Agreed Underlying Assumptions and Projection Methodologies”, European Econ-omy, Occasional Papers No. 19.
Fries, J.F. (1980), “Ageing, Natural Death, and the Compression of Morbidity”, New EnglandJournal of Medicine 303: 130-135.
Fuchs, V. (1972), Essays in the Economics of Health and Medical Care, National Bureau of EconomicResearch, New York.
Fuchs, V. (1984), “Though Much is Taken Reflections on Ageing, Health and Medical Care”,NBER Working Paper No. 1269.
Gerdtham, U., J. Sogaard., F. Anderson and B. Jonsson (1992), “An Econometric Analysis ofHealth Care Expenditure: A Cross-Section Study of the OECD Countries”, Journal ofHealth Economics, Vol.11, No.1, pp.63-84.
Getzen, T. (2000), “Health Care is an Individual Necessity and a National Luxury: ApplyingMultilevel Decision Models to the Analysis of Health Care Expenditure”, Journal of HealthEconomics 19, pp. 259-270.
Gonand, F. (2005), “Assessing the Robustness of Demographic Projections in OECD Coun-tries”, OECD Economics Department Working Papers No. 464.
Gray, A. (2004), Estimating the Impact of Ageing Populations on Future Health Expenditures, Public lec-ture to the National Institute of Economics and Business and the National Institute ofHealth and Human Science, 4 November, Canberra.
Grice, J. (2005), “The Atkinson Review: Measurement of Government Output in NationalAccounts”, in OECD Statistics Newsletter, No. 26, April.
Grunenberg, E.M. (1977), “The Failure of Success”, Milbank Memorial Fund Q. Health Soc. 55,pp. 3-24.
Health Canada (2001), “Ageing and the Financial Pressures on the Health Care System”,Health Policy Research Bulletin, Vol. 1, Issue 1, March.
Hitiris, T. and J. Posnett (1992), “The Determinants and Effects of Health Expenditure inDeveloped Countries”, Journal of Health Economics, Vol. 11, No. 2, pp. 173-81.
Høj, J. and S. Toly (2005), “The Labour Market Impact of Rapid Ageing of GovernmentEmployees: Some Illustrative Scenarios”, OECD Economics Department Working PapersNo. 441.
Jacobzone, S. (2003), “Ageing and the Challenges of New Technologies: Can OECD Socialand Health Care Systems Provide for the Future?”, The Geneva Papers on Risk and Insurance,Vol. 28, No. 2, April, pp. 254-74.

The Drivers of Public Expenditure on Health and Long-Term Care: an Integrated Approach
153
© OECD 2006
Jacobzone, S., E. Cambois and J.M. Robine (2000), “Is the Health of Older Persons in theOECD Countries Improving Fast Enough to Compensate for Population Ageing?”, OECDEconomic Studies No. 30, Paris.
Jönsson, B. and I. Eckerlund (2003), “Why do Different Countries Spend Different Amountson Health Care?”, A Disease-based Comparison of Health Systems, OECD, Paris.
Karlsson, M., L. Mayhew, R. Plumb and B. Rickayzen (2004), An International Comparison of Long-Term Care Arrangements, Cass Business School, City University, London.
KPMG Consulting (2001), Impact of New Technology on Victorian Public Hospital Costs, Report to theVictorian Department of Human Services, September.
Lagergren, M. and I. Batljan (2000), Will There Be a Helping Hand? Macroeconomic Scenarios ofFuture Needs and Costs of Health and Social Care for the Elderly in Sweden 2000-30, Annex 8 tothe Long-term Survey 1999/2000, Stockholm.
Lichtenberg, F.R. (2003), “The Impact of New Drug Launches on Longevity: Evidence fromLongitudinal, Disease-Level Data From 52 Countries, 1982-2001”, NBER Working PaperSeries No. 9754.
Lichtenberg, F.R. and S. Virabhak (2002), “Pharmaceutical Embodied Technical Progress,Longevity, and Quality of Life: Drugs As ‘Equipment For Your Health’”, NBER WorkingPaper Series No. 9351.
Lundsgaard, J. (2005), “Consumer Direction and Choice in Long-Term Care for Older Per-sons, Including Payments for Informal Care: How Can it Help Improve Care Outcomes,Employment and Fiscal Sustainability?”, OECD Health Working Papers No. 20, Paris.
Manton, K.G. (1982), “Changing Concepts of Morbidity and Mortality in the Elderly Popula-tion”, Milbank Memorial Fund Q. Health Soc. 60, pp. 183-244.
Michel, J.-P. and J.-M. Robine (2004), “A ‘New’ General Theory of Population Ageing”, TheGeneva Papers on Risk and Insurance Vol. 29, No. 4 (October), pp. 667–678.
Moise, P. and S. Jacobzone (2003), “Population Ageing, Health Expenditure and Treatment:an ARD Perspective”, A Disease-based Comparison of Health Systems, OECD, Paris.
Mushkin, E.P. and J.S. Landefeld (1979), Biomedical Research: Costs and Benefits, Ballinger Pub-lishing Company, Cambridge, Massachusetts.
Netten, A., A. Bebbington, R. Darton, J. Forder and K. Miles (1998), 1996 Survey of Care Homesfor Elderly People: Final Report, Discussion Paper 1423/2, PSSRU: University of Kent.
Newhouse (1992), “Medical Care Costs: How Much Welfare Loss?”, Journal of Economic Perspec-tives, Vol. 6, No. 3, pp. 3-21.
Norton, E.C. (2000), “Long-Term Care”, in Culyer, A.J. and J.P. Newhouse (eds.), Handbook ofHealth Economics, Vol. 1B, Elsevier, North-Holland.
OECD (2005a), Health Database, Paris.
OECD (2005b), Long-term Care for Older People, Paris.
OECD (2006), “Projecting OECD Health and Long-Term Care Expenditures: What are theMain Drivers?”, OECD Economics Department Working Papers No. 477.
Oliveira Martins, J., F. Gonand, P. Antolin, C. de la Maisonneuve and K. Yoo (2005), “TheImpact of Ageing in Demand, Factor Markets and Growth”, OECD Economics DepartmentWorking Papers No. 420.
Olshansky, J. et al. (2005), “A Potential Decline in Life Expectancy in the United States in the21st Century”, The New England Journal of Medicine, 352:11.

OECD Economic Studies No. 43, 2006/2
154
© OECD 2006
Productivity Commission (2005a), Economic Implications of an Ageing Australia, Research Report,Canberra.
Productivity Commission (2005b), Impacts of Medical Technology in Australia, Progress Report,Melbourne, April.
Rand Research Bulletin (2004), “Obesity and Disability: The Shape of Things to Come”, RB-9043.
Reinhold, W. (2001), Controlling in Pflegeeinrichtungen: “Operatives Controlling fürPflegeleistungen in Stationaren Pflegeeinrichtungen”, Lage: Jacobs, cited in Comas-Herrera and Wittenberg (2003).
Richardson, J. and I. Robertson (1999), “Ageing and the Cost of Health Services”, in PolicyImplications of the Ageing of Australia’s Population, Productivity Commission and MelbourneInstitute, Canberra.
Ringel, J.S., S.D. Hosek, B.A. Vollaard and S. Mahnovski (2002), The Elasticity of Demand forHealth Care; A Review of the Literature and its Application to the Military Health System, NationalDefense Research Institute, RAND Health.
Robine, J.M. and J.P. Michel (2004), “A ‘New’ General Theory of Population Ageing”, TheGeneva Papers on Risk and Insurance, Vol. 29, No. 4, October, pp. 667-678.
Seshamani, M. and A.M. Gray (2004), “A Longitudinal Study of the Effects of Age and Timeto Death on Hospital Costs”, Journal of Health Economics, March, Vol. 23, No. 2, pp. 217-35.
Sheehan, P. (2002), “Health Costs, Innovation and Ageing”, Pharmaceutical Industry WorkingPaper Series No. 9, Centre for Strategic Economic Studies, Victoria University of Technol-ogy, Melbourne.
Sturm, R. and D. Lakdawalla (2004), “Swollen Waistlines, Swollen Costs. Obesity WorsensDisabilities and Weighs on Health Budgets”, RAND Review, Spring.
Taleyson, L. (2003),“Private Long-Term Care Insurance – International Comparisons”, Healthand Ageing No. 8, Geneva Association Information Newsletter, March.
Tomassini, C., K. Glaser, D.A. Wolf, M. Broese van Groenou and E. Grundy (2004), “LivingArrangements among Older People: An Overview of Trends in Europe and the USA”,Population Trends 115, pp. 22-34.
Wanless, D. (2001), Securing our Future Health: Taking a Long-Term View, Interim Report, HMTreasury, London.
Weisbrod, B.A. (1991), “The Health Care Quadrilemma: An Essay On Technological Change,Insurance, Quality of Care, and Cost Containment”, Journal of Economic Literature,Vol. XXIX, pp. 523-552.
Westerhout, E. and F. Pellikaan (2005), “Can We Afford to Live Longer in Better Health?”,Netherlands Bureau for Economic Policy Analysis, Document No. 85, June.
Wittenberg, R., B. Sandhu and M. Knapp (2002), “Funding Long-Term Care: The Public andPrivate Options”, in (eds) Mossialos, E., A. Dixon, J. Figueras and J. Kutzin, FundingHealth Care: Options for Europe, Open University Press: Buckingham.
Wittenberg, R., L. Pickard, A. Comas-Herrera, B. Davies and R. Darton (2001), “Demand for Long-Term Care for Elderly People in England to 2031”, Health Statistics Quarterly 12, pp. 5-16.
Wittenberg, R., L. Pickard, A. Comas-Herrera, B. Davies and R. Norton (1998), Demand for Long-Term Care: Projections of Long-Term Care Finance for Elderly People, PSSRU: University of Kent.
Zwiefel, P.S. Felder and M. Meirs (1999), “Ageing of Population and Health Care Expendi-ture: A Red Herring?”, Health Economics, Vol. 8, pp. 485-96.