the dlslnflatlon of the 1980s david t. coe, martine … · the dlslnflatlon of the 1980s david t....
TRANSCRIPT

THE DlSlNFLATlON OF THE 1980s
David T. Coe, Martine Durand and Ulrich Stiehler
CONTENTS
Introduction . . . . . . . . . . . . . . . . . . . . . . . . . . . . . . . 1. The disinflation of the 1980s . . . . . . . . . . . . . . . . . . . .
A. Rapid disinflation during recession and recovery: 1980 to 1983 B. Slow growth and continued disinflation: 1983 to 1987 . . . . A decomposition of the sources of the 1980 to 1987 disinflation . A. The impact of monetary policies . . . . . . . . . . . . . . . . B. The impact of fiscal policies . . . . . . . . . . . . . . . . . . C. The impact of oil and non-oil commodity prices . . . . . . . . D. Other autonomous factors and exchange rates . . . . . . . . .
Summary and policy implications . . . . . . . . . . . . . . . . . . . . Appendix . . . . . . . . . . . . . . . . . . . . . . . . . . . . . . . . Bibliography . . . . . . . . . . . . . . . . . . . . . . . . . . . . . . .
II.
90 92 92 98
100 103 106 107 112 113 116 120
The authors are members of the General Economics Division of the Economics and Statistics Department. They acknowledge helpful comments from Andrew Dean, Robert Flanagan, John Llewellyn, John Martin, Jeff Shafer and Hannes Suppanz. They are also grateful to Anick Lotrous for statistical assistance and to Jackie Gardel for expert typing.
89

INTRODUCTION
There have been two postwar periods when OECD inflation was high, accelerating and area-wide - the early 1950s and the 1970s - and in both cases large increases in commodity prices played an important role. The inflation of the early 1950s, which largely reflected speculative forces associated with the Korean war, was relatively brief, as was the disinflation which followed.
By contrast, the inflation of the 1970s was more sustained and deeply rooted in the domestic wage-price system of OECD economies. The reduction of this entrenched inflation was the outstanding achievement of economic policies in the first half of the 1980s. In most countries, the reduction of inflation was costly in terms of recession and increases in unemployment rates (Chart A). Oil and non-oil commodity price declines, which were to some extent independent of economic policies, were important in reinforcing the disinflation process. A brief review of the disinflationary experience from 1980 to 1987 is presented in Section I.
The disinflation of the 1980s has been analysed in a number of recent papers: Beckerman and Jenkinson (1 9861, Cling and Meunier (1 986), Minczeles and Sicsic (1 986), Rowlatt (1 987), Black (1 9871, Morin (1 988) and Brown (1 988). These studies are based on single-equation or reduced-form analyses of the disinflation process and tend to focus on the proximate causes of the disinflation, particularly the roles of oil and non-oil commodity prices on the one hand and increases in unemployment on the other; there are notable divergences in these studies regarding the causes of the disinflation and the transmission mechanisms. Because disinflation is an endogenous phenomenon, it is necessary to go back to those events which can reasonably be regarded as exogenous in order to quantify its ultimate causes. This can best be done in the context of counter-factual, historical simulations with a linked, multi-country macroeconometric model. Section II presents such a model-based decomposition of the respective roles of macroeco- nomic policies, oil and non-oil commodity prices, and other autonomous develop- ments in the disinflation of the 1980s. A final section presents a summary and discusses policy implications.
90

CHART A
THE DlSlNFLATlON OF THE 1980s United States Total OECD (a1 --- -
------. Four major european economies (a1 - -- Japan
Per cent Growth of GNP/GDP deflator Per cent - 14 12 10
- 8 - 6
- -
0 - I I I I ,
1979 1980 1981 1982 1983 1984 1985 1986 1987 88
Growth of real GNP/GDP
/I/\\
-6 1979 1980 1981 1982 1983 1984 1985 1986 1987 88
0 1979 1980 1981 1982 1983 1984 1985 1986 1987 88
Per cent
l4 r Real long-term interest rates (b)
I Per cent
1 l4
4 ----- -. I
12
10
8
6
4
2
b) Long-term nominal interest rates minus the growth of the private consumption deflator
1979 1980 1981 1982 1983 1984 1985 1986 1987 88 a1 1982 GNP/GDP weights and exchange rates
91

I. THE DlSlNFLATlON OF THE 1980s
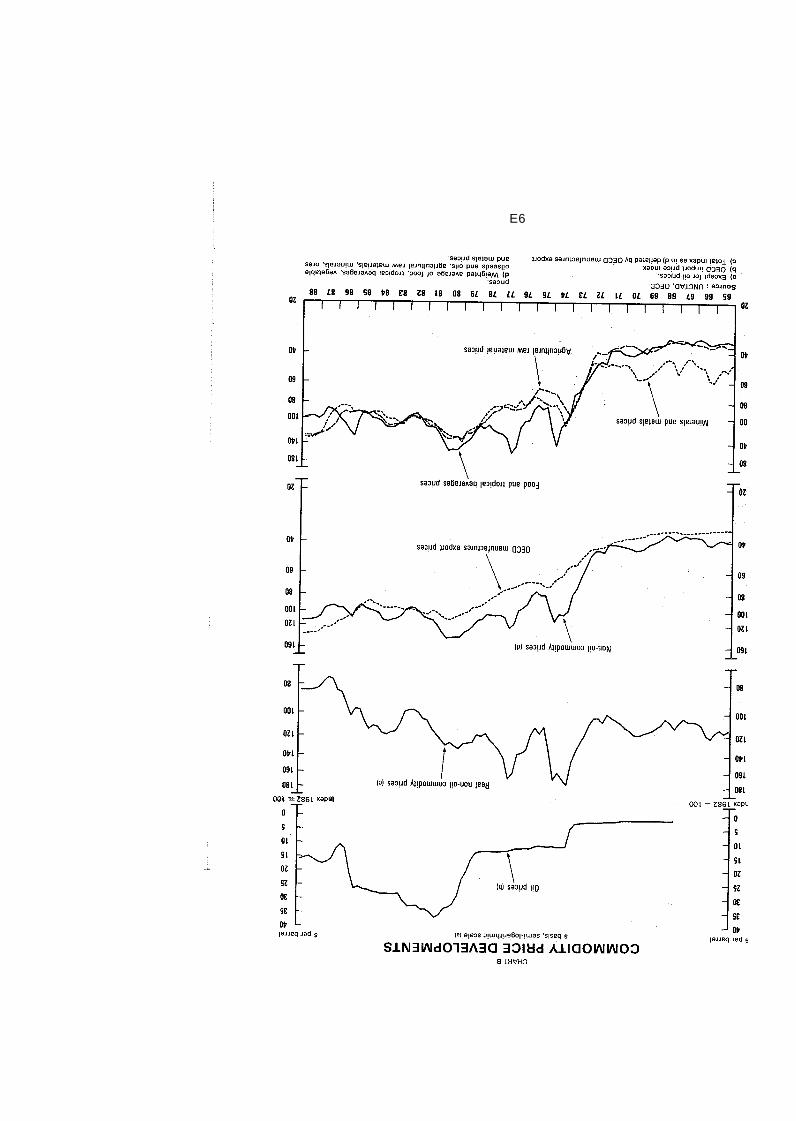
At the beginning and the end of the 1970s, accelerating world inflation was led by large increases in non-oil commodity prices and then exacerbated by major increases in oil prices - in 1 973 when oil prices quadrupled to about $1 2 per barrel and again in 1979 and 1980 when they more than doubled to about $36 (Chart B). After the second surge in oil prices, it was generally agreed among OECD governments that a repetition of the accommodating policies adopted after the first would result in unacceptably high inflation which would be inconsistent with sustained economic growth and potentially damaging to the international economic system’. The priority for macroeconomic policies was therefore to resist inflationary pressures as the oil price shock interacted with the domestic wage-price system, and also to reduce inflation which, in most countries, had risen to levels which were politically unsustainable.
A. Rapid disinflation during recession and recovery: 1980 to 1983
The need to stabilize financial and foreign exchange markets implied a major role for monetary policies, which were tightened substantially in major OECD countries in the 1979 to 1983 period (Chart CI2. An important signal of the new stance of monetary policies was the October 1979 change in operating procedures of the United States’ Federal Reserve Board whereby greater emphasis was placed on controlling the growth of the monetary aggregates with, correspondingly, less emphasis on stabilizing interest rates. In most other countries, monetary policies were also tightened immediately after the 1979 oil price shock and remained restrictive thereafter; this was partly for domestic reasons and partly to limit exchange-rate depreciation v i s - h i s the dollar as U.S. interest rates rose sharply. In Germany, and in a number of European countries which keep their currencies linked to the Deutschemark, the decline in reserves was the main source of monetary tightness in 1979 and 1980, as illustrated in the right-hand side of Chart C. From 1979 to mid- 1982, nominal and real interest rates rose steeply to record highs in most OECD countries, with short-term interest rates in the United States increasing to the unprecedented level of 20 per cent in the first quarter of 1980.
It can be argued that in the period from early 198 1 to early 1982, monetary policies in the United States achieved a new degree of credibility. This credibility may have also been enhanced in 1981 when the Government reacted to the illegal air controllers’ strike for higher pay by dissolving the union. Many had argued that once the anti-inflation stance of policies became credible, forward-looking inflation expectations would decline and this would contribute to the disinflation process3. Credibility is an elusive concept to measure, and hence it is difficult to judge the extent to which enhanced credibility contributed to the disinflation process. The
92
E6
OOL = 2861 xapui

CHART C
MONETARY Tl GHTE N I N G IN THE THREE MAJOR ECONOMIES 1979 to 1983
A. Growth of the monetary base B. Change in the monetary base (Seasonally adjusted. annual rates) (Billions of domestic currencv)
United States Domestic Per cent international reserves Billion $
14 14
12 12 12 12
10 10 10 10
8 8 8 8 6 6
4 4 6
4 4 2 2
2 -2 -2
6
2 0 0
0 0 - 4 -4 -a
1978 1979 1980 1981 1982 1983 -2
1978 1979 1980 1981 1982 1983
Billion yen Japan Per cent - .. 25 25 2500 2500
20 20 2cxi 1500 1500
1 OM 1000
10 l0 5m 500
2wo
15 15
5 El 0 0
-500 -5w) 0
-1 wo -1 M)(1
-1 5W -5 -1 500
-2000 -1 0 -1 0
-5
tlu -2500 -1 5 -45 -25001 ' I ' I ' ' ' I "
1978 1979 1980 1981 1982 1983 1978 1979 1980 1981 1982 1983
Germany Per cent
20 20
15 15
10 10
4 5
0 0
-5 -5
-10 1978 1979 1980 1981 1982 1983
40
30
20
10
-1 0 0
-20
30
-40
Billion DM
1 4 0
30
20
10
0
-10
1 -20
, I 4
1978 1979 1980 1981 1982 1983
94

apparent ease with which Japan and Germany, where the anti-inflation resolve of the monetary authorities was generally unquestioned, were able to maintain relatively low rates of inflation does, however, suggest the potential importance of credibility.
Fiscal policies over this period were less consistent across OECD countries than were monetary policies, and less obviously directed towards inflation objectives. For the OECD area as a whole, there was little change in the structural budget balance from 1980 to 1983 as increases in debt interest payments offset significant discretionary moves to reduce budget deficits in many countries (Table 1). In the United States, there were rapid increases in government spending on defence and interest payments, and large tax reductions which offset some of the inflation- reducing effects of monetary restraint. Fiscal policies were also expansionary in France, Italy and Canada. In Germany and Japan throughout most of the first half of the 1980s, and in the United Kingdom from 1980 to 1982, fiscal policies were restrictive, reflecting the widespread concern over the sustainability of government debt positions. For the smaller countries as a group, structural budget balances were broadly stable from 1980 to 1983.
Macroeconomic developments in the early 1980s were importantly affected by the policy mix adopted in the United States. After the initial rise in real interest rates from 1979 to mid-1982, the combination of continued monetary restraint and growing fiscal deficits resulted in continuing high real interest rates in the United States. In other countries, monetary policies remained uniformly restrictive as countries attempted to defend their currencies against the rise of the dollar. High levels of real interest rates thus became a global phenomenon in the early 1980s and remained a feature of the economic environment until about 1985.
Real output growth slowed from 1979 and, for the OECD area as a whole, was negative in 1982. Average annual real output growth in the three years from 1979 to 1982 was barely 3/4 per cent - the most protracted period of slow growth in the postwar period - followed by a relatively moderate 23/4 per cent in 1983, the first year of recovery. In the United States, there was a "double-dip" recession with declines in real output in 1980 and 1982. Japan was the only OECD country which did not experience a recession or major slowdown in real growth in the early 1980s.
Unemployment rates increased in virtually all OECD countries during this period and reached postwar highs in many countries. In 1983, the average unemployment rate in the seven largest economies taken together was 8 per cent, and almost 12 per cent in the smaller economies. Among the major countries, the increase in the unemployment rate was greatest in Canada and Europe, and relatively small in Japan.
An early signal of a turn-around in the worldwide inflation climate, and possibly also in inflation expectations, came from non-oil commodity prices (Chart B).
95

Table 1. The 1980 to 1987 disinflation Percentage growth except where noted
1980 1981 1982 1983 1984 1985 1986 1987
Inflation8 Total OECD Major seven economies
United States Japan Four major European economies
Smaller economies
Real GDP growth Total OECD Major seven economies
United States (0 Japan a, Four major European economies
Smaller economies
Unemployment ratesb Total OECD Major seven economies
United States Japan Four major European economies
Smaller economies
Effective exchange rates' United States Japan Germany
United States Japan Germany
Short-term interest rates'
10.2 9.5 9.1 3.8 13.0 13.9
1.1 1 .o
-0.2 4.3 1.0 2.0
6.2 5.6 7.2 2.0 5.6 8.4
90 100 110
11.4 10.9 9.5
9.2 8.8 9.6 3.2 10.4 11.4
1.6 1.7 1.9 3.7 0.2 0.6
7.0 6.4 7.6 2.2 7.3 9.3
110 110 I00
14.0 7.4 12.1
7.4 6.7 6.4 1.9 9.3 11.4
- 0.4 -0.6 - 2.5 3.1 0.8 0.8
8.4 7.8 9.7 2.3 8.4 10.4
120 90 90
10.6 6.9 8.9
5.2 4.6 3.9 0.8 7.7 9.0
2.7 2.9 3.6 3.2 1.6 1.6
8.9 8.1 9.6 2.6 9.3 11.7
120 100 90
8.6 6.4 5.8
4.7 3.9 3.7 1.2 5.5 9.2
4.9 5.2 6.8 5.1 2.7 3.4
8.5 7.5 7.5 2.7 9.7 12.2
140 100 90
9.5 6.1 6.0
4.2 3.5 3.2 1.4 5.3 8.0
3.2 3.2 3.0 4.7 2.4 3.3
8.4 7.4 7.2 2.6 9.9 12.2
140 100 80
7.5 6.5 5.4
3.8 3.1 2.6 1.9 4.6 7.7
2.7 2.8 2.9 2.4 2.6 2.7
8.3 7.3 7.0 2.8 10.1 11.7
110 140 100
6.0 4.8 4.6
3.2 2.7 3.0 -0.2 3.5 6.4
2.7 2.8 2.7 3.5 2.3 2.6
7.9 7.0 6.2 3.0 10.0 11.5
100 160 120
5.8 3.5 3.9

_.--- "."..", J.'....' Total OECO Major seven economies
United States Japan Four major European economies
Smaller economies
Ratio of cyclicallyadjusted
Total OECO Major seven economies
government lending to GDPb
United States Japan Four major European economies
Smaller economies
10.4 10.7 10.6 9.6 10.3 10.2 8.0 9.4 9.3 9.2 8.9 9.2
10.8 11.7 12.3 15.2 12.8 12.8
11.2 8.4 9.6 9.0 9.1 10.8 7.9 9.0 8.5 8.9 12.5 8.0 8.9 8.0 7.3 7.4 7.8 8.4 8.7 9.8
10.7 8.2 9.3 9.0 10.6 13.3 11.6 13.3 12.4 10.4
-1.8 -1.6 -1.6 -1.7 -1.4 -1.5 -0.2 0.2 -0.3 -4.1 -3.5 -3.0 - 2.5 -2.7 -2.0 - 2.2 -2.5 -2.4
-2.3 -2.4 -1.9 -1.8 -2.1 -1.8 -2.1 -2.3 -2.4 -1.9 -1.0 -1.7 -2.5 -2.9 -2.2 -2.8 -1.7 -0.8 -0.7 -0.1 -1.8 -1.9 -1.8 -1.9 -1.7 -2.4 -2.2 -2.5 -2.0 -1.5
Memorandum items: OECO import price of oil (cif dollars per barrel) 32.9 36.3 33.9 30.0 29.0 27.5 15.0 18.0
CO Non-oil commodity prices 13.3 -14.7 -14.3 5.9 0.5 -9.7 2.7 8.8 a/ As measured by the GDP deflator. bJ Per cent. c/ Index of effective exchange rates, 1978 1-100.
4

Minerals and metals prices, which are generally considered to be sensitive to demand conditions and inflation expectations, peaked in the first quarter of 1980. These and other non-oil commodity prices, which had been increasing faster than OECD manufactures export prices in the late 1970s, declined substantially from 1980 to 1982. Relative to OECD manufactures export prices the decline in non-oil commodity prices from 1981 to 1982 was dramatic. Real and nominal non-oil commodity prices recovered somewhat in 1983 with the pick-up in OECD growth.
OECD inflation, as measured by the growth of the GDP deflator, declined substantially and in 1983 was only half as fast as in 1980. Among the larger economies, comparatively small declines in inflation of about 1 l/z to 2 percentage points occurred in Japan and Germany, starting from relatively low rates of inflation, and in France. In the United Kingdom, inflation declined from 19.6 per cent in 1980 to 5.3 per cent in 1983. Inflation in the smaller countries as a group declined by 5 percentage points from 1980 to 1983, the same decline as in the major seven countries but from a higher base.
B. Slow growth and continued disinflation: 1983 to 1987
A remarkable feature of the 1983 to 1987 recovery was that inflation did not reaccelerate; indeed it continued to decline. This was particularly surprising in light of the significant easing of monetary policies in the three major economies after mid- 1985. The continued unwinding of inflation reflected, in part, the generally moderate pace of real growth, which averaged less than 3% per cent in the four years after the recession compared with 4 per cent in the previous upswing from 1976 to 1979. In OECD Europe, real growth averaged only 2l/2 per cent per year from 1983 to 1987. With the United States a notable exception, unemployment rates generally remained high or increased even further. These high levels of unemployment continued to exert downward pressure on nominal wage growth throughout the recovery, although the importance of this undoubtably differed considerably from country to country.
Exchange-rate developments may have also played an important role in restraining OECD-wide inflation. The substantial appreciation of the dollar from 1980 to early 1985 contributed to disinflation in the United States during a period of expansionary fiscal policies. The corresponding inflation-increasing impacts in depreciating countries were offset by generally restrictive fiscal policies and commodity price declines. Outside the United States, large fluctuations in profit margins on foreign and domestic markets also damped the inflation effects of exchange-rate fluctuations. This was apparent when non-dollar currencies were depreciating in the period to early 1985, as well as when the dollar subsequently depreciated.
98
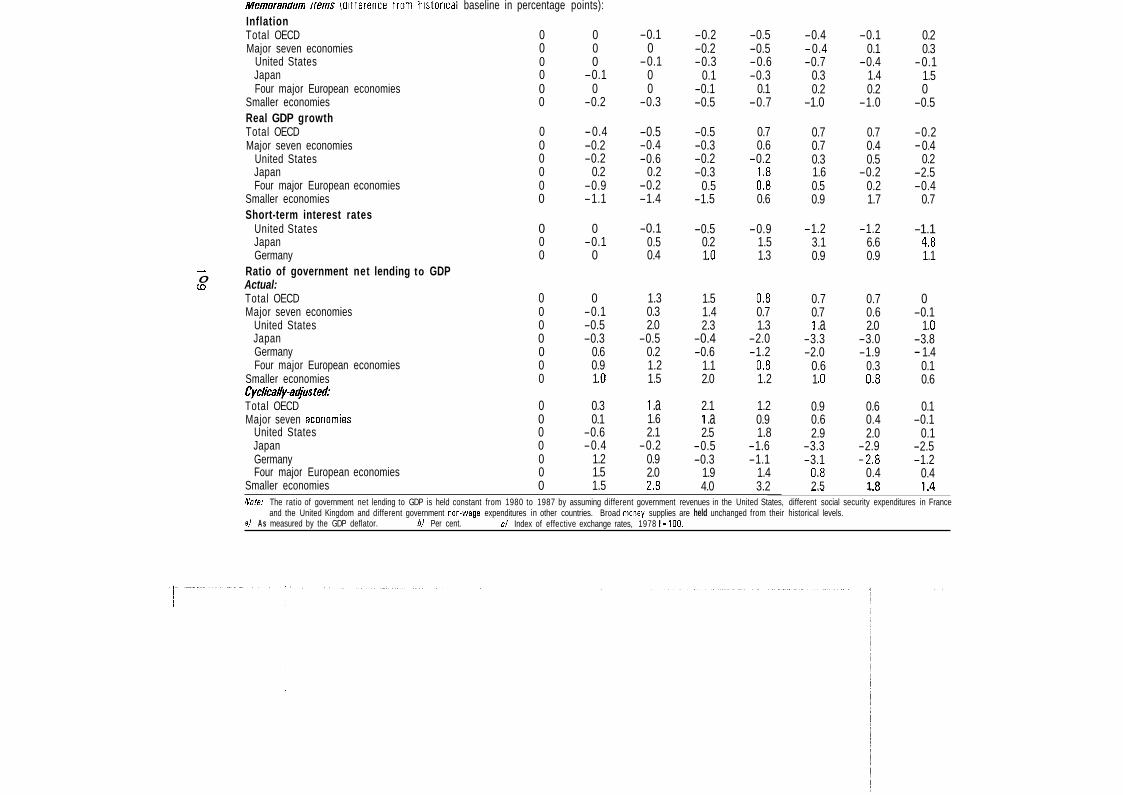
The broad stability of nominal non-oil commodity prices and the sharp declines in real prices from 1984 to early 1987 contributed to further disinflation in the OECD area. The weakness of non-oil commodity prices during a period of sustained, albeit moderate, economic growth was related to a number of structural factors. These included, for example, the continuing rise in agricultural assistance in most OECD countries which contributed to pervasive excess supplies on world agricultural markets; the declining use of metals in OECD production; and competition from new materials. A possibly important additional factor in the 1980s was the LDC debt crisis. Downward pressures on commodity prices increased as heavily-indebted commodity-producing countries sought to increase output in order to increase export earnings.
The enormous increases in oil prices in the 1970s were closely related to specific actions taken by OPEC. The extent to which OPEC can influence the world price of oil is determined not only by the degree to which its members can control oil production, but also by the economic environment in OECD countries. In the 1970s OPEC controlled most of the world's excess oil supply and there was relatively strong growth in the OECD area with a correspondingly strong demand for petroleum. In these circumstances, OPEC was able, for a period, to exert a significant influence on oil prices by controlling production.
In the 1980s the situation became very different. Real growth in the OECD was generally weak and the intensity of petroleum use had fallen from the 1970s in response to high prices. High prices had also called forth larger supplies from non-OPEC producers, who came to control a much larger share of world oil supply and tended to have excess capacity. Under these circumstances OPEC was unable to control world oil production and consequently had little influence on oil prices. After reaching a peak of $36 per barrel in early 198 1, the average price of OECD oil imports declined steadily to $26 per barrel in late 1985. The price then plunged to $1 1 per barrel in early 1986 before recovering to about $1 6 per barrel. This latter decline undoubtedly prolonged the disinflation process at a time when it had been in danger of petering out.
Throughout the 1980s, OECD governments placed increased emphasis on improving economic performance through structural reforms (OECD, 1 988). These reforms, by removing tax distortions, promoting deregulation and increasing competition, contributed to the disinflation process. In many countries, there were structural changes in the 1980s affecting labour markets (Chan-Lee et al., 1987; Emerson, 1987): union membership declined and the bargaining power of trade unions was moderated; indexation rules were changed to slow the dynamics of wage-price interaction, although this may have retarded the downward adjustment of wage growth during a period of rapid disinflation; minimum wages were held constant in nominal terms and/or allowed to decline in real terms or relative to average wages; and unemployment insurance replacement ratios declined.
99

Industries such as finance and transportation were deregulated with a resulting increase in competition, on both labour and product markets. More competitive behaviour was also stimulated by a changing sectoral composition of output and employment. In many countries, the pattern of economic growth in the 1983 to 1987 upswing was biased against sectors with unionised labour and less competitive market structures. The production base in OECD countries of industries such as steel, shipyards and mining declined. Other sectors, such as automobiles and consumer electronics, were subject to intense price competition from Japan and South-East Asia. Reduced demand for capital goods from debt-constrained LDCs, as well as from OPEC and centrally-planned economies, also contributed to the reallocation of resources towards activities with more competitive wage and price formation.
By 1987, inflation in the OECD area as measured by the growth of the GDP deflator had been reduced to 3’14 per cent; in terms of half-yearly growth rates, the disinflation process ended in the first half of 1987. In the seven major economies, average inflation in 1987 was only Z3’4 per cent, but remained relatively high at about 6’12 per cent for the smaller countries taken as a group. Nevertheless, inflation differentials between OECD countries had been reduced significantly4. Measured by the growth of consumer price indices, the disinflation process bottomed out earlier as the sharp decline in oil prices reduced the CPI inflation rate to 2% per cent in 1986 for the OECD area as a whole.
11. A DECOMPOSITION OF THE SOURCES OF THE 1980 TO 1987 DlSlNFLATlON
It is clear that changes in economic policies as well as developments in oil and non-oil commodity prices contributed to the 1980 to 1987 disinflation. Changes in commodity prices are to some extent autonomous but are also affected by economic policies; changes in policies can be considered autonomous, although some would argue that these also are, in a broad political economic sense, endogenous. The OECD INTERLINK model has been used to quantify the ultimate autonomous sources of the 1 980 to 1 987 disinflation through internationally-linked counter-factual simulations. The basic idea is to estimate the inflation effects of:
Economic policies with simulations which assume that policies, particu- larly monetary policies, had remained accommodative of existing inflation in the late 1970s and of the second oil price shock; Commodity prices with simulations which assume that oil prices had remained constant after 1979 and that there were no downward autonomous effects on non-oil commodity prices.
i)
ii)
100

Counter-factual simulations are also done to assess the contribution to the disinflation process from other autonomous factors and from exchange-rate changes. Chart D and Table 2 summarise the key results. Each counter-factual simulation reported in Table 2 has been done independently and the simulations are
10.5
10.0
9.5
9.0
8.5
8.0
7.5
7.0
6.5
6 .0
5.5
5.0
4.5
4.0
3.5
3.0
2.5
2.0
- -
- -
- - -
- .-
-
-
- -
-
-
- -
-
CHART D
COUNTER-FACTUAL SIMULATIONS ILLUSTRATING THE IMPACT ON OECD INFLATION
OF ACCOMMODATING MONETARY POLICIES AND UNCHANGED OIL AND NON-OIL COMMODITY PRICES (a)
-
-
-
-
- - -
OECD inflation as measured by the growth of the GDP deflator
10.0
9.5
9.0
8.5
8.0
7.5
7.0
'. \\\. Unchanged autonomous '\,\. impacts on non-oil ,._'*, commodity prices
-
-
-
-
-
-
-
-
-
-
Historical baseline
6.5
6.0
5.5
5.0
4.5
4.0
3.5
3.0
2.5
2.0
I I I I I I I 1.5 1.5 1980 1981 1982 1983 1984 1985 1986 1987
a) Seetextforadescriptionofthesimulationswhicharereported in Tables 2 to 5.
101

Table 2. The impact on OECD inflation from counter-factual simulationsa Differences from baseline in the growth of the OECD GDP deflator, in percentage points
1987 Cumulated difference 1980 1981 1982 1983 1984 1985 1986
Accommodating monetary policies: Unchanged nominal short-term
interest rates" 0.2 1.1 2.3 3.0 2.6 2.4 2.0 1.4 15.0 Unchanged real long-term interest rates 0.2 1.2 2.1 2.2 1.8 2.3 2.1 1.5 13.4
Unchanged fiscal policies' 0 0 -0.1 -0.2 -0.5 -0.4 -0.1 0.2 -1.1 Unchanged oil prices" ' 0 0.1 0.3 0.8 1.1 1.5 2.4 2.2 8.4 No autonomous impacts on
non-oil commodity pricesb 0 0 0.1 0.3 0.1 0.2 0.3 0.4 1.4 Unchanged participation rates 0 0.2 0.2 0.5 0.5 0.5 0.3 0.5 2.7 No autonomous impacts on wage behaviour 0.6 1.7 2.1 1.5 1 .o 0.6 -0.3 -0.7 6.5
-. No autonomous impacts on exchange rates 0 0.3 0.3 0.3 0.6 0.8 1.1 0.1 3.5 8 Memorandum items: impact on
non-oil commodity prices: From' unchanged nominal
short-term interest rates 0.4 2.5 3.4 2.1 3.6 5.0 6.0 3.7 26.7 From unchanged oil prices 0 0.9 2.1 4.5 4.4 1.9 15.3 4.2 33.3 From unchanged autonomous factors 0 5.1 10.3 -8.4 3.7 7.9 -1.5 5.0 22.1
aJ See text for a discussion of the specification of the simulations. bJ The inflation impacts from these simulations are shown in Chart D. cl These simulations are reported in detail in Tables 3 to 5.

not necessarily additive, although they are shown that way in the Chart5. Details on three of the key counter-factual simulations are given in Tables 3 to 5; the historical baseline is reported in Table 1.
Each counter-factual simulation illustrates an alternative history where some autonomous element which contributed to the 1980 to 1987 disinflation is assumed absent. The basic methodology is similar to that used by Eckstein (1 978) to analyse the mid- 1970s recession in the United States, and by Shafer ( 1988) to analyse the implications for other countries of the U.S. current account deficit of the 1980s. The results of such an analysis are, of course, model dependent. Although comparisons of simulation properties indicate that INTERLINK is in the mainstream of linked macroeconomic models (Bryant et al., 19881, models with fundamentally different theoretical frameworks - for example, models where wages, prices, interest rates and exchange rates are set on the basis of perfect foresight - might give qualitatively different results. The appendix contains a brief summary of how the inflation process is modelled in INTERLINK and the tracking performance of the wage-price and non-oil commodity price blocks.
A. The impact of morietary policies
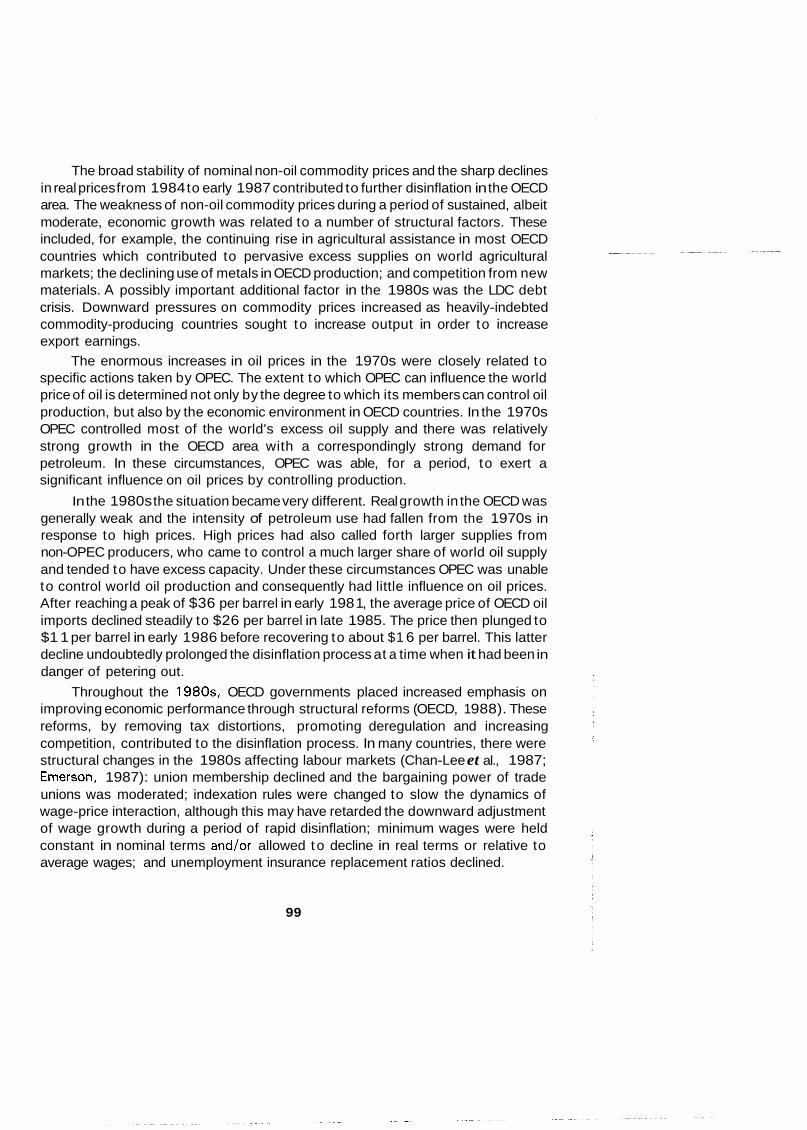
The disinflationary impact of the OECD-wide tightening of monetary policies was estimated in a linked counter-factual simulation in which monetary policies were assumed "accommodating" in the sense that short-term nominal interest rates were constrained from rising above their average level in the second half of 1978 - about 8 per cent in the United States and 4 per cent in Japan and Germany compared with actual rates in 1980 of 1 1.4, 10.9 and 9.5 per cent, respectively. In the simulation, interest rates do not fall below these levels because of the pressure from higher levels of nominal income and hence money demand. An alternative assumption of unchanged real long-term interest rates gives broadly similar results to those discussed below (as shown in Table 2). Real government non-wage expenditures were assumed to remain at their historical levels in these simulations.
More detailed results of the fixed nominal interest rate simulation are reported in Table 3. To prevent short-term nominal interest rates from rising, the growth of broad money supplies in the OECD would have had to have been about 3 percentage points higher in 1980 to 1983. Real growth in the OECD area would have been between 1 and 1% per cent higher in 1980 to 1982, but quite similar to the historical baseline thereafter. In 1982, the recession year, all countries except the United States would have registered modest growth rates. Unemployment would have been 3/4 to 1 per cent lower on average over the 1980 to 1987 period. The maximum impact of unchanged nominal short-term interest rates would have been to increase inflation in the OECD area by 3 percentage points in 1983, and by about 1 l/3 percentage points in 1987. Thus, fully 3 of the total 5 percentage point decline
103

Table 3. Counter-factual simulation of "accommodating" monetary policies Percentage growth except where noted
1980 1981 1982 1983 1984 1985 1986 1987
Inflationa Total OECO Major seven economies
United States Japan Four major European economies
Smaller economies
Real GDP growth Total OECD Major seven economies
United States A Japan P Four major European economies 0
Smaller economies
Unemployment ratesb Total OECD Major seven economies
United States Japan Four major European economies
Smaller economies
Effective exchange ratesc United States Japan Germany
United States Japan Germany
Short-term interest ratesb
10.4 9.9 9.6 3.5
13.5 13.5
2.0 2.0 0.6 6.2 1.9 2.2
6.0 5.3 6.7 2.0 5.5 8.5
90 100 110
7.9 4.3 3.8
10.3 10.2 11.2 4.3
11.7 10.8
3.0 3.3 3.4 5.7 1.4 1.1
6.4 5.6 6.3 2.1 6.9 9.3
110 110 100
7.9 4.3 3.8
9.7 9.4 9.8 3.8
11.6 11.5
1 .o 1 .o
-0.8 4.2 1.7 1.5
7.3 6.5 7.4 2.2 7.9
10.2
120 100 90
7.9 4.3 3.8
8.2 8.0 8.0 3.4
10.5 9.2
2.7 2.8 2.9 3.2 2.0 2.0
7.9 7.0 7.7 2.5 8.9
11.2
120 100 90
7.9 4.3 3.8
7.3 6.9 7.5 3.6 8.0 9.5
4.4 4.6 5.6 4.5 2.9 3.2
7.9 6.8 6.8 2.6 9.6
11.6
130 110 80
7.9 4.3 3.8
6.6 6.2 6.7 3.4 7.2 8.6
3.2 3.2 2.8 4.5 2.8 3.2
7.9 7.0 7.0 2.5 9.9
11.7
140 110 80
7.9 4.3 3.8
5.8 5.3 5.4 3.7 6.1 8.8
2.5 2.4 2.0 2.4 2.8 2.6
8.0 7.1 7.6 2.6
10.1 11.2
110 140 90
7.9 4.3 1.8
4.6 4.0 4.4 1.2 4.6 8.0
2.0 1.9 1.5 3.0 2.0 2.5
7.9 7.1 7.7 2.8 9.9
10.9
90 160 110
7.9 4.3 3.8
trroaa money growtn Total OECD 13.5 14.8 14.0 13.0 10.8 11.2 9.9 8.9
Memorandum items (difference from historical baseline
Inflation Total OECO Major seven economies
in percentage points):
United States Japan Four major European economies
Smaller economies
Real GDP growth Total OECD Major seven economies
United States Japan Four major European economies
0 v1 Smaller economies
Short-term interest rates United States Japan Germany
0.2 1.1 2.3 3.0 2.6 2.4 2.0 1.4 0.4 1.4 2.7 3.4 3.0 2.6 2.2 1.3 0.5 1.6 3.4 4.1 3.8 3.5 2.8 1.4
-0.3 1.1 1.9 2.6 2.4 1.9 1.9 1.4 0.5 1.3 2.3 2.8 2.5 1.9 1.5 1.1
-0.4 -0.6 0.1 0.2 0.3 0.6 1.1 1.6
0.9 1.4 1.4 0 -0.5 0 -0.2 -0.7 1 .o 1.6 1.6 -0.1 -0.6 0 -0.4 -0.9 0.8 1.5 1.7 -0.7 -1.2 -0.2 -0.9 -1.2 1.9 2.0 1.1 0 -0.6 -0.2 0 -0.5 0.9 1.2 0.9 0.4 0.2 0.4 0.2 -0.2 0.2 0.5 0.7 0.4 -0.2 -0.1 -0.1 -0.1
-3.5 -6.1 -2.7 -0.7 -1.6 0.5 2.0 2.1 -6.6 -3.1 -2.6 -2.1 -1.8 -2.2 -0.5 0.8 -5.7 -8.3 -5.0 -1.9 -2.2 -1.6 -0.8 -0.1
Non-oil commodity price growth 0.4 2.5 3.4 2.1 3.6 5.0 6.0 3.7 /Vote: Nominal short-term interest rates have been held constant at their 1978 II level. Real government non-wage expenditures are held unchanged from their historical levels. aJ As measured by the GDP deflator. b) Per cent. CJ Index of effective exchange rates, 1978 1-100.

in OECD inflation during the 1980 to 1983 period may have been attributable to the adoption of restrictive monetary policies by OECD countries. The declining role of monetary policies in the 1984 to 1987 period reflects the easing of monetary conditions as inflation continued to unwind under the pressure of declining oil prices.
The simulation results suggest that the disinflationary impacts of monetary policies were more important in the United States than in Japan and Europe. For 1983, for example, it is estimated that inflation would have been about 4 percentage points higher in the United States, but less than 3 percentage points higher in Japan and Europe. These inter-country differences reflect the extent to which real activity and unemployment vary endogenously in the counter-factual simulation, and the consequent responses of wages and prices. In general, both the elasticity of wages with respect to the unemployment rate, and of prices with respect to excess demand, are higher in the United States than in the European countries.
It must be stressed that inflation expectations are assumed to be adaptive in these simulations, and to have relatively small effects on long-term interest rates. Moreover, there are no mechanisms whereby higher inflation would have adverse effects on consumer or business confidence, although higher inflation does increase the personal savings rate in some countries. The counter-factual accommodating monetary policy simulation may be unrealistic in the sense that the results do not reflect changes in behaviour which might have been expected in the more inflationary environment - the Lucas critique (Lucas, 1976). On the other hand, it could be argued that the restrictive policies actually adopted represented more of a change in policy regime than did the assumed accommodating policies, which can be characterised as a continuation of the policies of the 1970s in many OECD countries.
B. The impact of fiscal policies
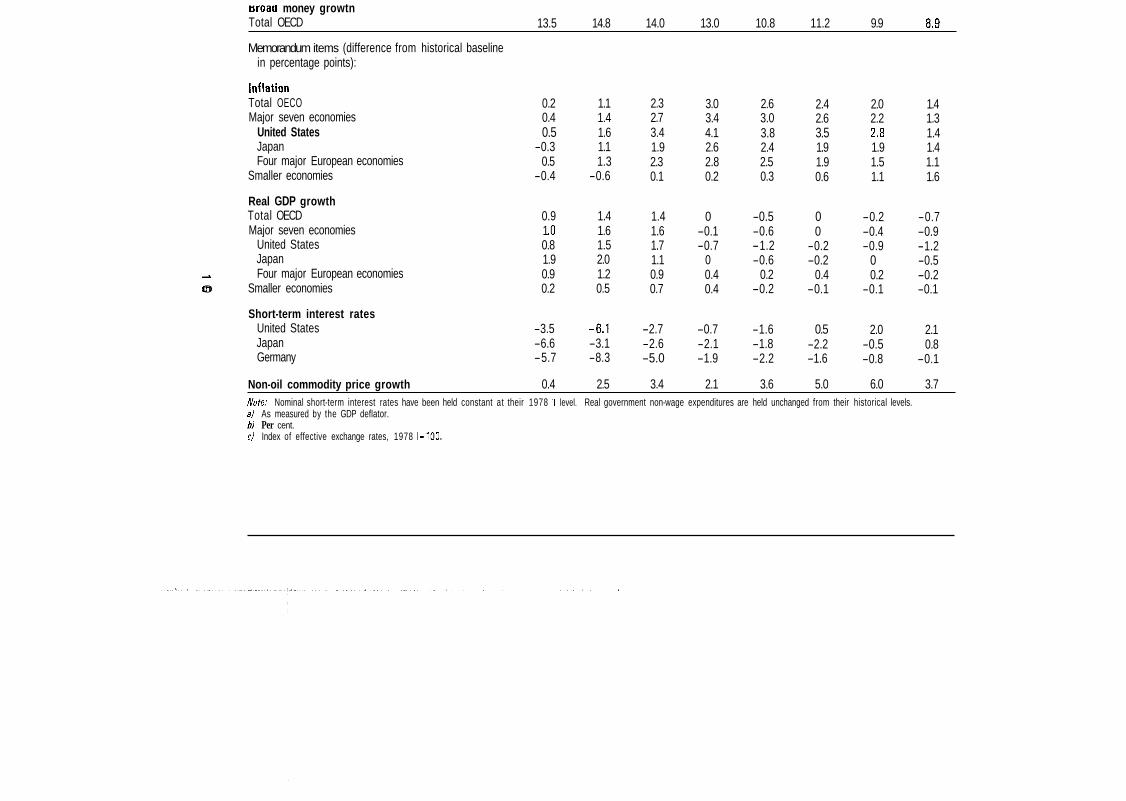
The inflation impact of the fiscal policies actually adopted was estimated by assuming that government non-wage expenditures (tax revenues in the case of the United States and social-security transfers for France and the United Kingdom) developed in such a way as to result in an unchanged ratio of net government lending to GDP from 1980 to 1 9876. Broad money supplies were held a t their historical levels. The stabilization of ex post government deficit/GDP ratios is not obviously "accommodating" because of the impact of automatic stabilizers and because discretionary fiscal policies were not restrictive in all countries (cf. memorandum to Table 4).
For the total OECD, the inflation impacts of unchanged ex post fiscal policies in the above sense are minor (Table 4). This essentially reflects very different estimated inflation effects in the United States and Japan, and within Europe. If
106

taxes in the United States had not been lowered in the early 1980s, but had instead remained broadly stable relative to GDP, the simulation results suggest that inflation might have been about % percentage point lower on average over the 1983 to 1986 period. In Japan, restrictive fiscal policies may have lowered the inflation rate by as much as 1 % percentage points. Among the major European countries, there were also offsetting fiscal policy effects: restrictive for Germany and the United Kingdom, expansionary for France and Italy. On balance, fiscal policy changes (as defined above) are estimated to have increased inflation by between '12 and 1 percentage point in the smaller countries from 1983 to 1987.
C. The impact of oil and non-oil commodity prices
Oil prices are exogenous in INTERLINK although it is clear, as argued above, that economic conditions in the industrialised economies provide the environment in which OPEC operates. Table 5 reports the results of a simulation in which the nominal OECD energy import price is maintained at its 1981 first-half level of $36 per barrel. Short-term nominal interest rates and real government non-wage expenditures are held a t their historical levels7. Had energy prices not declined, it is estimated that OECD inflation would have been about '13 percentage point higher in 1982, and about 1 percentage point higher in 1983 and 1984. The contribution of oil price declines to OECD disinflation increased in 1985 and 1986, when it is estimated to have been about 2% percentage points.
Non-oil cornrnodityprices are endogenously determined in INTERLINK by OECD growth, inflation and interest rates - all of which are themselves endogenous in INTERLINK - and by world oil prices and autonomous technological and supply factors. In the accommodating monetary policy simulation discussed above, it is estimated that the growth of non-oil commodity prices would have been almost 4 percentage points higher on average over the 1981 to 1987 period (cf. the memorandum items to Table 2). In the constant oil-price simulation, it is estimated that the growth of non-oil commodity prices would have been almost 5 percentage points higher on average from 1981 to 1987, with the largest impact in 1986.
The autonomous determinants of non-oil commodity prices are time trends, which are proxies for ongoing technological developments exerting a negative impact on non-oil commodity prices, and the residuals in the non-oil commodity price equations, which may partly represent supply-side factors such as weather conditions and other shocks. A counter-factual simulation was done where time trends were kept unchanged from their 1981 first-half values and residuals were held constant a t their average levels from 1979 to 198 1. The estimated impacts on non-oil commodity prices from these autonomous factors are quite volatile, and on average less than the impact from the accommodating monetary policy or the unchanged oil price simulations. The change in non-oil commodity prices due to
107

Table 4. Counter-factual simulation of unchanged fiscal policies Percentage growth except where noted
1980 1981 1982 1983 1984 1985 1986 1987
Inflationa
Total OECD Major seven economies
United States Japan Four major European economies
Smaller economies Real GDP growth Total OECD Major seven economies
United States Japan Four major European economies
0) Smaller economies
A
0
Unemployment r a t e d Total OECD Major seven economies
United States Japan Four major European economies
Smaller economies Effective exchange ratesc
United States Japan Germany
United States Japan Germany
Broad money growth Total OECD
Short-term interest ratesb
10.2 9.5 9.1
13.0 13.9
1.1 0.9
-0.2 4.3 1 .o 2.0
6.2 5.6 7.2 2.0 5.6 8.4
90 100 110
11.4 10.9 9.5
10.4
3.8
9.2
9.6 3.1
10.4 11.2
1.2 1.5 1.9 3.9
-0.7 -0.5
8.8
7.0 6.4 7.6 2.2 7.4 9.4
110 100 100
14.0 7.3
10.7
10.7
7.3 6.7 6.3 1.9 9.3
11.1
-0.9 -1.0 - 2.7
3.3 0.6
-0.6
8.6 8.0 9.8
8.8 2.3
10.6
120 100 90
10.5 7.4 7.0
10.6
5.0 4.4 3.6 0.9 7.6 8.5
2.2 2.6 3.0 2.9 2.1 0.1
9.3
9.9 2.6 9.7
12.1
120 100 90
8.1 6.6 4.2
11.2
8.5
4.2 3.4 3.1 0.9 5.6 8.5
5.8 5.6
6.6 6.9 3.5 4.0
8.8 7.8 8.0 2.7 9.9
12.5
140 100 90
8.6 7.6 7.0
8.4
3.8
1 .a 3.2 2.5
5.5 7.0
3.9 3.9 3.3 6.3 2.9 4.2
8.4 7.4 7.5 2.5
2.1
140 100 90
6.3 9.6
9.8
8.4
9.6
3.7 3.2 2.2 3.2 4.9 6.7
3.4 3.2 3.4 2.2
4.4
7.9 7.1 7.0 2.7
10.9
110 140 110
2.8
9.8
4.8
7.8 11.4
9.0
3.4 3.0 2.9 1.3 3.5 5.9
2.5 2.4 2.9 1 .o 1.9 3.3
7.4 6.7 6.0 2.9 9.7
10.1
100 160 120
4.7
4.1
9.1
8.3
Memorandum uems (oitterence trom nistorical baseline in percentage points): Inflation Total OECD 0 0 Major seven economies 0 0
United States 0 0 Japan 0 -0.1 Four major European economies 0 0
Smaller economies 0 -0.2 Real GDP growth Total OECD 0 -0.4 Major seven economies 0 -0.2
United States 0 -0.2 Japan 0 0.2 Four major European economies 0 -0.9
Smaller economies 0 -1.1 Short-term interest rates
United States 0 0 Japan 0 -0.1 Germany 0 0
Ratio of government net lending to GDP Actual: Total OECD 0 0 Major seven economies 0 -0.1
United States 0 -0.5 Japan 0 -0.3 Germany 0 0.6 Four major European economies 0 0.9
Smaller economies 0 1 .o Cyciicallya~us tek Total OECD 0 0.3 Major seven ecorlomies 0 0.1
Germany 0 1.2
A
0 CO
United States 0 -0.6 Japan 0 -0.4
Four major European economies 0 1.5 Smaller economies 0 1.5
-0.1 0
-0.1 0 0
-0.3
-0.5 -0.4 -0.6
0.2 -0.2 -1.4
-0.1 0.5 0.4
1.3 0.3 2.0
-0.5 0.2 1.2 1.5
1 .a 1.6 2.1
-0.2 0.9 2.0 2.8
-0.2 -0.5 -0.2 -0.5 -0.3 -0.6
0.1 -0.3 -0.1 0.1 -0.5 -0.7
-0.5 0.7 -0.3 0.6 -0.2 -0.2 -0.3 1 .a
0.5 0.8 -1.5 0.6
-0.5 -0.9 0.2 1.5 1 .o 1.3
1.5 0.8 1.4 0.7 2.3 1.3
-0.4 -2.0 -0.6 -1.2
2.0 1.2 1.1 0.8
2.1 1.2 1 .a 0.9 2.5 1.8
-0.5 -1.6 -0.3 -1.1
1.9 1.4 4.0 3.2
-0.4 -0.1 -0.4 0.1 -0.7 -0.4
0.3 1.4 0.2 0.2
-1.0 -1.0
0.7 0.7 0.7 0.4 0.3 0.5 1.6 -0.2 0.5 0.2 0.9 1.7
-1.2 -1.2 3.1 6.6 0.9 0.9
0.7 0.7 0.7 0.6 1 .a 2.0
-3.3 -3.0 -2.0 -1.9
0.6 0.3 1 .o 0.8
0.9 0.6 0.6 0.4 2.9 2.0
-3.3 -2.9 -3.1 -2.8
0.8 0.4
0.2 0.3
-0.1 1.5 0
-0.5
-0.2 - 0.4
0.2 -2.5 -0.4
0.7
-1.1
1.1 4.8
0 -0.1
1 .o -3.8 - 1.4
0.1 0.6
0.1 -0.1
0.1 -2.5 -1.2
0.4 2.5 1 .R 1.4 _ _ . ._ .. .
Note: The ratio of government net lending to GDP is held constant from 1980 to 1987 by assuming different government revenues in the United States, different social security expenditures in France
a/ A s measured by the GDP deflator. b/ Per cent. and the United Kingdom and different government non-wage expenditures in other countries. Broad nioney supplies are held unchanged from their historical levels.
c/ Index of effective exchange rates, 1978 1-100.

Table 5. Counter-factual simulation of unchanged oil prices Percentage growth except where noted
Inflationa
Total OECD Major seven economies
United States Japan Four major European economies
Smaller economies
Real GDP growth Total OECD Major seven economies
United States Japan -.L
-.L
0 Four major European economies Smaller economies
Unemployment ratesb Total OECO Major seven economies
United States Japan Four major European economies
Smaller economies
Effective exchange ratesc United States Japan Germany
United States Japan
Short-term interest ratesb
1980 1981 1982 1983 1984 1985 1986 1987
10.2 9.3 7.7 6.0 5.8 5.7 6.2 5.4 9.5 8.9 7.0 5.3 5.0 4.9 5.6 4.8 9.1 9.7 6.8 4.5 4.4 4.2 5.2 4.6 3.8 3.2 2.2 1.7 2.7 2.9 3.7 1.4
13.0 10.4 9.5 8.5 7.1 7.2 7.2 6.6 13.9 11.3 11.5 10.1 10.9 9.8 9.8 8.8
1.1 1.6 -0.4 2.7 4.8 3.1 2.9 2.3 0.9 1.8 -0.6 2.9 5.0 3.1 2.9 2.3
-0.2 2.0 -2.5 3.5 6.6 3.0 3.2 1.9 4.3 3.7 3.1 3.2 5.0 4.7 2.7 3.8 1 .o 0.3 0.9 1.7 2.6 2.2 2.4 1.9 2.0 0.6 0.9 2.0 3.6 3.2 2.8 2.7
6.2 7.0 8.3 8.8 8.3 8.2 7.9 7.7 5.6 6.4 7.7 8.0 7.4 7.2 6.9 6.8 7.2 7.6 9.6 9.4 7.4 7.1 6.1 6.0 2.0 2.2 2.3 2.6 2.7 2.6 2.8 3.0 5.6 7.3 8.4 9.2 9.5 9.7 10.0 9.9 8.4 9.3 10.4 11.5 11.8 11.8 11.3 11.0
90 110 120 120 140 140 110 100 100 110 90 100 100 100 140 160 110 100 90 90 90 90 110 120
11.4 14.0 10.6 8.6 9.5 7.5 6.0 5.8 10.9 7.4 6.9 6.4 6.1 6.5 4.8 3.5

YlUIlU lllullril Y l U W W L l l
Total OECD 10.4 10.7 10.8 11.7 9.2 10.6 10.6 10.9
Memorandum items (difference from historical baseline in percentage points):
Inflation Total OECD Major seven economies
United States Japan Four major European economies
Smaller economies
Real GDP growth Total OECD Major seven economies
United States Japan
-L -L Four major European economies .-L Smaller economies
Broad money growth Total OECD
Non-oil commodity price growth
OECB import price o f oi ld
0 0.1 0.3 0.8 1.1 1.5 2.4 2.2 0 0.1 0.3 0.7 1.1 1.3 2.5 2.1 0 0.1 0.4 0.6 0.7 1 .o 2.6 1.6 0 0 0.3 0.9 1.5 1.4 1.9 1.6 0 0 0.2 0.6 0.8 1.7 1.9 3.1 0 0.1 0.1 1.1 1.7 1.8 2.1 2.4
0 0 0 0 -0.1 -0.1 -0.2 -0.4 -0.2 0.1 0 0 -0.1 -0.1 0.1 - 0.5
0 0.1 0 -0.1 - 0.2 0 0.3 -0.8 0 0 0 0 -0.1 0 0.3 0.3 0 0.1 0.1 0.1 -0.1 -0.2 -0.2 -0.4 0 0 0.1 0.4 0.2 -0.1 0.1 0.1
0 0 0.2 0.5 0.6 1 .o 1.6 1.8
0
0
0.9 2.1 4.5 4.4 1.9 15.3 4.2
1 .o 3.4 7.3 8.3 9.8 22.3 19.4 Note: The OECO import price of oil is held constant at $36 per barrel (the actual level in 1981 I). Short-term interest rates and real government nowwage expenditures are unchanged from
a) As measured by the GDP deflator. bj Per cent. cl Index of effective exchange rates, 1978 1-100. d Dollars per barrel.
their historical levels.
,

these autonomous factors is estimated to have had a relatively small impact on OECD inflation (Table 2). The simulation results indicate that exogenous non-oil commodity price declines account for an average of '14 to '12 percentage point of the OECD disinflation, with the most important effects in Europe, the largest customer for internationally-traded raw materials.
The role of non-accommodating monetary policies in the 1980 to 1987 disinflation is estimated to have been much more important than were autonomous changes in oil and non-oil commodity prices - both with regard to initiating the disinflation process and to the total impact over the 1980 to 1987 period. As noted above, analyses of the 1980 to 1987 disinflation have often focused either on the decline in commodity prices or the rise in unemployment rates. Beckerman and Jenkinson (1 986) assume that the "turnaround in commodity prices was caused mainly by the strength and duration of the post- 1979 recession in the industrialised countries as a whole" (p. 39), but argue that the transmission mechanism was only through commodity markets. This is a direct implication of their empirical analysis which finds "no identifiable relationship between aggregate unemployment and wage inflation in most individual industrialised countries" (p. 5 1)- As Brown ( 1988) and Morin (1 988) point out, this result is inconsistent with most other empirical research including that embodied in INTERLINK where unemployment rates have important impacts on wages and measures of excess demand affect prices. Thus, in the counter-factual monetary simulation discussed above, the disinflationary impacts of restrictive monetary policies are transmitted through reduced demand in commodity, labour and product markets. Movements in commodity prices and unemployment rates are not independent, but both reflect, inter alia, changes in macroeconomic policies.
D. Other autonomous factors and exchange rates
Other autonomous factors also contributed to the 1980 to 1987 disinflation. During the early 1980s, there were increases in participation rates, particularly in North America and Japan, which may have been a t least partly autonomous. If participation rates had been unchanged from their level in 1 980, labour force growth and unemployment rates would have been lower, and it is estimated that OECD inflation might have been higher on average by about '14 to '/2 percentage point (Table 2). The average inflation impact may have been as large as 1 percentage point in Japan from 1980 to 1983 where there was a large increase in participation rates (from 7 1 per cent in 1979 to 73 per cent in 1983).
Structural policy measures affecting the labour market also contributed to the disinflation process in some countries. Their potential significance is suggested by the fact that wages in most OECD countries tended to increase more slowly over the 1980 to 1984 period than would have been suggested by past relationships summarised in estimated wage equations (cf. Appendix and Chan-Lee et al., 1987).
112

To estimate the effects of this “unusual“ wage behaviour, a counter-factual simulation was done where the residuals in the estimated wage equation were held constant at their 1979 second-half levels (Table 2). These autonomous influences on wage behaviour are estimated to have reduced OECD inflation by an average of more than 1 percentage point per year from 1980 to 1985. Among the larger economies, the most important impacts were in the four major European countriess. In the Netherlands, changes in indexation provisions and reductions in bonuses from 1980 to 198 1 may have reduced wage inflation by about 2 to 3 per cent on average over the 1982 to 1986 period. From 1986 to 1987, wage growth, although low, was higher than would have been predicted in light of high levels of unemployment, low inflation, etc.; it is estimated that this “unusual” wage behaviour may have increased OECD inflation by about ’h percentage point in these two years.
In the simulations discussed above, exchange rates are endogenous and essentially reflect interest-rate and inflation differentials together with a risk premium. Over the 1980 to 1987 period, exchange-rate movements clearly reflected factors additional to these “fundamentals”, at least as their effects can be reliably measured; this is indicated by the large errors in INTERLINK and virtually all other exchange-rate equations over this period. If the large swings in exchange rates are removed by holding constant the residuals in the exchange-rate equations at their 1979 first-half levels, the model gives a constant but small depreciation of the effective dollar exchange rate throughout the period. Although the impact on overall OECD inflation is small - an average increase of about % percentage point due to differences in lag structures across countries and the effects on non-oil commodity prices (Table 2) - there are relatively large offsetting effects across countries and over time within countries. For the United States, disinflation would have come more slowly, but been sustained longer: it is estimated that inflation would have been about 4 percentage points higher in 1985 when the actual appreciation of the U.S. dollar reached a peak, but essentially the same as in the historical baseline by 1987. The opposite occurs in the appreciating countries. For the four major European countries, inflation may have been about 3 percentage points lower in 1985 and 1 l h percentage points higher in 1987. In Japan, the main impact is in 1986 and 1 987 when inflation may have been about 2 percentage points higher.
SUMMARY AND POLICY IMPLICATIONS
The results of the decomposition of the sources of the 1980 to 1987
- The principal factors accounting for the disinflation were the restrictive monetary policies adopted in OECD countries;
disinflation can be summarised as follows:
113

- Restrictive fiscal policies also contributed to the disinflation process in most countries, although their inflation-reducing impact was much less significant than that of monetary policies; Even though a large part of the changes in non-oil commodity prices remains unexplained, it seems as if changes in such prices were not a major independent contributor to the decline in OECD inflation; Declines in oil prices, which undoubtedly also reflected policy-related developments in the OECD area, contributed relatively little to the disinflation process in the 1980 to 1983 period when most of the decline in OECD inflation occurred, but played an important role in sustaining the disinflation process after 1985;
- A variety of other factors, such as changes in participation rates, wage "moderation" and exchange-rate developments also contributed to the decline in OECD inflation.
Although the disinflation process had run its course by 1988, inflation in the OECD area still remains low by historical standards. Because low and stable inflation is widely regarded as one of the preconditions for sustained economic growth, and in light of the costs of disinflation, it is important that the current low-inflation environment be maintained. In the future, as in the past, autonomous supply shocks will have important effects on inflation in the short term. In response to shocks or inflationary pressures, monetary and fiscal policies can - in a very stylised sense - attempt to mitigate the implications for real activity by "accommodating" the increased inflation implied by the shock: alternatively, policies can be "non- accommodating" of the increase in inflation, thereby accepting the real output implications. These are the options that were open to monetary policies in the late 1970s.
The implications for real activity of non-accommodation may not be particularly severe in an environment where expectations of moderate inflation, closely contained by policies, encourage appropriate responses of wages and prices. After a long period of accelerating inflation such as occurred in the 197Os, the price of disinflation in terms of reduced output and unemployment was high. The OECD economies have, however, demonstrated their responsiveness to determined anti-inflation policies. In retrospect, it can be argued that it is less costly to maintain low inflation through non-accommodation of shocks as they occur, rather than to allow what might appear exante to be discrete, perhaps innocuous, increases in inflation to cumulate to levels that become economically and politically intolerable. This is the most important policy lesson from the disinflation of the 1980s.
-
-
114

NOTES
1.
2.
3.
4.
5.
6.
7.
8.
This section draws on the discussion of the analytical foundations and evolution of macroeconomic policy strategies in OECD countries from 1979 to 1987 contained in Chouraqui et al. (1 987). An extensive discussion of economic policies in OECD countries over the full postwar period is contained in Llewellyn et a/. (1 985) Chapters 2 and 3.
The 1982 to 1983 acceleration in the monetary aggregates in the United States occurred in the context of steadily declining inflation, reflecting a once-and-for-all increase in money demand rather than an aggressive easing of policies. Concern over third world debt was probably also a consideration (Chouraqui et al., 1987).
Emphasis on the credibility of policies was an early hallmark of the rational expectations or New Classical School. See Taylor (1 982) and the references cited therein.
More than half of OECD Member countries, however, still had inflation rates in excess of 4 per cent in 1987. The reduction of inflation differentials is apparent in the standard deviations of inflation rates across OECD countries based on GDP deflators (the first line is for all OECD countries, the second line excludes Greece, Iceland and Turkey):
1980 1981 1982 1983 1984 1985 1986 1987
21.3 11.3 10.8 16.4 11.2 10.3 8.1 7.8 5.6 4.6 4.4 5.5 4.9 4.6 4.8 3.8
It was not possible to combine all the exogenous changes into a single counter-factual simulation. After such an enormous percentage increase in oil prices as occurred in 1979, inflation would have receded considerably in any event. For this reason it is not interesting to attempt to allocate the total decline in inflation to that explained by various factors and that unexplained.
A plausible alternative would have been to assume unchanged ratios of structural or cyclically-adjusted government deficits to GDP. Because INTERLINK does not explicitly include a measure of structural budget balances, it was not possible to do such a simulation although cyclically-adjusted deficit ratios have been computed from the simulation results and are reported in the memorandum to Table 4. If broad moneysupplies had been held at their historical levels, i.e. if monetary policies had not "accommodated" the assumed oil price increases, aggregate inflation would have been on average between % and l/2 point lower per year in the 1982-87 period.
Cling and Meunier (1 9861, Minczeles and Sicsic (1 986) and Morin (1 988) estimate that price controls and the associated impacts on inflation expectations were major factors in the 1982 to 1985 disinflation in France. The inflation implications of other structural factors such as reduced union power, deregulation, increased competition, etc. are difficult to identify empirically. Because these structural changes are largely country-specific, they are unlikely to have had major effects on OECD-wide inflation trends.
115
Appendix
THE INFLATION PROCESS IN INTERLINK AND RECENT TRACKING PERFORMANCE
The specifications and properties of the INTERLINK wage-price blocks are described in Coe (1 9851, Chan-Lee et a/. (1 987) and Stiehler (1 987). A detailed description of the structure and full-model properties of INTERLINK is presented in Richardson (1 988). The Winter 1987 version of INTERLINK was used to do the linked simulations reported in Section II.
In linked simulations virtually all determinants of inflation are endogenous, the most important exceptions being the import price of oil and trend productivity growth. Nominal wages in INTERLINK are determined by an expectations-augmented Phillips curve in which the main determinants are the unemployment rate, the expected inflation rate (which is modelled on the assumption of adaptive expectations) and, depending on the country, labour productivity growth and the gap between the growth of private consumption and output deflators. Domestic price formation reflects short-run developments in domestic costs and excess demand pressures while ensuring long-run homogeneity with respect to a weighted average of domestic costs and world prices. The main determinants of expenditure deflators are the domestic value added deflator and appropriately weighted energy and non-energy import prices.
World prices of non-oil commodities are endogenously determined by OECD growth, inflation and interest rates, and by world oil prices and ongoing technological factors, the latter being proxied by time trends (Holtham and Durand, 1987). Long-run homogeneity with respect to the OECD price level is imposed. Changes in OECD activity affect the growth of non-oil commodity prices in the short run, but the level of OECD activity has no long-run impact on the level of non-oil commodity prices. Non-oil commodity prices determine the export unit values for food and raw materials for OECD countries and non-OECD regions. In linked simulations, export unit values determine import prices, which then influence domestic prices and wages.
Key elements determining the inflation response in simulations are the assumptions about monetary and fiscal policies. The transmission of a shock, whether monetary, fiscal or other, to wages is through labour market tensions and, for some countries, through the influence of short- to medium-term variations in productivity growth. The direct activity effects on prices are through movements in output relative to potential, but price movements also reflect the international transmission of demand and price pressures from trading partners and commodity markets. In simulations of monetary or other non-fiscal shocks, the effects on real activity, and hence inflation, will depend on whether non-wage government expenditures are held unchanged in real or nominal terms. Government revenues and wage expenditures are endogenous.
Fiscal policy simulations and simulations of exogenous shocks crucially depend on the assumed stance of monetary policy. In the case of an expansionary fiscal shock with non-accommodating monetary policy, i.e. where the money supply path is kept unchanged, short-term interest rates increase to keep money demand consistent with money supply. This interest-rate increase crowds out private investment and consumption, attenuating the impact on
116
prices. With accommodating monetary policies, i.e. where the path of nominal short-term interest rates is kept unchanged, the real activity effects and the ultimate inflation impacts are larger.
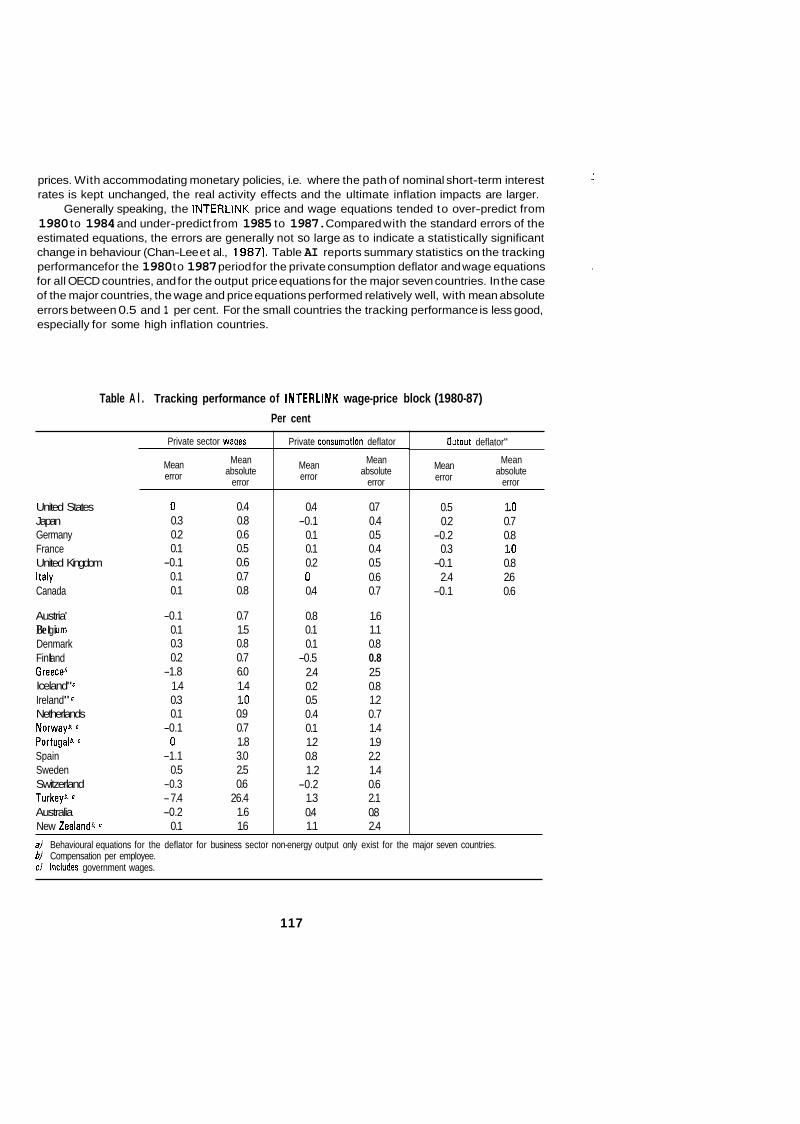
Generally speaking, the INTERLINK price and wage equations tended to over-predict from 1980 to 1984 and under-predict from 1985 to 1987. Compared with the standard errors of the estimated equations, the errors are generally not so large as to indicate a statistically significant change in behaviour (Chan-Lee et al., 1987). Table AI reports summary statistics on the tracking performance for the 1980 to 1987 period for the private consumption deflator and wage equations for all OECD countries, and for the output price equations for the major seven countries. In the case of the major countries, the wage and price equations performed relatively well, with mean absolute errors between 0.5 and 1 per cent. For the small countries the tracking performance is less good, especially for some high inflation countries.
Table A l . Tracking performance of INTERLINK wage-price block (1980-87) Per cent
Private sector wanes
Mean absolute
error
Mean error
United States 0 0.4 Japan 0.3 0.8 Germany 0.2 0.6 France 0.1 0.5 United Kingdom -0.1 0.6 Italy 0.1 0.7 Canada 0.1 0.8
Austria' -0.1 0.7 Be I g i u m 0.1 1.5 Denmark 0.3 0.8 Fin I and 0.2 0.7 Greece6 -1.8 6.0 Iceland" c 1.4 1.4 Ireland" c 0.3 1 .o Netherlands 0.1 0.9 Norwayr c -0.1 0.7 Portugalr c 0 1.8 Spain -1.1 3.0 Sweden 0.5 2.5 Switzerland -0.3 0.6 Turk@ c - 7.4 26.4 Australia -0.2 1.6 New Zealanda c 0.1 1.6
Private consumotion deflator
Mean absolute
error
Mean error
0.4 0.7 -0.1 0.4
0.1 0.5 0.1 0.4 0.2 0.5 0 0.6 0.4 0.7
0.8 1.6 0.1 1.1 0.1 0.8
-0.5 0.8 2.4 2.5 0.2 0.8 0.5 1.2 0.4 0.7 0.1 1.4 1.2 1.9 0.8 2.2 1.2 1.4
-0.2 0.6 1.3 2.1 0.4 0.8 1.1 2.4
Outout deflator"
Mean absolute
error
Mean error
0.5 1 .o 0.2 0.7
-0.2 0.8 0.3 1 .o
-0.1 0.8 2.4 2.6
-0.1 0.6
a) Behavioural equations for the deflator for business sector non-energy output only exist for the major seven countries. bl Compensation per employee. cl Includes government wages.
117

Table A2 reports summary statistics for the non-oil commodity price equations. There are relatively large errors in all the non-oil commodity price equations. The equations for the price of food, agricultural raw materials and metals and minerals have tended to overpredict while those for tropical beverages have tended to underpredict. In general there is no pattern in the equation residuals between 1980 and 1985, although large errors are present in almost all the equations in 1983. With the exception of the tropical beverages, the equations also tended to underpredict in 1986 and 1987, with large residuals in the agricultural raw materials and metals and minerals equations. The residuals can be taken to reflect supply shocks such as weather conditions and other exogenous factors which are not taken into account in the equations.
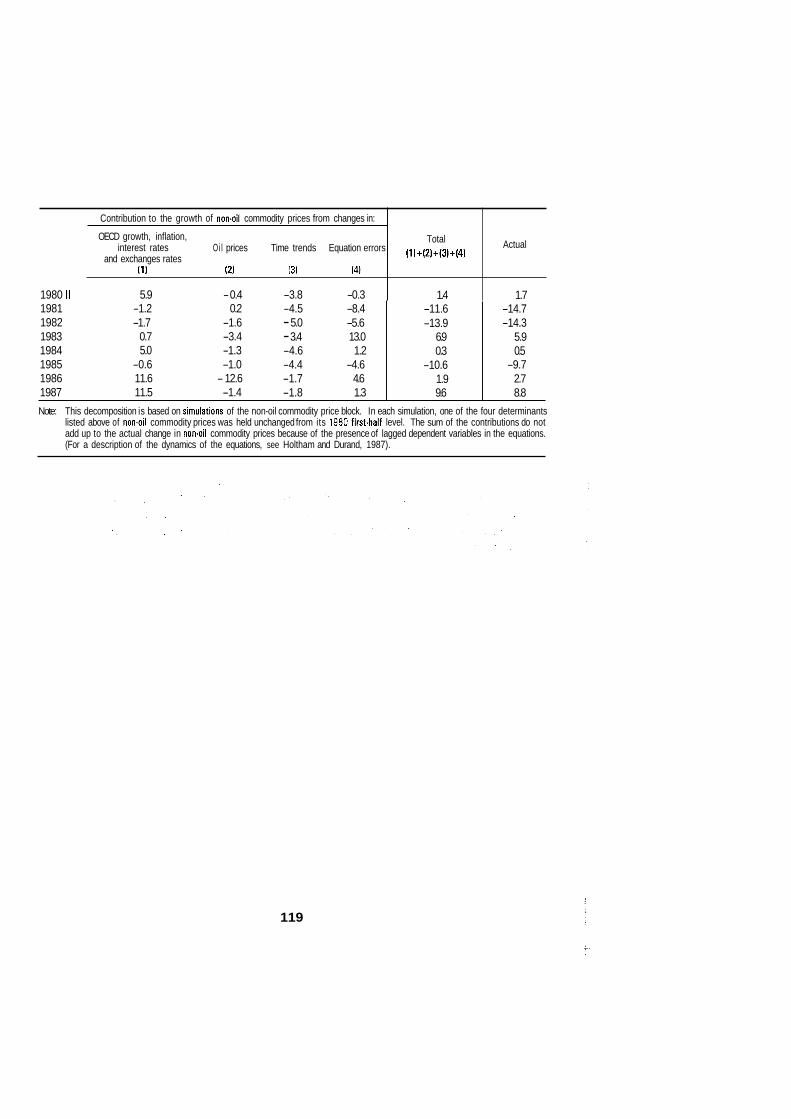
A decomposition of the 1980 to 1987 changes in non-oil commodity prices due to changes in the explanatory variables is presented in Table A3. This decomposition is based on simulations of the non-oil commodity price block where the determinants of these prices were held constant from their 1980 first-half levels. The decomposition presented in Table A3 is not comparable to the counter-factual simulations discussed in the text because i) there are no endogenous feedbacks from changes in oil prices, for example, to changes in OECD growth, inflation, etc., and iil the types and timing of the shocks are different. Over the 1981 to 1983 period, the time trends and equation residuals in the non-oil commodity price equations are estimated to have made the largest contribution to changes in non-oil commodity prices. From 1984 to 1987, it is estimated that developments in OECD economies, in particular movements in the dollar exchange rate, and the substantial decline in oil prices in 1986, were the main causes of changes in non-oil commodity prices.
~
Table A2. Tracking performance of INTERLINK non-oil commodity price block (1980-87) Per cent
Commodity price index
UNCTADa Food Tropical beverages Agricultural raw materials Metals and minerals
Weighted average
HWWAb Food Tropical beverages Agricultural raw materials Metals and minerals Weighted average
Mean error Mean absolute error
2.3 8.5 0 8.2 -2.5 4.6 -2.3 4.6 -1.6
-1.0 7.0 1.3 7.2
-3.5 6.2 -1.7 4.7 -1.4
aJ The UNCTAO price indices are weighted according to commodity exports and are used to determine non4lECD regions' export unit values. b) The HWWA price indices are weighted according to OECO commodity imports and are used to determine OECD countries' export unit values.
118
Contribution to the growth of nowoil commodity prices from changes in:
OECD growth, inflation,
and exchanges rates interest rates Oi l prices Time trends Equation errors
(1) (2) (3) (4)
1980 II 5.9 - 0.4 -3.8 -0.3 1981 -1.2 0.2 -4.5 -8.4 1982 -1.7 -1.6 - 5.0 -5.6 1983 0.7 -3.4 - 3.4 13.0 1984 5.0 -1.3 -4.6 1.2 1985 -0.6 -1.0 -4.4 -4.6 1986 11.6 - 12.6 -1.7 4.6 1987 11.5 -1.4 -1.8 1.3
Actual Total (1)+(2)+(3)+(4)
1.4 1.7 -11.6 -13.9
6.9 0.3
-10.6 1.9 9.6
-14.7 -14.3
5.9 0.5
-9.7 2.7 8.8
Note: This decomposition is based on simulations of the non-oil commodity price block. In each simulation, one of the four determinants listed above of non.oil commodity prices was held unchanged from its 1980 firsbhalf level. The sum of the contributions do not add up to the actual change in nonoil commodity prices because of the presence of lagged dependent variables in the equations. (For a description of the dynamics of the equations, see Holtham and Durand, 1987).
119
BIBLIOGRAPHY
Beckerman, W. and T. Jenkinson (1 9861, "What stopped the inflation? Unemployment or commodity prices?", Economic Journal (March), pp. 39-54.
Black, S. (1 987). "Accounting for the slowdown of inflation in OECD countries in the 1980s: how much is due to monetary policy?", presented to the American Economic Association meetings (December), mimeo.
Brown, A.J. (1 9881, "World depression and the price level", National Institute Economic Review (February), pp. 65-79.
Bryant, R., D.W. Henderson, G. Holtham, P. Hooper and S. Symansky (ed.) (1 988), Empirical Macroeconomics for lnterdependent Economies, The Brookings Institution, Washing- ton D.C.
Chan-Lee, J., D.T. Coe and M. Prywes (1 9871, "Microeconomic changes and macroeconomic wage disinflation in the 1980s", O€CD Economic Studies No. 8, (Spring), pp. 121 -57.
Chouraqui, J.C., K. Clinton and R.B. Montador (1 9871, "The medium-term macroeconomic strategy revisited", OECD Economics and Statistics Department Working Papers, No. 48 (Decem ber).
Cling, J. and F. Meunier (19861, "La desinflation en France: le point de vue de l'bconom&tre", Revue dconomique (November), pp. 1093-1 122.
Coe, D.T. (1 9851, "Nominal wages, the NAIRU and wage flexibility", OECD Economic Studies No. 5 (Autumn), pp. 87-1 26.
Eckstein, 0. (1 9781, The Great Recession, Amsterdam: North-Holland.
Emerson, M. (1987). "Regulation of the labour market: policy regimes for the retirement and dismissal of employees in the industrialised countries", EEC Economic Papers No. 55 (June).
Holtham, G. and M. Durand (1 987). "OECD economic activity and non-oil commodity prices: reduced-form equations for INTERLINK", OECD Economics and Statistics Department Working Papers, No. 42 (June).
Lucas, R.E. (1 9761, "Econometric policy evaluation: a critique" in K. Brunner and A. Meltzer (eds.), The Phillips Curve and Labour Markets, Carnegie-Rochester Conference Series on Public Policy, Vol. 1 (North-Holland), pp. 19-46.
Llewellyn, J., S. Potter and L. Samuelson (1 985), Economic forecasting and policy: the interna- tional dimension, London: Routledge and Kegan Paul.
Minczeles, A. and P. Sicsic (1 9861, "La dbsinflation 1982-85, une analyse variantielle", Revue dconomique (November), pp. 1 127-1 146.
Morin, P. (1 988). "Une analyse du processus de desinflation", fconomie et prdvision (January).
120

OECD (1 9881, "Progress in implementing structural reform", OECD Economic Outlook 43 (June),
Richardson, P. (1 988), "The structure and simulation properties of OECD's INTERLINK model",
Rowlatt, P.A. (1 9871, "Analysis of the inflation process", U.K. Treasury Working Paper No. 5 0
Shafer, J. (1 9881, "What the U.S. current-account deficit of the 1980s has meant for other OECD
Stiehler, U. (1 987), "Price determination in the major seven country models in INTERLINK", OECD
Taylor, J. (1 982). "Establishing credibility: a rational expectations viewpoint", American Economic
pp. 68-74.
OECD Economic Studies No. 10 (Spring), pp. 57-1 22.
(August).
countries", OECD Economic Studies No. 10 (Spring), pp. 149-1 84.
Economics and Statistics Department Working Papers No. 44 (July).
Review (May), pp. 81 -85.
121