the dl blues: the continuing saga of detection and quantitation limits richard r. rediske, ph.d....
TRANSCRIPT
The DL Blues: The Continuing Saga of
Detection and Quantitation Limits
Richard R. Rediske, Ph.D.
Annis Water Resources Institute
Grand Valley State University
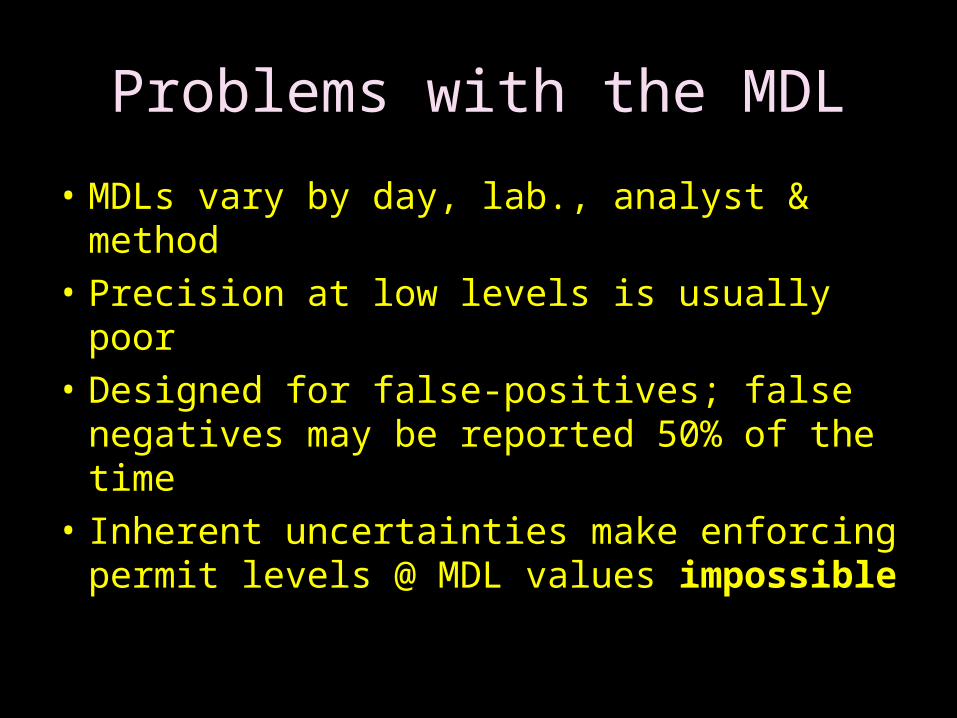
Problems with the MDL
• MDLs vary by day, lab., analyst & method
• Precision at low levels is usually poor
• Designed for false-positives; false negatives may be reported 50% of the time
• Inherent uncertainties make enforcing permit levels @ MDL values impossible
Problems with the MDL
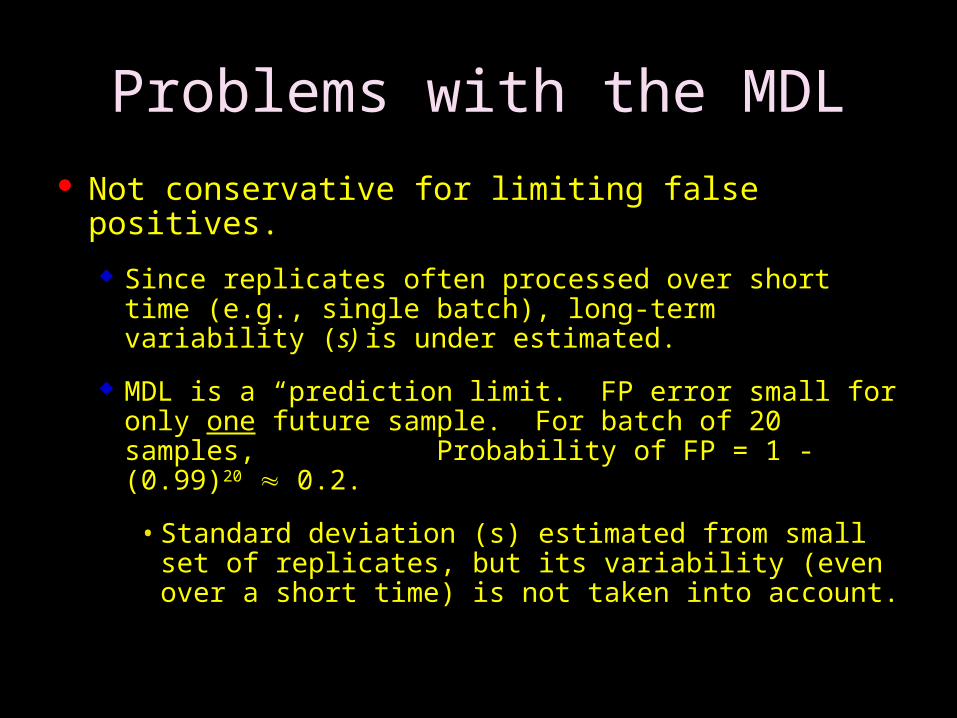
Not conservative for limiting false positives.
Since replicates often processed over short time (e.g., single batch), long-term variability (s) is under estimated.
MDL is a “prediction limit. FP error small for only one future sample. For batch of 20 samples, Probability of FP = 1 - (0.99)20 0.2.
• Standard deviation (s) estimated from small set of replicates, but its variability (even over a short time) is not taken into account.

Problems with the MDL MDL depends on precision (s) only
and does not take bias into account.
Positive Bias - Concentration of trace contamination in “blanks” can exceed MDL.
MDL does not minimize false negatives (even when negative analytical bias is absent) !
Cannot reliably report non-detects as “< MDL,” contrary to EPA and DOD guidance .
FN error at MDL is at least 50%.

MDL = 3 sMDL = 3 s
0
False Negatives at MDL
FNFNProbabilityProbability
(H(H00: : = MDL) = MDL)
FP FP Probability Probability
(H(H00: : = 0) = 0)
Limit to report Limit to report non-detectsnon-detects

Method Sensitivity Decision Points
0 20 40 60 80 100
1
Concentration in Relative Units
LQLDLC
Can’t differentiate from background
False Positive Error rate too high
LC
LD
LQ
Critical Level
Limit of Detection
Limit of Quantitation
+

Method Sensitivity Decision Points
0 20 40 60 80 100
1
Concentration in Relative Units
LQLDLC
Can differentiate from background
False Positive Acceptable
+ +
LC
LD
LQ
Critical Level
Limit of Detection
Limit of Quantitation

Method Sensitivity Decision Points
0 20 40 60 80 100
1
Concentration in Relative Units
LQLDLC
False Negative error rate too high to detectwith confidence
-
LC
LD
LQ
Critical Level
Limit of Detection
Limit of Quantitation
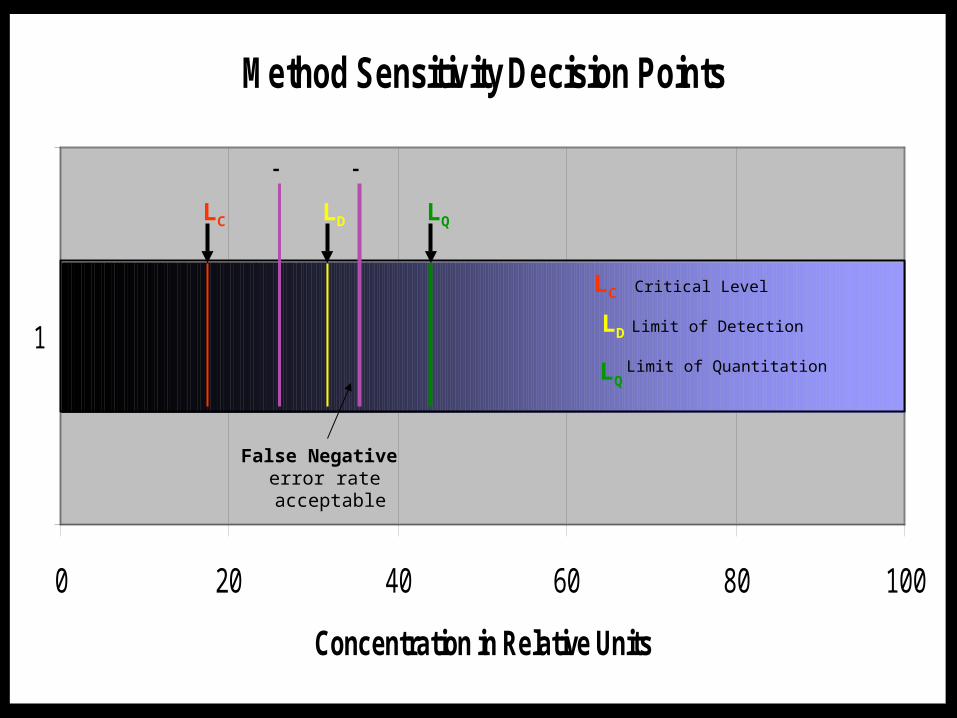
Method Sensitivity Decision Points
0 20 40 60 80 100
1
Concentration in Relative Units
LQLDLC
- -
LC
LD
LQ
Critical Level
Limit of Detection
Limit of Quantitation
False Negative error rate acceptable
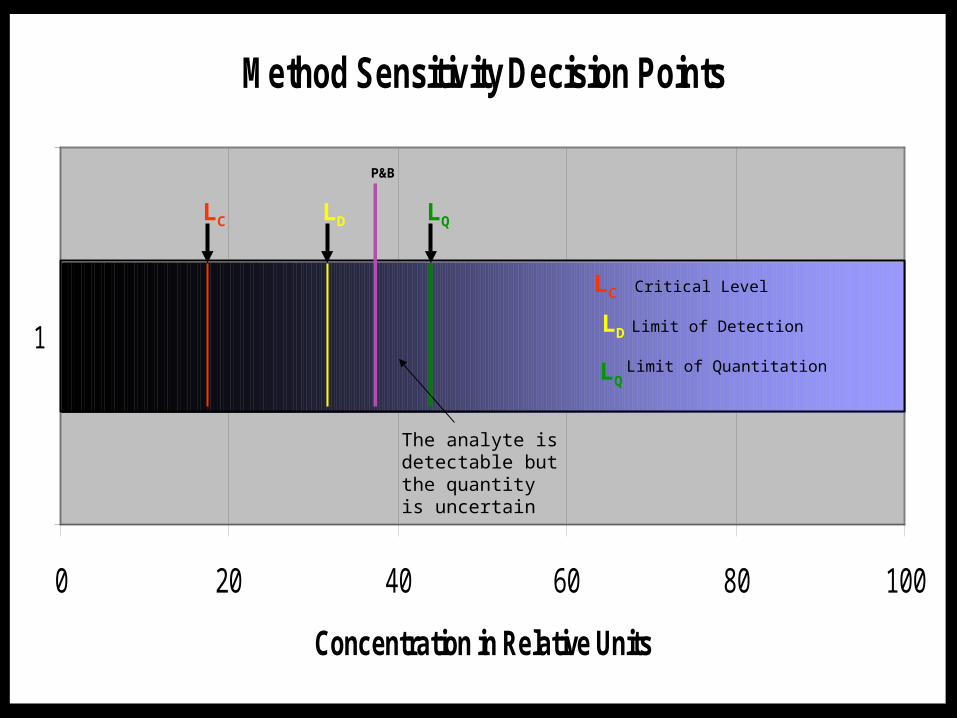
Method Sensitivity Decision Points
0 20 40 60 80 100
1
Concentration in Relative Units
LQLDLC
The analyte is detectable but the quantityis uncertain
P&B
LC
LD
LQ
Critical Level
Limit of Detection
Limit of Quantitation
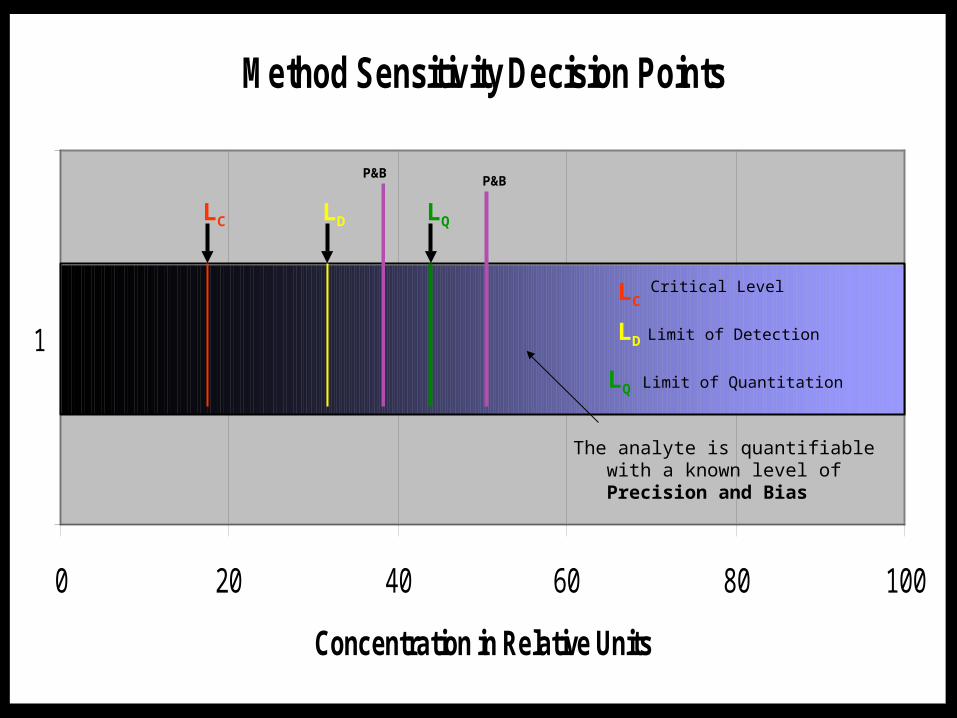
Method Sensitivity Decision Points
0 20 40 60 80 100
1
Concentration in Relative Units
LQLDLC
The analyte is quantifiable with a known level of Precision and Bias
P&BP&B
LC
LD
LQ
Critical Level
Limit of Detection
Limit of Quantitation
Current State of the Art
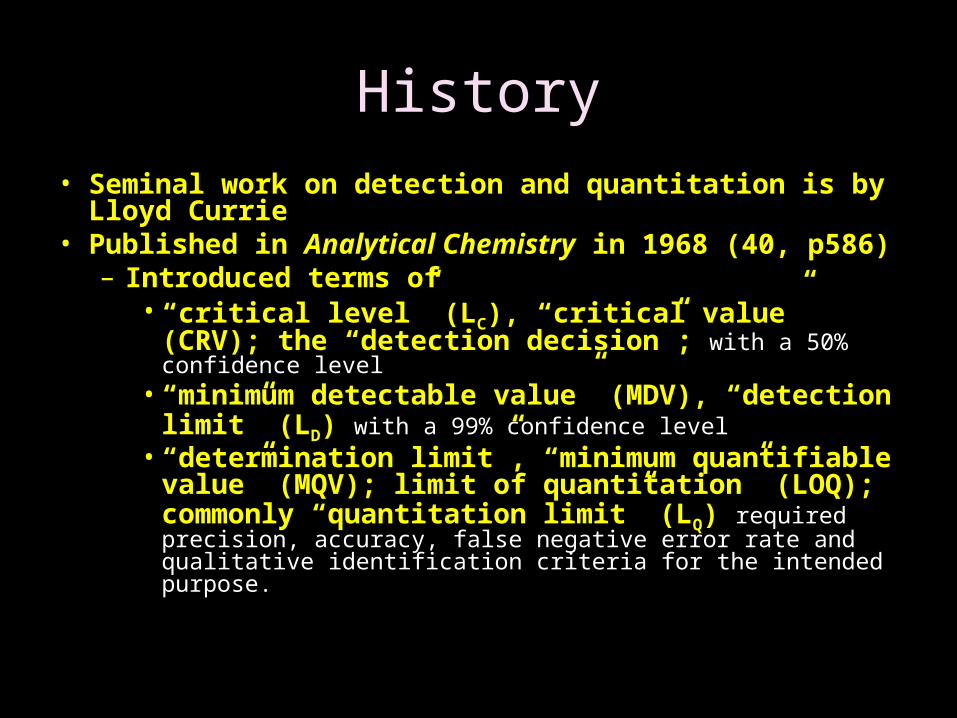
History
• Seminal work on detection and quantitation is by Lloyd Currie
• Published in Analytical Chemistry in 1968 (40, p586)– Introduced terms of
• “critical level” (LC), “critical value” (CRV); the “detection decision”; with a 50% confidence level
• “minimum detectable value” (MDV), “detection limit” (LD) with a 99% confidence level
• “determination limit”, “minimum quantifiable value” (MQV); limit of quantitation” (LOQ); commonly “quantitation limit” (LQ) required precision, accuracy, false negative error rate and qualitative identification criteria for the intended purpose.
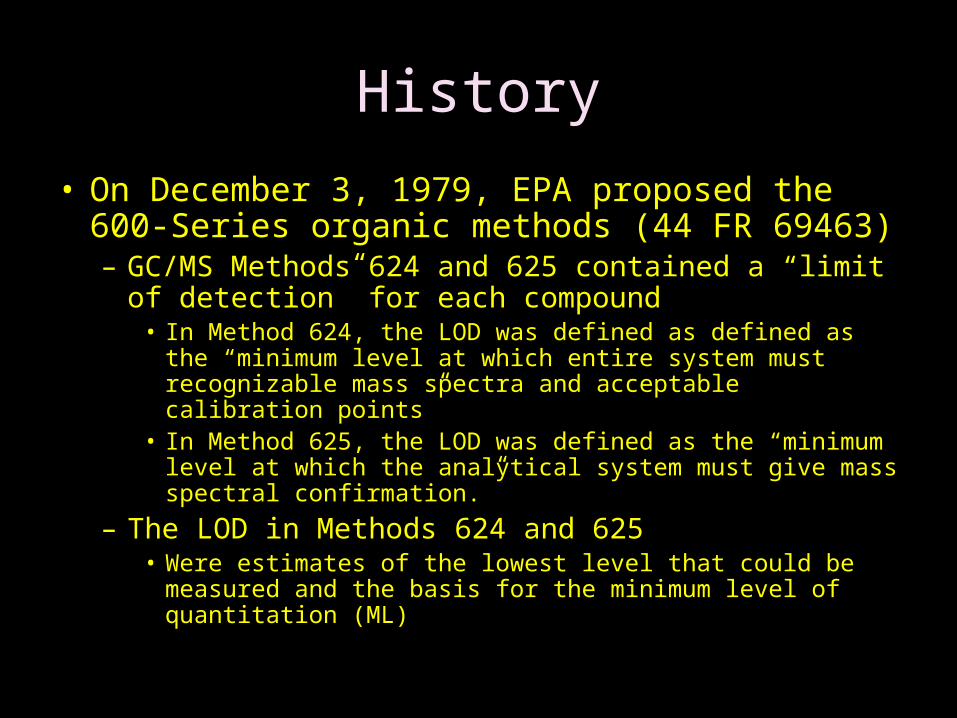
History
• On December 3, 1979, EPA proposed the 600-Series organic methods (44 FR 69463)– GC/MS Methods 624 and 625 contained a “limit of
detection” for each compound• In Method 624, the LOD was defined as defined as the
“minimum level at which entire system must recognizable mass spectra and acceptable calibration points”
• In Method 625, the LOD was defined as the “minimum level at which the analytical system must give mass spectral confirmation.”
– The LOD in Methods 624 and 625• Were estimates of the lowest level that could be measured
and the basis for the minimum level of quantitation (ML)

History
• Method detection limit (MDL) was first published in a paper by John Glaser and others at EPA’s laboratory in Cincinnati in 1981 in Environmental Science and Technology (15, p1426)– MDL based on Currie’s work– Employs low-level spikes rather than backgrounds– Uses Student’s t-test to allow for varying number of
replicates– Has remained largely unchanged since publication
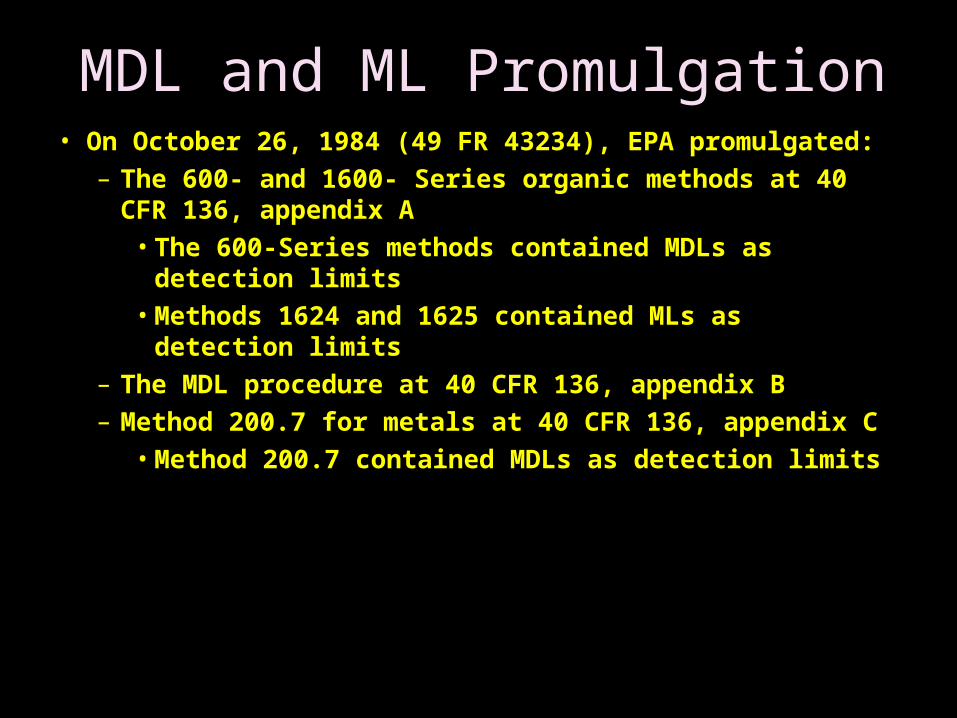
MDL and ML Promulgation• On October 26, 1984 (49 FR 43234), EPA promulgated:
– The 600- and 1600- Series organic methods at 40 CFR 136, appendix A
• The 600-Series methods contained MDLs as detection limits
• Methods 1624 and 1625 contained MLs as detection limits
– The MDL procedure at 40 CFR 136, appendix B– Method 200.7 for metals at 40 CFR 136, appendix C
• Method 200.7 contained MDLs as detection limits
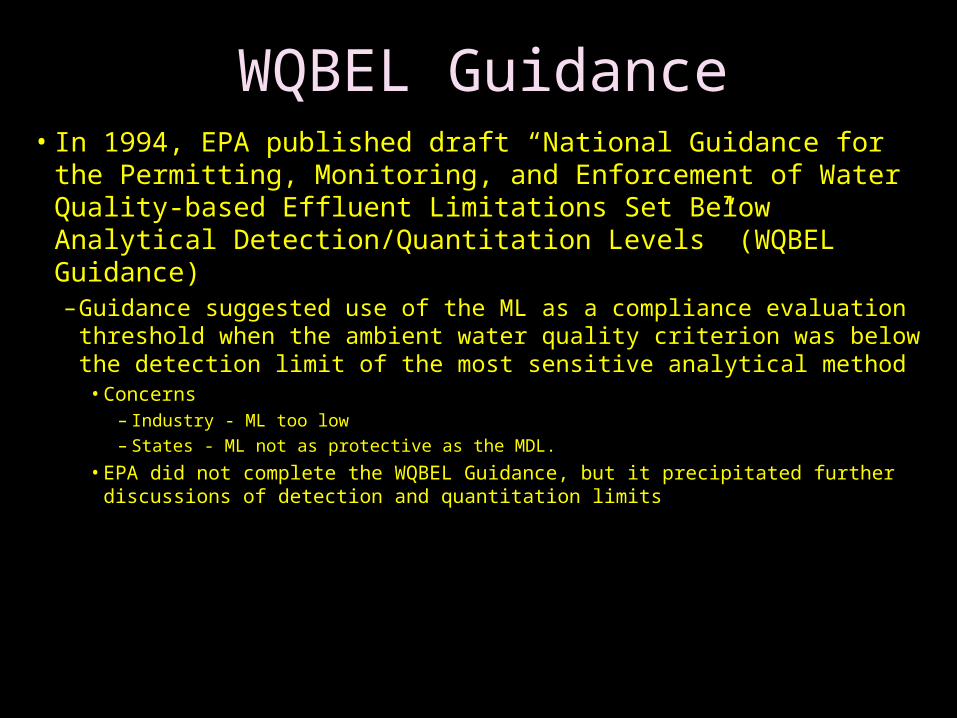
WQBEL Guidance• In 1994, EPA published draft “National Guidance for the
Permitting, Monitoring, and Enforcement of Water Quality-based Effluent Limitations Set Below Analytical Detection/Quantitation Levels” (WQBEL Guidance)–Guidance suggested use of the ML as a compliance evaluation
threshold when the ambient water quality criterion was below the detection limit of the most sensitive analytical method• Concerns
– Industry - ML too low– States - ML not as protective as the MDL.
• EPA did not complete the WQBEL Guidance, but it precipitated further discussions of detection and quantitation limits

Refinement of ML
• In support of the draft WQBEL Guidance, EPA refined the ML to be consistent with the ISO/IUPAC LOQ (at the time) and the ACS LOD– ML = 10 times the standard deviation of 7
replicates• ML = 3.18 times the MDL
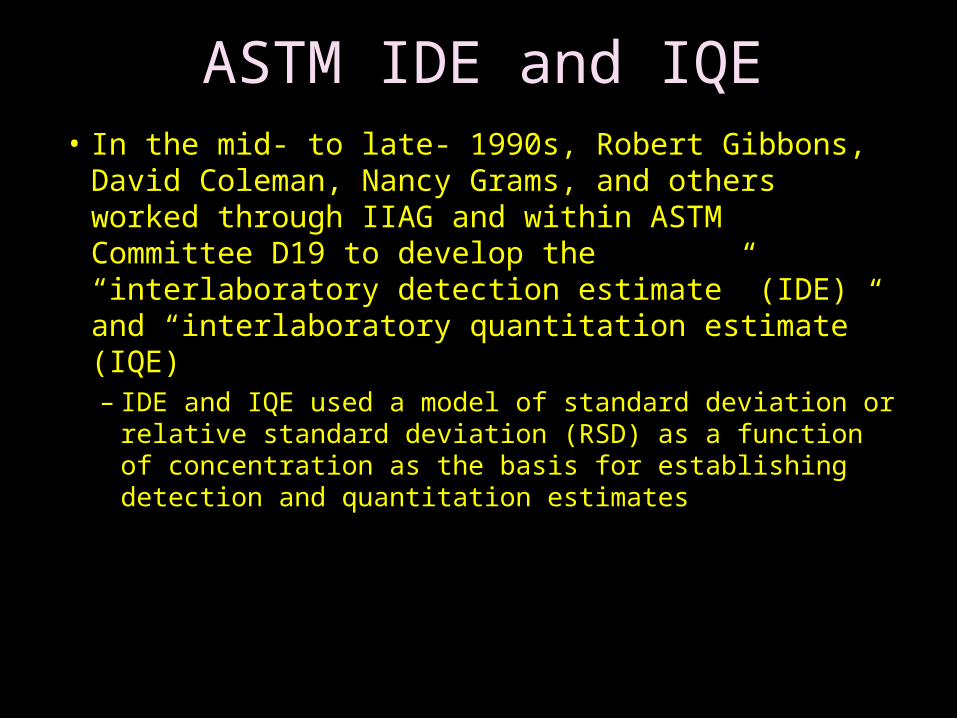
ASTM IDE and IQE• In the mid- to late- 1990s, Robert Gibbons, David
Coleman, Nancy Grams, and others worked through IIAG and within ASTM Committee D19 to develop the “interlaboratory detection estimate” (IDE) and “interlaboratory quantitation estimate” (IQE)– IDE and IQE used a model of standard deviation or
relative standard deviation (RSD) as a function of concentration as the basis for establishing detection and quantitation estimates
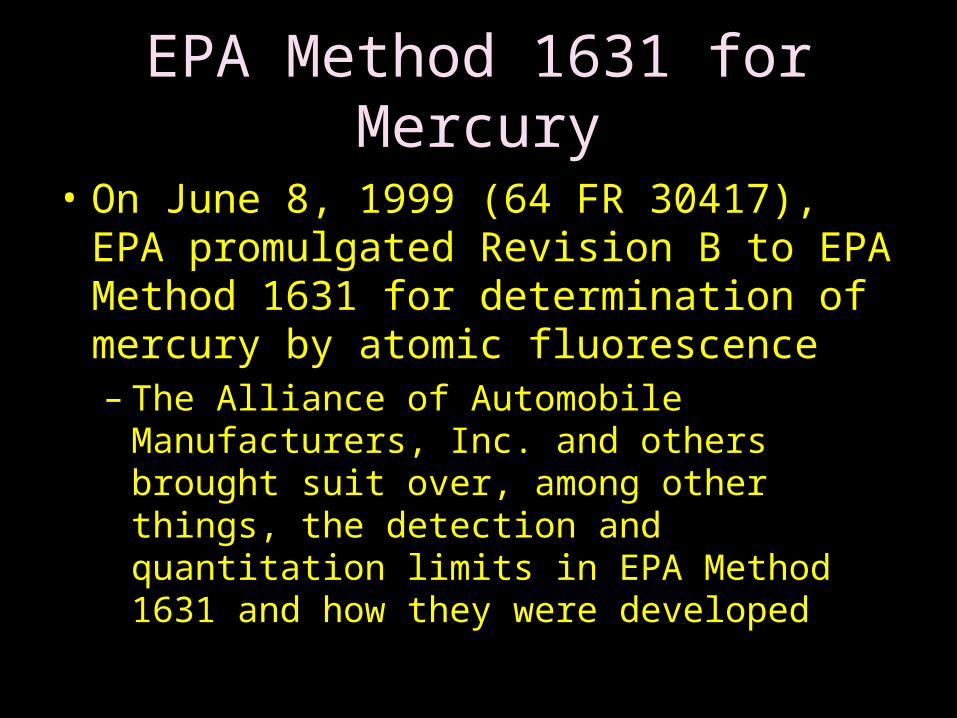
EPA Method 1631 for Mercury
• On June 8, 1999 (64 FR 30417), EPA promulgated Revision B to EPA Method 1631 for determination of mercury by atomic fluorescence– The Alliance of Automobile Manufacturers,
Inc. and others brought suit over, among other things, the detection and quantitation limits in EPA Method 1631 and how they were developed
Settlement Agreement
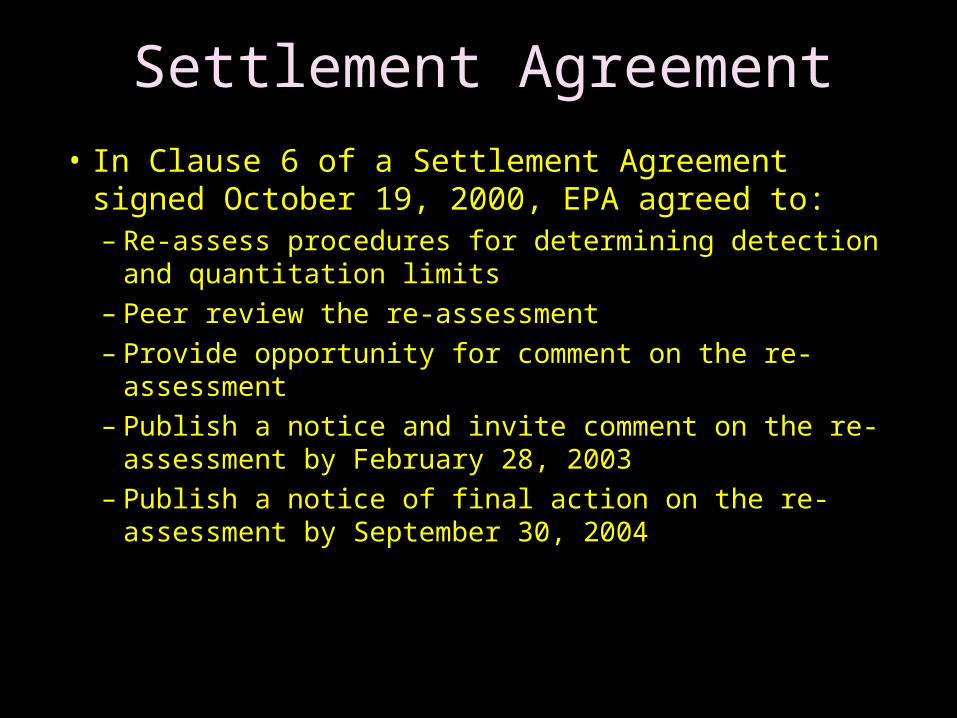
• In Clause 6 of a Settlement Agreement signed October 19, 2000, EPA agreed to:– Re-assess procedures for determining detection and
quantitation limits– Peer review the re-assessment– Provide opportunity for comment on the re-assessment– Publish a notice and invite comment on the re-
assessment by February 28, 2003– Publish a notice of final action on the re-assessment by
September 30, 2004
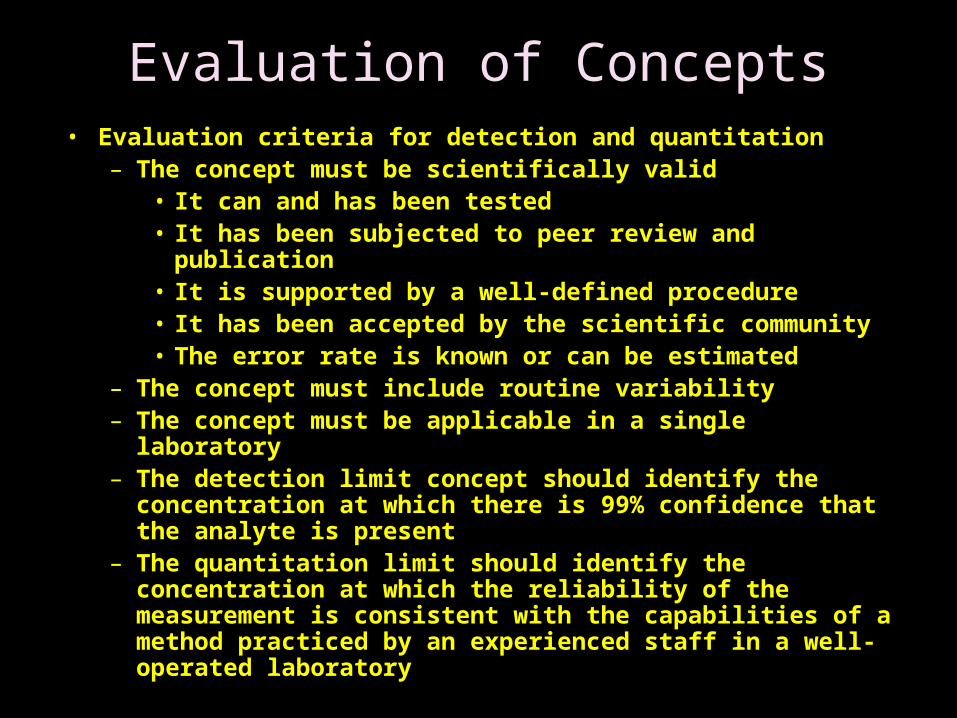
Evaluation of Concepts• Evaluation criteria for detection and quantitation
– The concept must be scientifically valid• It can and has been tested• It has been subjected to peer review and publication• It is supported by a well-defined procedure• It has been accepted by the scientific community• The error rate is known or can be estimated
– The concept must include routine variability– The concept must be applicable in a single laboratory– The detection limit concept should identify the
concentration at which there is 99% confidence that the analyte is present
– The quantitation limit should identify the concentration at which the reliability of the measurement is consistent with the capabilities of a method practiced by an experienced staff in a well-operated laboratory
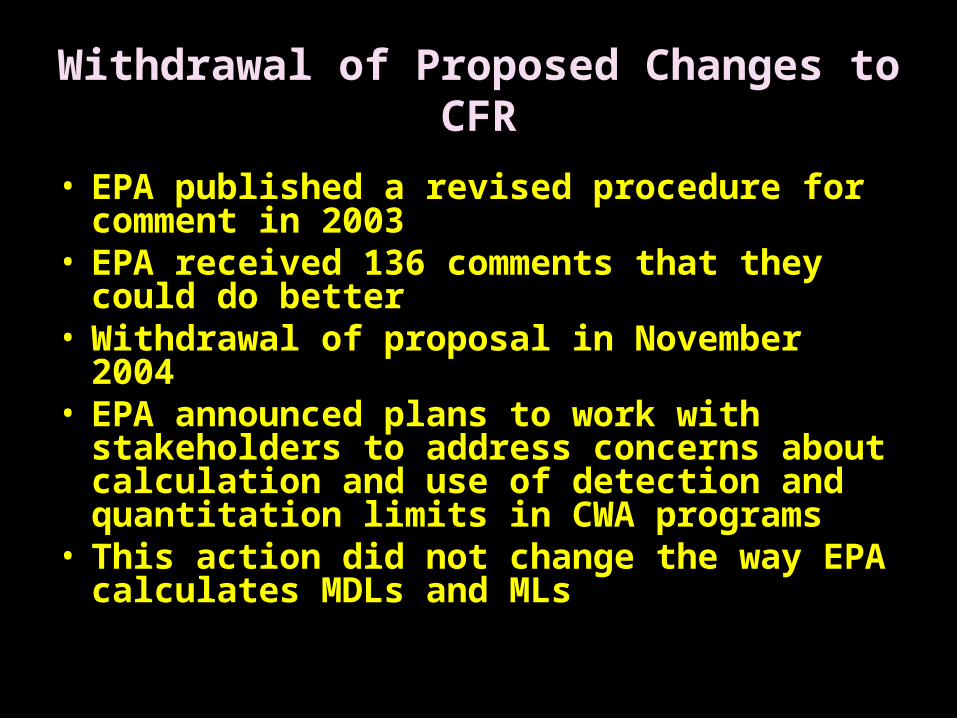
Withdrawal of Proposed Changes to CFR
• EPA published a revised procedure for comment in 2003
• EPA received 136 comments that they could do better
• Withdrawal of proposal in November 2004• EPA announced plans to work with
stakeholders to address concerns about calculation and use of detection and quantitation limits in CWA programs
• This action did not change the way EPA calculates MDLs and MLs
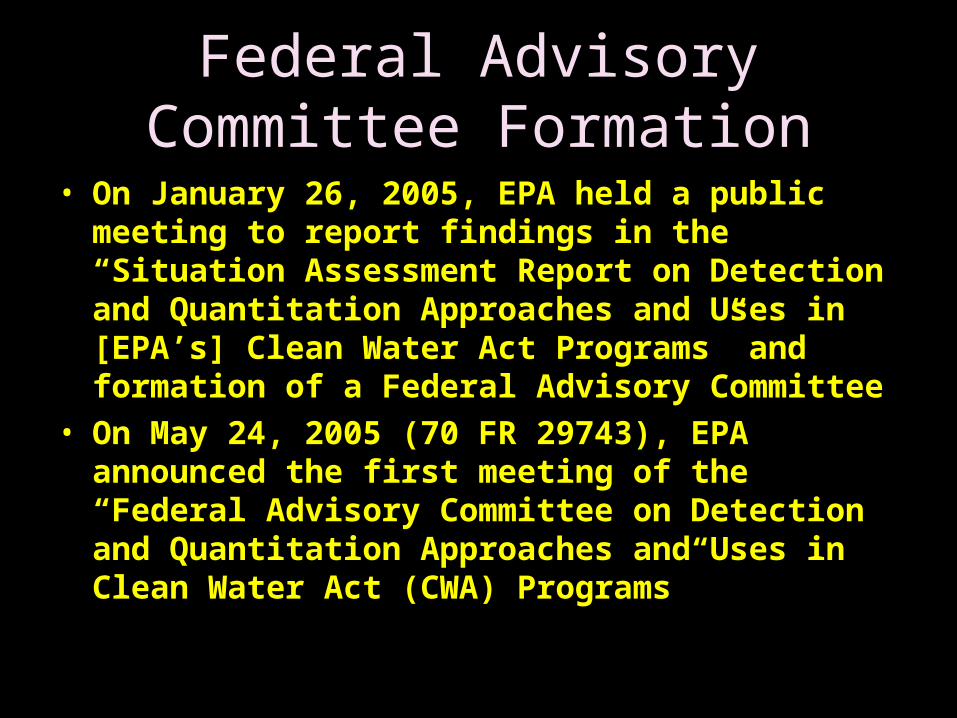
Federal Advisory Committee Formation
• On January 26, 2005, EPA held a public meeting to report findings in the “Situation Assessment Report on Detection and Quantitation Approaches and Uses in [EPA’s] Clean Water Act Programs” and formation of a Federal Advisory Committee
• On May 24, 2005 (70 FR 29743), EPA announced the first meeting of the “Federal Advisory Committee on Detection and Quantitation Approaches and Uses in Clean Water Act (CWA) Programs”
Is this too long?
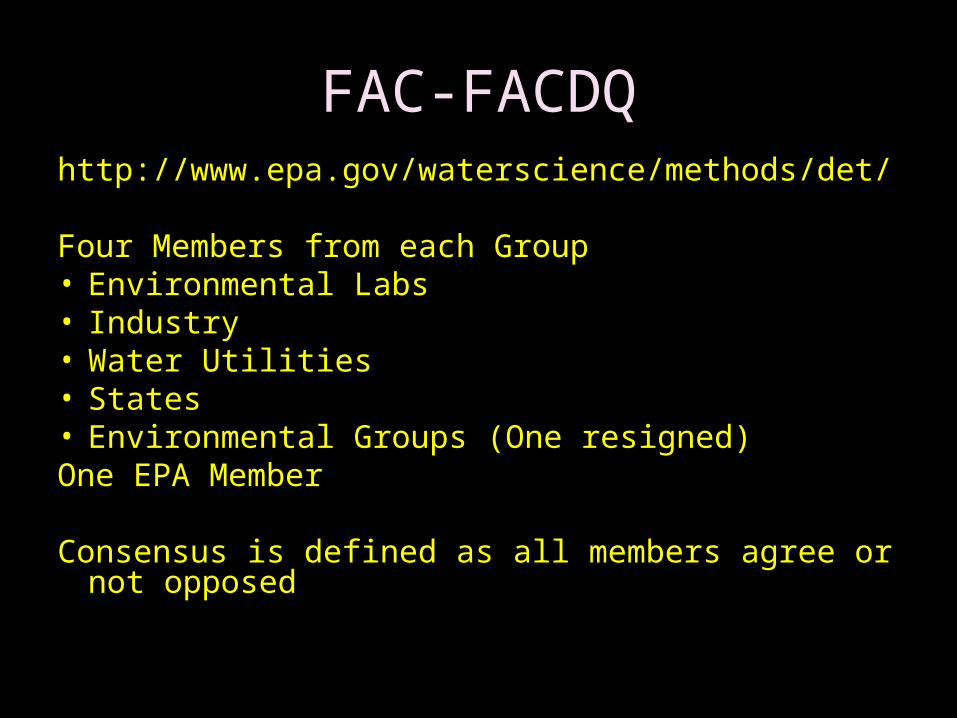
FAC-FACDQhttp://www.epa.gov/waterscience/methods/det/
Four Members from each Group• Environmental Labs• Industry• Water Utilities• States• Environmental Groups (One resigned)One EPA Member
Consensus is defined as all members agree or not opposed
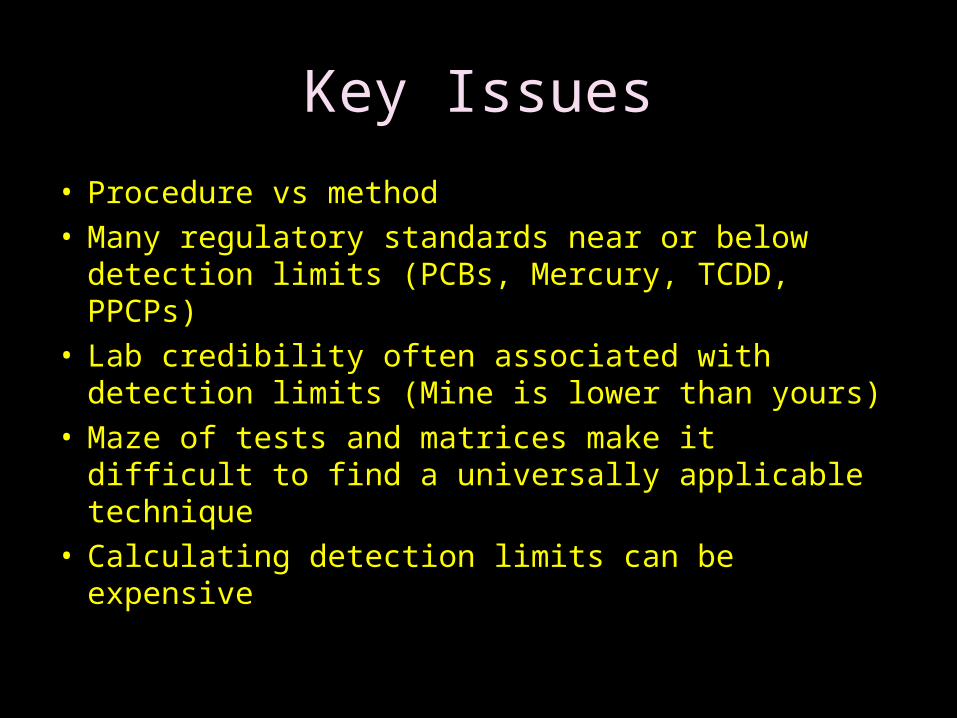
Key Issues
• Procedure vs method• Many regulatory standards near or below
detection limits (PCBs, Mercury, TCDD, PPCPs)• Lab credibility often associated with detection
limits (Mine is lower than yours)• Maze of tests and matrices make it difficult to
find a universally applicable technique• Calculating detection limits can be expensive
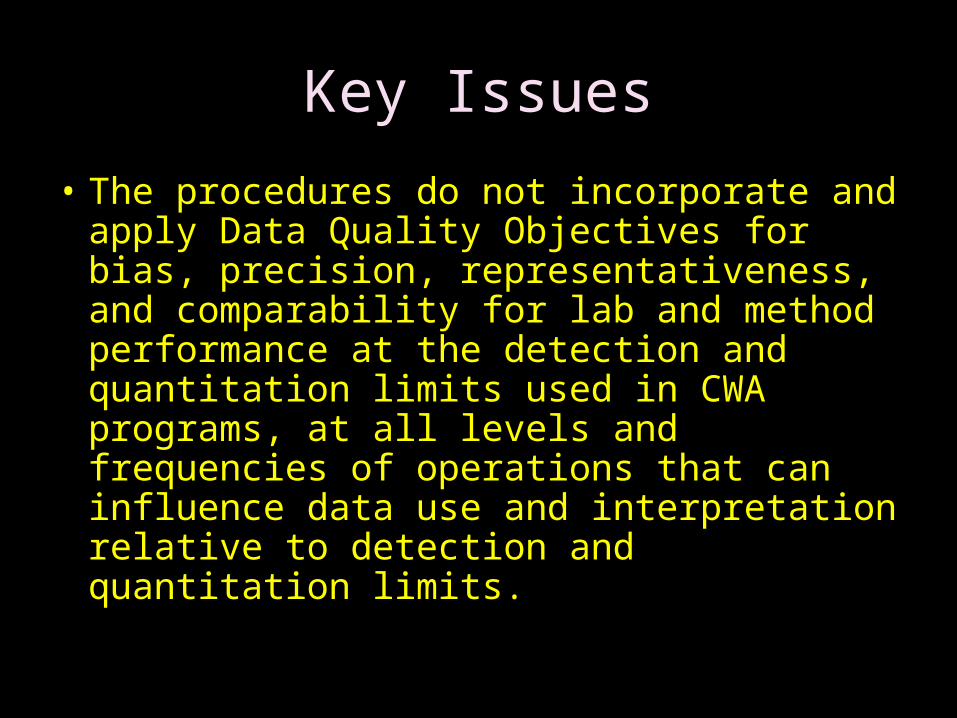
Key Issues
• The procedures do not incorporate and apply Data Quality Objectives for bias, precision, representativeness, and comparability for lab and method performance at the detection and quantitation limits used in CWA programs, at all levels and frequencies of operations that can influence data use and interpretation relative to detection and quantitation limits.
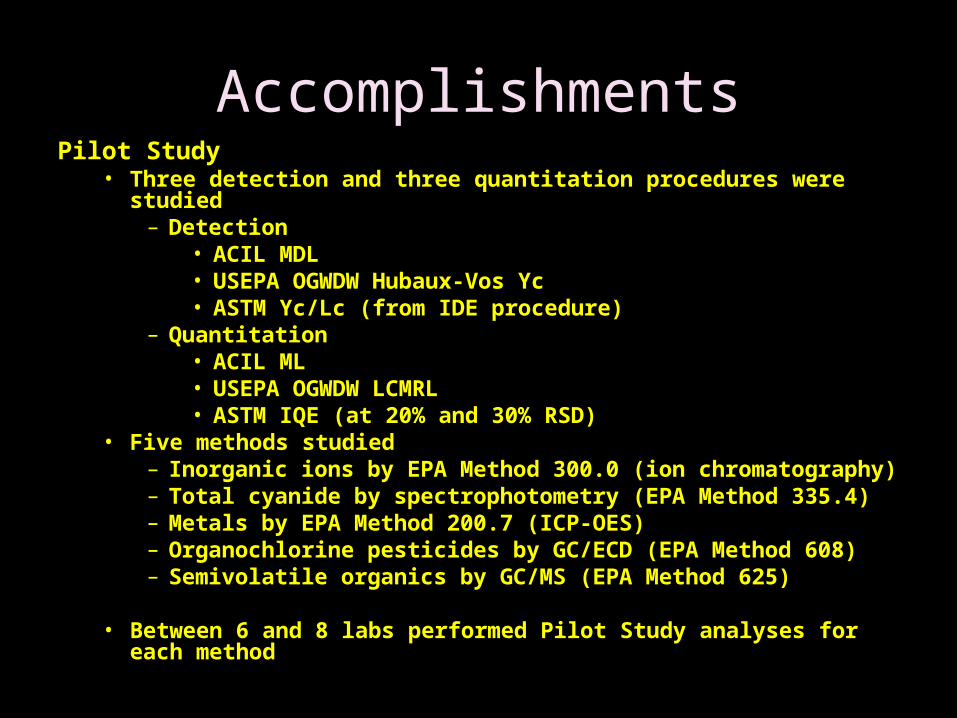
AccomplishmentsPilot Study
• Three detection and three quantitation procedures were studied– Detection
• ACIL MDL• USEPA OGWDW Hubaux-Vos Yc• ASTM Yc/Lc (from IDE procedure)
– Quantitation• ACIL ML• USEPA OGWDW LCMRL• ASTM IQE (at 20% and 30% RSD)
• Five methods studied– Inorganic ions by EPA Method 300.0 (ion chromatography)– Total cyanide by spectrophotometry (EPA Method 335.4)– Metals by EPA Method 200.7 (ICP-OES)– Organochlorine pesticides by GC/ECD (EPA Method 608)– Semivolatile organics by GC/MS (EPA Method 625)
• Between 6 and 8 labs performed Pilot Study analyses for each method
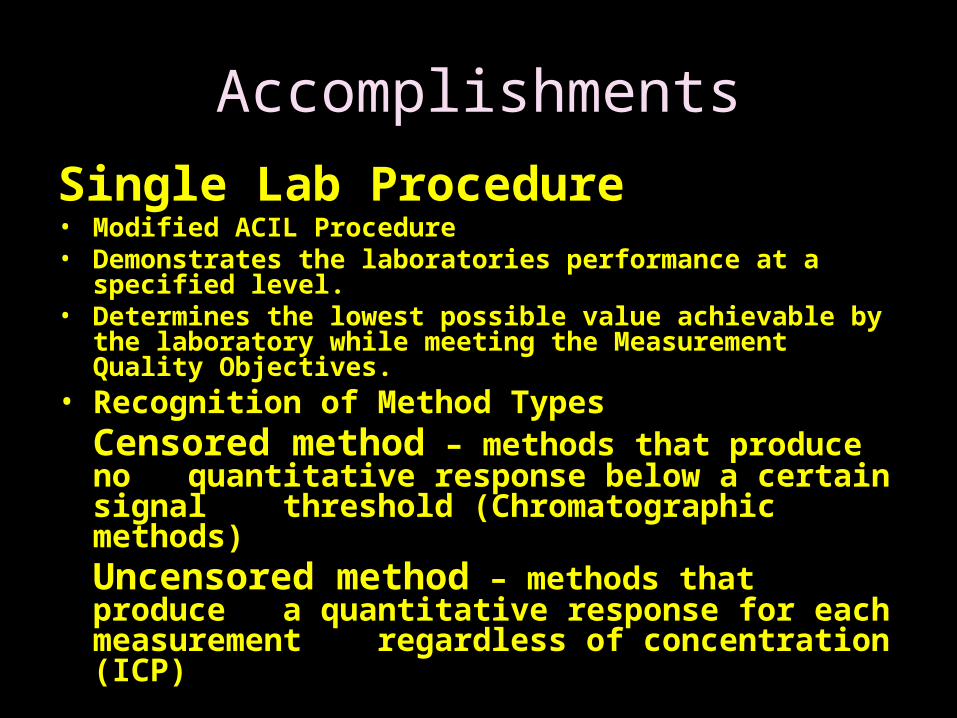
Accomplishments
Single Lab Procedure• Modified ACIL Procedure• Demonstrates the laboratories performance at a specified level.• Determines the lowest possible value achievable by the
laboratory while meeting the Measurement Quality Objectives.• Recognition of Method Types
Censored method – methods that produce no quantitative response below a certain signal
threshold (Chromatographic methods)Uncensored method – methods that
produce a quantitative response for each measurement regardless of concentration (ICP)
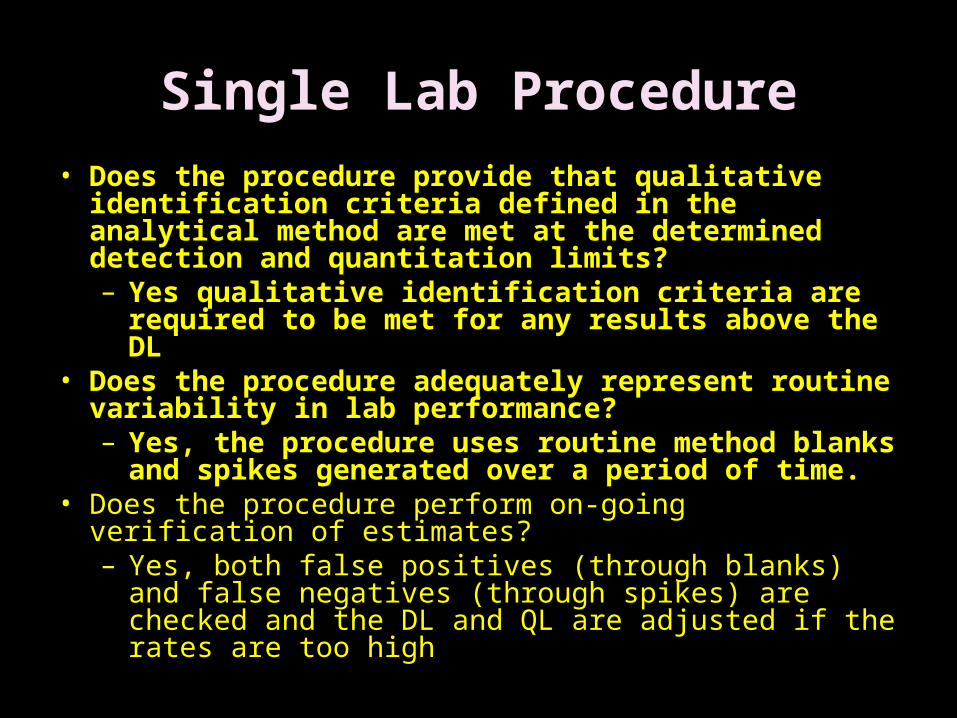
Single Lab Procedure
• Does the procedure provide that qualitative identification criteria defined in the analytical method are met at the determined detection and quantitation limits? – Yes qualitative identification criteria are required
to be met for any results above the DL• Does the procedure adequately represent routine
variability in lab performance? – Yes, the procedure uses routine method blanks
and spikes generated over a period of time.• Does the procedure perform on-going verification of
estimates? – Yes, both false positives (through blanks) and false
negatives (through spikes) are checked and the DL and QL are adjusted if the rates are too high
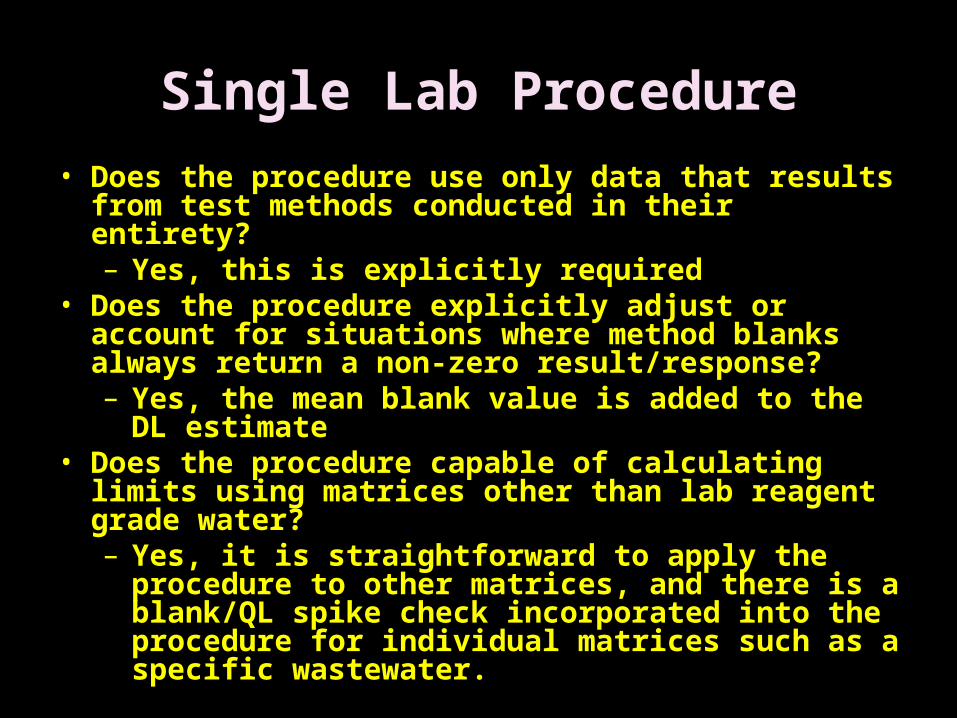
Single Lab Procedure
• Does the procedure use only data that results from test methods conducted in their entirety? – Yes, this is explicitly required
• Does the procedure explicitly adjust or account for situations where method blanks always return a non-zero result/response? – Yes, the mean blank value is added to the DL
estimate• Does the procedure capable of calculating limits
using matrices other than lab reagent grade water? – Yes, it is straightforward to apply the procedure
to other matrices, and there is a blank/QL spike check incorporated into the procedure for individual matrices such as a specific wastewater.
Single Lab Procedure
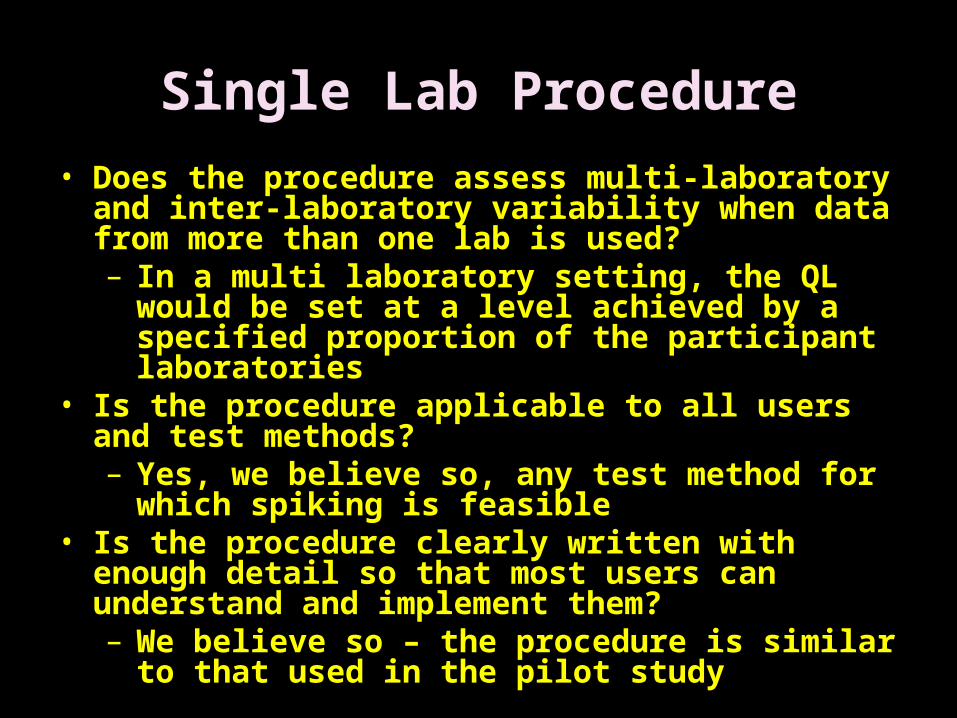
• Does the procedure assess multi-laboratory and inter-laboratory variability when data from more than one lab is used? – In a multi laboratory setting, the QL would be set
at a level achieved by a specified proportion of the participant laboratories
• Is the procedure applicable to all users and test methods?– Yes, we believe so, any test method for which
spiking is feasible• Is the procedure clearly written with enough detail
so that most users can understand and implement them? – We believe so – the procedure is similar to that
used in the pilot study
Single Lab Procedure
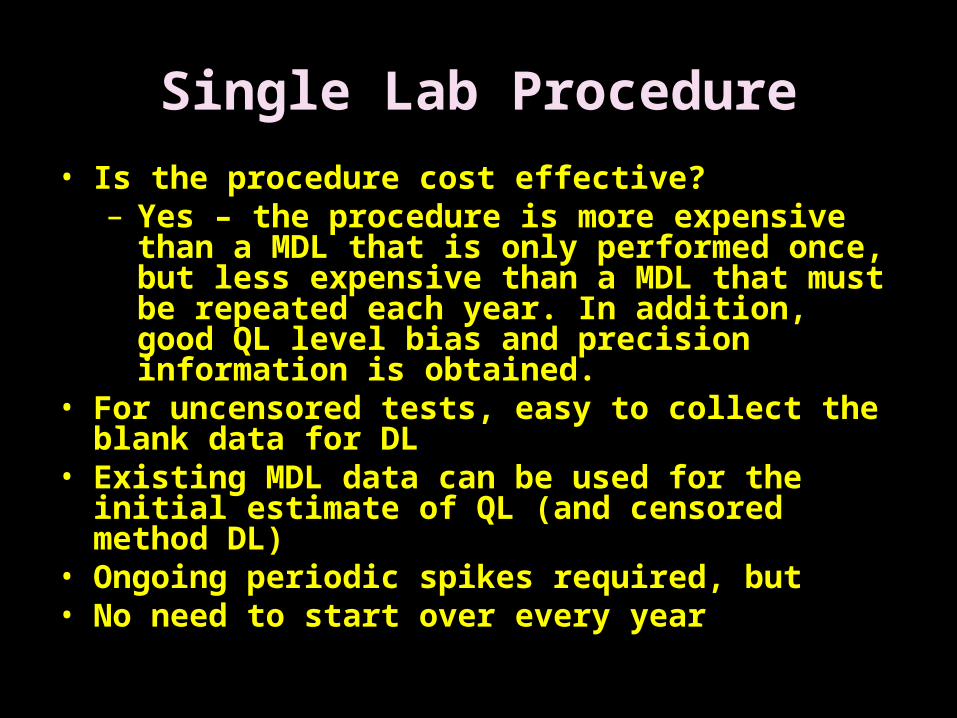
• Is the procedure cost effective? – Yes – the procedure is more expensive than a
MDL that is only performed once, but less expensive than a MDL that must be repeated each year. In addition, good QL level bias and precision information is obtained.
• For uncensored tests, easy to collect the blank data for DL
• Existing MDL data can be used for the initial estimate of QL (and censored method DL)
• Ongoing periodic spikes required, but• No need to start over every year
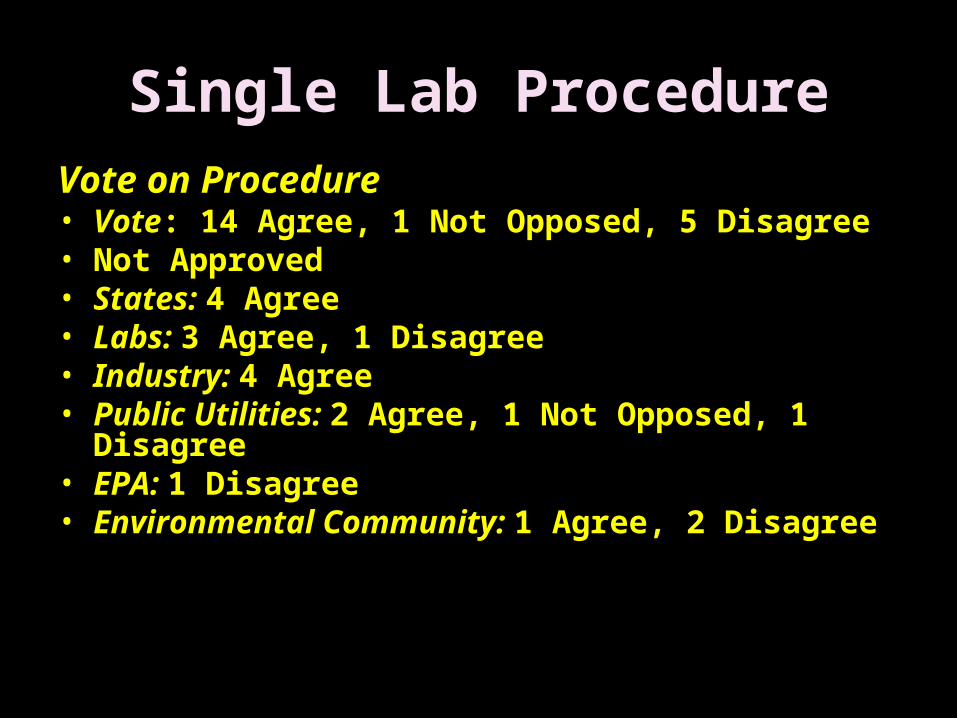
Single Lab ProcedureVote on Procedure• Vote: 14 Agree, 1 Not Opposed, 5 Disagree• Not Approved• States: 4 Agree• Labs: 3 Agree, 1 Disagree• Industry: 4 Agree• Public Utilities: 2 Agree, 1 Not Opposed, 1 Disagree• EPA: 1 Disagree• Environmental Community: 1 Agree, 2 Disagree

Measurement Quality Objectives• The FACDQ recommends that EPA establish quantitative
MQO bounds for relevant Data Quality Indicators (DQIs) that define Quantitation for intended CWA uses. These bounds would be offered for public comment by EPA.
• Vote: 9 Agree, 7 Not Opposed, 1 Disagree, 1 Absent • Not Approved
• Precision ≤ 30% RSD• Accuracy (measured as recovery for single
determination) = 20-180%• False Negative rate ≤ 10%• Ratio of Accuracy to Precision must be no less than 1.0• Example: 40% Recovery / 20% RSD = 2 O.K.,• Example: 20% Recovery / 30% RSD = .66 Not Acceptable• Vote: 12 Agree, 5 Not Opposed, 1 Disagree, 1 Absent• Not Approved
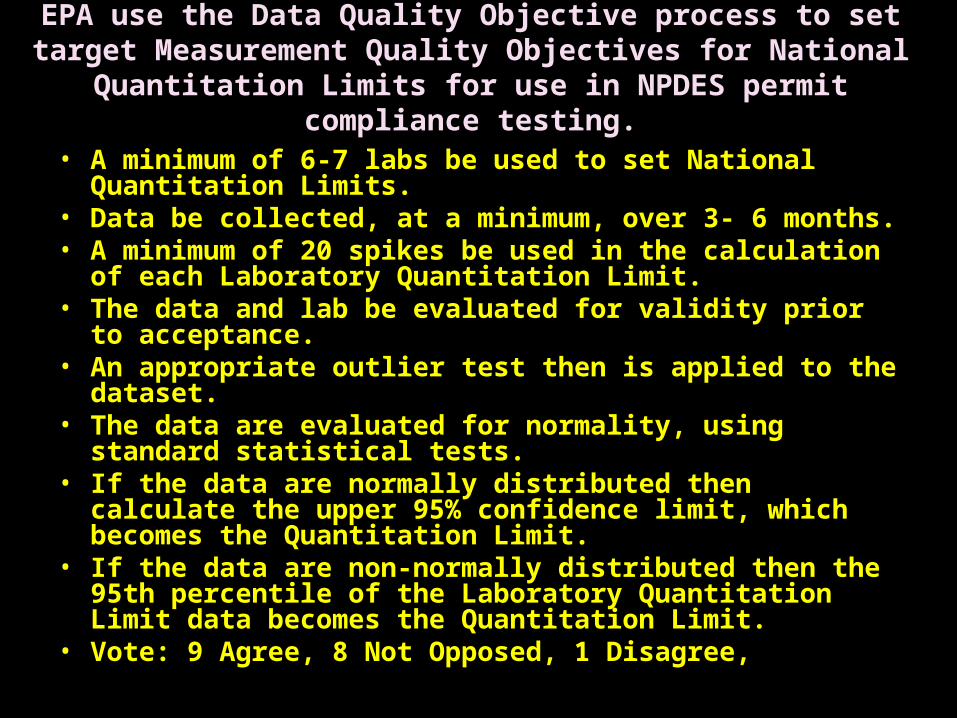
EPA use the Data Quality Objective process to set target Measurement Quality Objectives for National Quantitation
Limits for use in NPDES permit compliance testing.
• A minimum of 6-7 labs be used to set National Quantitation Limits.
• Data be collected, at a minimum, over 3- 6 months.• A minimum of 20 spikes be used in the calculation of
each Laboratory Quantitation Limit.• The data and lab be evaluated for validity prior to
acceptance.• An appropriate outlier test then is applied to the dataset.• The data are evaluated for normality, using standard
statistical tests.• If the data are normally distributed then calculate the
upper 95% confidence limit, which becomes the Quantitation Limit.
• If the data are non-normally distributed then the 95th percentile of the Laboratory Quantitation Limit data becomes the Quantitation Limit.
• Vote: 9 Agree, 8 Not Opposed, 1 Disagree,

December 2008• EPA proposes rule. Assuming a FACDQ recommendation
that EPA accepts, propose to amend – Part 136 (Analytical Methods) to add new approach(es).– Part 122 (EPA Administered Permit Programs: The
National Pollutant Discharge Elimination System) to add uses provisions.
• EPA– Takes comments and continues rulemaking accordingly– Conducts training/outreach for states, permittees, labs
• States– Comments on proposed EPA rules– Participates in EPA training/outreach– Continues existing approaches or transitions– Begins planning if federal rules are implementable with
or without state rules• Permittees and Labs
– Comments on proposed EPA rules
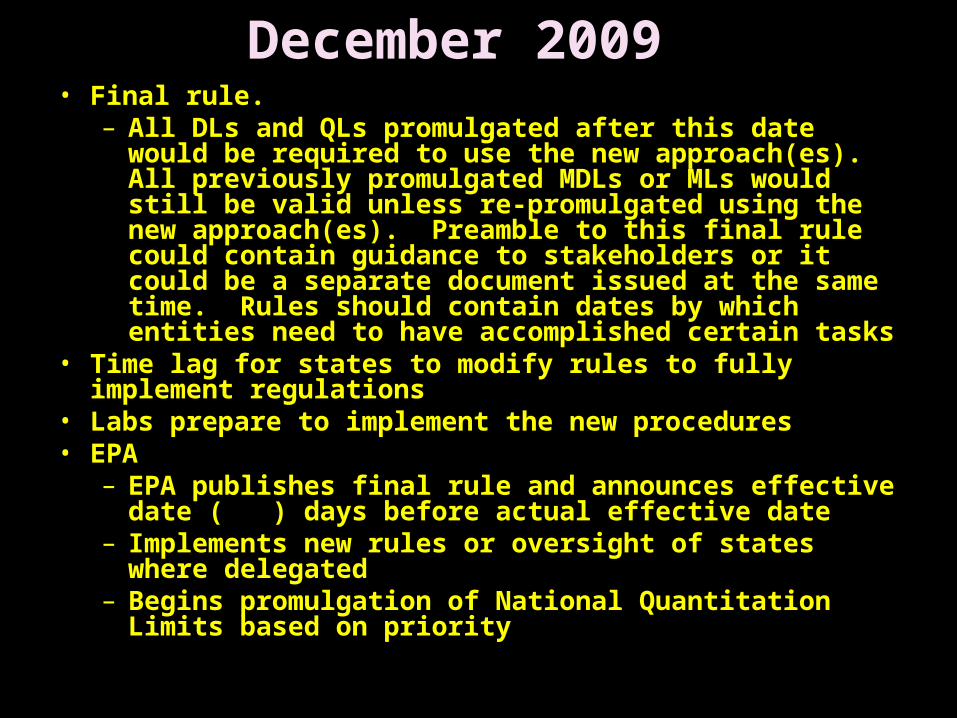
December 2009• Final rule.
– All DLs and QLs promulgated after this date would be required to use the new approach(es). All previously promulgated MDLs or MLs would still be valid unless re-promulgated using the new approach(es). Preamble to this final rule could contain guidance to stakeholders or it could be a separate document issued at the same time. Rules should contain dates by which entities need to have accomplished certain tasks
• Time lag for states to modify rules to fully implement regulations
• Labs prepare to implement the new procedures• EPA
– EPA publishes final rule and announces effective date ( ) days before actual effective date
– Implements new rules or oversight of states where delegated
– Begins promulgation of National Quantitation Limits based on priority

December 2009• States
– Begin implementing federal rules or begin state rule promulgation (if rules are necessary, it may take another year or two)
– May need to maintain duplicate system for methods/analytes with National QLs versus those without
– Plan training/outreach to permittees• Permittees
– Newly issued permits may specify procedures to be used to set DL and QL and other steps resulting from new rules
– Existing permits may be modified by states to contain new procedures
– Existing permits may automatically signal changes because of language that anticipates rule-making
– If state does not modify permits or have automatic change language in permits, some permits could go 5 years under the current requirements
• Laboratories– Begin using new procedure – May need to maintain duplicate procedures or nomenclature
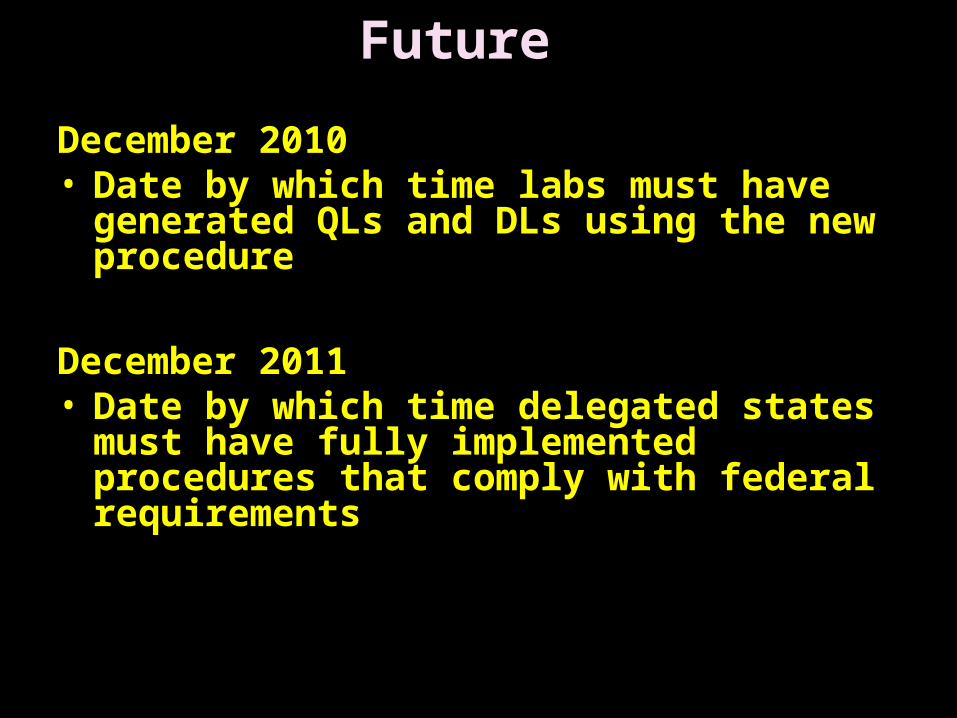
Future
December 2010• Date by which time labs must have generated
QLs and DLs using the new procedure
December 2011• Date by which time delegated states must
have fully implemented procedures that comply with federal requirements

We must chose wisely!