the diverse people of africa - nielsen · 2019-05-29 · 1.34 billion people $5.93 trillion gdp...
TRANSCRIPT

The Diverse People of Africa March 2012

2 Copyright © 2012 The Nielsen Company.
CHINA
Source : The World Bank: World Bank Development Indicators: World Bank national accounts data, and OECD National Accounts data files, (1) United Nations Population Division. 2009. World Population Prospects: The 2008 Revision. New York, United Nations, Department of Economic and Social Affairs (advanced Excel tables). Available at http://esa.un.org/unpd/wpp2008/index.htm. (2) Census reports and other statistical publications from national statistical offices, (3) Eurostat: Demographic Statistics, (4) Secretariat of the Pacific Community: Statistics and Demography Programme, (5) U.S. Census Bureau: International Database, and (6) World bank estimates based on the data from the sources above, household surveys conducted by national agencies, Macro International, the U.S. Centers for Disease Control and Prevention, and refugees statistics from the United Nations High Commissioner for Refugees.
Africa by the Numbers: Africa outpacing India and China in population growth
AFRICA HAS 8 COUNTRIES WITH A HIGHER GDP PER CAPITA (PPP) THAN CHINA AND 15 HIGHER THAN INDIA
1.34 billion people
$5.93 trillion GDP
1.17billion people
$1.73 trillion GDPAFRICA
INDIA
1.02 billion people
$1.69 trillion GDP
2.3%
population growth
0.5%
population growth
1.3%
population growth
With over one billion consumers—a number growing faster than that of any other continent—Africa boasts a wealth of potential. The young and quickly growing population, paired with a rising gross domestic product (GDP) that has grown faster than the rest of the world every year since 20011, make Africa a vital market brimming with opportunity. Traditionally viewed as an impoverished continent with little discretionary spending, Africa’s middle class is growing at an astounding rate and the GDP per capita (PPP) has grown 26 percent in the past 10 years2. With its steadily rising incomes, Africa offers vast potential and rewarding growth opportunities.
PEOPLEBEHIND THE NUMBERS
THE
DEMOCRATIC REPUBLIC OF CONGOhas the lowest usage of print media
NIGERIA has the highest CPG category spend
ETHIOPIA has the lowest overall penetration of CPG categories
KENYAhas the highest penetration of modern retail channels
UGANDA has near ubiquitous radio penetration
TANZANIA has the most CPG categories over 75% penetration
ZAMBIAhas the lowest TV penetration (67% of respondents)
Source: Nielsen Emerging Market Insights based on average of urban and peri-urban consumers in seven countries studied: (Nigeria, Ethiopia, Uganda, Kenya, Tanzania, Zambia and the Democratic Republic of Congo)
1 The World Bank: World Bank Development Indicators: World Bank national accounts data, and OECD National Accounts data files.2 The World Bank: World Development Indicators: World Bank, International Comparison Program database.

Copyright © 2012 The Nielsen Company. 3
ETHIOPIA
KENYA
NIGERIA
TANZANIA
UGANDA
DEMOCRATIC REPUBLIC OF CONGO
ZAMBIA
MOZAMBIQUE
ANGOLA
NAMIBIA
ZIMBABWE
GHANA
Available Now
Available Q2 2012
Diverse People of AfricaDespite the exciting opportunities and considerable promise of the African continent, doing business here also comes with significant challenges. Aside from political turmoil, wide income disparities, and infrastructure shortfalls, one of the biggest issues facing marketers in Africa is its diversity. Rather than just a continent, Africa must be viewed as 54 separate and distinct countries with a wide array of political, economic, geographical, cultural and social features. Even a single country like Nigeria has over 250 different ethnic groups and over 500 languages3. In addition to the differences separated by international borders, many African countries also boast incredible levels of internal diversity, which are impacted heavily by their respective colonial histories. By and large, local consumers in each of the markets studied have remained loyal to the consumption patterns and ethnic tastes of their former colonial rulers. This fragmented cultural landscape presents a unique challenge to marketers trying to tailor their message to African consumers.
Nielsen provides a unique and in-depth view into the diverse behaviors and attitudes that shape the diversity of the African consumer. Through extensive research into the retail infrastructure and a comprehensive survey of urban and peri-urban consumers across Sub-Saharan Africa, Nielsen knows how Africans think, buy, and consume media. Based on these insights, seven unique consumer segmentations provide an intimate look into the diverse needs that will not only highlight latent potential of these countries, but will also enable accurate decision making to confidently determine where, when and how to invest in African markets.
CO
UN
TRIE
S IN
TH
E N
IELS
EN S
TUD
Y
3 CIA - The World Factbook

4 Copyright © 2012 The Nielsen Company.
Similarities Among the DifferencesWhile diversity defines the African consumer, traditional attitudes and beliefs centered on family, affordability, loyalty, colonial history and planning for the future are core themes that permeate the lifeblood of the African consumer and strongly influence buy and watch behaviors.
Low incomes in Africa dominate and dictate rational purchase considerations that focus on daily essentials such as tea, basic oral care, cooking oil and detergents. Affordability and brand loyalty are key purchase drivers. In fact, three out of 10 consumers say they always buy the same brand. Traditional trade outlets such as small shops, table tops, open markets and kiosks dominate the retail landscape, but more affluent consumers shop supermarkets for products like cheese and antiseptics.
To succeed in Africa, it is important to not only ensure distribution in an unorganized market, but it is just as critical to confront the challenge of delivering an affordable product that gains consumer trust through offering quality and value.
On the media front, while TV and radio dominate the airwaves in the countries studied with penetration levels of 90 percent and 87 percent, respectively, mobile technology is rapidly growing and keeping pace. The mobile phone has become a cornerstone for connection among 86 percent of respondents who use the technology primarily for text messaging. Print and online sources are far less popular and are mainly used by more affluent consumers.
Source: Nielsen Emerging Market Insights. Based on average of urban and peri-urban consumers in seven countries studied: (Nigeria, Ethiopia, Uganda, Kenya, Tanzania, Zambia and the Democratic Republic of Congo)
With limited budgets, trust and affordability are important
WHAT FACTORS INFLUENCE YOUR DECISION TO BUY?(% of respondents)
Expensive brands
Any brand
Small pack sizes
Big pack sizes
BottomResponses
Affordable brands 37 Tried brands 31 Same brand 31
TopResponses
6899
Source: Nielsen Emerging Market Insights. Based on average of urban and peri-urban consumers in seven countries studied: (Nigeria, Ethiopia, Uganda, Kenya, Tanzania, Zambia and the Democratic Republic of Congo)
Media penetration across Africa
TV, MOBILE, AND RADIO HAVE CONSISTENTLY HIGH PENETRATION, WHILE PRINT AND INTERNET PENETRATION VARIES AMONG SEGMENTSAverage Penetration
90%TV
87%Radio
86%Mobile
46%Newspaper
27%Magazine
25%Internet

Copyright © 2012 The Nielsen Company. 5
Uncommon Diversity – One African FamilyWhile certain traditional preferences define one Africa, in a land with thousands of distinct ethnicities there is no “single African consumer”. Appreciating the diversity of the African market, Nielsen identified seven consumer segments based on demographic and attitudinal differences to help bring a unified understanding of how to reach consumers in this vast continent.
Comparing the seven distinct segments based on monthly income and average spend on consumer packaged goods (CPG) categories, three tiers emerged:
TIER 1: Trendy Aspirants and Progressive Affluents are the wealthy, urban, well-educated Africans with high income and CPG category spend. They drive modern trade, print and online penetration and are more open to expensive and new brands.
TIER 2: Balanced Seniors and Struggling Traditionals are middle aged, mid-income Africans with average CPG category spend. They are heads of households, shop for their family and are focused on affordability.
TIER 3: Evolving Juniors, Wannabe Bachelors and Female Conservatives are Africa’s biggest tier, comprised of consumers who spend much less than average on CPG categories. Primarily young and lower class, they are otherwise a diverse group comprised of consumers from increasingly modern students to conservative housewives.
Source: Nielsen Emerging Market Insights. Based on average of urban and peri-urban consumers in seven countries studied: (Nigeria, Ethiopia, Uganda, Kenya, Tanzania, Zambia and the Democratic Republic of Congo)
Three consumer tiers emerged based on income and spending
DIFFERENT PURCHASING HABITS ACROSS TIERS CALL FOR DIVERSE STRATEGIES AND OFFERINGS
Mean monthly household income (USD)
210
190
170
150
130
110
90
70
50
Mon
thly
CPG
Cat
egor
y Sp
end
(USD
)
0 200 400 600 800 1000 1200
TrendyAspirants
BalancedSeniors
WannabeBachelors Evolving Juniors
Female Conservatives
Progressive Affluents
Struggling Traditionals
Tier 3
Tier 2
Tier 1
24%
17%
11%
10%
7%
10%
21%

6 Copyright © 2012 The Nielsen Company.
Get to Know Tier 1: Trendy Aspirants and Progressive Affluents Trendy Aspirants (21%) and Progressive Affluents (7%) represent higher-class African consumers, spending and earning more than other segments. Representing just 28 percent of the population, they control 47 percent of the income and 40 percent of CPG category spend. They are well-educated and predominately urban.
Tier 1 consumers are willing to pay more for better service and they have higher penetration across most categories, especially discretionary categories like air-fresheners or deodorants. They are more likely to shop at modern trade stores and have high media usage, especially across the Internet and social media. Tier 1 consumers also have the highest usage of Internet-based activities on the mobile phone and over half of them have more than one mobile line.
Despite their similarities, there are lifestyle differences between both segments. Trendy Aspirants are young, ‘up-and-coming’ high-end consumers, while Progressive Affluents are older and tend to have families. Progressive Affluents are also better educated, belong to a higher socio economic class and are more likely to be online.
Tier 1 represents affluence. They have the highest discretionary spending of the tiers and buy the widest range of CPG products. They shop at modern trade stores and are easily accessible through more forms of media than other tiers. Tier 1 consumers are more open to buying expensive and exclusive value-added products and can be reached using more advanced media campaigns, such as the Internet or social media platforms.
Offer higher-end discretionary products
Build distribution in modern trade outlets
Reach out using the Internet and social media platforms
Appeal to Their Upscale Taste
% Population 28
% Income 47
% CPG Spend 40
Trendy AspirantsYoung and Up-coming
Progressive AffluentsOlder with Families
Tier 1:• Well educated• Willing to pay more • High media usage • Shop modern trade

Copyright © 2012 The Nielsen Company. 7
Get to Know Tier 2: Balanced Seniors and Struggling Traditionals Balanced Seniors (17%) and Struggling Traditionals (10%) spend an average amount on CPG categories. Accounting for 27 percent of the population, they are responsible for 28 percent of CPG category spend, but only 22 percent of total income. They tend to be in their mid–thirties, are married, act as the head of the household, and mostly live in peri-urban areas. Common beliefs and attitudes are centered on strong family and religious orientations, respect for elders, and a keen focus on affordability. Balanced Seniors and Struggling Traditionals shop at traditional trade stores and are average consumers of mass media like TV and radio.
Differences in income, driven by education and occupation separate these two segments. Balanced Seniors are better educated (post secondary school) and have a higher income (around $550 per month). They are willing to stand out and take risks and are much more likely to read magazines or newspapers. In contrast, Struggling Traditionals haven’t completed secondary school, have low income ($285 monthly) and under-index on penetration across most categories. Only 75 percent of Struggling Traditionals own a mobile phone, which is among the lowest of the seven segments studied and they are the least likely to upgrade their current mobiles to a new device.
To reach these segments, cater to heads of households who shop for their families. Struggling Traditionals are eager to try new products, but are strongly focused on affordability. Inexpensive products that add maximum value are important considerations.
Balanced Seniors are focused both on affordability and trust. While they spend the same amount as Struggling Traditionals, they earn considerably more. Build a relationship of trust to move them up the product chain to more expensive and discretionary goods.
% Population 27
% Income 22
% CPG Spend 28
Offer inexpensive products that add maximum value
Use traditional media platforms
Experiment with new products
Earn Their Trust and Build Loyalty
Balanced SeniorsBetter Educated/ High Income
Struggling TraditionalsUnder Educated/Low Income
Tier 2:• Older and married• Live in peri-urban areas• Shop traditional trade • Average mass media usage
8 Copyright © 2012 The Nielsen Company.
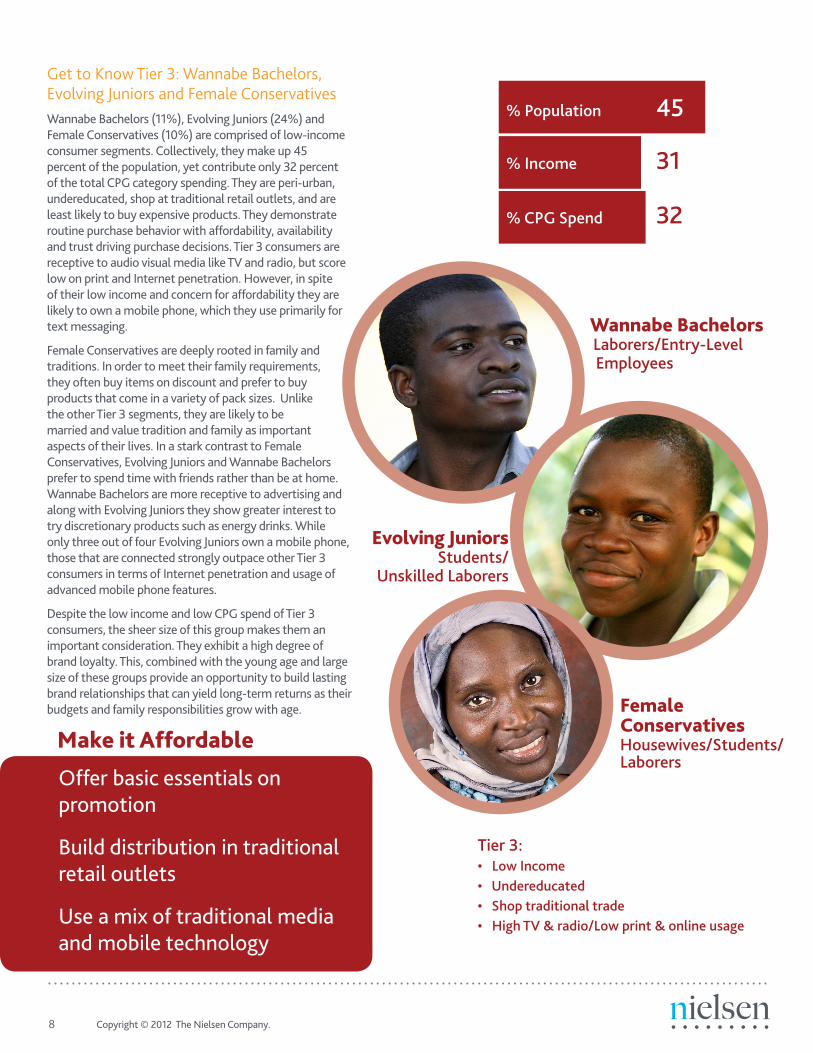
% Population 45
% Income 31
% CPG Spend 32
Get to Know Tier 3: Wannabe Bachelors, Evolving Juniors and Female Conservatives Wannabe Bachelors (11%), Evolving Juniors (24%) and Female Conservatives (10%) are comprised of low-income consumer segments. Collectively, they make up 45 percent of the population, yet contribute only 32 percent of the total CPG category spending. They are peri-urban, undereducated, shop at traditional retail outlets, and are least likely to buy expensive products. They demonstrate routine purchase behavior with affordability, availability and trust driving purchase decisions. Tier 3 consumers are receptive to audio visual media like TV and radio, but score low on print and Internet penetration. However, in spite of their low income and concern for affordability they are likely to own a mobile phone, which they use primarily for text messaging.
Female Conservatives are deeply rooted in family and traditions. In order to meet their family requirements, they often buy items on discount and prefer to buy products that come in a variety of pack sizes. Unlike the other Tier 3 segments, they are likely to be married and value tradition and family as important aspects of their lives. In a stark contrast to Female Conservatives, Evolving Juniors and Wannabe Bachelors prefer to spend time with friends rather than be at home. Wannabe Bachelors are more receptive to advertising and along with Evolving Juniors they show greater interest to try discretionary products such as energy drinks. While only three out of four Evolving Juniors own a mobile phone, those that are connected strongly outpace other Tier 3 consumers in terms of Internet penetration and usage of advanced mobile phone features.
Despite the low income and low CPG spend of Tier 3 consumers, the sheer size of this group makes them an important consideration. They exhibit a high degree of brand loyalty. This, combined with the young age and large size of these groups provide an opportunity to build lasting brand relationships that can yield long-term returns as their budgets and family responsibilities grow with age.
Offer basic essentials on promotion
Build distribution in traditional retail outlets
Use a mix of traditional media and mobile technology
Make it Affordable
Wannabe BachelorsLaborers/Entry-Level Employees
Female ConservativesHousewives/Students/ Laborers
Tier 3:• Low Income• Undereducated• Shop traditional trade• High TV & radio/Low print & online usage
Evolving JuniorsStudents/
Unskilled Laborers

Copyright © 2012 The Nielsen Company. 9
Uncommon Diversity Requires an Uncommon ApproachIncome DisparityAs the tactics and strategies needed to reach consumers across Africa require different approaches due to varied beliefs and behaviors, each country also requires a unique strategy. For example, while most countries are predominately rural, one half of Nigerians live in urban areas. Average Nigerian salaries of $850 per month stand in stark contrast to the average salaries in Ethiopia, Uganda, and Zambia, of less than $300 per month, leading to a smaller population of Tier 1 consumers in these low-income countries. Conversely, while Kenya over indexes heavily on its population of Progressive Affluents, Nigeria has more Trendy Aspirants than any other country.
Attitudes & BeliefsSpending time with family and planning for the future are resoundingly important beliefs among most consumers across countries. However, attitudes around technology, fashion, loyalty and how to spend leisure time can vary considerably. At one end of the spectrum, Nigerian consumers are technology savvy, fashionable, willing to try new things, individualistic and also brand loyal. Conversely, Ethiopian consumers are not fashion conscious or brand loyal, prefer to look natural and are constrained by life’s circumstances.
Media PreferencesOf all the media in Africa, the mobile phone has proven to be the fastest growing over recent years. Across the countries surveyed, 86 percent of respondents own at least one mobile phone, with one out of four Nigerian respondents owning more than one. This growing mobile landscape is dominated by prepaid users who recharge by cards and vouchers, though in the Democratic Republic of the Congo, one-third of respondents recharge via a dealer phone. TV and radio viewership are high across most countries, but the preferred programming content varies. Zambia lags the other countries across most media penetration, with the exception of radio and newspapers, which keep stride with the average. Kenyan consumers exhibit higher usage levels across all media, especially the Internet, social media and print.
Shopping PatternsConsumer spending and shopping patterns differ widely across countries. Nigerians spend the most on CPG products whereas Ethiopia, Uganda and Kenya spend least. In Ethiopia, only daily essentials like tea, coffee and cooking oil have high penetration and consumers are likely to shop for products on discount. Tanzania has the highest number of categories with penetration above 75 percent and consumers are likely to keep up with the newest trends in fashion and technology. In all countries, traditional retail formats dominate, though modern trade is showing strength in Kenya.
Country Comparison
Zambia
DRC
Tanzania
Confident about future
Challenging business environment
Low media penetration
High print media penetration
Fashionable
Willing to try new things
Low trial attitude
Low media penetration
Tradition and individualism important
Uganda
Young and fast-growing
High radio and newspaper usage
Lowest CPG spend of countries surveyed
Nigeria Affluent Consumer Segments
Highest CPG spend
Highest mobile phone ownership
Kenya
Affluent Consumer Segments
High Internet and social media usage
Shop supermarkets
Ethiopia Low CPG penetration
Important to look like natural self
Most basic mobile phone usage
Source: Nielsen Emerging Market Insights. Based on average of urban and peri-urban consumers in seven countries studied: (Nigeria, Ethiopia, Uganda, Kenya, Tanzania, Zambia and the Democratic Republic of Congo)

10 Copyright © 2012 The Nielsen Company.
A Different Approach In Africa, income disparities and diverse attitudes lead to very different buy and watch habits across both consumer segments and geographical regions. Pricing, promotion and distribution strategies will have to be modulated depending on the intended consumer segment or country. Tier 1 consumers will require much different product offerings and messages than the lower income Tier 3 consumers. And media strategies in Internet-savvy Kenya will differ from those in Zambia.
With a large, young, and rapidly growing consumer base, the emergent opportunities in Africa are likewise bountiful. In order to realize the growing potential that Africa offers, an intimate knowledge and understanding of the African consumers is critical. Getting into the mind of the African consumer to understand the beliefs and attitudes that drive buy and watch behaviors will be the key to unlocking Africa’s potential.
Source: Nielsen Emerging Market Insights. Based on average of urban and peri-urban consumers in seven countries studied: (Nigeria, Ethiopia, Uganda, Kenya, Tanzania, Zambia and the Democratic Republic of Congo)
Spending time with family and planning for the future are important themes
Zam
bia
Ken
ya Spending time with familyPlanning for the future
Nig
eria Planning for the
futureWomen's opinion is important
DRC
Planning for the futurePersistent efforts to get results
Tanz
ania Spending time
with familyWomen's opinion is important
Ethi
opia Women's opinion is
importantPersistent efforts to get results
Uga
nda Spending time with familyShould obey elders
TOP TWO ATTITUDES BY COUNTRY

For more information, please contact yourNielsen representative
Countries in the Study: Democratic Republic of CongoEthiopiaKenyaNigeriaTanzaniaUgandaZambia
Countries Available Q2 2012:AngolaGhanaMozambiqueNamibiaZimbabwe
About the Study
The Nielsen Emerging Market Insights Study provides an in-depth understanding of African markets and consumers. The study is based on face-to-face surveys from a sample of 5,000 urban and peri-urban residents between the ages of 15 and 45 across SEC groups A-E in and around key cities in seven Sub-Saharan African countries; Democratic Republic of Congo, Ethiopia, Kenya, Nigeria, Tanzania, Uganda, and Zambia. Five additional countries will be available mid-Q2 2012; Angola, Ghana, Mozambique, Namibia, and Zimbabwe. Findings from the study provide vital information into growth opportunities within the marketplace, insight into consumer attitudes that drive decisions on what African consumers watch and buy, and a fact-based understanding of how to reach consumers.
About Nielsen
Nielsen Holdings N.V. (NYSE: NLSN) is a global information and measurement company with leading market positions in marketing and consumer information, television and other media measurement, online intelligence, mobile measurement, trade shows and related properties. Nielsen has a presence in approximately 100 countries, with headquarters in New York, USA and Diemen, the Netherlands. For more information, visit www.nielsen.com
Copyright © 2012 The Nielsen Company. All rights reserved. Nielsen and the Nielsen logo are trademarks or registered trademarks of CZT/ACN Trademarks, L.L.C. Other product and service
names are trademarks or registered trademarks of their respective companies. 12/4605