the district of north vancouver dnv official community plan | transportation plan executive summary...
TRANSCRIPT

Inspired by nature, enriched by people
The District of North VancouverTransportation Plan
h


Table of Contents
Acknowledgements 1
Executive Summary 2
1.0 IntroductIon 5
2.0 ExIStIng condItIonS 19
3.0 WALKIng 32
4.0 cycLIng 41
5.0 trAnSIt 49
6.0 roAd SAfEty 59
7.0 roAd dESIgnAtIon 68
8.0 roAd nEtWorK 78
9.0 trAnSportAtIon dEmAnd mAnAgEmEnt (tdm) 87
10.0 fundIng, ImpLEmEntAtIon, & monItorIng 93
MapsWalking 37
cycling 45
transit 55
road Safety 65
Road Classification Strategy 73
road designations 75
road network 83

DNV Official Community Plan | Transportation Plan
This page intentionally left blank.

DNV Official Community Plan | Transportation Plan 1
AcknowledgementsThe District of North Vancouver Transportation Plan was developed under the leadership of District of North Vancouver Council with extensive involvement of the Transportation Consultation Committee, residents and businesses of the District.
Representatives from the Ministry of Transportation and Infrastructure, TransLink, the City of North Vancouver, the District of West Vancouver, the City of Vancouver, Port Metro Vancouver, Vancouver Coastal Health and School District 44 provided valuable input.
Comments from the Squamish Nation and Tsleil-Waututh Nation were welcomed and incorporated in the development of the Plan. The Plan has been written without prejudice to First Nations’ assertions of aboriginal rights and title to their traditional territories.
The process of developing this plan involved close collaboration between District of North Vancouver staff from transportation planning, sustainable community development planning, engineering services, finance, parks, environmental protection, information technology and other departments within the District.

2 DNV Official Community Plan | Transportation Plan
Executive Summary
Purpose of the Plan
The District of North Vancouver’s Transportation Plan endeavours to address residents’ desire to make the District an even-better place to live with plentiful options for walking, cycling, taking transit, and safe driving.
The plan responds to input heard from District residents in the 2012 Transportation Planning Priorities survey that:
» Overall, residents place the highest levels of priority on ensuring that the transit system is efficient, reliable and frequent, and on providing safer routes for children walking to school.
» Residents also place relatively high priority on ensuring that neighbourhood livability is taken into consideration when road improvements are planned, and on making changes that will reduce road collisions and improve traffic safety.
» Residents generally place higher priority on quality transit, neighbourhood liveability, and safety than on cycling connections.
The plan also addresses the District’s desire to reduce greenhouse gas emissions, improve public health, take advantage of partner funding, and develop more options for how people of all ages and abilities get around in this community.
Fit with the Official Community Plan (OCP)
As District policy, the plan is intended to deliver a sustainable transportation network supporting the Official Community Plan (OCP) approved by Council in 2011.
This plan includes actions that support the District in reaching the OCP transportation target of increasing trips made by walking, cycling and transit from 21 percent in 2011 to over 35 percent in 2030.
In the OCP, new growth is targeted in Lower Capilano Village Centre, Lower Lynn Town Centre, Lynn Valley Town Centre, and Maplewood Village Centre. The plan includes transportation investments needed to support the successful development of these areas with safer roads, transit supportive measures, better places to walk, as well as cycling connections.

DNV Official Community Plan | Transportation Plan 3
Listen to Community + Studies = Transportation Plan
The Transportation Plan was developed over four years incorporating input from:
» The Official Community Plan;
» Background studies;
» Stakeholders, including the District’s Transportation Consultation Committee;
» The 2012 Transportation Planning Priorities survey;
» Consultation with the public online and at a series of public events; and
» Council workshops.
DiSTriCT-WiDE• Spirit Trail• Safe routes to School• pedestrian crossings• Bike routes through re-
paving • Transit supportive
improvements
LyNN VALLEy• intersection safety
improvement: Lynn Valley road and mountain Highway
• Sidewalks: mountain Highway, ross road, Institute road, 29th Street
• Bike routes: Lynn Valley road, 29th Street
• Transit stop improvements
LoWEr LyNN• Highway 1 Interchanges• north service road• Keith road and bridge• Spirit Trail bridge at Lynn
creek• Bike routes:Keith road,
Barrow Street, orwell Street
• phibbs transit facility improvement
• Sidewalks: mountain Highway
• mountain Highway corridor improvements
• main Street corridor improvements
LoWEr CAPiLANo• intersection safety
improvement: Capilano road and curling road
• Transit priority: Capilano road corridor
• Bike routes: Hope Road, north-south east of Capilano Road
MAPLEWooD• intersection safety
improvements: dollarton Highway and riverside drive
• Bike route: mount Seymour parkway
• Transit stop improvements
Figure ES 1: Transportation Plan Priorities

4 DNV Official Community Plan | Transportation Plan
objectives of the Transportation Plan
Walking - Ensure safe and comfortable opportunities to walk are provided for pedestrians throughout the community for a variety of trip purposes.
Cycling - Provide a more complete cycling network that is safe and efficient for all ages and abilities.
Transit - Support the delivery of an enhanced and more integrated transit system across the community.
Driving
» Employ a range of solutions and countermeasures to make the road network as safe as possible, for all road users.
» Manage the existing road network to optimize safety and efficiency, while ensuring the integration of sustainable travel modes into the system.
» Manage road infrastructure in such a way that minimizes impacts on neighbourhoods, improves road safety, and enables the efficient movement of goods and people.
Transportation Demand Management (TDM) - Implement strategic and practical TDM measures to make walking, cycling and transit as more viable options to driving.
Funding & implementation
This transportation plan is financially ambitious over a twenty year horizon. Nonetheless, with partner funding, the plan appears to be within the District’s capabilities.

DNV Official Community Plan | Transportation Plan 5
1 introduction
The Official Community Plan includes the goal that transportation and land use planning be strategically integrated.
Our ability to move around quickly, safely, affordably, and comfortably affects every aspect of our lives.
The mode of transportation we use also has consequences for our environmental and personal health: walking to the bus stop or cycling to work, for example, can both reduce greenhouse gas emissions and provide good exercise.
The District of North Vancouver’s new long range Transportation Plan was developed to reflect the District’s vision of creating a sustainable and safe transportation network. To achieve this vision, the plan includes a series of recommended improvements to increase transportation options for residents.
The previous District Transportation Plan called the Transportation Network Study (1990) is dated. It is no longer aligned with the District’s Official Community Plan (OCP) and does not reflect 2012 travel behaviour, economic and environmental realities, or priorities of District residents.
Over the next 20 years, the plan endeavours to address residents’ desire to make the District an even-better place to live with plentiful options for walking, cycling, taking transit, and safe driving.

6 DNV Official Community Plan | Transportation Plan
As District policy, the plan is intended to deliver a sustainable transportation network supporting the Official Community Plan (OCP) land use vision that was approved by Council on June 27th, 2011. The Transportation Plan builds on the OCP and includes specific policy directions and network plans to help move people efficiently and safely, be equitable, respond to pressing environmental concerns, and elevate quality-of-life in the District.
The process undertaken in developing the plan is summarized as follows:
2008 - 2011• Council endorsement of
transportation goals• Alignment with OCP devel-
opment• Background studies • Public and stakeholder
consultation
Spring 2012• Consultation
draft plan
July 2012• Plan adoption
by council
Between 2008 and 2012, the Transportation Plan was developed incorporating extensive input from the public through:
» The Official Community Plan development process;
» Feedback from the public on transportation background studies;
» Information from dialogue with stakeholders, including the District’s Transportation Consultation Committee.

DNV Official Community Plan | Transportation Plan 7
Consultation held in Spring 2012 confirmed the priority that District residents place on implementing proposed improvements so that the District can plan improvements that best meet residents’ needs. The process included:
Activity Timing responses
Survey• online • Paper copies
march 1st – 31st, 2012 249
open House Events • Lynn Valley Library • Atrium at dnV Hall• parkgate Library
• March 5th – 4 to 6 pm• March 6th – 7 to 9 pm• March 7th – 5 to 6:30 pm
412116
Philosophers’ Café Lynn Valley Main Library
March 14, 2012 - 7:00 pm 10
Transportation Consultation Committee
march 2012 6
TransLink City of North Vancouver District of West Vancouver City of Vancouver Port Metro Vancouver Tsleil Waututh NationVancouver Coastal Health Grouse Mountain
March and April 20128
New immigrants Session -North Shore Multicultural Society
May 10, 2012, 12:30-2:00 pm 13
other Community Groups By email and at their meetings
ToTAL NUMBEr oF rESPoNSES iN ALL ACTiViTiES 364

8 DNV Official Community Plan | Transportation Plan
New Immigrants Session – North Shore Multicultural Society
The 2012 Transportation Planning Priorities survey results were consistent with input heard during the entire consultation process. The results area as follows:
» Overall, residents placed the highest levels of priority on ensuring the transit system is efficient, reliable and frequent, and on providing safer routes for children walking to school. Nine out of ten residents surveyed rated these improvements as either a ‘higher’ or ‘top priority’ for the District to implement.
» Residents also placed relatively high priority on ensuring that neighbourhood liveability is taken into consideration when road improvements are planned, and on making changes that will reduce road collisions and improve traffic safety.
» Residents generally placed higher priority on quality transit, neighbourhood liveability, and safety than on cycling connections.
The transportation priorities outlined in the plan respond to input from District residents and stakeholders.

DNV Official Community Plan | Transportation Plan 9
Fit with the Official Community Plan (OCP)The OCP includes an explicit goal that transportation and land use planning be strategically integrated. The Transportation vision has been developed in close alignment with the development of the OCP network of centres concept.
The OCP provides a growth management and urban structure plan for the District. The long term transportation vision is a strategic action plan for integration of transportation and land use planning.
The oCP aims to increase the mode share of walking, cycling and transit from 21% in 2011 to 35% in 2030. The North Shore Area Transit Plan is expected to increase percent trips by transit from 10% to 15%. Implementation of intensified land use in centres and increased investment in cycling networks, sidewalks and crossings is expected to increase walking and cycling mode share from 11% to 20%. About 65% of trips will still be made by car and so, investments in road safety will also be necessary.
The regional goal is 45% trips by walking, cycling and transit in 2030 but, the District’s goal is lower largely due to the continued prevelence of lower density single family neighbourhoods.
The District’s OCP goal for transportation is to “provide a safe, efficient and accessible network of pedestrian, bike and road ways and enable viable alternatives to the car through effective and coordinated land use and transportation planning” and includes a series of policies to support this goal.

10 DNV Official Community Plan | Transportation Plan
The Transportation Plan provides more detailed strategies to implement the policies included in the OCP. Strategic transportation priorities will support the development of the network of centres.
Planning to 203075-90% of growth focused in four key centres:• Lynn Valley• Lower Lynn• Lower Capilano - Marine• Maplewood
For each centre, investments will be needed for safer roads, crossings and cycling connections as well as sidewalks and transit supportive measures. The plan aims to complete a large portion of the priority projects identified in the centres over the next five years. Outside of the centres, some investments will still be needed to support initiatives like the Spirit Trail and safer routes to school.
DiSTriCT-WiDE• Spirit Trail• Safe routes to School• pedestrian crossings• Bike routes through re-
paving • Transit supportive
improvements
LyNN VALLEy• intersection safety
improvement: Lynn Valley road and mountain Highway
• Sidewalks: mountain Highway, ross road, Institute road, 29th Street
• Bike routes: Lynn Valley road, 29th Street
• Transit stop improvements
LoWEr LyNN• Highway 1 Interchanges• north service road• Keith road and bridge• Spirit Trail bridge at Lynn
creek• Bike routes:Keith road,
Barrow Street, orwell Street
• phibbs transit facility improvement
• Sidewalks: mountain Highway
• mountain Highway corridor improvements
• main Street corridor improvements
LoWEr CAPiLANo• intersection safety
improvement: Capilano road and curling road
• Transit priority: Capilano road corridor
• Bike routes: Hope Road, north-south east of Capilano Road
MAPLEWooD• intersection safety
improvements: dollarton Highway and riverside drive
• Bike route: mount Seymour parkway
• Transit stop improvements
Figure 1.1: Transportation Plan Priorities

DNV Official Community Plan | Transportation Plan 11
Why Have a Transportation Plan?The Transportation Plan provides detailed strategies to implement the policies included in the OCP over the next twenty years. Community benefits of the Transportation Plan for the District of North Vancouver are summarized below.
resident Priorities
Transportation issues are a top priority for District Residents according to a several community surveys.Citizens are concerned about traffic congestion and a lack of viable alternatives to the personal automobile, including public transit.
Safety
Investments in high priority intersection and corridor improvements will target reduction in crashes in the District and improve road safety. Since 2007, crash rates in North Vancouver and in the region have been declining, but only slightly.
ResidentsPriorities
Safety
Public Health
Environment
Economy
Inclusiveness
AfforableAlternatives
PartnerFunding
Community Liveability

12 DNV Official Community Plan | Transportation Plan
Public Health
Our dependence on cars can have negative impacts on human health like decreased opportunities for physical activity, increased exposure to air pollution, and increased risk of traffic collisions. Research shows that people who live in walkable and bikeable neighbourhoods are healthier, less stressed, less isolated, and have lower rates of depression. According to the Vancouver Coastal Health, over 9 percent of North Shore residents are obese, and 28 percent are overweight (North Shore Community Health Profile, 2009). These conditions are associated with dramatically higher instances diseases such as diabetes, cancer, stroke and heart disease.
Recent medical studies have found that walking 30 minutes every day is the single best thing that you can do for your health. Studies have also found that cycling is one of the most effective ways to improve fitness and combat health problems like obesity and cardiovascular disease. Bicycle travel is about three times faster than walking, for the same amount of energy. Leisurely cycling burns calories at the same rate as brisk walking (about 600 calories per hour) (TransLink, 2011). Overall higher physical activity levels among residents could contribute to lower overall health care costs.
Environment
Motor vehicles account for about 43 percent of the District’s greenhouse gas emissions that contribute to climate change. The District has committed in its OCP to a collaborative approach to land use and transportation planning that will build complete communities that are well served by transit and are easily accessible by walking and biking. Over time, people will also be more likely to purchase new vehicle technologies, like electric vehicles so it will become increasingly important to provide infrastructure for providing energy to these vehicles.
Source: BC Ministry of Environment, Hyla Environmental Services Ltd. Community Energy and Emissions Inventory
(2007); 2006 Census Population is 82,562
Transportation emissions are increasing in Metro Vancouver at a rate higher than other sources.
—Metro Vancouver
Transportation, 43%
Solid Waste, 6%
Building, 51%

DNV Official Community Plan | Transportation Plan 13
As of 2007, the combined GHG emissions of the whole District of North Vancouver community was approximately 573,000 tonnes annually or 6.9 tonnes per capita. Emissions in the District are primarily from buildings and transportation with a small amount coming from the decomposition of solid waste in landfills. Most of the emissions are associated with the burning of fossil fuels (natural gas and gasoline).
In Southern BC, including Metro Vancouver, greenhouse gas emissions led to significant climate change during the 20th Century; average annual temperatures have warmed by 0.5°C to 1.7°C. Precipitation has increased over the past decade and is predicted to continue to increase. This has already contributed towards profound environmental impacts on our region.
The Province of British Columbia has committed to reducing greenhouse emissions by 33 percent by 2020 via the Climate Action Plan (2008) and Bill 27 - Greenhouse Gas Reduction Targets Act (2007) which sets these legally-binding targets. Through implementation of the OCP, this Transportation Plan, and other plans and commitments, the District is taking action towards reducing GHG emissions.
inclusiveness
Providing alternatives to the car is in part a question of social equity. People with lower incomes, people travelling with young children, youth under 16, people with disabilities, and many of our seniors’ population require access to goods, services, and community amenities by walking, cycling, transit, car-sharing, as well as driving. Providing ample opportunities to safely walk and cycle in our communities improves the well-being of everyone.
Affordable Alternatives
As fossil fuel reserves dwindle, oil prices are predicted to continue to rise. Hence, residents will likely choose to walk, cycle, take transit or car-share more frequently. The Canadian Automobile Association estimates the cost of owning and operating a car to be about $8,945 a year, about $150 for a bicycle, and virtually no cost for walking.
The Transportation Plan reflects the existing and future needs of the population and emphasizes new ways of getting around.
Experiences, Reflections & Needs
I drove my car when employed as it was inconvenient to take bus service to work (carrying books, etc.) and cross-District transit is very time consuming. Now, in my retirement, I take transit as often as convenient, particularly to the City of North Vancouver and Vancouver.
—Darlene, District resident
14 DNV Official Community Plan | Transportation Plan
Partner Funding
This plan is needed in order for the District to attract partner funding from development, TransLink, the Province, ICBC, and others. Approved plans are often needed for funding.
Economy
The efficient movement of goods, freight, and people around the District is vital to community livability, vibrance, and economic prosperity. Access to the waterfront industries as well as access to airports, highways, and businesses all influence the attractiveness of the District as a place to work and invest.
Community Livability
Providing safe and attractive routes for walking, cycling and transit, also supports the liveability of communities and even improves the vibrancy of local businesses. Studies have shown that replacing automobile trips with walking, cycling, or transit provides more opportunities for chance encounters and facilitates more social interaction among residents.

DNV Official Community Plan | Transportation Plan 15
Goals for Transportation in the DistrictTo enhance the sustainability of the District’s transportation network, the following goals that were endorsed by Council in 2008 have guided the development of this plan for investment in the transportation system.
KEy GoALS For TrANSPorTATioN
1. Provide Transportation options for All
2. Promote Physically-Active Transportation Alternatives
3. reduce Transportation Demand
4. Create Places for People, Not Cars
5. Make the Lowest-impact Transportation Choice, the First Choice
6. Make a Sustainable Transportation System Happen.
Goal 1: Provide Transportation options for All
A key element of a sustainable community is a transportation network that is accessible for everyone, including youth, seniors, low-income individuals, and those with disabilities. Applying accessible design principles to facilities and infrastructure, such as sidewalks and trail networks, also assists in meeting social objectives by promoting transportation opportunities for all. Transit service must also be available for those for whom walking or cycling are infeasible. As the District’s population continues to age, providing alternatives to the vehicle and investing in non-vehicular infrastructure becomes increasingly important.
Goal 2: Promote Physically-Active Transportation Alternatives
Choices about transportation and infrastructure influence the health of citizens and the environment. Supporting a variety of active ways of getting around reduces greenhouse gas emissions and air pollutants while promoting a physically fit community. Studies show that neighbourhoods and communities that are designed for walking and cycling have lower rates of obesity and childhood asthma.
cc Im
age
cour
tesy
of K
ooco
r on
flic
kr

16 DNV Official Community Plan | Transportation Plan
Goal 3: reduce Transportation Demand
Congestion at the bridgeheads is an important issue for the District as the bridges provide access to jobs, shopping, and other amenities in the region. While travel between the North Shore and other areas of the region will continue to be important, the impacts of congestion may be reduced by intensification of commercial, recreational and employment land uses within the District. With a greater mix of land uses within the District, travel distances can be reduced and a broader range of trips can be satisfied by walking, cycling or transit. This is expected to free up road space for trucks moving goods and for trips that truly need to be made by car. This land use approach to transportation planning supports a strong, resilient, self-reliant economy in the District.
Goal 4: Create Places for People, Not Cars
There is a strong correlation between land use and transportation planning. Grouping housing, shopping, and workplaces in mixed-use centres allows easy access to services for pedestrians, cyclists and transit-users. Developing well-designed, liveable and dense mixed-use centres supports people in meeting their daily needs within walking distance of their homes. In addition to reducing greenhouse gas emissions, this increases community interaction and chance encounters, which builds social cohesion and a sense of community.
Goal 5: Prioritize the Lowest-impact Transportation Choice
In order of priority, walking, cycling, transit, goods movement, shared automobile use and finally single-occupancy automobile use, best addresses environmental and socio-economic considerations. By prioritizing investments in lowest-impact transportation choices, the District will encourage residents’ choices to walk, cycle, take transit, or rideshare for many of their trips.
Goal 6: Make a Sustainable Transportation System Happen
“Making it happen” is critical to meeting the transportation goals of the District. The Transportation Plan is a working and flexible document that will continue to guide change over its lifetime. This plan will be realized through cooperation, policy direction, financial support and performance monitoring. Financial strategies will enable implementation. Timely adjustments can be made, as necessary.
In recognition of our shared transportation network, working closely and consistently in our planning endevours with the City of North Vancouver, the District of West Vancouver, TransLink,and others is critical
Experiences, Reflections & Needs
Edgemont village is only a 10 minute walk so I will often walk for light groceries/library if not passing by as part of another trip. Off-road paths would be preferable to busy roads.
—David, District resident

DNV Official Community Plan | Transportation Plan 17
Planning PrioritiesIn preparing the plan, the District worked closely with partners to carry out a number of background studies between 2008 and 2011 including:
» Pedestrian Master Plan,
» Bicycle Master Plan,
» North Shore Area Transit Plan,
» Road Safety Plan,
» Lower Lynn Transportation Strategy,
» Road Network Plan, and
» Road Classification Strategy.
Evaluation of Projects
From the background studies, the District identified a long list of potential transportation improvements.
To determine priorities, this list of potential transportation initiatives was reviewed against evaluation criteria, such as:
» Alignment with OCP
» Safety
» Transportation choices
» Cost
» Partnering opportunities
» Ease of implementation
» Anticipated use
To determine near-term needs, these priorities were then reviewed relative to priorities for successful new growth and development in Lynn Valley, Lower Lynn, Lower Capilano and Maplewood centres.
The priorities are intended to be flexible. In some cases a lower priority project may be advanced sooner to leverage an implementation opportunity, such as funding from partner agencies or development contributions.

18 DNV Official Community Plan | Transportation Plan
Plan Structure
Pedestrian Cycling Transit road Safety
road Designation
road Network
Demand Management
iNTroDUCTioN, ViSioN & GoALS
ExiSTiNG CoNDiTioNS
FUNDiNG & iMPLEMENTATioN

DNV Official Community Plan | Transportation Plan 19
introductionThe following chapter provides a summary of existing conditions within the District of North Vancouver and the implications for future planning for the transportation network.
GeographyThe District of North Vancouver encompasses a large geographic area on Metro Vancouver’s North Shore. The District shares boundaries with the City of North Vancouver, the District of West Vancouver, Squamish Nation, and Tsleil-Waututh Nation.
Because of natural boundaries surrounding the District of North Vancouver, including mountains to the north, Burrard Inlet to the south, and Capilano River to the west, future growth in North Vancouver will be achieved through infill development. Enhanced environmental regulations like the urban containment boundary included in Metro Vancouver’s Regional Growth Strategy (2011) also limit development in the District’s undeveloped areas.
2 Existing Conditions
As the population profile changes travel patterns may shift.

20 DNV Official Community Plan | Transportation Plan
Transportation on the North Shore is influenced by other fixed factors which present challenges in the District’s transportation network.
» Regional roadway connections to the rest of the Metro Vancouver are limited by two bridges. As such, there is limited capacity for growth in the peak number of vehicular trips to and from the North Shore.
» North Shore vehicular movement is limited to a few major roadways, particularly in the east-west direction. The existing street network generally lacks connectivity, the street design pattern includes several cul-de-sacs, and there are many creeks and rivers without passable crossings. This challenge is exacerbated by the design of Highway 1, which bisects much of the road network in the District.
DemographicsPopulation Growth
According to the Statistics Canada Census of Population, the number of residents in the District of North Vancouver has increased by 19,091, or 30.1 percent, in the three decades between 1976 and 2006. In 2011, the District’s population was 82,562.
Figure 2.1 shows the population growth rates between 2006 and 2011, on the North Shore and in Metro Vancouver as a whole.
Figure 2.1 – 2006 to 2011 Population Growth Rates
The District’s total population between 1921 and 2006 is shown in Figure 2.2. The District anticipates its population growth to more closely represent its long-term historical average, with an estimated annual growth of 0.75 to 1.0 percent. The 2011 Official Community Plan anticipates a 2030 population of 105,000.
Source: Stats Canada (2006 Census)
District of North Vancouver
City of North Vancouver
West Vancouver Metro Vancouver0.0%
1.0%
2.0%
3.0%
4.0%
5.0%
6.0%
7.0%

DNV Official Community Plan | Transportation Plan 21
Age Distribution
Similar to demographic shifts in Metro Vancouver overall, the median age in the District is increasing. This shift in the population composition is notable in the larger percentage of seniors and lower percentage of children than in earlier decades. Between 1976 and 2006 the portion of the population age 19 or younger (children, teens and pre-teens) dropped from 36.7 percent to 26.2 percent. At the same time, the portion 65 years or older nearly tripled from 4.7 percent to 13.5 percent. Figure 2.2 presents the age distribution of District residents in 1976 and 2006.
The 2006 Census reported the District’s median age as 41.7 years, and over one-quarter (26.1 percent) of District residents were age 55 or older, equal to the population age 19 or younger. The median age ranges in Metro Vancouver from 36.9 years in Anmore to 51.3 years in White Rock, with the regional median as 39.1 years. Between 2001 and 2006, the District’s median increased by 2.1 years compared to 1.7 years for Metro Vancouver.
Although the City of North Vancouver has a younger median age then the District (40.1 years), West Vancouver also has a considerably greater median age (48.5 years). As a result, the District’s median age is slightly lower than the overall North Shore median. The aging population impacts how people get around, how often they travel, and the destination of trips starting in the District.
Source: Stats Canada
Figure 2.2 - Historic Changes in Population of the DNV
implications
The aging population impacts our transportation system as elderly individuals are likely to become more reliant on walking and transit. As the population profile changes, travel patterns may shift from traditional peak periods to mid-day periods, and trips will likely become more localized.

22 DNV Official Community Plan | Transportation Plan
The higher average age of the District’s population in comparison to Metro Vancouver is shown in Figures 2.3 and 2.4. In Figure 2.4, the black line shows Metro’s population pyramid.
Figure 2.3 - District Age Distribution: 1976 and 2006
Source: Stats Canada (2006 Census)
Figure 2.4 – District 2006 Population Pyramid
Source: Stats Canada (2006 Census)

DNV Official Community Plan | Transportation Plan 23
Household income
The median annual household income in the District is among the highest in the region at $77,032, 39.5 percent higher than Metro Vancouver overall.
Income levels correlate to transportation choices. Households with higher incomes are less likely to change behaviour in response to increased costs such as fuel prices, parking charges or vehicle fees. There is also a positive correlation of higher income to increased cycling (Translink, Cycling for Everyone, 2011).
implications
Household income impacts transportation choice and behaviours.
Household Size
The average household size in the District decreased 15.2 percent from 3.3 to 2.8 persons per household from 1976 to 2006. Household sizes in the District were larger than Metro Vancouver, which had an overall average of 2.6 persons per household in 2006.
The trend towards smaller household sizes is one factor that influences the District’s low population growth despite multi-family development. Between 1976 and 2006 the District added 10,660 private households, a 56 percent increase. However, as noted above, the population increased 30.1 percent during this period.
Between 2001 and 2006, the number of dwelling units in the District increased by 1429 (4.8 percent) while the total population increased by 252 (0.3 percent) persons. During the same period, Metro Vancouver’s population increased by 6.5 percent and number of dwelling units increased by 84,715 (10.8 percent).
Housing Type
Over half (56.9 percent) of the 29,745 District residences are single detached dwellings. Metro Vancouver municipalities range widely with 10.4 percent to 90.3 percent of the total occupied dwellings in a detached structure type. On the North Shore, West Vancouver had a similar proportion of single detached dwellings, while the City of North Vancouver had a lower share of single family homes. The comparison of dwellings by structure type for North Shore municipalities is shown in Figure 2.5.
Source: Stats Canada (2006 Census)
Figure 2.5 – Comparison of Dwellings by Housing Type

24 DNV Official Community Plan | Transportation Plan
The recent growth in dwelling units has been small, with an average of 134 dwelling units created per year between 2001 and 2006. The increase is realized through the construction of basement or secondary suites, as well as new, multifamily developments.
The 2006 Census reports that the ownership rate of private District dwellings was 82.6 percent, the same level that was reported in 1976. This level is higher than the average of 65 percent of private occupied dwellings that are owner occupied in Metro Vancouver. However, Anmore, Belcarra, Langley Township and Lions Bay have higher owner occupancy rates than the District.
implications
In general, low density single-family neighbourhoods are difficult and expensive to serve with effective public transportation. With a low number of riders living in close proximity to each bus stop, the cost effectiveness of transit supportive infrastructure is low in single family neighbourhoods. Distances between homes, transit stops, and destinations like schools and workplaces are large. As a result, the cost of providing transit service to single family neighbourhoods is high.

DNV Official Community Plan | Transportation Plan 25
Travel Patterns
Car ownership
The Insurance Company of British Columbia (ICBC) reports car ownership rates for the District and City of North Vancouver combined. Between 1999 and 2009, the number of cars registered in North Vancouver grew significantly from 75,000 to 85,000, a rate higher than population growth. In 2009 in North Vancouver, car ownership per capita was higher than the regional average at 0.62 vehicles per capita compared to the regional average of 0.58. Considering factors like the different land use and income attributes of the District compared to the City, car ownership rates are likely higher than 0.62 per capita within the District.
Daily Travel
A trip is defined as a movement by any means (vehicle, bus, foot, and bicycle) with a separate origin and destination. A trip from home to the dry cleaner and then to work, for example, would be calculated as two trips since there are two separate destination points.
TransLink’s 2008 Trip Diary results for trips that started in the District of North Vancouver indicated that:
» There are about 340,000 trips made in the District on a typical day.
» About 63 percent of trips are made by driving, 17 percent as a car passenger, 9 percent by transit, 9 percent by walking, and 2 percent by cycling. Less than 1 percent of trips were made by another mode of travel like a heavy truck.
» 53 percent of all trips are for personal business like recreation, shopping/dining or visiting the doctor’s office, 45 percent of trips are for travel to work, post-secondary or grade school, and about 1 per cent of trips are made during work.
» People in the District of North Vancouver make an average of 2.88 trips per day compared to the regional average of 2.67. The higher trip rate may be a factor of a lower level of mixing of land uses.
» As shown in Figure 2.6, the average trip beginning in the District of North Vancouver is about 8.0 kilometres in distance, which is lower than the regional average of 9.3 kilometres. The average trip beginning in the District by transit was 11 km, by driving was 10.0 kilometres, by cycling was 7.5 kilometres, as a car passenger was 7.0 kilometres, and by walking was 2.4 kilometres.

26 DNV Official Community Plan | Transportation Plan
Trip Diary results for the North Shore indicated that approximately 77 percent of trips remained on the North Shore and 14 percent of trips had a destination in Vancouver. In the morning peak period, 120,000 trips began on the North Shore and 100,000 trips ended on the North Shore, with the reverse pattern in the afternoon peak. For all types of trips, North Shore residents make few trips to other areas of Metro Vancouver with 5 percent of trips going to Burnaby or New Westminster, about 1 percent going to the Northeast Sector (Coquitlam, Port Coquitlam), and 1 percent going to each of Richmond and Surrey.
Source: TransLink Trip Diary Survey (2008)
Figure 2.6 – Trip Length by Mode and Purpose
implications
The results of the 2008 Trip Diary Survey and 2006 Census indicate that there is tremendous demand for travel within the North Shore and that on average trips are less than eight kilometres in distance. This supports the idea that new transportation options in the District will be well used by residents if a new framework for transit routes and a complete cycling and pedestrian networks are established on the North Shore.
Of trips that begin in the District and City of North Vancouver each day, 47 percent occur in the traditional peak travel periods (6:30-9:30am and 3:30-6:30pm) and 38 percent of daily trips take place in the midday period between 9:30am and 3:30pm. Personal trips make up almost 60 percent of all trips during the midday and 51 percent of all travel in the PM Peak period.

DNV Official Community Plan | Transportation Plan 27
Source: TransLink Trip Diary Survey (2008)
Figure 2.7 – Trips Originating in North Vancouver
Where District residents Work
According to the Statistics Canada Census (2006), in the District, about 12 percent of residents work from their home and a high proportion of District residents travel to other municipalities for work. The jobs-to-housing ratio is 0.52 with approximately 24,000 jobs and 46,000 residents in the labour force.
About 46 percent of the District’s labour force work on the North Shore and about one-third of the District’s labour force is employed in the City of Vancouver. The District’s labour force also travels to other areas of Metro Vancouver for work, with approximately 9 percent commuting to Burnaby another 3 percent commuting to Richmond, and remaining commuters traveling to other areas of the region.
Source: Stats Canada (2006 Census)
Figure 2.8 - DNV Resident Commute Destinations (Top 6)

28 DNV Official Community Plan | Transportation Plan
How District residents Travel to Work
According to the 2006 Census, 78 percent of workers that reside in the District drive, 10 percent take transit, and five percent walk or cycle to work. As shown in Figure 2.9, the District’s mode split is similar to that of West Vancouver, but differs from the City of North Vancouver where 20 percent of workers take transit and 11 percent walk or cycle to work. The difference in mode split can be attributed to land use context as the City of North Vancouver has a denser, mixed use, pedestrian-oriented environment.
Based on 2006 Census, people use different modes of transportation to get to work depending on where they work. 42 percent of workers that commute to downtown Vancouver take transit whereas only 4 percent of North Vancouver residents who commute to Burnaby and New Westminster take transit. Approximately 5 percent of people who live in the District of North Vancouver and work on the North Shore ride a bicycle or walk to work.
A number of factors influence people’s choice of mode of transportation, including the travel time advantages and reliability, the quality of the infrastructure, as well as the costs of travelling and parking. For example, the high transit mode share for downtown Vancouver compared to other areas of the region could be attributed to the travel time advantage and reliability, quality of services, the lower cost of transit compared to the costs of fuel and parking. The relatively low commuter mode share for cycling could be attributed to the lack of cycling infrastructure.
Source: Stats Canada (2006 Census)
Figure 2.9 - Transportation Mode Choice Across the North Shore

DNV Official Community Plan | Transportation Plan 29
Travel to Work in the District
Figure 2.10 illustrates the patterns of travel from other areas of Metro Vancouver to the District of North Vancouver for work. About 25 percent of people that travel to work in the District come from Vancouver, Burnaby and Coquitlam. Because there are workers coming into the District, there is a bi-directional commuting pattern for peak travel to and from the District.
FIGURE 2.10 – Home Origin of Commute Trips to DNV (Top 6)
Source: Stats Canada (2006 Census)
The majority of trips to work in the District begin in other municipalities. As such, connections to the District’s employment areas from across the North Shore and from the regional transportation network are important.

30 DNV Official Community Plan | Transportation Plan
District Transportation SystemSome key links in the District’s transportation network require coordination with partner agencies such as the Ministry of Transportation and Infrastructure (MoTI) and TransLink, the Regional Transportation Authority.
» Highway 1 – Highway 1 (known as “Upper Levels Highway”), from the Ironworkers’ Memorial Second Narrows Bridge to West Vancouver serves regional and provincial traffic and operates under the sole jurisdiction of the MoTI. While Highway 1 is intended to provide regional and inter-regional access for motor vehicles, this route is heavily used for local trips within North Vancouver because of the lack of east-west road connectivity.
» Major road Network – The Major Road Network (MRN) includes Marine Drive, Capilano Road south of Highway 1, Main Street, Mount Seymour Parkway, and parts of Riverside Drive, Mount Seymour Road and Dollarton Highway. The District shares jurisdiction over these roads with TransLink who contributes towards maintenance and upgrades.
» Transit Network – Transit services are provided by TransLink. Local transit services are accessible to residents in most areas of the District. Bus routes across Lions Gate and Ironworkers’ Memorial Second Narrows Bridges and the SeaBus passenger ferry connect the North Shore with the regional transit network.
» Local road Network – The local road network under municipal jurisdiction provides roads, bicycle facilities and sidewalks. There are several gaps in the on-street pedestrian and cycling network.
The District’s Parks department also plans and maintains urban trails that provide comfortable and often convenient connections for pedestrians and cyclists. Routes such as the Spirit Trail are key examples.
implications of Travel Patterns
Across Metro Vancouver, travel patterns have changed since the 1990s with more suburban employment and trips from suburb to suburb. The increases in the elderly population and the relatively high work-from-home population in North Vancouver have also resulted in a shift in travel patterns in the District. There is a more distributed trip pattern and the traditional suburb to downtown commute is less predominant than in years past.

DNV Official Community Plan | Transportation Plan 31
ConclusionThe existing transportation patterns in the District are a key input in identifying opportunities and key areas of focus for transportation network planning.
» A growing concentration of land uses in centres as outlined in the District’s OCP will contribute to increased mode share for walking, cycling and transit in the District.
» The built area in the District of North Vancouver is not expected to expand, so enhancements to the transportation network will generally involve improvements to existing infrastructure.
» As the population profile changes with an aging population, travel patterns may shift from traditional peak periods to mid-day periods, and trips likely become more localized.
» Due to a lack of east-west road connectivity within the District, trips within the District are made using Highway 1.
» There are gaps in the on-street pedestrian and bicycle network.
» The transit network can be revised by TransLink to reflect existing travel patterns.
» On average, trips that begin in the District are less than eight kilometres in distance.
» Low density single-family neighbourhoods will be challenging to serve with effective public transportation.
» Convenient connections between the District’s centres and locations both on the North Shore and across the region will continue to be important.

32 DNV Official Community Plan | Transportation Plan
3 Walking
Town and village centres will have more opportunities for walking and higher levels of pedestrian activity
introductionA pedestrian travels from place to place by foot or using an assistive mobility device, such as a wheelchair or stroller. Every trip begins or ends as a pedestrian, whether the trip is made by cycling, transit or driving.
In the District’s 2012 Transportation Planning Priorities survey, about 25 percent of respondents indicated that they plan on driving less and walking more in the next five years.
Increasing the number of walking trips in the District will result in continued reductions in air pollution, more people in the community enjoying an active lifestyle, more social interaction on the streets, safety benefits both in terms of safety in numbers and natural surveillance for crime prevention, and better support of local businesses. Active lifestyle benefits of walking often described by public health professionals include:
» Improved efficiency of heart and lungs;
» Increased energy and alertness, more restful sleep, reduced stress levels, and reduced absenteeism;
» Strengthened muscles and bones as well as slowing of the aging process;
» Burning of body fat, raised metabolism, reduced blood pressure, and reduced levels of cholesterol;
» Prevention of disease such as asthma, heart disease, diabetes and some forms of cancer; and
» Decreased obesity.
cc Im
age
cour
tesy
of f
orkl
ift o
n fl
ickr

DNV Official Community Plan | Transportation Plan 33
ChallengesThe following are some challenges in making walking a more viable transportation choice in the District.
» Built environment – The low density of land uses in the District results in longer distances to destinations. It is also not cost-effective to build sidewalks in areas where they will not be used by many people.
» Personal and environmental factors – Some of the key factors that impact the pedestrian experience include weather, health and fitness, terrain, as well as safety concerns.
» Transportation system factors – Lack of sidewalks, crossing barriers (e.g. streams or highways), unsafe street crossings, incomplete sidewalk networks, sidewalk too close to moving traffic, lack of lighting in some areas, and poor maintenance of sidewalks all influence whether one might choose to walk. This has been a particular concern around schools in the District.
» infrastructure costs – The cost of building and maintaining a complete sidewalk network in the District would be far greater than historical funding levels. However, the cost of pedestrian infrastructure is relatively small compared to the cost of road infrastructure.
BackgroundDistrict residents' Priorities
Making sure children have safe routes to walk to and from school was identified in the District’s 2012 Transportation Planning Priorities survey as the top pedestrian priority of District residents. Improving accessibility for wheelchairs and strollers, completing the sidewalk network and integrating sidewalks with urban trails (like the Spirit Trail) were also considered higher priority among the majority of residents. Implementing traffic calming measures like curb extensions and improving the walking environment with things like street furniture and public art are considered lower priority.
Pedestrian Master Plan
The District’s Pedestrian Master Plan was endorsed by Council on June 15, 2009. The purpose of the Pedestrian Master Plan is to develop a specific strategy for improving conditions for pedestrians and to promote walking as a safe and convenient form of transportation. The plan focuses on prioritizing sidewalk installation projects and proposes new policies on planning, design and maintenance.
The District’s objective is to ensure safe and comfortable opportunities to walk are provided for pedestrians throughout the community for a variety of trip purposes.
cc Im
age
cour
tesy
of f
orkl
ift o
n fl
ickr

34 DNV Official Community Plan | Transportation Plan
recommended Practice for Crossing Facilities
The Recommended Practice for Crossing Facilities (2009) provides the District with a systematic process to determine appropriate crosswalk control, select appropriate crossing treatments, and prioritize locations for implementing improvements. Using the Recommended Practice for Crossing Facilities, ten locations within the District were identified for higher-priority crossing improvements.
Safe routes to Schools
The District of North Vancouver and School District (NVSD) 44 collaborated on two studies to identify strategies to improve routes to schools in 2010 and 2011. The process was successful in identifying high priority improvements with support of school administration and parent advisory councils and to prepare "safe routes to school" maps as a resource for school communities.
The District intends to continue to assess opportunities to address conditions around schools throughout the District and implement improvements as appropriate.
Walking Priorities oCP Town and Village Centres
Lynn Valley, Lower Lynn, Lower Capilano and Maplewood centres will be higher priority areas for new and enhanced pedestrian infrastructure. Town and Village centres will have more opportunities for walking and higher levels pedestrian activity because more people will be living in close proximity to range of different types of destinations like businesses, libraries, shops and restaurants.
Sidewalks
As part of the Pedestrian Master Plan, potential locations for a new or extended sidewalk were determined using a sidewalk priority index. The index assigns a score based on land use and transportation characteristics. The sidewalk priority index was applied to block faces within the District that do not have a sidewalk. The plan focuses on providing sidewalks on the highest classification roads, specifically on both sides of all minor and major arterial roads; on one side of all collector roads; and on both sides of collectors within 100 metres of a school, extending to the end of the block face.
Priority groupings were assigned based on the Pedestrian Potential Index and Deficiency Index score of existing conditions for each block face.
» The Pedestrian Potential index measures the strength of environmental factors that favour walking. In other words, it evaluates the need for a sidewalk based on how likely it is that people will be walking there. For example, having a school or business nearby can influence walking levels in an area.
» The Deficiency Index measures the level of necessity for pedestrian improvements. Factors for the Deficiency Index were chosen to measure how difficult or dangerous the street is for walking. For instance, factors such as speeds of vehicles can influence pedestrian safety and consequently the suitability of the street for walking.
Priority sidewalk projects are shown on p. 37, as identified in the Pedestrian Master Plan.

DNV Official Community Plan | Transportation Plan 35
Crosswalks
Locations identified for crossing improvements are shown on p. 37. Examples of potential crossing improvements include: enhanced crosswalks, overhead crosswalk signs, pedestrian signals, and special crosswalks. The locations were prioritized based on: pedestrian-related crash history, transit proximity, public concerns, land use, road classification, and pedestrian crossing demand. Other crossing improvement locations may be considered as necessary.
Urban Trails
Urban trails like the Spirit Trail provide comfortable and convenient connections for pedestrians travelling in the District. Urban trails typically feature wider widths to support multiple uses, hard surfaces to accommodate mobility assist devices, and lighting to enhance safety at all times of the day. Linkages between urban trails and the on-street sidewalk network and bicycle network will continue to be a key planning consideration.
As we continue to design the built environment to be attractive and comfortable for pedestrians of all ages and abilities, District residents will continue to respond by making more trips by walking, cycling and transit and fewer trips by car

36 DNV Official Community Plan | Transportation Plan
This page intentionally left blank.

DNV Official Community Plan | Transportation Plan 37
!!
!
!
!
!!
!
!
!
!
!
!
!
!
CITY OF NORTH VANCOUVER
Lions
Gate
Brid
ge
Iron
Wor
kers
DIS
TRIC
T O
FW
EST
VA
NC
OU
VER
Mem
orial
Brid
ge
Capil
ano R
d
Marine Dr
Welch StW 1st St
Lons
dale
Ave
Montroyal Blvd
Moun
tain H
wy
Lynn V
alley Rd
E Keith Rd
Dollarton Hwy
Mt Seymour
Pkwy
Fern St
Lilloo
et Rd
Rive
rside
Dr
Sechelt DrBerkle
y Ave
E 27th St
Ross Rd
E Braemar Rd
Dempsey Rd
0 10.5 Kilometers
WALKING
DISTRICT OFNORTH VANCOUVER
PUBLISHED: JULY 5, 2012
Deep
Cov
e RdIndian River Dr
W Queens Rd
Fairw
ay D
r
Arborl
ynn D
r
Kirkstone Rd
Willi
am Av
e
From
me R
d
E 29th St
Mt Seymour Rd
Ridgewood Dr
Paisley Rd
W 15th St
Moun
tain H
wyMain St
Delbr
ook A
ve
OFFICIAL COMMUNITY PLAN
å
ååå
å
å
HIGH PRIORITY SIDEWALKS
HIGH PRIORITY CROSSING IMPROVEMENTS
å
KEY GROWTH AREA
VILLAGE CENTRE
FUTURE CROSSING IMPROVEMENTS
FUTURE SIDEWALKS
åFUTURE PEDESTRIAN AND BICYCLE OVERPASS/BRIDGE IMPROVEMENT


DNV Official Community Plan | Transportation Plan 39
Policy Directions The following policy directions are intended to encouraging more walking trips in the District:
1. Work toward completing the sidewalk network (as per map on p. 37) to improve District-wide pedestrian connectivity.
A complete and continuous sidewalk network will support more walking in the District. Even relatively small gaps in the overall network can discourage walking.
2. Provide safe, accessible, and comfortable facilities for pedestrians of all ages and levels of ability.
The pedestrian realm needs to continue to become accessible for everyone, including people with mobility challenges. A universally accessible pedestrian environment typically features properly designed wheelchair ramps at crosswalks (or any location where a grade change is present), appropriate grades on all pedestrian facilities, and a continuous clear zone free of obstructions. Providing countdown timers and adequate pedestrian crossing times for people with mobility challenges will become increasingly important, as the average age in the District is relatively higher than many other parts of the region.
3. Work with schools to provide safe and active routes to schools
Many children in the District are being driven to and from school, even for short distances, causing traffic congestion and safety issues around schools, and denying children the opportunity to be more physically active. The District will continue to work with School District 44 and key community stakeholders to identify ways to encourage students to use active transportation for school trips.
1. Work with schools to provide safe and active routes to school.
2. Provide safe and comfortable facilities for pedestrians of all ages and levels of ability.
3. Complete the sidewalk network (as per map on p. 37) to improve District-wide pedestrian connectivity.
4. integrate the pedestrian network with parks and urban trails where feasible and improve access to key trail connections that connect neighbourhoods.
5. Employ traffic calming measures to reduce vehicle speed and increase pedestrian safety at crosswalks.
6. Make the environment for walking more comfortable and attractive with improved street lighting, street furniture and public art.

40 DNV Official Community Plan | Transportation Plan
4. integrate the pedestrian network with parks and urban trails where feasible and improve ac-cess to key trail connections that connect neighbourhoods.
Integrating the pedestrian network with the trail system can improve the walking experience by improving connectivity while providing a pleasant route away from traffic. Where feasible, the District will continue to integrate the sidewalk network with the trail system to encourage more trips by walking.
5. Employ traffic calming measures to reduce vehicle speed and increase pedestrian safety at crosswalks.
The risk of pedestrians being involved in a collision in the District could be reduced by employing pedestrian crossing treatments in certain areas and completing high priority crosswalk improvements in a timely manner. Safety features such as curb extensions to shorten crossing distances and pedestrian countdown timers will become increasingly important, especially with an aging population.
6. Make the environment for walking more comfortable and attractive with improved street lighting, street furniture and public art.
A pedestrian-oriented area might include features such as: narrower travel lanes, wide sidewalks, landscaping, curb extensions, frequent marked crossings, raised crosswalks, lighting and pedestrian-scale street furniture. The District will continue to encourage pedestrian-oriented design, particularly in Town and Village centres where there is higher pedestrian activity. The District will continue to work with developers to ensure that new developments improve the public realm and pedestrian landscape. New developments will incorporate design criteria that improve the pedestrian environment.

DNV Official Community Plan | Transportation Plan 41
introductionA safe and efficient cycling network in the District is integral to achieve a sustainable transportation system that enhances the environmental, social and economic aspects of a complete community.
4 Cycling
Cycling is one of the most economically efficient ways of getting around.
The District’s objective is to provide a more complete cycling network that is safe and efficient for all ages and abilities.
In the District’s 2012 Transportation Planning Priorities survey, about 20 percent of respondents indicated that they plan on driving less and cycling more in the next five years.

42 DNV Official Community Plan | Transportation Plan
A look at trip diary information for the District (TransLink, 2008) also demonstrates the potential latent demand for cycling in the District that could be served by safer cycling connections. Trips less than 8.0 kilometres are generally a reasonable distance for cycling and the average bicycle trip that begins in the District is 7.5 kilometres. The average car trip beginning in the District for grade school is 6.3 kilometres, for personal business is 7.3 kilometres, and for work is 10.0 kilometres and so some of these trips could be made by cycling in the future.
Cycling can also be one of the most economically efficient ways of getting around. Cycling infrastructure is generally more cost efficient than infrastructure for other modes as it can often be implemented within existing road rights of way. In addition, the cost of owning and operating a bicycle is much lower than a car, which provides people with more disposable income that might otherwise be spent on driving.
Cycling is an effective way to improve fitness and to combat common health problems such as obesity and cardiovascular disease. Bicycle travel is three times faster than walking, for the same amount of energy. Leisurely cycling burns calories at the same rate as very brisk walking and burns about 600 calories per hour (TransLink, 2011).
Distribution of Bicycle Trips by Distance in Metro Vancouver
Energy Consumption by Mode in Metro Vancouver
Source: TransLink, Cycling for Everyone, 2011
Source: TransLink, Cycling for Everyone, 2011

DNV Official Community Plan | Transportation Plan 43
ChallengesIn a District survey of cyclists and potential cyclists (2011), the following barriers to cycling in North Vancouver were identified:
» Topography (for example, lack of connections over hills and waterways and the impacts directness of routes);
» Lack of integrated cycling network (for example, the need to complete the cycling network and provide better east-west connectivity);
» Lack of information about how to get around bike routes;
» The street is busy with traffic;
» Vehicle speeds;
» Risk from motorists who don’t know how to drive safely with cyclists;
» Perceptions of safety; and
» Risk of injury from bike-car collisions.
Background
District residents Priorities
Among the proposed cycling improvements, improving on-street connections, accommodating cyclists of different skill levels, and improving cycling routes to high-frequency transit services were seen as more important than connecting North Shore cycling routes with other municipalities and providing adequate cycling support facilities such as parking and change facilities in the District’s 2012 Transportation Planning Priorities survey.
North Vancouver Bicycle Master Plan
The North Vancouver Bicycle Master Plan (BMP) prepared together by the District and the City of North Vancouver in 2006 is being updated with input from cyclists, residents, and other key stakeholders.
The plan builds upon the investments made in the bicycle network since 2006 and includes links in the network that are aimed at improving connectivity and safety for cycling in the District. The “big move” of the BMP is that it includes urban trails as well as on-street cycling routes.
The plan includes a range of types of facilities that accommodate cyclists at all levels. Certain types of facilities may be designated because of opportunities or constraints of future road improvements (for example, a shared lane may be designated because there is not adequate road space for a bike lane). Other route types are designated to accommodate a certain type of cyclist. For example, routes like shared lanes and bike lanes attract regular cyclists, while routes like urban trails are more often used by infrequent cyclists and people that are new to cycling.

44 DNV Official Community Plan | Transportation Plan
The plan also identifies the need for improved wayfinding so that cyclists have good information about what routes to follow.
Urban TrailsTrails and Greenways in the District provide key linkages in an integrated transportation network for walking, hiking, cycling, and taking transit. Planning for urban trails is undertaken the District’s Parks and Open Space Strategic Plan, but will continue to be done in collaboration with transportation planning initiatives. Urban trails would help encourage the “interested but concerned” cyclists, and generate a broader appeal for cycling. Given the importance of urban trails in the transportation network, they are noted on the cycling plan map on p. 45.
Cycling Priorities Cycling network opportunities and projects where identified during the development of the cycling master plan.
The criteria and weightings used in the master plan to evaluate and prioritize bicycle facility improvements include: safety, ability to meet design guidelines, cost, demand, network contribution, and appeal. Priority improvements either help overcome major barriers to cycling (such as Highway 1 and waterways) or complete gaps in the bicycle network.
Figure 4.1 shows the existing cycling network, high priority projects and other planned network improvements as identified in 2012.
High Priority Cycling improvements
The following projects are a high priority to improve cycling connectivity and safety in the District:
» Main Street Bike Route - Harbour Avenue to Second Narrows Bridge and connection to Dollarton Highway
» Mount Seymour Parkway - Lillooet Road to Riverside Drive
» Orwell Street – Fern Street to Main Street
» Lynn Valley Road – Mountain Highway to Highway 1
» 29th Street – Saint Georges to Lynn Valley Road
» Mountain Highway – Keith Road to Lynn Valley Road
» Hope Road – Bridgeman Avenue to Capilano Road
» Tatlow Avenue – Marine Drive to Capilano Road
» Crown Street Bridge Connector – Lynn Avenue to 4th Street

DNV Official Community Plan | Transportation Plan 45
!!
!
!
CITY OF NORTH VANCOUVER
Lions
Gate
Brid
ge
Iron
Wor
kers
DIS
TRIC
T O
FW
EST
VA
NC
OU
VER
Mem
orial
Brid
ge
Capil
ano R
d
Marine Dr
Welch StW 1st St
Lons
dale
Ave
Montroyal Blvd
Moun
tain H
wy
Lynn V
alley Rd
E Keith Rd
Dollarton Hwy
Mt Seymour
Pkwy
Fern St
Lilloo
et Rd
Rive
rside
Dr
Sechelt DrBerkle
y Ave
E 27th St
Ross Rd
E Braemar Rd
Dempsey Rd
0 10.5 Kilometers
CYCLING
DISTRICT OFNORTH VANCOUVER
PUBLISHED: JULY 5, 2012
Deep
Cov
e RdIndian River Dr
W Queens Rd
Fairw
ay D
r
Arborl
ynn D
r
Kirkstone Rd
Willi
am Av
e
From
me R
d
E 29th St
Mt Seymour Rd
Ridgewood Dr
Paisley Rd
W 15th St
Moun
tain H
wyMain St
Delbr
ook A
veKEY GROWTH AREA
VILLAGE CENTRE
OFFICIAL COMMUNITY PLAN
EXISTING URBAN TRAIL ROUTE
EXISTING ON-STREET BIKE ROUTE
HIGH PRIORITY BIKE IMPROVEMENT
ååå
å
å
å
å
åFUTURE PEDESTRIAN AND BICYCLE OVERPASS/BRIDGE IMPROVEMENT
å
FUTURE ON-STREET BIKE IMPROVEMENT
(All proposals are conceptual only. Alignment to be determined)FUTURE URBAN TRAIL IMPROVEMENT
CITY OF NORTH VANCOUVER BIKE ROUTES


DNV Official Community Plan | Transportation Plan 47
Policy Directions The following policy directions are intended to increase the number of trips made by cycling in the District:
1. improve on-street cycling connections and expand the network in areas with greater cycling potential.
2. Accommodate cyclists of all skill levels with on and off-street cycling routes and explore opportunities to expand the cycling network around schools.
3. Improve cycling routes to high quality transit services and work with TransLink to make bike-transit integration convenient and intuitive.
4. Connect the North Shore cycling network with the wider region.
5. Require major developments to include quality cycling support facilities.
6. Work with the community on cycling awareness initiatives.
1. improve on-street cycling connections and expand the network in areas with greater cycling potential.
The District has made progress on its bicycle network, but there are still many incomplete routes throughout the District. Gaps in the network make it difficult for cyclists to feel safe travelling on bicycle routes. The District will continue to consider the needs of cyclists in all road improvement projects, invest in cycling in areas with greater cycling potential, and work towards completing high priority projects in a timely manner. Related to this, wayfinding between cycling routes and key destinations will continue to be increasingly important. In addition, intersection improvements for cyclists, such as coloured pavement, bike boxes, and crossbikes will be continue to be an important part of expanding the cycling network, as a vast majority of vehicle-bike collisions occur at intersections.
2. Accommodate cyclists of all skill levels with on and off-street cycling routes and explore op-portunities to expand the cycling network around schools.
Skill levels, physical capabilities and needs vary widely among cyclists, and consequently different cyclists require or are attracted to different types of bicycle facilities. A connected cycling network in the District will require the integration of trails and on-street cycling routes. This could also encourage new cyclists who generally prefer off-street routes, such as urban trails. While an experienced cyclist may be comfortable riding along a high-volume multi-lane arterial road and may prefer to ride along such a road to minimize travel times, a less experienced cyclist may only feel comfortable on off-street pathways like the Spirit Trail or on local street bike routes. To improve network connectivity and encourage cyclists of ranging levels of ability, the District will continue to integrate on-street bike routes with off-street bike routes where feasible.

48 DNV Official Community Plan | Transportation Plan
3. Improve cycling routes to high quality transit services and work with TransLink to make bike-transit integration convenient and intuitive.
Integrating cycling and public transit provides numerous benefits, particularly for lower density areas such as the District. For cyclists, combining trips with transit can significantly increase the total distance travelled and can assist in overcoming barriers such as gaps in the bicycle network, unsafe routes, or inclement weather. Providing “bike and ride” facilities can also significantly increase a transit station’s passenger catchment radius, particularly in low density areas where transit stops are further apart.
4. Connect the North Shore cycling network with the wider region.
Seamless connectivity to cycling routes in neighbouring municipalities will enable cycling to be a more viable way of making longer regional trips. Linkages to the broader region can also support cycling tourism, which is beneficial for the local economy. The District will continue working with neighbouring municipalities to establish an inter-connected cycling network on the North Shore that connects to the wider region.
5. Require major developments to include quality cycling support facilities.
Cycling support facilities, such as bicycle parking, are a necessity for many cyclists. Requiring new commercial and multi-family developments to provide adequate cycling support facilities is an effective way to ensure that cyclists’ needs are met.
6. Work with the community on cycling awareness initiatives.
Increase awareness by working with the community on initiatives to promote cycling as a healthy, environmentally friendly, viable and inexpensive alternative to the automobile.
cc Im
age
cour
tesy
of W
ill V
anlu
e on
flic
kr

DNV Official Community Plan | Transportation Plan 49
introduction
5 Transit
Density is one of the most important built environment factors influencing transit ridership.
The District’s objective is to support the delivery of an enhanced and more integrated transit system across the community.
Public transit is a fundamental component of a healthy, liveable, and complete community. Transit is an efficient and environmentally sustainable way of transporting large numbers of people across longer distances. There are also numerous community benefits of transit for the District of North Vancouver, including those below.
» residents’ Top Priority – In the District’s 2012 Transportation Planning Priorities survey, about 25 percent of respondents indicated that they plan on driving less and taking transit more in the next five years.
As well, through the 2007 and 2009 community surveys, residents indicated that transportation is their number one priority and residents articulated the need for improved transit services.

50 DNV Official Community Plan | Transportation Plan
To support increased transit service, the intensity of jobs and housing will need to increase over time. The growing concentration of land uses in centres as outlined in the District’s OCP is intended to contribute to improving transit ridership in the District.
A 2011 study by TransLink on land uses supported by frequent transit services notes that density is one of the most important built environment factors influencing transit ridership. Along frequent transit corridors in Metro Vancouver, medium to high population densities within a five minute walk of a frequent transit stop have been found to correlate with a 16 to 20 percent mode share. Medium to high job densities within a five minute walk of a frequent transit stop have been found to correlate with close to 40 to 60 percent of trips by transit. A 2010 study by TransLink on transit-oriented communities also noted that corridors with a compact concentration of mixed-land uses have more all-day, bi-directional use of transit, making higher quality, all day, frequent transit services more viable.
» Safety - Transit is among the safest ways to travel. From 2003 to 2008 in the United States, bus travel resulted in 0.05 deaths per 100 million passenger miles, compared to 1.42 deaths for motor vehicles (Federal Transit Administration, 2009).
» Climate Change and Air Quality - Supporting increased transit use can also have significant impacts on climate change and air quality. According to the American Public Transportation Association (2011), a single commuter switching his or her commute to transit can reduce a household’s carbon emissions by 10 per cent and up to 30 percent if he or she eliminates a second car.
» Disease Prevention - There are also proven public health benefits of increased transit use. Studies have proven that increasing the availability of public transit is one among a number of modifications to the built environment that offers opportunities for increasing physical activity and reducing the prevalence of obesity and associated health problems (American Journal of Preventive Medicine, 2010). In addition, replacing car trips with transit trips can help improve air quality, which reduces risk of respiratory diseases.
» Equity for Mobility-Disadvantaged - Other benefits of increased transit use in the District include providing equitable travel options for all residents, including those that do not drive due to age, income or physical ability. Transit ensures that all residents have access to employment, education, healthcare, and socio-recreational activities. Transit is also important for tourists, workers, and others from other parts of the region who come to North Vancouver to access its recreational and employment areas.
» Efficient Use of Public Funds - With increased people-moving capacity, transit also relieves the need for costly investments in new road capacity.
» Partner Funds – District investment in transit supportive measures leverage partner funds from the Regional Transit Authority and enables improved transportation choices in the District.

DNV Official Community Plan | Transportation Plan 51
ChallengesSome of the challenges in making transit a more viable transportation choice in the District include:
» New investments in transit services depend on increased and stable funding of TransLink.
» Low density single-family neighbourhoods are difficult and expensive to serve with effective transit. As such, low activity areas do not support frequent transit services.
» The curvilinear road network adds time and kilometres to transit trips.
» High driving mode share could be partially attributed to higher household incomes and higher car ownership rates in the District.
» Residents in the District are more likely to choose to drive because the incremental cost of driving is relatively low and driving is often more convenient than walking, cycling or taking transit.
» The aging population impacts our transportation system as elderly individuals tend to be more reliant on walking and transit.
» Many transit stops within the District are not universally accessible, do not have shelters and lack sidewalk connections to transit stops.
» As the population profile changes, travel patterns may shift from traditional peak periods to mid-day periods, and trips will likely become more localized.
» There is a more distributed trip pattern and the traditional suburb to downtown commute is less predominant than in years past, which makes it more difficult to serve with transit.
» There has been limited application of park-and-ride and bike stations on the North Shore.
» Real and perceived safety concerns at some transit exchanges have discouraged people from using transit.
Background
District residents Priorities
While residents placed the highest priority on ensuring the efficiency, reliability and frequency of the transit system in the District’s 2012 Transportation Planning Priorities survey, they also placed relatively high priority on improving Phibbs Exchange and having better infrastructure for transit riders (e.g., weather protection, wheelchair pads.) Older residents were particularly likely to place the highest priority on the transit system and those living in the eastern part of the district were particularly likely to place the highest priority on improving the Phibbs Exchange.
Who is responsible?
» TransLink undertakes the long range and strategic transit planning for the region. This includes development of Area Transit Plans.

52 DNV Official Community Plan | Transportation Plan
» TransLink's operating division, Coast Mountain Bus Company, including operating subsidiaries and contracted services, is responsible for the implementation of transit services, as well as identifying service issues and creating schedules.
» The District of North Vancouver plays an important supporting role in the provision of transit. The District approves the use of streets by buses and bus stops. The District also provides transit supportive measures such as appropriate implementing appropriate policies like land use zoning, implementing infrastructure like transit priority lanes and signals, sidewalks, crosswalks, cycling routes to transit, and weather protection and benches at bus stops, and clearing snow from streets and landing areas. The District’s policies supporting transit use can also influence TransLink’s plans.
North Shore Area Transit Plan
Area Transit Plans provide a long-range vision for transit in each sub-region of Metro Vancouver. The process is conducted by TransLink in consultation with municipalities, First Nations, residents, transit users and other key stakeholders of the sub-region. The North Shore sub-region includes the District of North Vancouver, Squamish First Nation, Tsleil-Waututh, City of North Vancouver, West Vancouver, Bowen Island, and Lions Bay. TransLink has developed an Area Transit Plan for each sub-region about every five to 10 years.
The North Shore Area Transit Plan (NSATP) vision that emerged through consultation in 2011 includes:
» A new approach for transit services on the North Shore that aims to more efficiently and effectively serve the District’s emerging land use via transit.
» A 50 percent increase in transit mode share for the entire North Shore (from 10 percent in 2008 to 15 percent by 2040).
Key highlights of the 2011 NSATP vision include:
» The 2040 transit vision is aligned with the District’s OCP network of centres concept.
» Investment in the transit vision can be scaled based on funding.
» Frequent Transit Network (FTN) serving higher density areas with a range of all-day destinations.
» Local types of services used to service lower density areas.
» New or improved transit exchanges to support passenger and operational needs.

DNV Official Community Plan | Transportation Plan 53
Defining Transit Service Types
Frequent Transit Network (FTN)
On an FTN, transit comes along at least every 15 minutes in both directions, throughout the day and into the evening, everyday of the week. The FTN refers to a high frequency and span of transit service within a corridor. It does not refer to specific routes, technologies or vehicle types. This level of service may be provided by a single route or by a combination of multiple routes and/or technologies within the same corridor. The SeaBus is an important component of the FTN.
Major District Transit Corridors
Major District Transit corridors identify routes where quality local services are recommended to serve the District’s village centres. The Major District Transit corridors complement the regional Frequent Transit Network by identifying roads where priority measures could be implemented by the District to move transit vehicles and/or passengers more efficiently or safely. The District will also work with TransLink to explore the potential for enhanced east-west rapid transit service. Although the Marine Drive corridor has been identified as a desirable rapid transit corridor, alternative (parallel) routes may need to be explored.
Local Transit Services
Local services will continue to be delivered across the District. While the span and frequency of service will vary depending on land uses, the District intends to continue working with the TransLink to define basic levels of transit accessibility serving neighbourhoods.

54 DNV Official Community Plan | Transportation Plan
Transit Priorities The District’s long term concept for future transit services (p. 55) will be implemented in consultation with TransLink and North Shore municipalities. The implementation of higher quality services is likely to occur more quickly in areas where transit supportive land use continues to emerge.
High priority transit improvements from the District’s perspective are outlined below.
High Priority Transit improvements
» Continue to work with TransLink towards alignment of their plans with the District’s policy directions.
» Continue to work with TransLink and the Provincial government to improve safety and community integration of the transit exchange function at Phibbs Exchange.
» Implement southbound transit priority measures on Capilano Road, south of Highway 1.
» Improve existing southbound transit priority lane on lower Mountain Highway and explore other priority improvements around Highway 1.
» Continue to extend the Marine Drive transit priority lane east to connect to the City of North Vancouver, as appropriate.
» Review and update bus shelter and bench contracts to support the District’s goals.

DNV Official Community Plan | Transportation Plan 55
!!
!
!!(
!(
!(
!(
!(
!(
CITY OF NORTH VANCOUVER
Lions
Gate
Brid
ge
Iron
Wor
kers
DIS
TRIC
T O
FW
EST
VA
NC
OU
VER
Mem
orial
Brid
ge
Capil
ano R
d
Marine Dr
Welch StW 1st St
Lons
dale
Ave
Montroyal Blvd
Moun
tain H
wy
Lynn V
alley Rd
E Keith Rd
Dollarton Hwy
Mt Seymour
Pkwy
Fern St
Lilloo
et Rd
Rive
rside
Dr
Sechelt DrBerkle
y Ave
E 27th St
Ross Rd
E Braemar Rd
Dempsey Rd
0 10.5 Kilometers
TRANSIT
DISTRICT OFNORTH VANCOUVER
PUBLISHED: JULY 5, 2012
Deep
Cov
e RdIndian River Dr
W Queens Rd
Fairw
ay D
r
Arborl
ynn D
r
Kirkstone Rd
Willi
am Av
e
From
me R
d
E 29th St
Mt Seymour Rd
Ridgewood Dr
Paisley Rd
W 15th St
Moun
tain H
wyMain St
Delbr
ook A
ve
Seab
us
EXISTING LOCAL AREA TRANSIT NETWORK
FUTURE FREQUENT TRANSIT NETWORK
FUTURE MAJOR DISTRICT TRANSIT CORRIDOR
HIGH PRIORITY TRANSIT EXCHANGE/TRANSFERTERMINUS IMPROVEMENT!(
FUTURE TRANSIT EXCHANGE/TRANSFERTERMINUS IMPROVEMENT!(
KEY GROWTH AREA
VILLAGE CENTRE
OFFICIAL COMMUNITY PLAN


DNV Official Community Plan | Transportation Plan 57
Policy DirectionsThe following policy directions are intended to guide the District in working with TransLink to increase transit ridership levels in the District:
1. Work with TransLink to consider applications for transit priority measures that make transit more efficient and reliable.
2. Work with the TransLink to integrate frequent transit services into the District’s network of centres.
3. Work with TransLink to identify transit exchange improvements that address public safety and community integration.
4. Support transit riders with infrastructure such as weather protection, wheelchair pads, sidewalks, and curb ramps around bus stops.
5. improve walking and cycling connections to transit and continue to provide a more integrated multi-modal network for people of all ages and abilities.
1. Work with TransLink to consider applications for transit priority measures that make transit more efficient and reliable.
The District will continue working with TransLink and neighboring municipalities to consider appropriate applications for transit priority lanes, signal timing, and bus bulges that can make transit more efficient and reliable.
2. Work with the TransLink to integrate frequent transit services into the District’s network of centres.
The District will work with Translink to continue to improve the quality of transit services delivered within the District. For transit to continue to become a more integral part of the District’s transportation network, the District will concentrate growth and facilitate land uses in Lower Lynn, Lynn Valley, Lower Capilano and Maplewood centres that support the performance of transit corridors with rapid and frequent service within the District.
3. Work with TransLink to identify transit exchange improvements that address public safety and community integration.
The District will work with TransLink to plan transit supportive infrastructure, transit exchange and terminus facilities within centre areas. This will include collaboration with TransLink to identify Phibbs Exchange improvements that address public safety and community integration in the Lower Lynn Town Centre and support transit ridership growth. The District would be supportive of initiatives that integrate land use and transit, such as encouraging mixed-use development at or near Phibbs Exchange.

58 DNV Official Community Plan | Transportation Plan
4. Support transit riders with infrastructure such as weather protection, wheelchair pads, side-walks, and curb ramps around bus stops.
The District will continue to work towards universal accessibility of transit stops in partnership with the region’s bus company, including provision of wheelchair pads, sidewalks and curb ramps in the vicinity of transit stops. Renewal of the District’s shelter and bench contract supports this direction.
5. improve walking and cycling connections to transit and continue to provide a more integrated multi-modal network for people of all ages and abilities.
Providing a more integrated multi-modal network enables residents to combine transit trips with modes of transportation. This can be achieved by improving walking and cycling routes and amenities, identifying opportunities for park and ride facilities, and improving transit station facilities. The District will continue to improve the conditions for walking and cycling to transit services so that transit services are more broadly accessible.

DNV Official Community Plan | Transportation Plan 59
introductionRoad safety is a shared responsibility between all levels of government, ICBC, police, road users and the vehicle industry. The District can play a key role in improving road safety by making improvements to road infrastructure.
6 road Safety
crash rates in north Vancouver are declining
The District’s objective is to employ a range of solutions and countermeasures to make its road network as safe as possible, for all road users.
The District’s Road Safety Plan, outlined in the next section, provides the District with a prioritized list of improvements that will help improve safety on District roads.

60 DNV Official Community Plan | Transportation Plan
ChallengesThe Road Safety Plan identified seven key road safety issues in the District, based on findings of the site visits, stakeholder consultation, and collision trends identified throughout the network.
» High traffic speeds – Higher speeds are typically associated with higher collision risk and crash severity because drivers have less time to react to unexpected road and traffic conditions.
» Congestion and high traffic volumes – Drivers encounter traffic congestion in the District due to the regional and commuter traffic that rely on District roads. Congestion can lead to driver frustration and consequent risk-taking behaviour such as speeding, red-light running, as well as “rat-running” through residential areas.
» Pedestrian safety – Pedestrians face challenges such as gaps in the sidewalk network, narrow sidewalks, insufficient curb ramps, long crossing distances, lack of lighting in some areas, and driver neglect.
» Cyclist safety – Cyclist collisions often occur along higher volume streets and intersections without adequate cycling facilities.
» Signal operations and display – Because of non-optimal or non-existent left turn phasing or poor visibility, left turn delays can result in driver frustration and associated risk-taking behaviour.
» Sightlines at intersections – Due to factors such as overgrown vegetation or parked vehicles, poor sightlines leave less distance and time for drivers and other road users to react.
» Transit safety – Safety concerns associated with transit include pedestrians jaywalking near bus stops and collisions involving buses pulling out of bus stops.
» Channelized right turns – Channelized right turns are typically associated with a higher risk of collisions. Drivers are required to look for gaps in the traffic from the left and need to be wary of stopped vehicles on the right turn lane in front, while watching for pedestrians and cyclists. Another challenge of channelized right turns is that they tend to increase motor vehicle speeds around the corner, which impacts pedestrian safety.

DNV Official Community Plan | Transportation Plan 61
Collision Trend
The crash rate in North Vancouver compared to the rest of the Lower Mainland is shown in Figure 6.1.
* Crashes per policy-years earned, rounded to nearest ten. "North Vancouver" includes District and City.
Figure 6.1 – Crash Rate in North Vancouver
Since 2007, crash rates in North Vancouver and in the region have been declining, but only slightly. The District’s Road Safety Plan is intended to reduce the crash risk at key intersections and corridors by employing a range of engineering strategies.
Background
District residents Priorities
Planning road improvements to improve traffic safety was a top road infrastructure priority in the District’s 2012 Transportation Planning Priorities survey. Somewhat lower priority was given to working with the RCMP on enforcement and safety.
DNV road Safety Plan
The District’s Road Safety Plan (2010) identifies existing road safety issues and provides a prioritized list of short, medium and long-term improvements that would reduce the risk of crashes across the District.
The strategy is primarly focused on engineering approaches to improving traffic safety, but recognizes the need for other aspects of road safety such as education and enforcement, as described in Table 6.1.

62 DNV Official Community Plan | Transportation Plan
ENGiNEEriNG SoLUTioNS
• Optimize left turn signal phasing
• Upgrade traffic control displays
• Review and upgrade traffic control devices
• Speed reduction strategies• modify right turn lanes• restrict turning
movements as appropriate
• maintain intersection sight triangles
• Re-pave roadways• Improve signing and
pavement markings for all road users, including pedestrians and cyclists.
• Complete pedestrian network
• Complete cycling network
• review bylaws
EDUCATioN SoLUTioNS
• Share the Road Campaign• Be Safe, Be Seen
Campaign
ENForCEMENT SoLUTioNS
• Work with the rcmp on effective traffic safety and speed enforcement initiatives.improvement
Table 6.1: road Safety Strategies
other Safety initiatives
School Travel Planning
Many children in the District who live within comfortable walking distance to a school are being driven to and from school on a daily basis. This causes traffic congestion and traffic safety issues around schools, while preventing children from being more physically active and independent. School Travel Planning is a collaborative community-based approach to identify the barriers to active transportation around schools and to develop engineering and social marketing solutions to encourage positive travel behaviour change.
The District encourages initiatives aimed at reducing the number of cars around schools, cleaner air, safer streets, and more alert and healthy students. Measures and program initiatives can be implemented by the District, School District, parents groups, non-government organizations, and other stakeholders to improve conditions around schools. The District reviewed conditions for walking and cycling around three schools in 2010 and another three schools were reviewed in 2011.
Crosswalk Improvements
The District is committed to improving overall conditions for pedestrians, and improving crossing facilities is one way to achieve this goal. As mentioned in the Pedestrian Plan Chapter, there are priority locations in the District that require crossing improvements. These crossing improvements will be implemented as soon as funding permits, to improve safety for all pedestrians.
Traffic Calming
About 16 percent of all reported collisions in the District occur on local roads. Implementing traffic calming measures can help reduce collision risk on local roads. Traffic calming measures can either be funded by the District or by residents. If there is a measurable collision reduction potential, ICBC may be willing to contribute funding towards traffic calming projects.

DNV Official Community Plan | Transportation Plan 63
road Safety PrioritiesHigh priority locations for road safety improvements, as indicated on p. 65, were developed by examining locations which exhibited the highest frequency of crashes among three most prevalent modes of travel: driving, cycling, and walking, and evaluating projects against criteria set out in the Transportation Plan.
High Priority Locations for Safety improvements
Detailed analysis of intersections and corridors with the highest number of crashes in the District was completed. From there, the Road Safety Plan for mitigation measures and recommended improvements were developed.
High priority locations for improvements include:
» 29th Street at Lonsdale Avenue and at Lynn Valley Road;
» Lynn Valley Road corridor;
» Mountain Highway corridor;
» Main Street corridor; and
» Dollarton Highway at Riverside Drive.
Other locations for road safety improvements may be considered as necessary.

64 DNV Official Community Plan | Transportation Plan
This page intentionally left blank.

DNV Official Community Plan | Transportation Plan 65
!!
!
!!(
!(
!(!(
!(
!(
!(!(
!(
!(
!(!(
!(
!(!(!( !(
CITY OF NORTH VANCOUVER
Lions
Gate
Brid
ge
Iron
Wor
kers
DIS
TRIC
T O
FW
EST
VA
NC
OU
VER
Mem
orial
Brid
ge
Capil
ano R
d
Marine Dr
Welch StW 1st St
Lons
dale
Ave
Montroyal Blvd
Moun
tain H
wy
Lynn V
alley Rd
E Keith Rd
Dollarton Hwy
Mt Seymour
Pkwy
Fern St
Lilloo
et Rd
Rive
rside
Dr
Sechelt DrBerkle
y Ave
E 27th St
Ross Rd
E Braemar Rd
Dempsey Rd
0 10.5 Kilometers
ROAD SAFETY
DISTRICT OFNORTH VANCOUVER
PUBLISHED: JULY 5, 2012
Deep
Cov
e RdIndian River Dr
W Queens Rd
Fairw
ay D
r
Arborl
ynn D
r
Kirkstone Rd
Willi
am Av
e
From
me R
d
E 29th St
Mt Seymour Rd
Ridgewood Dr
Paisley Rd
W 15th St
Moun
tain H
wy
Main St
Delbr
ook A
ve
OFFICIAL COMMUNITY PLAN
SAFETY IMPROVEMENTS
FUTURE INTERSECTION IMPROVEMENT!(
HIGH PRIORITY INTERSECTION IMPROVEMENT!(
KEY GROWTH AREA
VILLAGE CENTRE
CORRIDOR IMPROVEMENTS


DNV Official Community Plan | Transportation Plan 67
Policy Directions
The following policy directions are intended to reduce collisions and improve safety for all road users, including cyclists and pedestrians.
1. reduce collisions and improve safety for all road users.
2. Complete detailed reviews to identify and implement road safety improvements at priority locations.
3. Conduct road Safety Audits on key transportation projects where possible.
4. Work with the RCMP and the community on effective traffic safety and speed enforcement initiatives.
1. reduce collisions and improve safety for all road users.
To improve the safety and health of its residents, the District intends to employ a range of solutions and countermeasures to make its road network as safe as possible, for all road users, particularly vulnerable road users.
2. Complete detailed reviews to identify and implement road safety improvements at priority locations.
Strategic investments in road safety improvements can enhance neighbourhood safety and liveability. The District will continue to work towards implementing improvements identified in the Road Safety Plan as soon as possible to reduce the number of collisions.
3. Conduct road Safety Audits on key transportation projects where possible.
A Road Safety Audit is “a formal and independent safety performance review of a road transportation project by an experienced team of safety specialists, addressing the safety of all road users” (ICBC Road Improvement Program). Road Safety Audits will continue to be conducted on the design for key transportation projects, as appropriate.
4. Work with the RCMP and the community on effective traffic safety and speed enforcement initiatives.
Improving road safety requires an interdisciplinary approach with the participation of the community and many different agencies, including the RCMP. The benefits of road safety projects can often be better realized with effective police enforcement. The District will continue to work with the RCMP to target enforcement as appropriate. The District will also work with the community on neighbourhood campaigns to reduce speeding on local or collector roads.

68 DNV Official Community Plan | Transportation Plan
introductionDesignating roads for specific purposes can help move people, goods and services safely and efficiently across the District. To achieve this goal, the District will implement a road designation strategy which includes road classification and route designation.
7 road Designation
Roads designated for specific purposes support land-use and transportation patterns.
The District’s objective is to provide a strategy for managing the existing road network to optimize safety and efficiency, while ensuring the integration of sustainable travel modes into the system.

DNV Official Community Plan | Transportation Plan 69
ChallengesSeveral factors influence road designation planning in the District, such as:
» Non-Optimal Road Classification – Several roadways in the District may not be functioning as intended or indicated by their classification. A road’s classification may not be appropriate because of the road width, proximity to schools, transit service, and route designations. For example:
• Riverside Drive south of Dollarton Highway is currently classified as a local road whereas it functions as a minor arterial road, moving trucks in the Maplewood Industrial area.
• Skyline Drive, north of Montroyal Boulevard is currently classified as a collector road whereas it functions as a narrow local road.
» overbuilt roads – Some roads designated in the 1990’s as arterial roads in anticipation of new subdivisions can be downgraded now that those subdivisions will not be going ahead. As such, some roads in the northern parts of the District can be reclassified from a major arterial road to a minor arterial road, or from a minor arterial road to a collector road.
» Traffic Management – Local roads prioritize access whereas arterial roads prioritize traffic flow. Allocating different types and volumes of traffic to different roads can improve traffic safety, reduce traffic delay, and improve goods movement.
Background
1. Road Classification System
Road classification is an important tool for transportation planning and roadway management, which designates streets into different classes based on the type of service each group is intended to provide. The District’s proposed 2012 road classification system is an update from the 1990 North Vancouver Transportation Network Study, and reflects the District’s vision of a more efficient transportation network.
The proposed road classification guidelines are included in Table 7.1 and the proposed road classification network is shown on p.73. A Bylaw amendment will be required for the road classification changes to take effect.
A refined road classification system improves traffic operation and safety, while preserving the liveability of our neighbourhoods and enhancing the attractiveness of our commercial corridors.

70 DNV Official Community Plan | Transportation Plan
MAJor ArTEriAL
MiNor ArTEriAL CoLLECTor LoCAL rUrAL
FUNCTioN Primarily traffic movement
Primarily traffic movement and some property access
Traffic movement and property access
Property access Property access and traffic movement
AVErAGE DAiLy TrAFFiC VoLUME
5,000 to 50,000 5,000 to 20,000 1,000 to 8,000 Lower than 1,500
Lower than 2,000
NUMBEr oF VEHiCLE LANES (both directions)
2 to 4 2 to 4 2 to 4 2 1 to 2
PArKiNG Limited and typically restricted
one or both sides as feasible
one or both sides as feasible
usually on both sides
No parking lane
PEDESTriANS Sidewalks required on both sides; enhanced pedestrian safety measures recommended to reduce traffic impacts
Sidewalks on both sides desirable
Sidewalks on both sides desirable
Sidewalks on at least one side desirable
Special treatment if necessary
BiCyCLES Bike lanes or separated bike facilities preferred
Bike lanes or separated bike facilities preferred
Special treatment if necessary
Special treatment if necessary
Special treatment if necessary
ExiSTiNG ExAMPLES iN THE DiSTriCT
marine drive, Capilano Road, mount Seymour parkway
delbrook Avenue, Highland Boulevard, montroyal Boulevard
fromme road, garden Avenue, West 15th Street
Anne macdonald Way, regent Avenue
Indian river drive (east of Indian river crescent)
Table7.1–ProposedRoadClassificationGuidelines(2011)
2. route Designations
There are three route designation types in the District:
» Major Road Network (MRN),
» Dangerous Goods Routes, and
» Disaster Response Routes.
Highway 1 is both a Dangerous Goods Route and a Disaster Response Route. Details of each route designation type are provided below.

DNV Official Community Plan | Transportation Plan 71
Major Road Network
The MRN is a joint designation between the District and TransLink. TransLink establishes guidelines for roads eligible for regional-funding as part of the MRN. The guidelines establish standards for management, operation, construction and maintenance of the MRN.
TransLink also:
» Provides operations, maintenance and rehabilitation funding for the MRN to the District;
» Approves truck movement prohibitions; and
» Works with the District to designate routes and times for dangerous goods movement.
Dangerous Goods Routes
A dangerous goods route (DGR) is a roadway that is designated for the transport of dangerous materials. Carriers of dangerous goods (as defined by the Transportation of Dangerous Goods Act, 1992) are permitted to travel only by routes designated as a DGR, except for the purposes of obtaining or delivering dangerous goods to a site by the most direct route to or from the destination. The DGR network in 2012 is currently regulated by the District’s Street and Traffic Bylaw.
Changes are proposed to the DGR network to better reflect current conditions. The map on p. 75 shows the proposed DGR network. To make the new DGR network official, an amendment to the District’s Street and Traffic Bylaw and approval by the Province will be required. The proposed DGR’s in the District include all MRN roads and Highway 1.
Disaster Response Routes
A Disaster Response Route (DRR) is a predefined, identifiable route capable of withstanding natural disasters, which can best move emergency services and supplies in response to a major disaster. DRR’s can include roads, marine, air and rail, and are a critical part of the overall emergency transportation system to ensure that planned transportation system changes do not impact response times.
The existing DRR’s in 2012 are proposed to be revised as in the map on p.74 to better serve potential muster stations along the waterfront. Muster stations are located where, within a three-kilometre radius, at least three of the four modes of transportation (road, rail, marine, air) come together. For example, in 2012, Mount Seymour Parkway is the existing DRR, but Dollarton Highway is proposed to replace Mount Seymour Parkway to better serve muster stations on the Burrard Inlet.
road Designation PrioritiesThe map on p. 73 shows the proposed road classification network. Some reclassification is proposed to ensure that all roads are classified appropriately in the District.
The proposed network of specially designated roads is shown on p. 74. Roads designated for specific purposes support the OCP’s envisioned land-use and transportation patterns. In 2011 and 2012, TransLink is reviewing the MRN route designations on the North Shore. The District will continue to work towards reaching a consensus with TransLink on the network illustrated on p. 74.

72 DNV Official Community Plan | Transportation Plan
This page intentionally left blank.

DNV Official Community Plan | Transportation Plan 73
!!
!
!
CITY OF NORTH VANCOUVER
Lions
Gate
Brid
ge
Iron
Wor
kers
DIS
TRIC
T O
FW
EST
VA
NC
OU
VER
Mem
orial
Brid
ge
Capil
ano R
d
Marine Dr
Welch StW 1st St
Lons
dale
Ave
Montroyal Blvd
Moun
tain H
wy
Lynn V
alley Rd
E Keith Rd
Dollarton Hwy
Mt Seymour
Pkwy
Fern St
Lilloo
et Rd
Rive
rside
Dr
Sechelt DrBerkle
y Ave
E 27th St
Ross Rd
E Braemar Rd
Dempsey Rd
0 10.5 Kilometers
ROAD CLASSIFICATION STRATEGY
DISTRICT OFNORTH VANCOUVER
PUBLISHED: JULY 5, 2012
Deep
Cov
e RdIndian River Dr
W Queens Rd
Fairw
ay D
r
Arborl
ynn D
r
Kirkstone Rd
Willi
am Av
e
From
me R
d
E 29th St
Mt Seymour Rd
Ridgewood Dr
Paisley Rd
W 15th St
Moun
tain H
wy
Main St
Delbr
ook A
ve
PROPOSED ROAD CLASSIFICATION CHANGES
EXISTING ROAD CLASSIFICATION
MAJOR ARTERIAL
LOCALPRIVATE
HIGHWAY
RURALLOCAL
KEY GROWTH AREAVILLAGE CENTRE
OFFICIAL COMMUNITY PLAN
COLLECTOR
COLLECTOR
MINOR ARTERIAL
MINOR ARTERIAL


DNV Official Community Plan | Transportation Plan 75
!!
!
!
CITY OF NORTH VANCOUVER
Lions
Gate
Brid
ge
Iron
Wor
kers
DIS
TRIC
T O
FW
EST
VA
NC
OU
VER
Mem
orial
Brid
ge
Capil
ano R
d
Marine Dr
Welch StW 1st St
Lons
dale
Ave
Montroyal Blvd
Moun
tain H
wy
Lynn V
alley Rd
E Keith Rd
Dollarton Hwy
Mt Seymour
Pkwy
Fern St
Lilloo
et Rd
Rive
rside
Dr
Sechelt DrBerkle
y Ave
E 27th St
Ross Rd
E Braemar Rd
Dempsey Rd
0 10.5 Kilometers
ROAD DESIGNATION
DISTRICT OFNORTH VANCOUVER
PUBLISHED: JULY 5, 2012
Deep
Cov
e RdIndian River Dr
W Queens Rd
Fairw
ay D
r
Arborl
ynn D
r
Kirkstone Rd
Willi
am Av
e
From
me R
d
E 29th St
Mt Seymour Rd
Ridgewood Dr
Paisley Rd
W 15th St
Moun
tain H
wy
Main St
Delbr
ook A
ve
#*#*
#*
#*
HIGHWAY/MINISTRY OF TRANSPORTATION
FUTURE MAJOR ROAD NETWORK/DANGEROUS GOODS ROUTE
FUTURE MAJOR ROAD NETWORK/LOCAL ACCESS ONLY FOR DANGEROUS GOODS
FUTURE DISASTER RESPONSE ROUTE
MUSTER STATION FOR DISASTER RESPONSE#*
KEY GROWTH AREA
VILLAGE CENTRE
OFFICIAL COMMUNITY PLAN


DNV Official Community Plan | Transportation Plan 77
Policy directionsThe following policy directions are intended to guide the District towards an appropriate road classification system:
1. Re-classify the roads, as illustrated in the Road Classification Strategy Map.
2. Work towards designation of roads, as illustrated in the road Designation Map.
3. Work with TransLink to designate MRN roads as identified in the Road Designation Map and improve roadway infrastructure on the MrN as needed.
1. Re-classify the roads, as illustrated in the Road Classification Strategy Map.
A recommendation of this plan is that the District bring forward bylaw changes necessary to reclassify roads to their desired function. This will retain traffic flow operations on arterial roads, while protecting local neighbourhoods from higher speeds and through traffic.
2. Work towards designation of roads, as illustrated in road Designation Map.
A recommendation of this plan is that the District continues to work with the Province, Emergency providers, and other stakeholders to designate Disaster Response Routes and Dangerous Goods Routes.
3. Work with TransLink to designate MrN roads as illustrated in the road Designation Map and improve roadway infrastructure on the MrN as needed.
The MRN is typically a high volume road which supports goods movement and transit demands. The District will continue to work with TransLink to designate MRN routes and improve roadway infrastructure on the MRN.

78 DNV Official Community Plan | Transportation Plan
introductionTo accommodate growth planned in the OCP, the Transportation Plan includes a balanced approach that focuses on improvements for all modes of transportation that make the best use of existing infrastructure and address key safety concerns.
In the District’s 2012 Transportation Planning Priorities survey, over 40 percent of respondents indicated that they plan on driving less and walking, taking transit and cycling more in the next five years.
The Transportation Plan includes improvements to the road network with a number of benefits including fewer air quality and greenhouse gas impacts and better mobility for all road users, including cyclists, pedestrians and transit vehicles.
8 road Network
The Plan includes a balanced approach focused on improvements for all modes of transportation.
the district’s objective is to manage road infrastructure in such a way that minimizes impacts on neighbourhoods, improves road safety, and enables the efficient movement of goods and people.

DNV Official Community Plan | Transportation Plan 79
ChallengesWhile the District’s road network is largely built out and will not be requiring any significant capacity increases, there are some challenges in providing network connectivity, which are outlined below.
» Highway 1 bisects the District – Highway 1 bisects the District, creating a barrier between neighbourhoods to the north and south sides of the highway.
» road Connectivity - Much of the District’s roadway network lacks a defined grid pattern, dictated largely by the topography and the lack of bridges over north-south creeks and rivers. This means that there are few alternate east-west routes to arterial roads and circuitous routing in some areas.
» Lack of East-West routes – The presence of many creeks and ravines which run north-south in the District and the historical built form of the transportation network make it challenging to develop a robust east-west road network.
» Congestion around bridgeheads – Areas around the two bridgeheads have relatively higher levels of traffic congestion, especially when an incident occurs. This is somewhat expected as these are the two only roadway access points across the Burrard Inlet and congestion can block access across the highway.
» Natural Hazard Area - The District is situated on sloping terrain interspersed with many creeks, ravines and greenbelts. The District is also prone to severe weather activity, including heavy precipitation and strong winds. These factors influence the risk of natural hazard events such as landslides, debris flows, wildland-urban interface fires, flooding, and earthquakes.
» Topography – The District’s road network is heavily affected by grades. Roads with steep grades often have safety issues such as speeding and difficult geometry.
» High regional Truck Volumes – Highway 1, which traverses the District from the Ironworker’s Memorial Second Narrows Bridge to the District of West Vancouver, carries a high proportion of regional and provincial truck traffic. The presence of heavy industrial land uses along the waterfront also generates higher levels of truck traffic between the Second Narrows Bridge and the access points along the lower level roads.

80 DNV Official Community Plan | Transportation Plan
BackgroundThe District’s roadway network in 2012 is largely built out. It is expected that there will continue to be relatively few areas of significant congestion within the District’s boundaries. Congestion at the two bridgeheads is the greatest cause of delays on District roadways. Although there is sufficient road width to handle north-south traffic volumes throughout the District, congestion occurs on some east-west routes especially during peak hours, notably Main Street, Dollarton Highway, Marine Drive and East Keith Road.
District residents Priorities
Planning road improvements to ensure neighbourhood liveability was a top road infrastructure priority in the District’s 2012 Transportation Planning Priorities survey. Those living in the eastern part of the district were particularly likely to place top priority on implementing new east-west connections off Highway 1. Residents recognized the benefits of reallocating travel lane space to accommodate all types of vehicles (e.g., transit buses, cyclists). Lower priority was given to providing supportive infrastructure for alternative energy vehicles, and facilitating truck and rail access to ports and commercial areas were viewed as less of a priority.
road Network Study
The District’s Road Network Study (2011) was a high-level analysis of the District’s road network needs. It looked at whether the existing network will be adequate to carry future traffic generated by the build-out of the OCP. The study also took into account plans of the City of North Vancouver and the two First Nations. Analysis was conducted to answer two key questions:
» Are more or fewer road lanes needed on our roads?
» Are new links needed in the road network?
The findings of the modelling work indicated that:
» Overall, traffic growth on District roads is projected to increase by less than half a percent annually.
» On average, traffic volumes during the afternoon peak period are projected to increase the most.
» The highest traffic growth could potentially occur on Marine Drive (west of Capilano Road) and West 1st Street, largely due to potential future development plans of the Squamish Nation and regional development.
» The lowest traffic growth is expected on roads heading north from Highway 1 and east along Mount Seymour Parkway and Dollarton Highway.
The study identified a range of projects at a high level, with preliminary cost estimates and then measured those projects against a set of evaluation criteria that balance the District’s long range planning goals with financial objectives.

DNV Official Community Plan | Transportation Plan 81
road Network PrioritiesBased on the evaluation of projects carried out in the Road Network Study, the following priorities were identified:
» Highway 1 Lower Lynn Interchanges
• One potential link is an improved connection of Keith Road to Mount Seymour Parkway;
• Another potential east-west link is a North Service Road that would run parallel along the north side of Highway 1 connecting Mountain Highway with Mount Seymour Parkway; and
• Highway 1 interchange improvements would help facilitate improved goods movement.
» Crown Street Bridge over Lynn Creek to provide access for pedestrians, bicycles, and possibly vehicles in an emergency.
» Capilano Road from Highway 1 to Grouse Mountain reallocation of over-wide pavement to improve safety and enhance pedestrian and cycling environment, without reducing vehicular throughput.
With the Lions Gate Bridge nearing capacity, plans like the North Shore Area Transit Plan, Bicycle Master Plan, and Pedestrian Master Plan aim to accommodate any growth in travel demand along the Marine Drive and Capilano Road corridors by high quality frequent transit services, cycling routes, and pedestrian amenities. Along the Marine Drive and Capilano Road corridors, many of the new trips can be accommodated by transit and so, transit priority lanes along these corridors will be an important component of road network improvements.
Long term projects that are identified in the plan will depend on development activities, First Nations’ plans, as well as opportunities to partner with other agencies.

82 DNV Official Community Plan | Transportation Plan
This page intentionally left blank.

DNV Official Community Plan | Transportation Plan 83
!!
!
!
CITY OF NORTH VANCOUVER
Lions
Gate
Brid
ge
Iron
Wor
kers
DIS
TRIC
T O
FW
EST
VA
NC
OU
VER
Mem
orial
Brid
ge
Capil
ano R
d
Marine Dr
Welch StW 1st St
Lons
dale
Ave
Montroyal Blvd
Moun
tain H
wy
Lynn V
alley Rd
E Keith Rd
Dollarton Hwy
Mt Seymour
Pkwy
Fern St
Lilloo
et Rd
Rive
rside
Dr
Sechelt DrBerkle
y Ave
E 27th St
Ross Rd
E Braemar Rd
Dempsey Rd
0 10.5 Kilometers
ROAD NETWORK
DISTRICT OFNORTH VANCOUVER
PUBLISHED: JULY 5, 2012
Deep
Cov
e RdIndian River Dr
W Queens Rd
Fairw
ay D
r
Arborl
ynn D
r
Kirkstone Rd
Willi
am Av
e
From
me R
d
E 29th St
Mt Seymour Rd
Ridgewood Dr
Paisley Rd
W 15th St
Moun
tain H
wyMain St
Delbr
ook A
ve
KEY GROWTH AREA
VILLAGE CENTRE
HIGH PRIORITY IMPROVEMENTS
FUTURE IMPROVEMENTS
OFFICIAL COMMUNITY PLAN
ROAD NETWORK
ROAD NETWORK
ROAD NETWORK TIED TO DEVELOPMENT
HIGHWAY INTERCHANGES


DNV Official Community Plan | Transportation Plan 85
Policy Directions
1. Consider neighbourhood liveability in planning of road improvements.
2. Continue to work with stakeholders to improve east-west mobility.
3. reallocate road space to improve safety and accommodate transit vehicles, cyclists, pedestrians as well as private vehicles, where feasible.
4. Monitor the development of alternative energy vehicles and provide supportive infrastructure, as necessary.
5. Facilitate effective access for trucks and rail to key port, industrial and commercial.
1. Consider neighbourhood liveability in planning of road improvements.
Planning of road improvements will take into account the needs of the users as well as neighbouring communities. Projects will be integrated into their context or setting in a sensitive manner through careful planning, consideration of different perspectives and tailoring designs to particular project circumstances.
2. Continue to work with stakeholders to improve east-west mobility.
One of the challenges in the District’s road network is the lack of road connectivity, particularly in the east-west direction. To address this, the District will proceed with implementing road projects identified in the road network plan show in Figure 8.1 as funding permits. The District should continue to work with stakeholders to improve east-west road connectivity, including an improved connection between Seymour and Lower Lynn and completing the Low Level Route.
3. Where beneficial and feasible, reallocate road space to improve safety and accommodate transit vehicles, cyclists, pedestrians as well as private vehicles.
Reallocating road space typically involves shifting road space to better accommodate other ways of getting around such as transit, HOV, cycling lanes or increased sidewalk space. Reallocating road space can reduce excessive road width and have a traffic calming effect on speeds. These projects are also critically important to completing streets with mobility options for non-drivers, delivering a more efficient and equitable transportation network, and supporting the choice to walk, cycle or take transit. The District will continue to reallocate road space where feasible and beneficial through opportunities like repaving or new development.
Lane allocation for transit or HOV is intended to improve the people-moving capacity of congested roadways. Transit priority measures give buses preferential treatment on roads and improve transit travel times and reliability. An example would be improvement of Capilano Road (Marine Drive to Fullerton Avenue) to provide a transit lane. High occupancy vehicles (HOV) are typically prioritized through exclusive HOV lanes, which reserve travel lanes all day or during peak travel times.

86 DNV Official Community Plan | Transportation Plan
4. Monitor the development of alternative energy vehicles and provide supportive infrastructure as necessary.
With rising oil prices and increasing concerns about the environmental impact of burning fossil fuels, there has been a renewed interest in alternative energy vehicles such as plug-in hybrid and electric cars. The District will continue to monitor the development of alternative energy vehicles and consider the need to plan for the provision of supporting infrastructure, such as charging stations.
5. Facilitate effective access for trucks and rail to key port, industrial and commercial areas.
The effective movement of goods plays a critical role in ensuring that the District remains economically competitive. The District will seek opportunities to place goods movement as a higher priority on roads leading to key port, industrial and commercial areas.

DNV Official Community Plan | Transportation Plan 87
introductionImplementation of Transportation Demand Management (TDM) measures is a critical part of creating a complete, sustainable community. TDM measures can motivate people to change their travel choices from driving to walking, cycling or taking transit. TDM can also encourage people to make fewer trips by deciding to telework, shop locally and online, or avoid congested times and routes.
TDM can benefit the community in many ways such as:
» Improved community liveability;
» Improved physical fitness and health;
» Greater mobility options;
» Time and cost savings for individuals;
» Reduced congestion;
» Road and parking infrastructure cost savings;
» Greater return on municipal investments in walking, cycling and transit infrastructure;
9 Transportation Demand Management (TDM)
TDM measures encourage people to choose to walk, cycle or take transit.

88 DNV Official Community Plan | Transportation Plan
» Reduced demand on road and parking infrastructure; and
» Reduced traffic collisions.
ChallengesPeople’s travel preferences are ultimately dependent on relative financial, time and convenience costs of different ways of getting around. A built form comprised of low density housing and a low level of mixing of land uses, makes it difficult to influence travel preferences because of the travel time and convenience costs of driving relative to walking, cycling or taking transit. As such, different approaches to TDM will be considered based on the local context.
BackgroundMany TDM initiatives are already in place in North Vancouver and across the region. TransLink and the Province have implemented several TDM measures, including:
» U-Pass BC - Subsidized transit passes are available to Capilano University students through the Provincial U-Pass program.
» Employer Transit Pass - Discounted annual transit passes can be purchased by employees when 25 or more employees of a workplace are enrolled.
» Jack Bell rideshare - Commuters use an online matching system to arrange ride sharing to and from locations within the District.
» TransLink’s Travel Smart Program -Tools and information are available that support individuals in using more sustainable ways of getting around.
» High Occupancy Vehicle (HOV) Lanes - Time savings and travel time reliability provide an incentive to rideshare during peak congestion periods. The HOV lane on Mountain Highway has been an effective queue jumper for ridesharing.
The District is also implementing or supporting a number of TDM measures, including:
» integration of Land Use and Transportation Planning - Following the OCP, this strategy promotes concentrated development patterns with mixed land uses to make walking and cycling more viable and to support a more efficient transit network.
The District’s objective is to implement strategic and practical TDM measures to make walking, cycling and transit preferable to driving.

DNV Official Community Plan | Transportation Plan 89
» Safe and Active routes to Schools - Programs and studies which improve safety around schools and encourage students to walk, cycle or take transit to school.
» Reduced Parking Requirements - Reduced parking requirements in appropriate developments are allowed in the District.
» Transit Priority Measures and HoV Lanes - Southbound Mountain Highway HOV lane and the westbound transit lane on Marine Drive.
» Plans and Policies Focussed on Sustainable Transportation Modes - Bike Master Plan, Pedestrian Master Plan, and North Shore Area Transit Plan (led by TransLink) support shifts in travel patterns.
» Funding and/or Promotional Support for TDM initiatives - The District has traditionally supported programs like Bike to Work Week and the Commuter Challenge. The District can work with employers and the community to expand opportunities for TDM initiatives.
» Bike Parking Facilities - Interior and exterior bike parking facilities are encouraged in medium to large developments.
» TDM programs for District employees – Participation in TransLink’s employer transit pass program, co-op car, virtual desktop software to enable telecommuting, hybrid pool vehicles, flexible and/or compressed work hours, showers and changing rooms, bike racks, and enrolment in the regional ridesharing program.
» Car Sharing – The District is supportive of car sharing programs in the region. Car sharing is a program that provides its members with access to a fleet of vehicles on a minute, hourly or daily rate. Car sharing allows people to use sustainable modes of transportation, such as transit, walking or cycling for most every day trips, while providing access to a car on a needed basis without having to own one. The District provides dedicated on-street parking spaces for these vehicles, and will continue to support initiatives like car sharing, which can reduce demand for multi-car ownership.
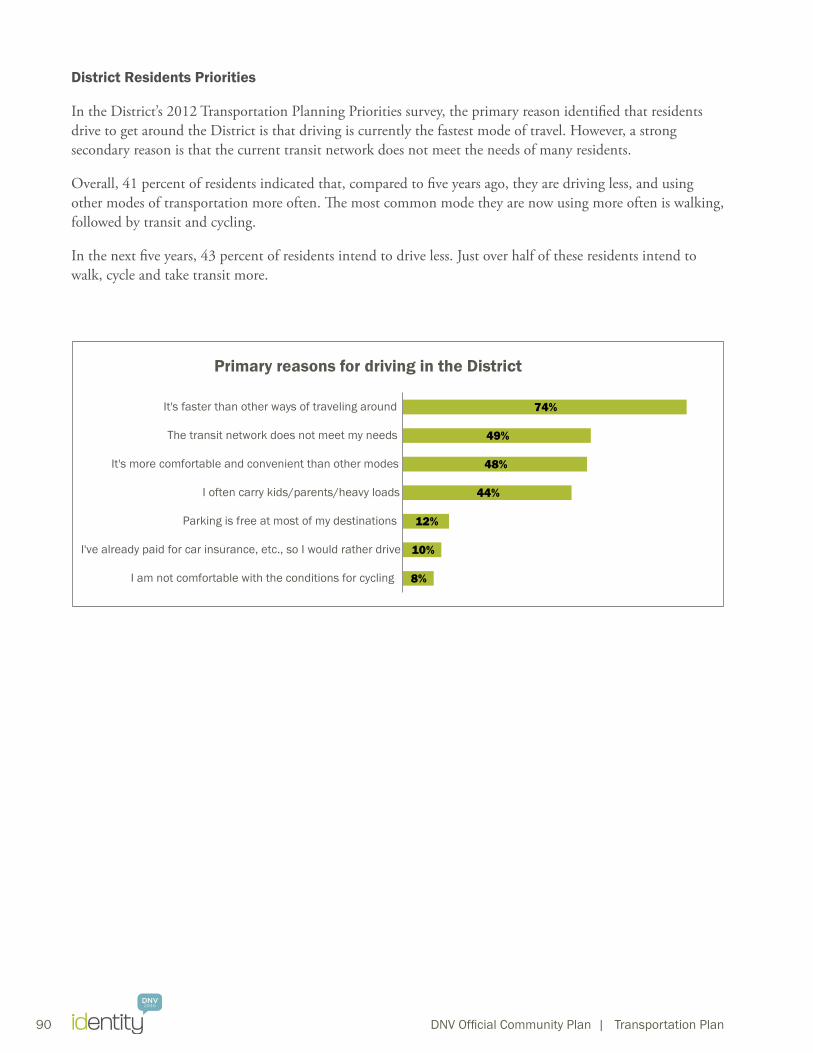
90 DNV Official Community Plan | Transportation Plan
District residents Priorities
In the District’s 2012 Transportation Planning Priorities survey, the primary reason identified that residents drive to get around the District is that driving is currently the fastest mode of travel. However, a strong secondary reason is that the current transit network does not meet the needs of many residents.
Overall, 41 percent of residents indicated that, compared to five years ago, they are driving less, and using other modes of transportation more often. The most common mode they are now using more often is walking, followed by transit and cycling.
In the next five years, 43 percent of residents intend to drive less. Just over half of these residents intend to walk, cycle and take transit more.
74%
49%
48%
44%
12%
10%
8%
It's faster than other ways of traveling around
The transit network does not meet my needs
It's more comfortable and convenient than other modes
I often carry kids/parents/heavy loads
Parking is free at most of my destinations
I've already paid for car insurance, etc., so I would rather drive
I am not comfortable with the conditions for cycling
Primary reasons for driving in the District
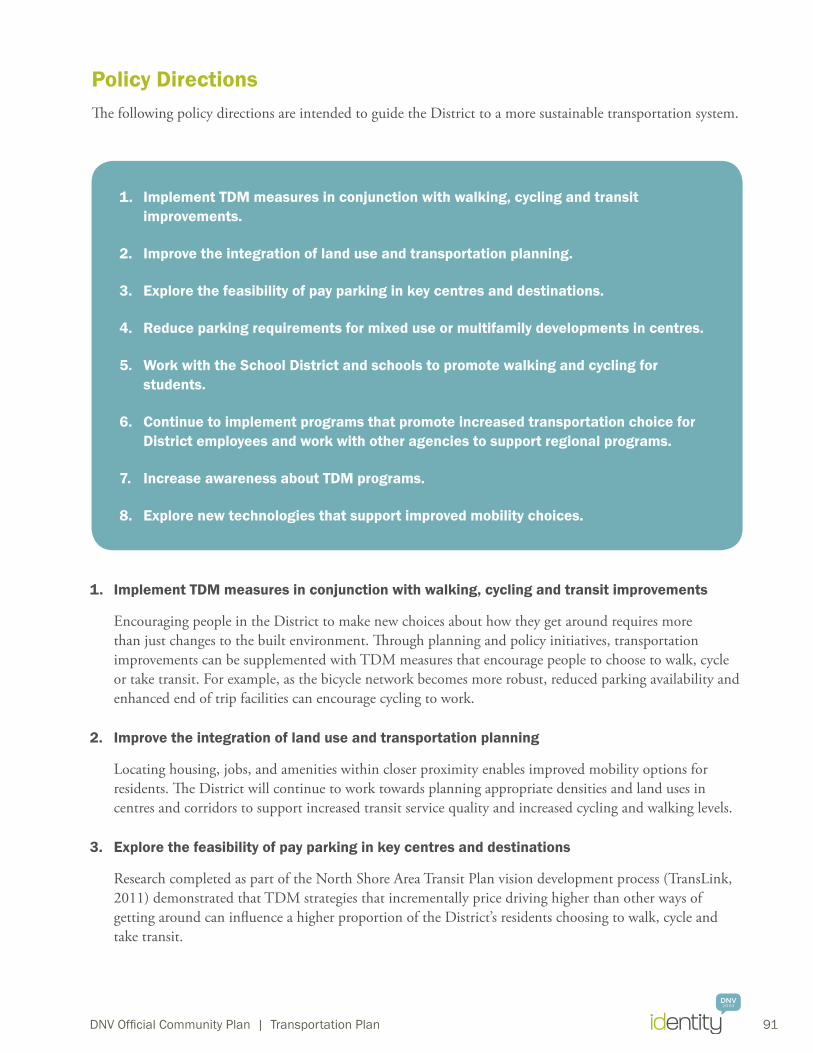
DNV Official Community Plan | Transportation Plan 91
Policy DirectionsThe following policy directions are intended to guide the District to a more sustainable transportation system.
1. implement TDM measures in conjunction with walking, cycling and transit improvements.
2. improve the integration of land use and transportation planning.
3. Explore the feasibility of pay parking in key centres and destinations.
4. Reduce parking requirements for mixed use or multifamily developments in centres.
5. Work with the School District and schools to promote walking and cycling for students.
6. Continue to implement programs that promote increased transportation choice for District employees and work with other agencies to support regional programs.
7. increase awareness about TDM programs.
8. Explore new technologies that support improved mobility choices.
1. implement TDM measures in conjunction with walking, cycling and transit improvements
Encouraging people in the District to make new choices about how they get around requires more than just changes to the built environment. Through planning and policy initiatives, transportation improvements can be supplemented with TDM measures that encourage people to choose to walk, cycle or take transit. For example, as the bicycle network becomes more robust, reduced parking availability and enhanced end of trip facilities can encourage cycling to work.
2. improve the integration of land use and transportation planning
Locating housing, jobs, and amenities within closer proximity enables improved mobility options for residents. The District will continue to work towards planning appropriate densities and land uses in centres and corridors to support increased transit service quality and increased cycling and walking levels.
3. Explore the feasibility of pay parking in key centres and destinations
Research completed as part of the North Shore Area Transit Plan vision development process (TransLink, 2011) demonstrated that TDM strategies that incrementally price driving higher than other ways of getting around can influence a higher proportion of the District’s residents choosing to walk, cycle and take transit.

92 DNV Official Community Plan | Transportation Plan
Most parking in the District is free of charge and on and off-street parking is generally ample in centres around the District. Charging for parking can discourage driving and encourage people to walk, cycle or take transit. Pricing parking has also been proven to support local retail businesses by encouraging more parking turnover and create a “park once” environment with more pedestrian activity. Pay parking could also discourage local employees from parking in prime locations in shopping districts.
4. Reduce parking requirements for mixed use or multifamily developments in centres.
The District will consider developing formal standards for lowering the number of minimum and maximum parking spaces for developments in centres and ensuring that developers provide adequate bicycle parking facilities.
5. Work with the School District and schools to promote walking and cycling for students
The number of children in the District who walk or bike to school has declined significantly in recent years and many children are being driven to and from school. The District will continue to work with the School District to encourage local schools to engage in TransLink’s school trip reduction program. School TDM programs increase active transportation and improve the health and well-being of children, while reducing parking and traffic problems around schools.
6. Continue to implement programs that promote increased transportation choice for District employees and work with other agencies to support regional programs.
Encouraging employees to commute by walking, cycling or transit results in a healthier workforce and provides cost-savings to individuals. The District will continue to work with agencies like TransLink to introduce TDM programs for its employees.
7. increase awareness about TDM programs
Providing information on the District’s website about local TDM programs as well as regional initiatives such as TransLink’s TravelSmart Program can encourage residents to explore different travel options.
8. Explore new technologies that support improved mobility choices
Innovative transportation tools are rapidly emerging as a result of advances in information and communication technology. These tools support TDM initiatives by providing travellers with information such as: bus schedules, directions, travel times, live webcams and maps. Transportation technologies can also be embedded within the infrastructure, such as: signal pre-emption for buses, sensory or video detection for cyclists and pedestrians, and real time bus schedules at bus stops. The District will continue to explore new technologies that improve transportation network effectiveness.

DNV Official Community Plan | Transportation Plan 93
10 Funding, implementation & Monitoring
Transportation investments are necessary to support the successful development of town and village centres.
This chapter outlines the strategy used to identify implementation priorities, funding strategies, and plans to monitor implementation of the Transportation Plan.
Evaluation FrameworkA number of studies were completed on road safety, road network planning, road classification, bicycle network planning, and pedestrian planning between 2008 and 2011. The North Shore Area Transit Plan, led by TransLink has also been a key input into the Transportation Plan. The ongoing OCP implementation planning will also continue to resolve the specific infrastructure needed to enliven centres as places for pedestrians, cyclists and transit users.
Coming out of the background studies, a long list of potential improvements were generated. Conceptual cost estimates have been prepared based on assumptions and projected requirements for the construction of each project. Estimates on potential partner funding contributions to projects were also developed, based on the District’s previous experiences.
The long list of potential improvements was then reviewed against the evaluation criteria. The evaluation process also acknowledged the importance of supporting the successful redevelopment of the centres identified in the OCP.

94 DNV Official Community Plan | Transportation Plan
The evaluation framework assessed various initiatives relative to goals identified in the District’s Official Community Plan (OCP), as well as safety, cost, encouragement of alternative modes, partnering opportunities, ease of implementation, and anticipated use, as follows:
» Alignment with oCP Goals - This criterion is used to benchmark each initiative relative to its support for the eight OCP goals:
1. Create a network of vibrant, mixed-use centres while enhancing the character of our neighbourhoods and protecting natural areas.
2. Encourage and enable a diverse mix of housing type, tenure and affordability to accommodate the lifestyles and needs of people at all stages of life.
3. Foster a safe, socially inclusive and supportive community that enhances the health and well-being of all residents.
4. Support a diverse and resilient local economy that provides quality employment opportunities.
5. Provide a safe, efficient and accessible network of pedestrian, bike and road ways and enable viable alternatives to the car through effective and coordinated land use and transportation planning.
6. Conserve the ecological integrity of our natural environment, while providing for diverse park and outdoor recreational opportunities.
7. Develop an energy-efficient community that reduces its greenhouse gas emissions and dependency on non-renewable fuels while adapting to climate change.
8. Provide infrastructure to support community health, safety and economic prosperity, and facilities that enhance recreational opportunities, cultural activity and artistic expression.
» Relative safety benefits - This criterion measures the degree to which the treatment could improve road safety conditions for all user groups (pedestrians, cyclists, and vehicles).
Long List of Potential improvements
• Alignment with ocp• Safety• Transportation choices• cost• Partnering opportunities• Ease of implementation• Anticipated use
Successful centres Successfulcentres
Short term prioties
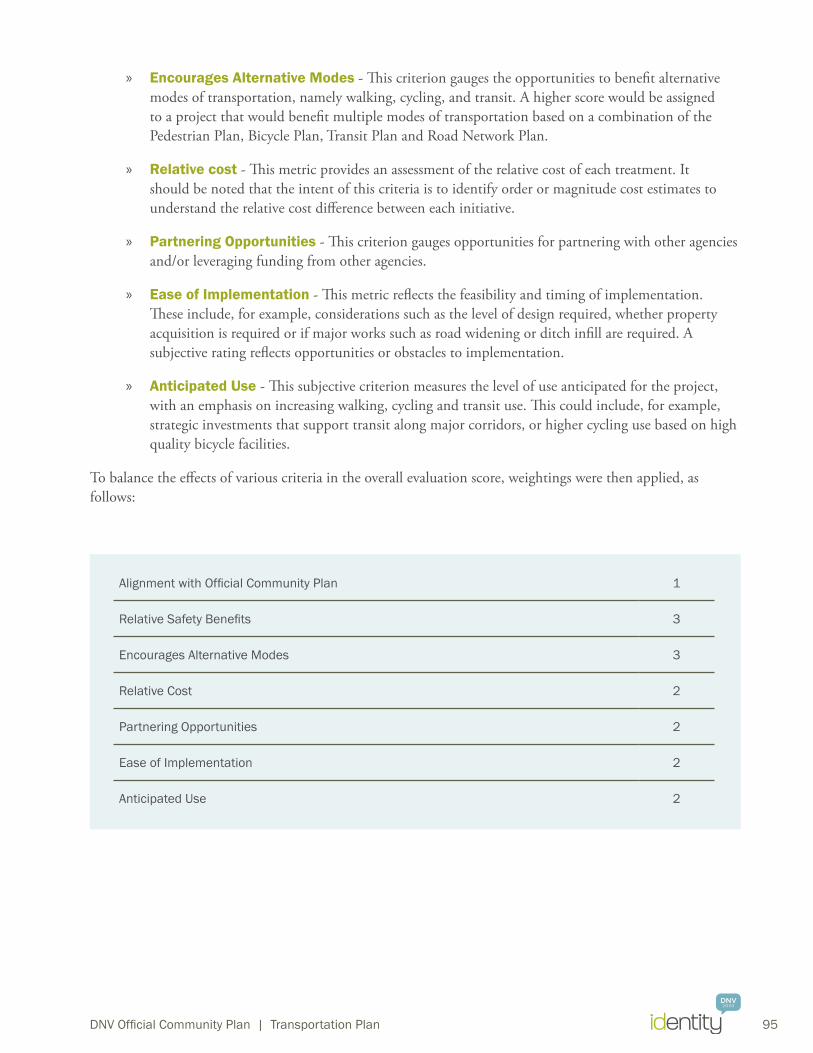
DNV Official Community Plan | Transportation Plan 95
» Encourages Alternative Modes - This criterion gauges the opportunities to benefit alternative modes of transportation, namely walking, cycling, and transit. A higher score would be assigned to a project that would benefit multiple modes of transportation based on a combination of the Pedestrian Plan, Bicycle Plan, Transit Plan and Road Network Plan.
» relative cost - This metric provides an assessment of the relative cost of each treatment. It should be noted that the intent of this criteria is to identify order or magnitude cost estimates to understand the relative cost difference between each initiative.
» Partnering opportunities - This criterion gauges opportunities for partnering with other agencies and/or leveraging funding from other agencies.
» Ease of implementation - This metric reflects the feasibility and timing of implementation. These include, for example, considerations such as the level of design required, whether property acquisition is required or if major works such as road widening or ditch infill are required. A subjective rating reflects opportunities or obstacles to implementation.
» Anticipated Use - This subjective criterion measures the level of use anticipated for the project, with an emphasis on increasing walking, cycling and transit use. This could include, for example, strategic investments that support transit along major corridors, or higher cycling use based on high quality bicycle facilities.
To balance the effects of various criteria in the overall evaluation score, weightings were then applied, as follows:
Alignment with Official Community Plan 1
Relative Safety Benefits 3
Encourages Alternative modes 3
relative cost 2
Partnering Opportunities 2
Ease of Implementation 2
Anticipated Use 2

96 DNV Official Community Plan | Transportation Plan
A second filter of projects was then applied to support successful introduction of people living and working in the developing centres in Lower Lynn, Lynn Valley, Lower Capilano and Maplewood.
After the Transportation Plan is approved, evaluation of projects will be ongoing due to factors like changes in scope, new partner funding opportunities, and circumstances for implementation. As such, the evaluation will be revisited annually to determine the value of advancing a given project for consideration in the District’s capital planning process. This approach ensures that capital projects proposed for Council consideration reflect the current transportation system needs and broader District priorities.
Funding opportunities This plan is about future improvements to the transportation network. Asset sustainment is addressed by other District initiatives and is not addressed by this document. It is acknowledged that spending on maintenance of existing assets will generally take priority over new transportation projects.
A recommendation of this plan is that the District establishes a stable and sufficient budget to ensure timely implementation of new transportation investments. Work has begun to establish a funding program for this Transportation Plan, relative to other priorities for implementing the OCP.
While this plan for new transportation investments is financially ambitious, by leveraging significant partner funding from TransLink, the Province, ICBC, and development contributions, the plan appears to be within the District’s capabilities. The following illustrative example shows how a series of projects may be supported funded by the District together with partners:
Official Community Plan
Services Finances
Long Term Financial Plan
Corporate Plan/ Strategic Action
Plans

DNV Official Community Plan | Transportation Plan 97
Below is further information on specific funding programs that the District can leverage and it is acknowledged that funding programs may change over time.
Provincial Programs and initiatives
The Ministry of Transportation and Infrastructure is responsible for provincial highways, including Highway 1. Through improvements to Highway 1 there may be opportunities to partner with the Ministry on related projects and initiatives. In addition, the Provincial Government administers the BikeBC program, which promotes new, safe and high quality cycling infrastructure through cost-sharing with local governments. The BikeBC program includes:
» Provincial Cycling Investment Program (PCIP) - Strategic investments that build important cycling corridors of regional and provincial significance are eligible under this funding program.
» Cycling Infrastructure Partnerships Program (CIPP) - Ministry of Transportation and Infrastructure cost-sharing program that provides up to 50 percent funding (to a maximum of $100,000 per project) for new bicycle facilities.
regional Programs and initiatives
TransLink provides funding for road network, transit and bicycle facility projects in Metro Vancouver through several programs:
» Major road Network Major Capital Program - Provides funding for major capital projects that exceed $5 million in cost and will have significant regional or provincial benefit.
» Major road Network Minor Capital Program - Annual allocation of TransLink capital funds that is dedicated to managing and improving the efficiency of the existing MRN network. Eligible projects include minor capital works such as improvements to MRN intersections, geometrics, safety, and network continuity.
Update to existing trail:community amenity
New pedestrian/bike bridge: shared by province or region, and district
New traffic signal: may be shaped by developer, ICBC, district
SIte to be re-developed
re-build road in front of site (sidewalks, bike lanes): developer servicing agreement

98 DNV Official Community Plan | Transportation Plan
» Major road Network operation, Maintenance and rehabilitation Program – Annual funding allocation that funds the operation, maintenance and rehabilitation of the Major Road Network on a pro rata basis, depending on the number of MRN lane kilometres within each municipality.
» Transit-Related Road Infrastructure Program (TRRIP) – Funding for transit improvements, such as transit priority signals, queue-jumping lanes for buses, and bus lanes. TransLink contributes up to half of the costs of municipal capital projects, up to the maximum funding allocated to each municipality.
» Bicycle Infrastructure Capital Cost Sharing Program (BICCS) – Funding program that encourages municipalities to construct bicycle routes and remove physical barriers to cycling. Funding is available in both “block allocations” based on population and for “regional needs”. Funding through the BICCS program is typically up to 50 percent of the project cost. The BICCS program is planned to be combined with the MRN Minor Capital program starting in 2013.
infrastructure Canada
Infrastructure Canada manages a number of programs that provide funding for environmental and local transportation infrastructure projects in municipalities across Canada. Typically, the federal government contributes one-third of the cost of municipal infrastructure projects.
Green Municipal Funds
The Federation of Canadian Municipalities manages the Green Municipal Fund, with a total allocation of $550 million. This fund is intended to support municipal government efforts to reduce pollution, reduce greenhouse gas emissions and improve quality of life.
iCBC
ICBC provides funding for road improvements where there is potential to reduce crashes, improve safety, and reduce claims costs to ICBC. Funding available through ICBC’s Road Improvement Program has assisted the District in conducting studies and implementing many safety improvements over the past 15 years. Other ICBC programs include Speed Watch (through Community Policing Centres), Speed and Intersection Safety Program, Counter Attack, Operation Red Nose, and Road Sense Speaker Program for Schools.
Development Contributions
Many of the projects specified in the plan will be partially funded through requirements of new development in the District.
Private sector
Many corporations wish to be good corporate citizens and promote environmentally-beneficial causes. Bicycle and pedestrian facilities are well-suited to corporate sponsorship and have attracted significant sponsorship both at the local level and throughout North America.
Advertising
There are several options for funding initiatives through advertising. For example, advertising on bicycle route maps and racks as well as transit shelters can reduce the costs of providing those amenities.

DNV Official Community Plan | Transportation Plan 99
implementationIn the OCP, growth is targeted in Lower Capilano Village Centre, Lower Lynn Municipal Centre, Lynn Valley Town Centre, and Maplewood Village Centre. Transportation investments will be needed to support the successful development of these centres with safer roads, pedestrian crossings and cycling connections as well as sidewalks and transit supportive measures. Outside of the centres, some investments will still be needed to support initiatives like the spirit trail and safe routes to school.
The short, medium and long priorities for investment are summarized in the maps of the walking, cycling, road safety and road nework chapters of this plan.
In some corridors, there are a number of road safety, cycling, pedestrian, and transit improvements to be completed. The catalysts to implementing a set of projects along a corridor will vary.
Not all road corridors have adequate width to accomodate all modes of travel. As such, some modes may be better accomodated through a complete network that uses parallel streets. For example, it is anticipated that streets parallel to Capilano Road between Marine Drive and Fullerton will be integral in providing effective transit priority and a comfortable environment for cycling. Another example is the Barrow-Spicer bicycle route between Harbour Avenue and the Seymour River that can provide a comfortable cycling alternative to busy Main Street.
Monitoring A monitoring plan will be developed to measure the progress of this plan towards the District’s transportation goals and will measure:
» Progress in implementation;
» Impacts of implementation on the District’s goals; and
» Value of allocating resources to various transportation initiatives.
The monitoring plan would include:
» Baseline conditions for each mode;
» Targets for each mode;
» Indicators and monitoring criteria; and
» Evaluation of conditions against baseline criteria periodically.
The District intends to establish a monitoring plan that is:
» Meaningful - The monitoring strategy should yield meaningful results and point to the success in achieving the vision, goals and targets of the Transportation Plan. These indicators and systems will need to be developed over time to reflect local needs and community priorities.

100 DNV Official Community Plan | Transportation Plan
» Measurable - The monitoring program needs to establish criteria that are readily measurable. There are numerous areas in which little or no data and/or no formal system for monitoring is available. The District will continue to work with partner agencies to improve the availability of local and regional data and incorporate it into planning processes.
» Manageable - The monitoring program needs to take into account resource limitations of the District and will identify metrics for which data or information can be readily obtained.


Inspired by nature, enriched by people