the (dis)advantages of clearinghouses before the fed
TRANSCRIPT
The (Dis)Advantages of Clearinghouses Before the Fed
Matthew Jaremski*
Colgate University, NBER
March 2014
Preliminary; Do Not Cite
Abstract:
Even well intentioned supervision and regulation can lead to ruin if not uniformly applied across
the financial system. This paper studies the double-sided effect of historical U.S. clearinghouses.
Clearinghouses were private organizations capable of auditing member banks’ balance sheets,
levying fines, and providing emergency liquidity during financial panics. At the same time, their
selective nature and membership costs left many banks unprotected. This paper studies how
clearinghouses affected the composition and solvency of both members and non-members. An
annual database of national and state bank balance sheets from six states between 1880 and 1910
indicates that those member banks had a lower closure rate and non-member banks had a higher
closures rate after a clearinghouse entered. The results suggest that the lack of universal
protection might have led to the same instability clearinghouses were trying to trying to prevent.
JEL: (G21, G32, N21)
Keywords: Bank Regulation, Financial Panics, Regulatory Arbitrage, Clearinghouses, Bank
Failure, National Banking Era
* Dept. of Economics, Colgate University, 13 Oak Drive, Hamilton, NY 13346, USA. E-mail:
1
1. Introduction
Modern financial systems are governed by a patchwork of laws and supervisors. In
addition to increasing overhead costs, the patchwork encourages the pursuit of regulatory
arbitrage whereby institutions choose to operate under the laws that will be most profitable for
them. This has led firms to move into the less regulated shadow banking system, pursue risky
off-balance sheet transactions, and adopt non-traditional corporate structures. The recent
financial crises has shown that regulatory arbitrage inevitably obscures the underlying realities
and distorts markets, leaving whole nations vulnerable to sudden changes in liquidity. In this
way, the introduction of patchwork regulation might actually cause the very instability that it
meant to correct.
The National Banking Era (1863-1914) offers a unique testing ground for examining the
spillover effects of regulatory arbitrage. During this period, the majority of banks were chartered
by state legislatures and there was no central bank to supervise and coordinate bank activity. The
only source of emergency funds was private clearinghouse institutions, and even then, they only
acted to prop up member banks. Because clearinghouses were believed to have supervised banks,
the lack of universal membership might have allowed surrounding banks to take on more risk
and increased the probability of banking panics. Using a comprehensive bank-level database of
all state and national banks in Indiana, Michigan, Minnesota, Ohio, Pennsylvania, and Wisconsin
from 1880 through 1910, I examine the effect of clearinghouses on both member and non-
member behavior.
Private clearinghouse associations filled a pseduo-regulatory role from the inception of
the first clearinghouse in 1853 until the passage of the Federal Reserve Act in 1913. Created by
groups of state and national banks, the associations were established to facilitate the clearing of
2
checks and bank notes, but evolved to provide emergency liquidity during financial panics.1
Intervening in at least eight panics, Cannon (1910, p. 96) called them "one of the finest examples
the country has ever seen of the ability of the people when left to themselves to devise
impromptu measures for their own relief".2 However, at the same time, membership was costly,
preventing many banks from receiving liquidity during panics. This was clearly illustrated during
the Panic of 1907 when member banks faired quite well compared to non-member banks. For
example, state and national banks that were part of the New York City clearinghouse lost few
deposits during 1907, while trust companies that were prohibited from joining suffered
widespread deposit losses. It was not until JP Morgan coordinated a bailout of the stock market
and trust companies that the system was able to recover.
Exploring the relative strengths and weaknesses of the clearinghouse system has proved
difficult.3 Moen and Tallman (1994, 2000) and Hoag (2011) examine clearinghouse members
relative to non-members during specific panics and in specific places. Moen and Tallman find
that member banks in New York City and Chicago fared much better than non-member banks
during the Panic of 1907, whereas Hoag finds that member banks were not significantly better
off than non-member banks in New York City during the Panic of 1893. In this way, there are
conflicting results across panics and they have not tested whether clearinghouses outside of
financial centers also had an effect on banks.
1 Gorton (1985, p. 277) states "the clearinghouse was capable of temporarily behaving as a single firm during
banking panics. The powers and functions that clearinghouses developed most resembled those of a central bank. In
fact, it is almost literally true that the Federal Reserve System, as originally conceived, was simply the
nationalization of the private clearinghouse system." 2 Loans were issued in 1857, 1860, 1861, 1863, 1873, 1884, 1890, 1893, and 1907 (Sprague 1910, pp. 432-433).
3 Seminal studies by Timberlake (1984), Gorton (1985), and Gorton and Mullineaux (1987) discuss the structure and
actions of clearinghouses in depth using anecdotal evidence from many cities and panics, but do not study individual
bank data or conduct an empirical analysis.

3
Alternatively, Jaremski (2014) has analyzed the effects of clearinghouses on national
banks across the nation from 1865 through 1914. He finds that national banks adopted a more
risky balance sheet and were slightly more likely to fail once a clearinghouse entered a city. The
examination of national bank data is useful because their uniform regulation eliminates the
possibility of omitted policy variables and the longer time-series allows for better capture of pre-
existing trends. However, the analysis suffers from three drawbacks. First, the high requirements
of national banks likely reduced the effect that clearinghouses would have had on bank stability
and composition. Second, most national banks were members of their local clearinghouse so the
paper’s results are based on comparisons across cities with different characteristics. Third, state
banks and trust companies made up the vast majority of the banking system and were often
responsible for the depth of financial panics. As a result of these issues, the study cannot test the
effect of clearinghouses on non-member banks and might understate the effect of clearinghouses
on the entire financial system.
To fill this gap, I combine national bank data from the Comptroller of the Currency’s
Annual Report with state bank data from official state reports of Indiana, Michigan, Minnesota,
Ohio, Pennsylvania, and Wisconsin. In addition to having readily available data, these states are
useful as they had few pre-existing financial centers and contained a wide range of urban, rural,
manufacturing, and agricultural areas.4 I then link the bank data to the dates of clearinghouse
membership as reported by the Merchants and Bankers Directory (1880-1889), Rand McNally
Bankers Directory (1890-1900), and Polks Bankers Directory (1901-1910).
The data indicate that banks changed their behavior after the arrival of a clearinghouse.
Banks that chose to become members experienced a significant decline in the annual probability
4 The Northeast was the only other region that had available data for the period, but given the region’s large number
of existing banks and low number of state banks, it is not well suited for this study.

4
of closure and only small changes to their composition. Alternatively, those banks that did not
become a member shifted towards a much riskier portfolio and experienced a significant increase
in their probability of closure after a clearinghouse opened. The results suggest that the
exclusivity of clearinghouses might have imposed a negative externality on the surrounding
financial community.
2. The Development of Clearinghouses in the United States
First started in New York City during 1853, clearinghouses were private organizations
created by banks to lower the costs of clearing checks and bank notes. Without the presence of a
clearinghouse, banks had to send a representative to every other bank in the area in order to
redeem their debt. Clearinghouses lowered shoe leather costs by providing a central location and
time to clear debt every day. Each member bank would then only have had to send a
representative to the clearinghouse. The association also reduced the amount of currency that
members had to pay out each day, as they were only required to make up the difference between
other banks’ debt that they returned and their debt that other banks returned. This reduced the
need for excess reserves and could have led to a more efficient allocation of assets.
Membership in a clearinghouse came with stipulations and requirements. Banks generally
had to pay a fee and pass an admissions test. The test typically involved an examination of the
bank's balance sheet and certification of its capital stock. After becoming a member, banks had
to continue to submit financial statements and allow periodic examinations when requested.
Members who did not follow these guidelines were subject to fines and could be expelled from
the association.

5
Many banks did not adopt a membership. Of the 924 banks that operated in clearinghouse
cities in the sample, only 55 percent became members. Indeed, only 7 cities had 100 percent
bank membership. National banks were much more likely to adopt memberships compared to
state banks. The lower proportion of state banks is likely a combination of clearinghouses
explicitly preventing them from becoming members and the high costs of membership relative to
their small size. As such, most locations with perfect membership were those without the
presence of a state bank and with only a couple of national banks.5
The success of the clearinghouse model in lowering clearing costs depended upon
establishing intimate relationships with member banks and keeping operations relatively local.
Banks in other cities, therefore, had to form their own associations rather than clearing debt
through New York City.6 Figure 2 provides a geographic view of 54 clearinghouses created in
the sample before 1910. Early expansion was limited to financial centers: Cincinnati, Cleveland,
Columbus, Indianapolis, Milwaukee, Philadelphia, Pittsburgh, and St. Paul. A few cities (Detroit,
Minneapolis, Grand Rapids, and Duluth) established clearinghouses during the 1880s but many
more entered after the Panics of 1893 and 1907. Nine cities established clearinghouses within
three years of 1893, and seven cities established them within three years of 1907.
2.1 Clearinghouses as Lenders of Last Resort
The clearinghouse system was designed to clear bank debt, but it evolved to do much
more. As the Panic of 1857 approached, the policy committee of the New York City
5 About half of clearinghouses had perfect national bank membership, while only 10 clearinghouses had perfect state
bank membership. 6 Most of associations adopted a structure similar to New York City's but installed some of their own rules.

6
clearinghouse authorized the issue of clearinghouse loan certificates to qualified member banks.7
The certificates were backed by collateral from the receiving bank, but they were drawn on the
clearinghouse, making them a joint-liability of the members. When a member defaulted, the
remaining members bore the loss in proportion to their capital stock. Member banks thus could
conserve their limited currency reserves by settling their clearinghouse obligations with
certificates rather than currency, and liquid banks that did not need reserves gained interest on
the certificates.8 The subsequent panics pushed clearinghouses to innovate. During the Panic of
1860, the New York Clearinghouse pooled their members' reserves to create a fund for mutual
aid. The Panic of 1873 ushered in the use of certified checks which did not require collateral.
The Panic of 1893 brought the use of low denomination clearinghouse notes which could be used
by anyone and operated as a makeshift currency.
Clearinghouses also protected their members from negative information releases during
panics. This included replacing the weekly publication of individual bank statements with the
publication of a single aggregate clearinghouse statement, limiting predatory interest rate
practices, and guarding the names of banks that received loan certificates. (Gibbons 1859,
Calomiris and Schweikart 1991)
Clearinghouses ultimately sought to protect their members from financial panics rather
than surrounding banks. As shown by Moen and Tallman (1994, 2000), state banks that were not
allowed to join Chicago’s clearinghouse and trust companies that were not allowed to join New
York City’s clearinghouse experienced greater deposit losses during the Panic of 1907. This is
even more important as the public took notice of clearinghouse. Moen and Tallman (p. 152)
7 Given that interest rates were fixed for all borrowers and everyone was on the hook for losses, the loan committee
likely took great care in choosing borrowers and assessing the collateral. 8 It is important to note that clearinghouse members were required to accept loan certificates.

7
relate that the Chicago Daily Tribune reported about the actions of the Chicago Clearinghouse in
reducing the riskiness of the banking system and moderating the panic. These news articles
likely decreased public distress over member banks. However, at the same time, they might have
increased over non-member banks by suggesting that non-member banks were unprotected.
Figure 2 illustrates bank closures in the sample states from 1880 through 1910. The
figure provides a few interesting facts. First, bank closures were concentrated around the Panics
of 1893 and 1907. Second, the fraction of bank closures was sometimes higher for clearinghouse
members than non-members. Third, state banks might have managed relatively better under
clearinghouse membership than national banks. The fraction of closed national bank members
remained above that of other national banks after 1894, while the fraction of closed state bank
members was often below that of other state banks.
While the aggregate picture tells a story, it does not offer the best comparison of member
and non-members as clearinghouses were typically in larger cities were bank competition might
have led to more bank concerns. Therefore, to provide a closer comparison, Table 1 drops all
banks in locations that did not have a clearinghouse before 1910. The table indicates that
clearinghouse members were much less likely to close than non-members. About 35 percent of
member banks closed over the thirty year period, whereas almost 55 percent of non-members
closed. These values amount to annual probabilities of about 1.2 percent and 1.8 percent
respectively. Contrary to Figure 2, the stabilizing effect of clearinghouses seems to be greatest on
national banks where membership cuts the closure rate by more than half from 66 to 31 percent,
but state banks also see a considerable reduction from 51 to 41 percent. These differences across
similar locations are quite dramatic, but could be caused by endogenous selection into
membership based on characteristics such as bank size, reputation, or age. The rest of the paper,

8
therefore, accounts for these other factors in order to offer a more conclusive test of whether
clearinghouses make member banks more stable and make non-member banks less stable.
3. Data
I combine national and state bank data to examine the effect of clearinghouses on
members and non-members. The national bank data comes from Jaremski (2013). Culled from
the Comptroller of the Currency's Annual Report, the data contain the annual balance sheet of
every national bank in operation during the third quarter of each year. Data are missing for 1885
when balance sheets were not reported and for 1905 when certain balance sheet items are
combined. Using the tables provided by the Comptroller, I drop the few balance sheets published
during the year of a bank’s closure in order to avoid changes made in anticipation of closure.
The state bank balance sheet data come from the state reports of Indiana, Michigan,
Minnesota, Ohio, Pennsylvania, and Wisconsin. Data for Indiana are from the Annual Report of
the Auditor of State of the State of Indiana. Data for Michigan are from the Annual Report of the
Commissioner of the Banking Department of the State of Michigan. Data for Minnesota are from
the Report of the Public Examiner of the State of Minnesota to the Governor before 1910 and the
Annual Report of the Banking Department of the State of Minnesota thereafter. Data for Ohio are
from Annual Report of the Auditor of State to the Governor of Ohio. Data for Pennsylvania are
from the Reports of the Several Banks and Savings Institutions and Banks Organized under the
Free Banking Law of Pennsylvania before 1895 and the Annual Report of the Commissioner of
Banking thereafter. Data for Wisconsin are from the Semi-Annual Statement on the Condition of
State and Private Banks of Wisconsin before 1895, the Annual Report of the Bank Examiner
from 1896 to 1902, and the Annual Report of the Commissioner of Banking thereafter. Due

9
mostly to states reporting bank information biannually during the 1880s, balance sheets are only
missing for Indiana in 1880, 1882, 1884, and 1898, Michigan before 1889, Minnesota in 1883,
Ohio in 1883, 1889, 1893, and 1902, and Wisconsin in 1883, 1885, and 1887.
To create consistent balance sheet measures, I must make some adjustments when
combining the various reports. First, I aggregate unique balance sheet items into more common
items. For instance, the various types of time deposits, checking deposits, demand deposits,
savings deposits, and certificates of deposits are merged into a single individual deposits
measure. Second, I fill missing bank observations using a linear trend to avoid years when only
one type of bank was present in a state for a certain year.9 Lastly, I define the year of bank
closure as the year after the last balance sheet was published. It is possible that these closures
might be name changes, mergers, or changes between national and state bank charters. While I
account for slight name changes, I am unable to determine which banks merged or converted to a
different type of charter. However, these events could also have been driven by distress and
insolvency. The final balance sheet database contains 62,714 observations for 2,491 national
banks and 3,465 state banks from 1880 through 1910.
Clearinghouse information comes from the Merchants and Bankers Directory (1880-
1889), Rand McNally Bankers Directory (1890-1900), and the Polks Bankers Directory (1901-
1910). The directories provide a list of banks and trust companies in each year, cities that had a
clearinghouse, and banks that were clearinghouse members. Because the Directories were
9 If anything, this linear assumption should bias the regressions away from finding a significant effect of
clearinghouses.

10
generally published in January, I designate membership as the year before the notation first
appeared in the directories.10
4. Empirical Analysis
Clearinghouses could have affected a bank’s stability by altering its composition,
penalizing its risky actions, and providing emergency liquidity. However, before determining
whether clearinghouses affected bank behavior, we have to know something about what led to
the entry of a clearinghouse and what led individual banks to adopt a membership. If the entry of
a clearinghouse or membership was endogenous to the local economic or financial conditions,
then we must control for those factors before examining the effect of clearinghouses on banks.
After examining these determinants, I then test whether a clearinghouse altered the balance sheet
composition and probability of closing for both members and non-members.
4.1 Determinants of Clearinghouse Entry
I model clearinghouse entry using a linear probability model where the dependent
variable is a dummy variable that takes the value of "1" if a clearinghouse was in operation in the
specified year. While the bank data exist for every year, the county-level Census database
assembled by Haines (2004) only contains data each decade. This data limitation is restrictive
because many clearinghouses were not created at the end of a decade, meaning that the model
would often pick up changes occurring after the clearinghouse entered. To obtain more precise
estimates of the determinants of clearinghouse entry, I assume that the county-level census
10
I also verify dates with Cannon (1900) and the Comptroller’s Annual Report whenever possible Dating entry one
year prior to its appearance best matches the dates provided by other sources, but the results remain similar (if not
grow larger) when using the contemporaneous year.

11
variables grew linearly over time and create annual estimates of the county-level aggregates in-
between each decennial observation.11
As the entry of a clearinghouse was likely to have quickly influenced the banking system
in the county but not economic activity, the banking measures are lagged one year but the census
variables are not. Moreover, observations after a clearinghouse entered are dropped to avoid
changes that occurred thereafter, and counties without banks are dropped to avoid locations that
would not need a clearinghouse. The full specification is:
where is a vector of county-level variables including the logarithm of population, the
logarithm of farm value per person, and the fraction of the population living in an area of 25,000
people or more, and is the error term.12
and are the logarithms of
the total number of national and state banks in the county in the previous year. and
are the logarithms of national and state bank assets and capture whether the relative
size of banks attracted clearinghouses. I also include fixed effects for each year ( ) and either
state or county-fixed effects ( ) in order to better control for local economic conditions.
Table 1 shows that clearinghouses were attracted to counties with large population and
urban centers. The coefficients on population and the fraction of the population living in an area
of 25,000 or more are always statistically significant and positive. A county that had 10 percent
more population had a 0.04 to 0.46 percentage point higher probability of receiving a
11
The few counties with changing boundaries are aggregated to their 1880 county boundaries so values are
comparable across time. 12
While the formal measure of urbanization (i.e., a place of more than 2,500) could be used, only a handful of
clearinghouses were established in a city with fewer than 25,000 people and thus the included variable should better
capture the determinants of entry. All dollar values are deflated to an 1870 basis using Officer (2008).
12
clearinghouse, whereas a county that had 10 percentage points more people living in a large city
had a 0.92 to 1.56 percentage point higher probability. The coefficients of both variables are
largest when controlling for county fixed effects suggesting that it was population growth that
mattered not just the level of population.
The number of banks is not always a significant predictor of clearinghouse entry after
dropping counties without a bank. The coefficient on state banks is only significant in the first
specification, while the coefficient on national banks is significant in both state-fixed effects
specifications. Even the coefficients on bank assets are generally insignificant. The coefficients
on banks are also a little small. Doubling the number of national banks only increased the
probability of entry by about half a percent each year. Therefore contrary to population, the
presence of national banks rather than their growth seems to be important to clearinghouse entry.
Clearinghouses thus were likely installed in growing counties with a large number of banks.
4.2. Determinants of Clearinghouse Membership
When trying to understand the determinants of clearinghouse membership, it is important
to use a proper control group. First, regardless of their composition, banks could not join a
clearinghouse if one did not exist in their city. Second, the presence of a clearinghouse may alter
the decisions of entering banks. To mitigate these issues, I limit the sample to banks in cities that
established a clearinghouse in the year before the clearinghouse opened. For instance, the
clearinghouse in Grand Rapids opened in 1885 and thus only banks in Grand Rapids existing in
1884 are included. Each bank’s membership decision is then observed when just before it was
first confronted with a clearinghouse, potentially endogenous banks are dropped, and banks that
did not have a choice to join a clearinghouse are dropped. The model is thus:

13
where is a clearinghouse dummy denoting whether the bank became a member of a
clearinghouse, is a dummy variable for whether the bank was a state bank, is a vector
of balance sheet items, and the rest of the variables retain their previous definitions. In this case,
I include a linear time trend instead of year fixed effects because of the low number of
clearinghouse entries per year.
I have chosen several key balance sheet variables based on historical studies of banking
and the CAMELS measures used by modern bank regulators. Ln(Assets) measures bank size.
The ratio of Capital to Assets measures capital adequacy. The ratio of Cash to Assets is an index
of bank liquidity, measuring the bank’s capacity to meet bank runs in specie. The ratio of
Individual Deposits to Assets measure liability diversity, whereas the ratio of Loans to Assets
measure asset diversity. The ratios of Due From Banks to Assets and Due to Banks to Assets
measure the size of interbank relationships and the bank's exposure to market participants.
Table 3 shows that state banks were not necessarily more or less likely to become a
clearinghouse member than national banks after controlling for age, location-specific factors, and
their composition. Instead, large banks that were located in towns with few other national banks
were the most likely to adopt a membership. The results make intuitive sense. First, large banks
were best able to shoulder the costs of membership. Next, clearinghouses needed some coalition
of banks in order to work effectively. To put it another way, clearinghouses in locations with few
banks would need them all to join before starting. The rest of Table 3 estimates the regressions
separately for state and national banks. State banks did not seem to respond significantly to any
of the variables, suggesting that the significant coefficients in the first set of columns are driven
mostly by national banks.

14
The data suggest that much of the decision to become a clearinghouse member is based
on a bank’s size and environment rather than its portfolio composition. In this way, it does not
seem that significantly more or less risky banks chose to join a clearinghouse.
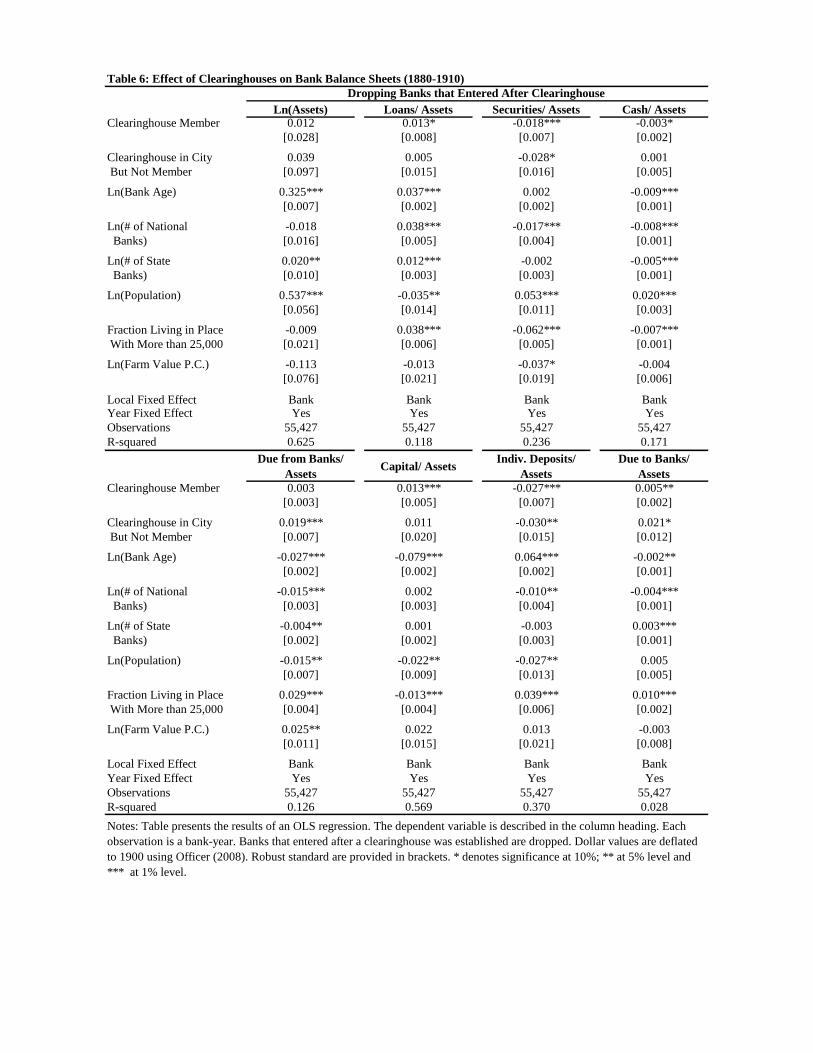
4.3 Effect of Clearinghouses on Member Balance Sheets
I take several steps to isolate the effect of clearinghouses on bank balance sheets. First, I
control for the endogeneity of clearinghouse entry by including each county’s population,
urbanization and farm value as well as each city’s state and national banks. Second, I drop banks
that entered a county after a clearinghouse was established because their composition might have
been endogeneous to the existing clearinghouse. Third, I include the logarithm of the bank’s age
and year fixed effects to capture any growth trends that existed over the lifetime of the bank and
across the financial system, and bank fixed effects to capture time invariant bank characteristics.
The model takes the form of:
where is a clearinghouse dummy denoting whether the bank was a member of a
clearinghouse in the current year, and the other variables retain their definitions.13
The
interaction between the clearinghouse dummy and the state bank dummy provides the additional
effect of clearinghouses on state banks. The total effect on national banks therefore would be ,
while the total effect on state banks would be .
Table 4 shows that banks changed their balance sheet composition after joining a
clearinghouse. Starting with the aggregate effect, becoming a member is correlated with a bank
13
now contains the ratio of bonds and stocks to assets which was previously excluded to avoid multicollinearity.
15
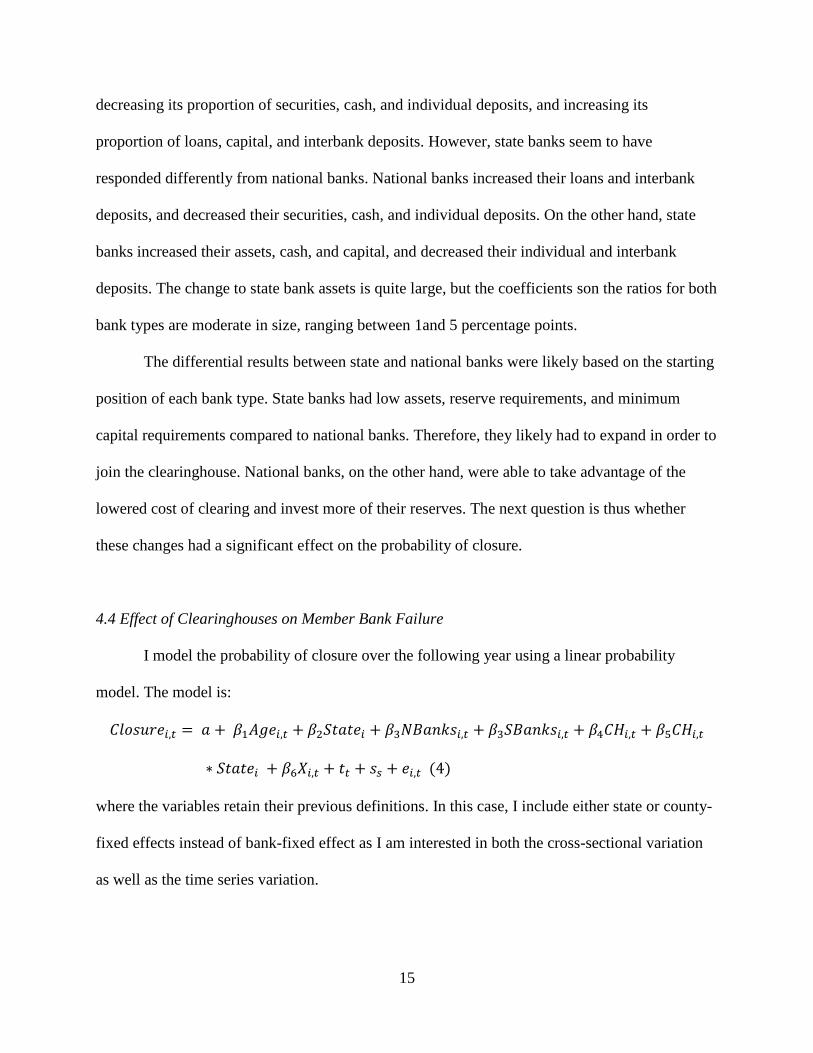
decreasing its proportion of securities, cash, and individual deposits, and increasing its
proportion of loans, capital, and interbank deposits. However, state banks seem to have
responded differently from national banks. National banks increased their loans and interbank
deposits, and decreased their securities, cash, and individual deposits. On the other hand, state
banks increased their assets, cash, and capital, and decreased their individual and interbank
deposits. The change to state bank assets is quite large, but the coefficients son the ratios for both
bank types are moderate in size, ranging between 1and 5 percentage points.
The differential results between state and national banks were likely based on the starting
position of each bank type. State banks had low assets, reserve requirements, and minimum
capital requirements compared to national banks. Therefore, they likely had to expand in order to
join the clearinghouse. National banks, on the other hand, were able to take advantage of the
lowered cost of clearing and invest more of their reserves. The next question is thus whether
these changes had a significant effect on the probability of closure.
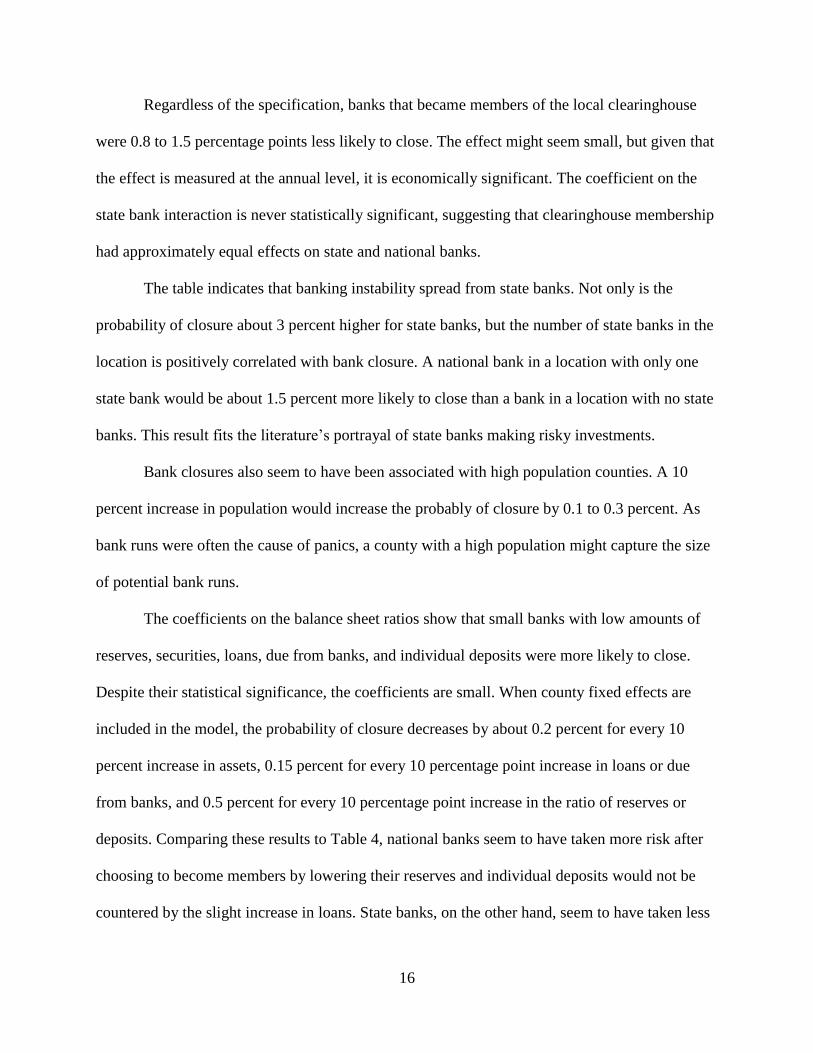
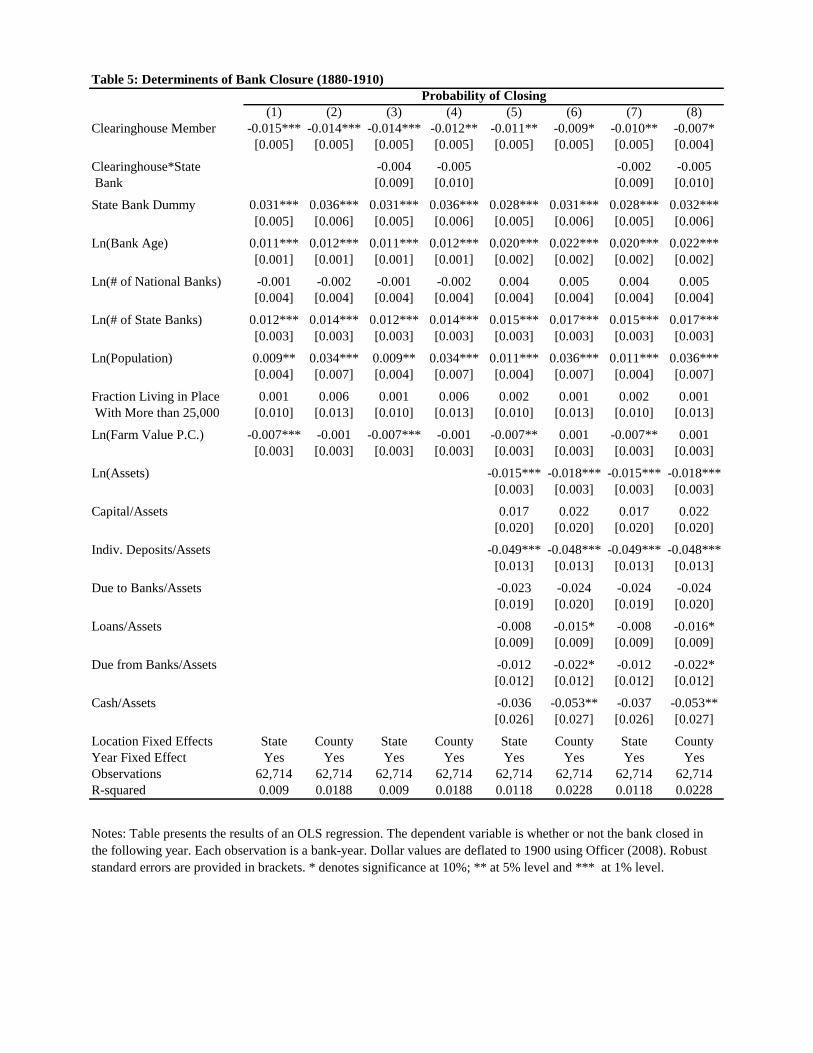
4.4 Effect of Clearinghouses on Member Bank Failure
I model the probability of closure over the following year using a linear probability
model. The model is:
where the variables retain their previous definitions. In this case, I include either state or county-
fixed effects instead of bank-fixed effect as I am interested in both the cross-sectional variation
as well as the time series variation.
16
Regardless of the specification, banks that became members of the local clearinghouse
were 0.8 to 1.5 percentage points less likely to close. The effect might seem small, but given that
the effect is measured at the annual level, it is economically significant. The coefficient on the
state bank interaction is never statistically significant, suggesting that clearinghouse membership
had approximately equal effects on state and national banks.
The table indicates that banking instability spread from state banks. Not only is the
probability of closure about 3 percent higher for state banks, but the number of state banks in the
location is positively correlated with bank closure. A national bank in a location with only one
state bank would be about 1.5 percent more likely to close than a bank in a location with no state
banks. This result fits the literature’s portrayal of state banks making risky investments.
Bank closures also seem to have been associated with high population counties. A 10
percent increase in population would increase the probably of closure by 0.1 to 0.3 percent. As
bank runs were often the cause of panics, a county with a high population might capture the size
of potential bank runs.
The coefficients on the balance sheet ratios show that small banks with low amounts of
reserves, securities, loans, due from banks, and individual deposits were more likely to close.
Despite their statistical significance, the coefficients are small. When county fixed effects are
included in the model, the probability of closure decreases by about 0.2 percent for every 10
percent increase in assets, 0.15 percent for every 10 percentage point increase in loans or due
from banks, and 0.5 percent for every 10 percentage point increase in the ratio of reserves or
deposits. Comparing these results to Table 4, national banks seem to have taken more risk after
choosing to become members by lowering their reserves and individual deposits would not be
countered by the slight increase in loans. State banks, on the other hand, seem to have taken less

17
risk as the increased reserves and assets would counter the decrease in loans individual deposits.
That being said, because most of the changes correlated with clearinghouse entry were only a
few percentage points, the effect of clearinghouse membership on closure through bank
composition was not particularly large.
4.5 Effect of Clearinghouses on Non-Members
The previous regressions show that member banks were significantly less likely to close
compared to non-member banks in their own county. The question, however, is whether
clearinghouses affected non-member banks. I thus re-estimate the balance sheet and closure
regressions to determine whether there were spillovers on the local financial community.
To estimate the effect of clearinghouses on non-members, I create a separate indicator
variable. denotes whether the bank was in a city that had a clearinghouse but was not a
member. The balance sheet regression is now:
where the variables retain their previous definitions.
Even banks that did not choose to join altered their behavior after the arrival of a
clearinghouse. In Table 6, non-members had a decline in individual deposits and securities as
well as an increase in interbank deposits. While many of these same changes occurred for
member banks, the corresponding changes were much larger for non-member banks. The size
difference is especially large for interbank deposits. This change is likely the result of non-
member banks clearing through member banks. These changes might have reduced stability
during a panic when all banks were having trouble meeting withdrawal demands.

18
Unlike the balance sheet regressions that examine the time series of each bank, the
previous bank closure regressions examined both time series and cross-section variation. This
creates a problem when including both clearinghouse dummies because banks in counties with a
clearinghouse were generally concentrated in a single city. Therefore, the model would compare
banks in large cities with those in small cities. To avoid this problem, I drop banks in cities that
never received a clearinghouse, leaving the model to compare banks in very similar locations
before and after a clearinghouse entered. The model is now:
where the variables retain their definitions. In this case, I estimate the specifications separately
with state and location fixed effects.14
The regressions results are presented in Table 7. While the coefficients are not always
statistically significant at the 10 percent level, they indicate that the entry of a clearinghouse
made members less likely to closed but made non-members more likely to close. The effect on
members is between 0.5 and 1.5 percent, while the effect on non-members is much larger
ranging from 1.7 to 3.2 percent. The coefficient for clearinghouse members falls just below the
10 percent cutoff when county fixed effects are included, while the coefficient on non-members
grows. When dropping banks outside of clearinghouse cities, a bank’s assets, individual deposit
ratio, and reserves are significant predictors of bank closure. In this way, the decrease in deposits
after the entry of a clearinghouse also made non-member banks significantly more likely to close
even compared to member banks.
14
It is important to note that the location-fixed effects will effectively drop out any location that had a clearinghouse
before 1880 and any bank that entered after a clearinghouse was established.

19
5. Conclusion
Kroszner (2000 p.158) writes, "the 'lesson' learned from [the Panic of 1907] was that the
clearinghouse mechanism appeared to be inadequate to serve the financial system of the U.S. and
was used as a motivation for the creation of the Federal Reserve System.” While Kroszner is
addressing a number of factors, this paper highlights the negative impact of clearinghouse
exclusivity. The clearinghouse system had many benefits. It audited its members’ balance sheets,
reduced the need for excess reserves, and lowered the probability of closure. However at the
same time, its entry also influenced surrounding banks that did not chose to become members.
Specifically, non-member banks adopted a more risky portfolio and became much more likely to
close after a clearinghouse entered their city. Because only around 60% of banks in
clearinghouse cities became members, the system was susceptible to economic shocks.
Exclusivity provides one reason why the nation chose to pass the Federal Reserve Act
(1913) rather than encouraging the expansion of the clearinghouse system. As described by
Wicker (2005), the establishment of a central bank was not just about emergency funds. If
emergency liquidity was the goal, then the funds issued under the Aldrich-Vreeland Act (1908)
and the clearinghouse system were likely sufficient.15
Instead the adoption of central bank was
an attempt to provide stability to the entire banking system over time—something the reactionary
and exclusionary approaches of clearinghouses could not achieve. Instead of allowing banks to
naturally form associations, the Federal Reserve forced every national bank to become a member
and strongly encouraged state banks and trust companies to join. This reduced the number of
non-protected banks and made sure that a lender of last resort was present in all cities. At the
same time, the creation of districts allowed the system to maintain some of the local supervision
15
Jacobson and Tallman (2013) show that the combination of the two factors in1914 prevented a panic from
occurring.

20
of the clearinghouse system and likewise lower the cost of note clearing. Second, it installed an
active lender of last resort that was available to provide emergency and seasonal liquidity during
all periods rather than just during financial panics. This protected banks from all economic
fluctuations and not just wide-scale problems.16
16
See for instance Miron (1986).
21
Works Cited
Calomiris, Charles and Larry Schweikart. 1991. “The Panic of 1857: Origins, Transmission, and
Containment.” Journal of Economic History 51, 807-834.
Cannon, James. 1900. Clearing Houses‒Their History, Methods, and Administration. New York:
D. Appleton and Company.
Cannon, James. 1910. Clearinghouses. National Monetary Commission. Washington, DC:
Government Printing Office
Gibbons, James S. 1859. The Banks of New York, Their Dealers, the Clearinghouses, and the
Panic of 1857. New York: D. Appleton and Co.
Gorton, Gary. 1985. "Clearinghouses and the Origin of Central Banking in the United States."
Journal of Economic History 45, 277-283.
Gorton, Gary and Donald Mullineaux. 1987. "The Joint Production of Confidence: Endogeneous
Regulation and Nineteenth Century Commercial-Bank Clearinghouses." Journal of
Money, Credit, and Banking 19, 457-468.
Haines, Michael R. 2004. Historical, Demographic, Economic, and Social Data: The United
States, 1790-2000. ICPSR Study 2896. Ann Arbor, MI: Inter-university Consortium for
Political and Social Research.
Hoag, Chris. 2011. “Clearinghouse Membership and Deposit Contraction during the Panic of
1893.” Cliometrica 5, 187-203
Jaremski, Matthew. 2013. National Bank Balance Sheets. Unpublished database collected from
the Comptroller of the Currency’s Annual Report.
Kroszner, Randall. 2000. "Lessons from Financial Crises: The Role of Clearinghouses." Journal
of Financial Services Research 18, 157-171.
Merchants and Bankers’ Directory (also called Merchants and Bankers’ Almanac). 1861-1890.
New York: Bankers’ Magazine Office.
Minnesota Population Center. 2004. National Historical Geographic Information System: Pre-
release Version 0.1. Minneapolis, MN: University of Minnesota. http://www.nhgis.org.
Miron, Jeffrey A. 1986. “Financial Panics, the Seasonality of the Nominal Interest Rate, and the
Founding of the Fed”. The American Economic Review 76, 125-140.
Moen, Jon and Ellis Tallman. 1992. "The Bank Panic of 1907: The Role of the Trust
Companies." Journal of Economic History 52, 611-630.
Moen, Jon and Ellis Tallman. 2000. "Clearinghouse Membership and Deposit Contraction
During the Panic of 1907." Journal of Economic History 60, 145-163.
Officer, Lawrence. 2008. "What Was the Value of the US Consumer Bundle Then?"
MeasuringWorth. http://www.measuringworth.org/consumer/
Rand McNally Bankers’ Directory. 1890-1914. Chicago: Rand McNally.
Sprague, Oliver. 1910. History of Crises Under the National Banking System. National Monetary
Commission.
Timberlake, Richard. 1984. "The Central Banking Role of Clearinghouse Associations." Journal
of Money, Credit, and Banking 16, 1-15.

Figure 1: Clearinghouse Locations Before 1910
Notes: Figure presents the locations of clearinghouses established before 1910. County boundaries taken from
Minnesota Population Center (2004).

Not MemberMember Not MemberMember Not MemberMember
1880 0.0167 0.0247 1880 0.0161 0 1880 0.0184 0.02
1881 0.0287 0.0112 1881 0.0299 0.0133 1881 0.0248 0
1882 0.039 0 1882 0.0248 0 1882 0.0833 0
1883 0.0217 0.0101 1883 0.0158 0.0118 1883 0.0422 0
1884 0.0446 0.0185 1884 0.0493 0.0225 1884 0.0305 0
1885 0.0131 0 1885 0 0 1885 0.0483 0
1886 0.0181 0.025 1886 0.0084 0.0309 1886 0.0435 0
1887 0.0151 0.0303 1887 0.0081 0.0291 1887 0.0333 0.0345
1888 0.022 0.0076 1888 0.0156 0.0098 1888 0.0369 0
1889 0.0188 0.0123 1889 0.0186 0.0169 1889 0.0192 0
1890 0.0212 0.0296 1890 0.0201 0.0336 1890 0.0235 0.02
1891 0.0261 0.0054 1891 0.0246 0.0079 1891 0.0285 0
1892 0.0353 0.0311 1892 0.0155 0.0078 1892 0.0645 0.0769
1893 0.0169 0.0338 1893 0.008 0.0286 1893 0.0294 0.0448
1894 0.0213 0.026 1894 0.0127 0 1894 0.0332 0.0779
1895 0.0193 0.0299 1895 0.0104 0.0191 1895 0.0306 0.0519
1896 0.0316 0.0603 1896 0.0242 0.0321 1896 0.0407 0.1184
1897 0.0196 0.0306 1897 0.0105 0.0325 1897 0.0303 0.0267
1898 0.0125 0.0224 1898 0.0069 0.0133 1898 0.019 0.0411
1899 0.0181 0.0253 1899 0.0058 0.0183 1899 0.0317 0.0411
1900 0.0162 0.0201 1900 0.0095 0.0172 1900 0.0238 0.0267
1901 0.0489 0.0353 1901 0.0211 0.0286 1901 0.0795 0.05
1902 0.0198 0.0315 1902 0.0219 0.0402 1902 0.0173 0.0125
1903 0.0248 0.0364 1903 0.0109 0.0428 1903 0.0383 0.0227
1904 0.0298 0.0438 1904 0.0226 0.0378 1904 0.0366 0.0562
1905 0.0239 0.0331 1905 0.0248 0.037 1905 0.0231 0.0241
1906 0.0249 0.0236 1906 0.0094 0.0147 1906 0.0368 0.043
1907 0.0576 0.0511 1907 0.0095 0.0421 1907 0.0947 0.0707
1908 0.0191 0.0276 1908 0.0115 0.0137 1908 0.0249 0.0561
1909 0.0139 0.0271 1909 0.0124 0.031 1909 0.0151 0.0189
1910 0.009 0.0273 1910 0.0069 0.0402 1910 0.0104 0
Figure 2: Fraction of Closed Banks (1880-1910)
Notes: Figures provide the fraction of banks that closed each year. "Not Member" denotes banks that were a
member of their local clearinghouse in that year, and "Clearinghouse" denotes those that were a member.
0
0.01
0.02
0.03
0.04
0.05
0.06
0.071
88
0
18
81
18
82
18
83
18
84
18
85
18
86
18
87
18
88
18
89
18
90
18
91
18
92
18
93
18
94
18
95
18
96
18
97
18
98
18
99
19
00
19
01
19
02
19
03
19
04
19
05
19
06
19
07
19
08
19
09
19
10
Panel A: All Banks
Not Member Member
0
0.01
0.02
0.03
0.04
0.05
0.06
18
80
18
81
18
82
18
83
18
84
18
85
18
86
18
87
18
88
18
89
18
90
18
91
18
92
18
93
18
94
18
95
18
96
18
97
18
98
18
99
19
00
19
01
19
02
19
03
19
04
19
05
19
06
19
07
19
08
19
09
19
10
Panel B: National Banks
Not Member Member
0
0.02
0.04
0.06
0.08
0.1
0.12
0.14
0.16
18
80
18
81
18
82
18
83
18
84
18
85
18
86
18
87
18
88
18
89
18
90
18
91
18
92
18
93
18
94
18
95
18
96
18
97
18
98
18
99
19
00
19
01
19
02
19
03
19
04
19
05
19
06
19
07
19
08
19
09
19
10
Panel C: State Banks
Not Member Member

Total Banks
(N=903)
National Banks
(N=390)
State Banks
(N=513)
56.1% 83.1% 35.7%
Clearinghouse Members 34.5% 30.6% 41.5%
Non-Clearinghouse Members 55.3% 72.7% 51.8%
All Banks 43.6% 37.7% 48.1%
Notes: Table presents the fraction of banks that became a member of their local clearinghouse. Locations that
never gained a clearinghouse are dropped.
Table 1: Descriptive Statistics of Banks in Clearinghouse Cities (1880-1910)
% Closed
% Members

Table 2: County-Level Determinants of Clearinghouse Entry (1880-1910)
(1) (2) (3) (4)
Ln(Population) 0.004** 0.046*** 0.004** 0.046***
[0.002] [0.013] [0.002] [0.012]
Fraction Living in Place 0.092*** 0.156*** 0.092*** 0.156***
With More than 25,000 [0.021] [0.045] [0.021] [0.045]
Ln(Farm Value P.C.) -0.003* -0.022*** -0.002* -0.022***
[0.001] [0.005] [0.001] [0.005]
L.Ln(Number of National 0.003*** 0.003 0.006*** 0.003
Banks) [0.001] [0.003] [0.002] [0.005]
L.Ln(Number of State 0.003* -0.001 0.004 0.002
Banks) [0.002] [0.002] [0.003] [0.003]
L.Ln(National Bank -0.001** -0.001
Assets) [0.001] [0.001]
L.Ln(State Bank -0.001 -0.001
Assets) [0.001] [0.001]
Location Fixed Effects State County State County
Year Fixed Effects Yes Yes Yes Yes
Observations 10,169 10,169 10,169 10,169
R-squared 0.030 0.030
Counties With At Least One Bank
Notes: Table presents the results of an OLS regression. The dependent variable is whether or
not a county gained a clearinghouse in that particular year. Each observation is a county-
year. Counties that had a clearinghouse before 1880, or did not have a bank are dropped.
Counties are also dropped from the sample after a clearinghouse was established. Dollar
values are deflated to 1900 using Officer (2008). Robust standard errors are provided in
brackets. * denotes significance at 10%; ** at 5% level and *** at 1% level.
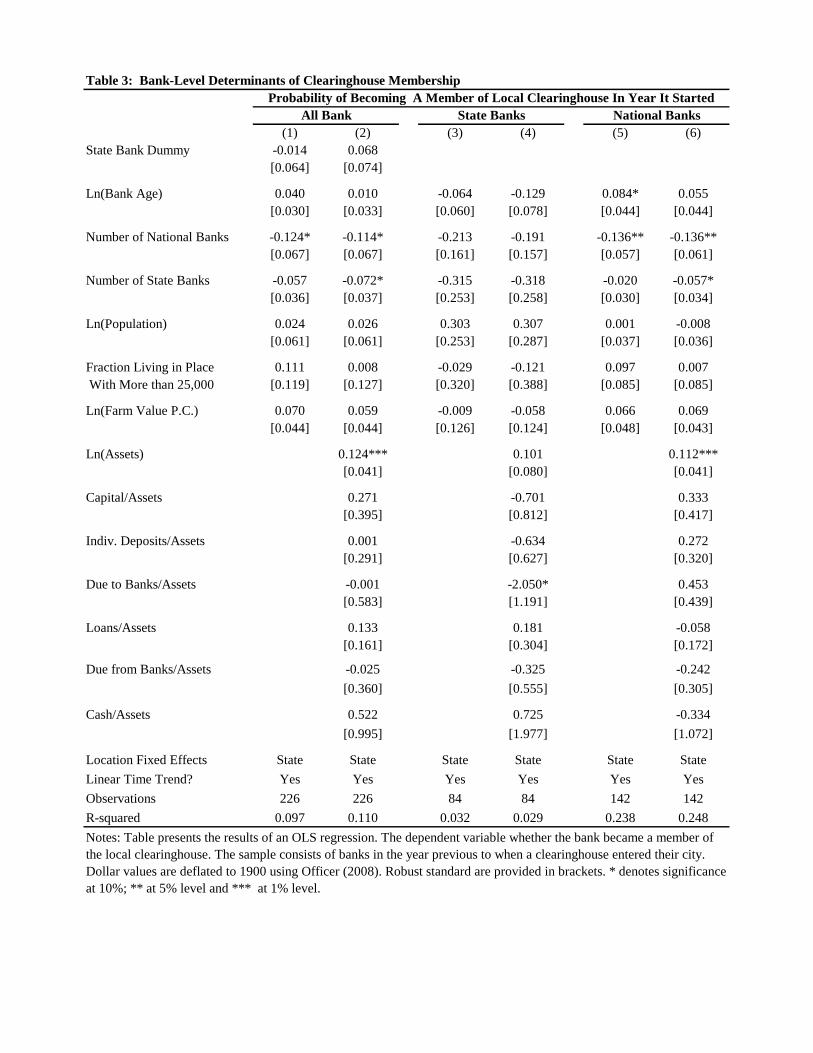
Table 3: Bank-Level Determinants of Clearinghouse Membership
(1) (2) (3) (4) (5) (6)
State Bank Dummy -0.014 0.068
[0.064] [0.074]
Ln(Bank Age) 0.040 0.010 -0.064 -0.129 0.084* 0.055
[0.030] [0.033] [0.060] [0.078] [0.044] [0.044]
Number of National Banks -0.124* -0.114* -0.213 -0.191 -0.136** -0.136**
[0.067] [0.067] [0.161] [0.157] [0.057] [0.061]
Number of State Banks -0.057 -0.072* -0.315 -0.318 -0.020 -0.057*
[0.036] [0.037] [0.253] [0.258] [0.030] [0.034]
Ln(Population) 0.024 0.026 0.303 0.307 0.001 -0.008
[0.061] [0.061] [0.253] [0.287] [0.037] [0.036]
Fraction Living in Place 0.111 0.008 -0.029 -0.121 0.097 0.007
With More than 25,000 [0.119] [0.127] [0.320] [0.388] [0.085] [0.085]
Ln(Farm Value P.C.) 0.070 0.059 -0.009 -0.058 0.066 0.069
[0.044] [0.044] [0.126] [0.124] [0.048] [0.043]
Ln(Assets) 0.124*** 0.101 0.112***
[0.041] [0.080] [0.041]
Capital/Assets 0.271 -0.701 0.333
[0.395] [0.812] [0.417]
Indiv. Deposits/Assets 0.001 -0.634 0.272
[0.291] [0.627] [0.320]
Due to Banks/Assets -0.001 -2.050* 0.453
[0.583] [1.191] [0.439]
Loans/Assets 0.133 0.181 -0.058
[0.161] [0.304] [0.172]
Due from Banks/Assets -0.025 -0.325 -0.242
[0.360] [0.555] [0.305]
Cash/Assets 0.522 0.725 -0.334
[0.995] [1.977] [1.072]
Location Fixed Effects State State State State State State
Linear Time Trend? Yes Yes Yes Yes Yes Yes
Observations 226 226 84 84 142 142
R-squared 0.097 0.110 0.032 0.029 0.238 0.248
Probability of Becoming A Member of Local Clearinghouse In Year It Started
All Bank State Banks National Banks
Notes: Table presents the results of an OLS regression. The dependent variable whether the bank became a member of
the local clearinghouse. The sample consists of banks in the year previous to when a clearinghouse entered their city.
Dollar values are deflated to 1900 using Officer (2008). Robust standard are provided in brackets. * denotes significance
at 10%; ** at 5% level and *** at 1% level.

Clearinghouse Member 0.010 -0.037 0.013* 0.026*** -0.017** -0.019** -0.003* -0.008***[0.028] [0.031] [0.008] [0.008] [0.007] [0.008] [0.002] [0.002]
Clearinghouse*State 0.148** -0.041** 0.009 0.015*** Bank [0.064] [0.018] [0.015] [0.003]
Ln(Bank Age) 0.325*** 0.323*** 0.037*** 0.038*** 0.002 0.001 -0.009*** -0.009***[0.007] [0.007] [0.002] [0.002] [0.002] [0.002] [0.001] [0.001]
Ln(# of National -0.018 -0.018 0.038*** 0.039*** -0.017*** -0.017*** -0.008*** -0.008*** Banks) [0.016] [0.016] [0.005] [0.005] [0.004] [0.004] [0.001] [0.001]
Ln(# of State 0.020** 0.021** 0.012*** 0.012*** -0.002 -0.002 -0.005*** -0.005*** Banks) [0.010] [0.010] [0.003] [0.003] [0.003] [0.003] [0.001] [0.001]
Ln(Population) 0.538*** 0.540*** -0.035** -0.036*** 0.052*** 0.053*** 0.020*** 0.021***[0.056] [0.056] [0.014] [0.014] [0.011] [0.011] [0.003] [0.003]
Fraction Living in Place -0.009 -0.011 0.038*** 0.038*** -0.062*** -0.062*** -0.007*** -0.007*** With More than 25,000 [0.021] [0.021] [0.006] [0.006] [0.005] [0.005] [0.001] [0.001]
Ln(Farm Value P.C.) -0.111 -0.107 -0.012 -0.013 -0.039** -0.039** -0.004 -0.004[0.077] [0.077] [0.021] [0.021] [0.020] [0.020] [0.006] [0.006]
Local Fixed Effect Bank Bank Bank Bank Bank Bank Bank BankYear Fixed Effect Yes Yes Yes Yes Yes Yes Yes YesObservations 55,427 55,427 55,427 55,427 55,427 55,427 55,427 55,427R-squared 0.625 0.625 0.118 0.119 0.235 0.235 0.171 0.172
Clearinghouse Member 0.003 0.001 0.012*** 0.006 -0.026*** -0.016* 0.004* 0.006**[0.003] [0.004] [0.005] [0.005] [0.006] [0.008] [0.002] [0.003]
Clearinghouse*State 0.007 0.019* -0.031** -0.007** Bank [0.006] [0.010] [0.013] [0.003]
Ln(Bank Age) -0.027*** -0.027*** -0.079*** -0.079*** 0.064*** 0.064*** -0.002** -0.001**[0.002] [0.002] [0.002] [0.002] [0.002] [0.002] [0.001] [0.001]
Ln(# of National -0.015*** -0.015*** 0.002 0.002 -0.010** -0.010** -0.004*** -0.004*** Banks) [0.003] [0.003] [0.003] [0.003] [0.004] [0.004] [0.001] [0.001]
Ln(# of State -0.004** -0.004** 0.001 0.001 -0.003 -0.003 0.003*** 0.003*** Banks) [0.002] [0.002] [0.002] [0.002] [0.003] [0.003] [0.001] [0.001]
Ln(Population) -0.015** -0.015** -0.022** -0.022** -0.027** -0.027** 0.006 0.006[0.007] [0.007] [0.009] [0.009] [0.013] [0.013] [0.005] [0.005]
Fraction Living in Place 0.029*** 0.029*** -0.013*** -0.013*** 0.039*** 0.040*** 0.010*** 0.010*** With More than 25,000 [0.004] [0.004] [0.004] [0.004] [0.006] [0.006] [0.002] [0.002]
Ln(Farm Value P.C.) 0.026** 0.026** 0.023 0.024 0.011 0.010 -0.002 -0.002[0.011] [0.011] [0.015] [0.015] [0.021] [0.021] [0.008] [0.008]
Local Fixed Effect Bank Bank Bank Bank Bank Bank Bank BankYear Fixed Effect Yes Yes Yes Yes Yes Yes Yes YesObservations 55,427 55,427 55,427 55,427 55,427 55,427 55,427 55,427R-squared 0.125 0.125 0.569 0.569 0.370 0.371 0.028 0.028Notes: Table presents the results of an OLS regression. The dependent variable is described in the column heading. Each
observation is a bank-year. Banks that entered after a clearinghouse was established are dropped. Dollar values are
deflated to 1900 using Officer (2008). Robust standard are provided in brackets. * denotes significance at 10%; ** at 5%
level and *** at 1% level.
Table 4: Effect of Clearinghouses on Bank Balance Sheets (1880-1910)
Ln(Assets) Loans/ Assets Securities/ Assets Cash/ Assets
Due from Banks/
Assets Capital/ Assets
Indiv. Deposits/
Assets
Due to Banks/
Assets
Dropping Banks that Entered After Clearinghouse
(1) (2) (3) (4) (5) (6) (7) (8)
Clearinghouse Member -0.015*** -0.014*** -0.014*** -0.012** -0.011** -0.009* -0.010** -0.007*
[0.005] [0.005] [0.005] [0.005] [0.005] [0.005] [0.005] [0.004]
Clearinghouse*State -0.004 -0.005 -0.002 -0.005
Bank [0.009] [0.010] [0.009] [0.010]
State Bank Dummy 0.031*** 0.036*** 0.031*** 0.036*** 0.028*** 0.031*** 0.028*** 0.032***
[0.005] [0.006] [0.005] [0.006] [0.005] [0.006] [0.005] [0.006]
Ln(Bank Age) 0.011*** 0.012*** 0.011*** 0.012*** 0.020*** 0.022*** 0.020*** 0.022***
[0.001] [0.001] [0.001] [0.001] [0.002] [0.002] [0.002] [0.002]
Ln(# of National Banks) -0.001 -0.002 -0.001 -0.002 0.004 0.005 0.004 0.005
[0.004] [0.004] [0.004] [0.004] [0.004] [0.004] [0.004] [0.004]
Ln(# of State Banks) 0.012*** 0.014*** 0.012*** 0.014*** 0.015*** 0.017*** 0.015*** 0.017***
[0.003] [0.003] [0.003] [0.003] [0.003] [0.003] [0.003] [0.003]
Ln(Population) 0.009** 0.034*** 0.009** 0.034*** 0.011*** 0.036*** 0.011*** 0.036***
[0.004] [0.007] [0.004] [0.007] [0.004] [0.007] [0.004] [0.007]
Fraction Living in Place 0.001 0.006 0.001 0.006 0.002 0.001 0.002 0.001
With More than 25,000 [0.010] [0.013] [0.010] [0.013] [0.010] [0.013] [0.010] [0.013]
Ln(Farm Value P.C.) -0.007*** -0.001 -0.007*** -0.001 -0.007** 0.001 -0.007** 0.001
[0.003] [0.003] [0.003] [0.003] [0.003] [0.003] [0.003] [0.003]
Ln(Assets) -0.015*** -0.018*** -0.015*** -0.018***
[0.003] [0.003] [0.003] [0.003]
Capital/Assets 0.017 0.022 0.017 0.022
[0.020] [0.020] [0.020] [0.020]
Indiv. Deposits/Assets -0.049*** -0.048*** -0.049*** -0.048***
[0.013] [0.013] [0.013] [0.013]
Due to Banks/Assets -0.023 -0.024 -0.024 -0.024
[0.019] [0.020] [0.019] [0.020]
Loans/Assets -0.008 -0.015* -0.008 -0.016*
[0.009] [0.009] [0.009] [0.009]
Due from Banks/Assets -0.012 -0.022* -0.012 -0.022*
[0.012] [0.012] [0.012] [0.012]
Cash/Assets -0.036 -0.053** -0.037 -0.053**
[0.026] [0.027] [0.026] [0.027]
Location Fixed Effects State County State County State County State County
Year Fixed Effect Yes Yes Yes Yes Yes Yes Yes Yes
Observations 62,714 62,714 62,714 62,714 62,714 62,714 62,714 62,714
R-squared 0.009 0.0188 0.009 0.0188 0.0118 0.0228 0.0118 0.0228
Table 5: Determinents of Bank Closure (1880-1910)
Probability of Closing
Notes: Table presents the results of an OLS regression. The dependent variable is whether or not the bank closed in
the following year. Each observation is a bank-year. Dollar values are deflated to 1900 using Officer (2008). Robust
standard errors are provided in brackets. * denotes significance at 10%; ** at 5% level and *** at 1% level.
Ln(Assets) Loans/ Assets Securities/ Assets Cash/ AssetsClearinghouse Member 0.012 0.013* -0.018*** -0.003*
[0.028] [0.008] [0.007] [0.002]
Clearinghouse in City 0.039 0.005 -0.028* 0.001
But Not Member [0.097] [0.015] [0.016] [0.005]
Ln(Bank Age) 0.325*** 0.037*** 0.002 -0.009***
[0.007] [0.002] [0.002] [0.001]
Ln(# of National -0.018 0.038*** -0.017*** -0.008***
Banks) [0.016] [0.005] [0.004] [0.001]
Ln(# of State 0.020** 0.012*** -0.002 -0.005***
Banks) [0.010] [0.003] [0.003] [0.001]
Ln(Population) 0.537*** -0.035** 0.053*** 0.020***
[0.056] [0.014] [0.011] [0.003]
Fraction Living in Place -0.009 0.038*** -0.062*** -0.007***
With More than 25,000 [0.021] [0.006] [0.005] [0.001]
Ln(Farm Value P.C.) -0.113 -0.013 -0.037* -0.004
[0.076] [0.021] [0.019] [0.006]
Local Fixed Effect Bank Bank Bank BankYear Fixed Effect Yes Yes Yes Yes
Observations 55,427 55,427 55,427 55,427
R-squared 0.625 0.118 0.236 0.171
Due from Banks/
AssetsCapital/ Assets
Indiv. Deposits/
Assets
Due to Banks/
Assets
Clearinghouse Member 0.003 0.013*** -0.027*** 0.005**
[0.003] [0.005] [0.007] [0.002]
Clearinghouse in City 0.019*** 0.011 -0.030** 0.021*
But Not Member [0.007] [0.020] [0.015] [0.012]
Ln(Bank Age) -0.027*** -0.079*** 0.064*** -0.002**
[0.002] [0.002] [0.002] [0.001]
Ln(# of National -0.015*** 0.002 -0.010** -0.004***
Banks) [0.003] [0.003] [0.004] [0.001]
Ln(# of State -0.004** 0.001 -0.003 0.003***
Banks) [0.002] [0.002] [0.003] [0.001]
Ln(Population) -0.015** -0.022** -0.027** 0.005
[0.007] [0.009] [0.013] [0.005]
Fraction Living in Place 0.029*** -0.013*** 0.039*** 0.010***
With More than 25,000 [0.004] [0.004] [0.006] [0.002]
Ln(Farm Value P.C.) 0.025** 0.022 0.013 -0.003
[0.011] [0.015] [0.021] [0.008]
Local Fixed Effect Bank Bank Bank Bank
Year Fixed Effect Yes Yes Yes Yes
Observations 55,427 55,427 55,427 55,427
R-squared 0.126 0.569 0.370 0.028
Notes: Table presents the results of an OLS regression. The dependent variable is described in the column heading. Each
observation is a bank-year. Banks that entered after a clearinghouse was established are dropped. Dollar values are deflated
to 1900 using Officer (2008). Robust standard are provided in brackets. * denotes significance at 10%; ** at 5% level and
*** at 1% level.
Table 6: Effect of Clearinghouses on Bank Balance Sheets (1880-1910)
Dropping Banks that Entered After Clearinghouse

(1) (2) (3) (4)
Clearinghouse Member -0.015*** -0.007 -0.013** -0.006
[0.005] [0.005] [0.005] [0.005]
Clearinghouse in City 0.027** 0.032*** 0.017 0.021*
But Not Member [0.012] [0.012] [0.012] [0.012]
State Bank Dummy 0.012 0.014 -0.004 -0.004
[0.013] [0.013] [0.014] [0.014]
Ln(Bank Age) 0.014*** 0.015*** 0.028*** 0.030***
[0.004] [0.004] [0.005] [0.005]
Ln(# of National Banks) -0.003 -0.001 -0.010 -0.005
[0.009] [0.013] [0.009] [0.013]
Ln(# of State Banks) 0.010** 0.008* 0.014*** 0.012***
[0.004] [0.004] [0.004] [0.004]
Ln(Population) 0.015 0.053*** 0.030*** 0.071***
[0.010] [0.017] [0.011] [0.018]
Fraction Living in Place 0.009 -0.007 0.018 -0.003
With More than 25,000 [0.017] [0.020] [0.017] [0.020]
Ln(Farm Value P.C.) -0.013* 0.002 -0.013 -0.004
[0.008] [0.010] [0.008] [0.010]
Ln(Assets) -0.024*** -0.026***
[0.006] [0.006]
Capital/Assets 0.035 0.041
[0.045] [0.045]
Indiv. Deposits/Assets -0.069** -0.062**
[0.027] [0.027]
Due to Banks/Assets -0.044 -0.038
[0.038] [0.038]
Loans/Assets -0.030 -0.039*
[0.021] [0.021]
Due from Banks/Assets 0.034 0.024
[0.044] [0.045]
Cash/Assets -0.129*** -0.128***
[0.044] [0.045]
Location Fixed Effects State Location State Location
Year Fixed Effect Yes Yes Yes Yes
Observations 12,697 12,697 12,697 12,697
R-squared 0.0168 0.0205 0.0235 0.0282
Cities That Established a Clearinghouse
Before 1910
Table 7: Determinents of Bank Closure (1880-1910)
Notes: Table presents the results of an OLS regression. The dependent variable is
whether or not the bank closed in the following year. Each observation is a bank-
year. Dollar values are deflated to 1900 using Officer (2008). Robust standard
errors are provided in brackets. * denotes significance at 10%; ** at 5% level and
*** at 1% level.