the direct and indirect influence of company performance
TRANSCRIPT

Research Journal of Finance and Accounting www.iiste.org
ISSN 2222-1697 (Paper) ISSN 2222-2847 (Online)
Vol.6, No.1, 2015
108
The Direct and Indirect Influence of Company Performance,
Investors’ Expectation and Investment Risk on Individual Stock
Price Index at Indonesia Stock Exchange
Muhammad Anhar
Indonesia College of Economics, 11A Kayu Jati Raya Street, Jakarta 13220, Indonesia
* E-mail of the corresponding author: [email protected]
Abstract
The objective of this research is to find out whether the company performance, investors’ expectation and
investment risk empirically have direct or indirect influence on Individual Stock Price Index (ISPI) with stock
market price and transactions volume as intermediaries.This research applied quantitative, ex post facto,
associative, and positivistic method by analyzing the Individual Stock Price Index difference among companies,
such as examining the factors that affecting the changes, analyzing the causal relationship among the factors, and
testing the differences. The existing influences are studied simultaneously using Structural Equation Model
(SEM). Stationary test, descriptive analysis, SEM analysis, Goodness of Fit Test, and Effect Size analysis are
also used in this study.The company performance factors (especially financial performance), investor’s
expectation on stock price and return, and investment risk are set as exogenous variables; market price and
transaction volume as mediator variables; and ISPI as endogenous variable. The three exogenous variables are
latent variables where their values are represented on their each indicators. Company performance indicators are
Earning per Share, Price-Earnings Ratio, Book Value, Price-Book Value Ratio, Debt-Equity Ratio, Return on
Assets, Return on Equity and Net Profit Margin. Investors’ expectation indicators are Price Trend, Latest Return,
Average Return, Return Trend, Latest Return Percentage, Average Return Percentage, and Return Trend
Percentage. Investment risk indicators are Standard Deviation of return (Total Risk), Coefficient of Variation
(Total Risk Relative), and Coefficient Beta of stock (Systematic Risk). This study confirms that: First, company
performance, investors’ expectation and investment risk influence transactions volume and market price, and
have impact on Individual Stock Price Index. Second, market price have important role as mediator, but not with
transaction volume. Third, investors’ expectation and investment risk have direct influnce on Individual Stock
Price Index, while company performances have indirect influence through market price.
Keywords: company performance, investors’ expectation, investment risk, transaction volume, market price,
and stock price index.
1. Introduction
1.1 Background
Investors expect that the Individual Stock Price Index (ISPI) continue to rise as an indicator of positive stock
return. Similarly, the issuers also expect an increase in ISPI, which means the increasing of corporate value.
However, the empirical phenomena of stock market show the different pictures, for example:
1. ISPI at one time are varies among companies, from very low (less than 100 points) to very high
(thousands of points), and fluctuate over time.
2. Market Price (MP) at one time varies among companies, from very low (less than nominal) to very high
(significantly above par), and fluctuate over time.
3. Transaction Volume (TV) at one time varies among companies, from very low (zero) to very high
(millions of shares) and fluctuate over time.
4. Company Performance (CP, especially financial performance), Investors' Expectations (IE) and
Investment Risk (IR) at one time varies among companies and fluctuate over time.
Those phenomena indicate empirical gap does exist between the expectations of the parties interested in
stock investment and the market reality on the other side. Those phenomena raise the question: Why ISPI varied
among companies and fluctuate over time? What is the relationship of ISPI’s fluctuations and differences with
CP’s, IE’s and IR’s fluctuations and differences? Are CP, IE and IR affect the stock MP and VT, subsequently
leading to ISPI?
1.2 Research Problem
The research problem are formulated as follows: "How do company performance (CP), investors' expectations
(IE), and the investment risk (IR) influence stock market price (MP) and stock transaction volume (TV), and do
they have any impact on individual stock price index (ISPI)? ". The problems of this study are meticulously as
follows:
1. How do CP, IE and IR influence ISPI directly and indirectly?
Research Journal of Finance and Accounting www.iiste.org
ISSN 2222-1697 (Paper) ISSN 2222-2847 (Online)
Vol.6, No.1, 2015
109
2. How do the role of MP and TV as mediator of the influence of CP, IE and IR on ISPI?
1.3 Research Objectives
In accordance with the research problem, the objectives of this research are:
1. Determine the direct and indirect influence of CP, IE and IR on ISPI.
2. Determine the role of MP and TV as mediators of the effect of CP, IE and IR on ISPI.
2. Literature Review, Conceptual Framework and Hypothesis
2.1 Literature Review
Investors’ expectations in the stock investment is to obtain return commensurate with the risks that have been
taken into account. Stock return is benefits associated with investing money in stocks includes annual cash
dividends as well as the market price increases or capital gains that realize at the end of the year (Van Horne &
Wachoviz, 2001). Almost all investors prefer a stock return in form of capital gain to dividend (Susanto and
Sabardi, 2002). Since the capital gain is derived from the price increase, then MP and its fluctuation are very
important for investors. MP determines the amount of compensation for the investors and the value of company.
Stock market price is the price the stock is sold in the market (Weston et al., 2006). Transaction volume is the
number of shares traded daily (Magdalena, 2004), or the number of shares traded on day t (Halim and Hidayat,
2000). MP and TV are indicators used in technical analysis. Stocks with large TV and high MP indicate that the
stocks are actively traded (saleable). Stock Price Index is a stock price expressed in index numbers
(fayku.files.wordpress.com), expressed in scale of point, and counted in a certain way. ISPI is the stock price
index of each company listed on a stock exchange (www.idx.co.id.). ISPI is a ratio of MP to basic price for each
stock, and published by the stock exchange (fayku.files.wordpress.com). Since component of index calculation
include MP and TV, then factors that affect MP and TV will have impact on ISPI. MP and TV are influenced by
factors which is the base of stocks selection by investors, for example the CP, IE and IR.
The influence of CP is discused in fundamental analysis of the company. In the analysis, MP and TV
are affected by the prospect of stocks return, and the prospect of stocks return are reflected in the financial
performance of the issuer (Tandelillin, 2010). The indicator of good or bad financial performance is reflected in
the financial ratios (Yowono, Sukarno and Ichsan, 2003). In other words, financial ratios are indicators of CP,
specifically financial performance. Overall, financial ratios are numerous. Each researcher is entitled to
determine the ratio used, since there is no compulsion to use certain ratios (Prihadi, 2008). Financial ratios
publicly listed companies are available and can be obtained at Indonesian Stock Exchange. They are Earning
Per Share (EPS), Price-Earnings Ratio (PER), Book Value (BV), Price-Book Value Ratio (PBV), Debt-Equity
Ratio (DER), Return on Assets (ROA), Return on Equity (ROE), Net Profit Margin (NPM), and Operating Profit
Margin (OPM).
The influence of IE is discused in technical analysis. Technical analysis is essentially a search of
predictable stock prices and returns pattern (Bodie et al., 2008). Expected return is a return to be received by
investors on their investment in the future (Suad Husnan, 2001). Level of stock price and expected return are
based on estimates made in a certain way (Brown and Warner, 1985). The results of estimation will determine
investors' expectations of stock price and stock return that is going to happen in the future. Investors are
interested to stocks with high expected price and return. Level of IE on stock prices and stock return in the future
based on the value of Last Price (LP), Average Price (AP), Price Trend (PT), Last Return (LR), Average Return
(AR), Return Trend (RT), Last Return Percentage (LR%), Average Return Percentage (AR%), and Return Trend
Percentage (RT%).
The influence of IR is expressed in the axiom "risk-return trade-off." The axioms argued that rational
investors consider risks and returns when investing their money. Palepu et al. (2006) says that one stages in
security analysis is the formulation of expected return and risk of individual securities. With the risk and return
analysis, investors can discover which company's stock has expected return commensurate with its risks.
Investors will buy shares in the perception that there is conformity (equivalent) between potential risk and
expected return. Of some notion stated by the experts (Van Horn, Bodie, Brigham etc.), it can be concluded that
the investment risk is (1) the possibility of obtaining actual return of investment inconsistent with the expected
return, (2) the possibility of not achieving the expected return. The difference between the actual return and
expected return of a security is Total Risk, the difference arising due to market conditions called Systematic Risk,
and the difference arising because of the company condition called Specific Risk. Systematic risk showed
sensitivity of the investment return to economic conditions in general and stock market condition in particular.
Stock market conditions can be observed from fluctuations of Jakarta Composite Index (JCI) and its market
return. Specific risks showed sensitivity of stock returns (SR) to internal factors of the company. Investors are
more concerned with total risk and systematic risk, because specific risk can be minimized and controlled
(controllable) by means of diversification and selecting well-performed shares, while total risk and systematic
risk cannot be minimized under the same way and are beyond the control of investors (uncontrollable). Total risk
Research Journal of Finance and Accounting www.iiste.org
ISSN 2222-1697 (Paper) ISSN 2222-2847 (Online)
Vol.6, No.1, 2015
110
is measured by standard deviation (SD, σ) and coefficient of variation (CV) of return, whereas systematic risk is
measured by the Beta coefficient (β) of stock.
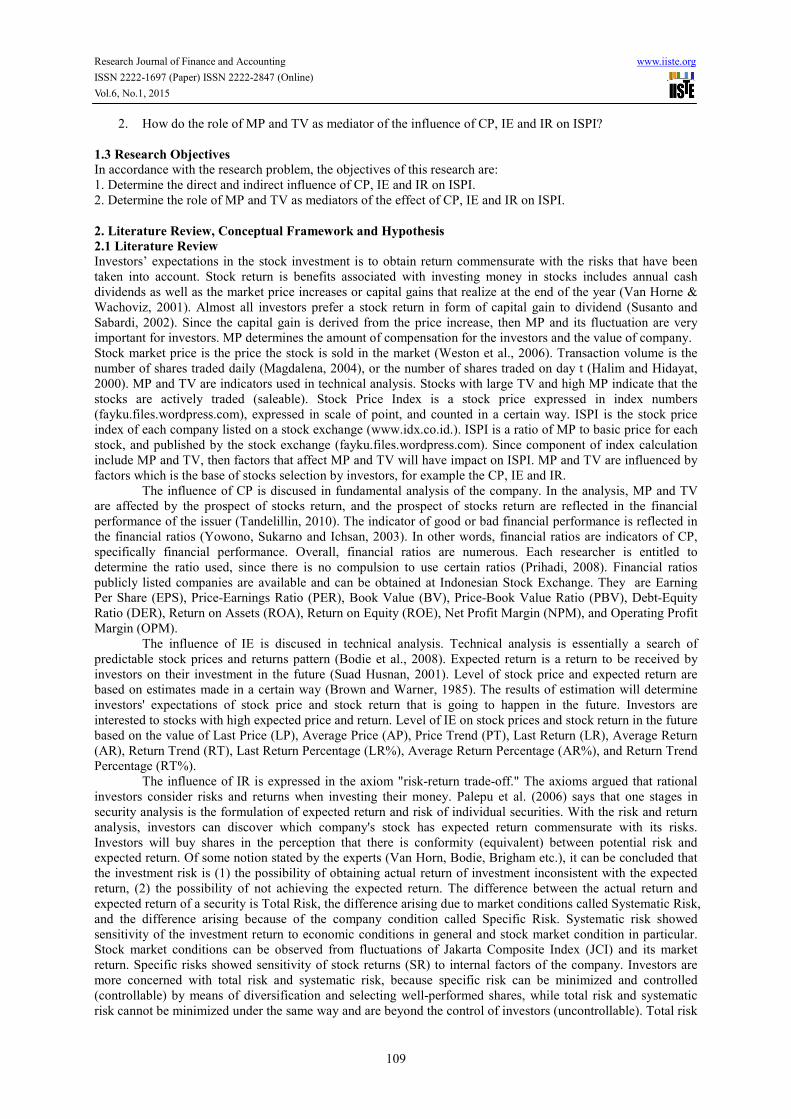
2.2 Previous Research
Stock related research (price, return, index) in general have been carried out. But such as theory, research related
to those factors generally indicates the presence of a research gap as follows:
1. The influences of those factors are examined separately or partially. The influences of CP are
investigated and analyzed with company's fundamental analysis, the influences of IE are investigated
and analyzed with technical analysis, and the influences of IR are investigated and analyzed with
investment risk analysis. Research that examines these three factors simultaneously/integrated in one
multifactor-model has not been done.
2. The influence of financial ratios (these are actually just indicators of CP, not CP itself) or IE indicators
or IR indicators on SR/MP/ISPI are analyzed partially (as shown below) using regression model or
trend. Indicators of CP/IE/IR work as independent variables, and SR/MP/ISPI work as dependent
variables.
3. Regression model involving only the independent and dependent variable without the intermediary
variable has been used, so that only produces direct influence and no indirect influence.
4. CP/IE/IR is measured by their value itself, not using the indicators, because the indicators used to
measure latent variables are unknown in regression model.
Compared to previous studies, this study has the following differences (See Figur 1 below) :
Figure 1. Research Model
FINANCIAL RATIOS SR/MP/ISPI
SR/MP/ISPI
RISK INDICATORS
SR/MP/ISPI FLUCTUATION SR/MP/ISPI PREDICTION

Research Journal of Finance and Accounting www.iiste.org
ISSN 2222-1697 (Paper) ISSN 2222-2847 (Online)
Vol.6, No.1, 2015
111
Explanation:
Indonesia English
KP (Kinerja Perusahaan)
EI (Ekspektasi Investor)
RI (Risiko Investasi)
VT (Volume Transaksi)
HP (Harga Pasar)
IHSI (Indek Harga Saham Individual)
CP (Company Performance)
IE (Investors’ Expectation)
IR (Investment Risk)
TV (Transaction Volume)
MP (Market Price)
ISPI (Individual Stock Price Index) as an approximation of Stock
Return
1. The influences of CP, IE and IR are being researched and analyzed integratedly using a multifactor
model (Structural Equation Model) as shown below.
2. Put CP, IE and IR in position as latent independent (exogenous) variables to be measured by its
indicators, and the indicators are positioned as indicators (not as independent variable).
3. Insert MP and TV as mediator variables in the model, so it can be known whether the influence of CP,
IE, and IR are direct or indirect.
4. Put ISPI in position as dependent (endogenous) variable.
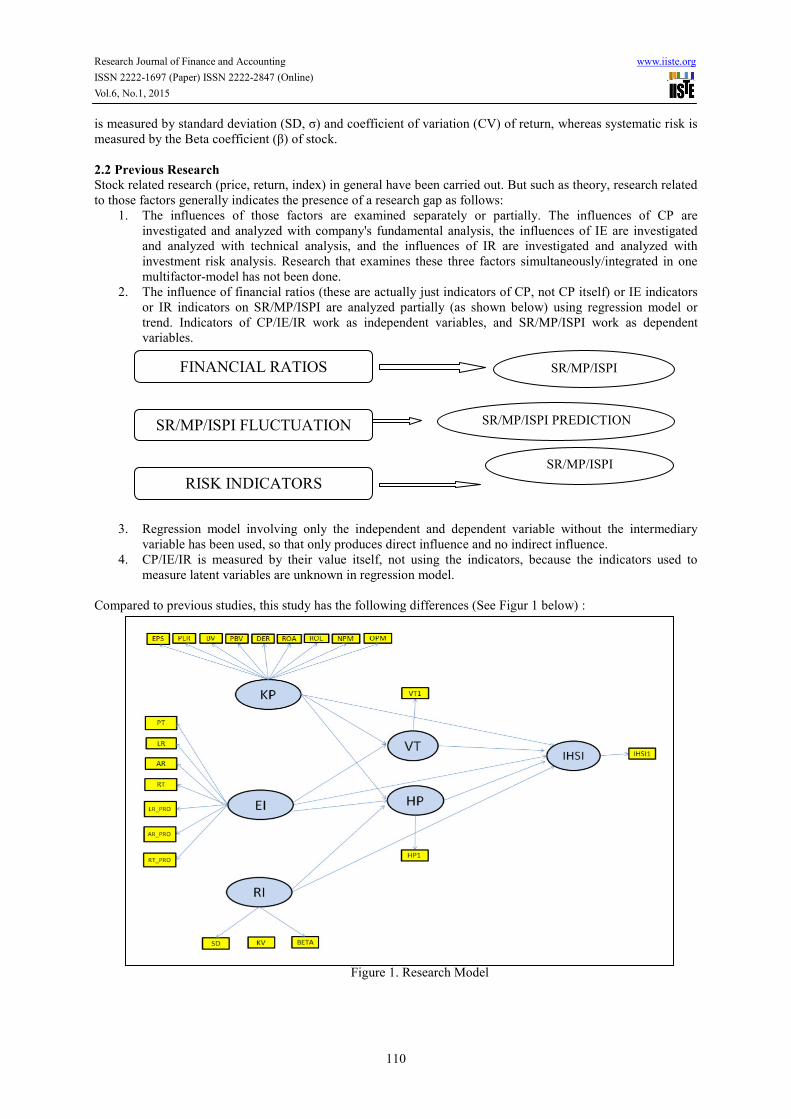
2.3 Conceptual Framework
Conceptual framework below explains the relationship model which explain that CP, IE and IR have direct
influence on ISPI and have indirect influence through MP and TV. In the framework, there are three pathways of
influence as follow (See Figure 2) :
1. The direct influence of exogenous variables (CP, IE and IR) on endogenous variables (ISPI) without
going through mediator variable.
2. The influence of mediator variables (MP and TV) on endogenous variable (ISPI).
3. The influences of exogenous variables (CP, IE and IR) on endogenous variables (ISPI) through the
mediator variables (MP and VT).
2.4 Research Hypotheses
Based on the conceptual framework described above, the following hypotheses can be developed:
H1: Company performances affect stock transaction volume.
H2: Investor’s expectations affect stock transaction volume.
H3: Investment risks affect stock transaction volume.
H4: Company performances affect stock market price.
H5: Investors’ expectations affect stock market price.
H6: Investment risks affect stock market price.
H7: Stock market price affect ISPI.
H8: Stock transaction volume affect ISPI
H9: Company performance affect ISPI.
H10: Investors’ expectations affect ISPI. H11: Investment risks affect ISPI.
3. Methodology
The design of causal research has been used in this study, which the strength of relationships and influence
among variables will be measured either directly or indirectly. Exogenous variables (CP, IE and IR) use 19
indicators, while mediator variables (MP and TV) and endogenous variable (ISPI) using one indicator each. Thus
the overall study design includes 22 indicators in the initial model as shown above (see figure 1 and 2).
Using secondary data of 110 samples out of 425 companies listed at the end of May 2014 as the
population, this research applied quantitative, ex post facto, associative, and positivistic method by analyzing
the ISPI difference among companies, such as examining the factors that affecting the changes, analyzing the
causal relationship among the factors, and testing the differences. The existing influences are studied
simultaneously using Structural Equation Model (SEM). Stationary test, descriptive analysis, SEM analysis,
Goodness of Fit Test, and Effect Size analysis are also used in this study.
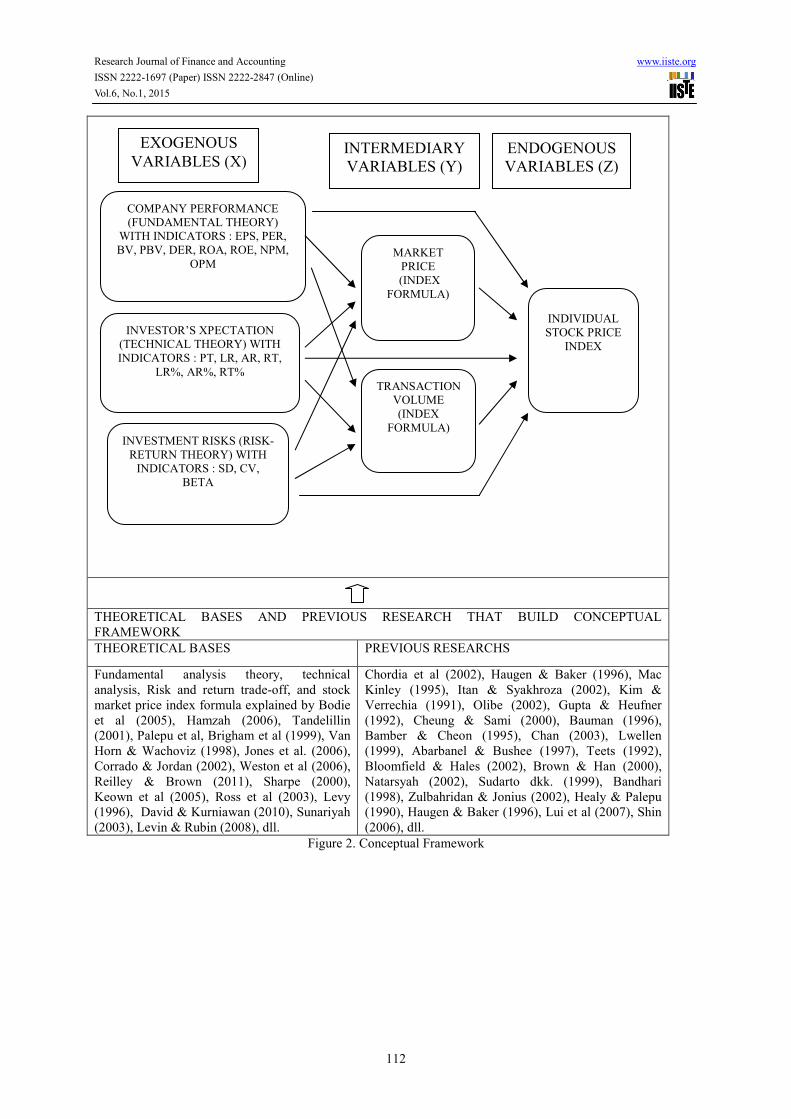
Sequences of analysis are presented in table 1 below:
Research Journal of Finance and Accounting www.iiste.org
ISSN 2222-1697 (Paper) ISSN 2222-2847 (Online)
Vol.6, No.1, 2015
112
THEORETICAL BASES AND PREVIOUS RESEARCH THAT BUILD CONCEPTUAL
FRAMEWORK
THEORETICAL BASES PREVIOUS RESEARCHS
Fundamental analysis theory, technical
analysis, Risk and return trade-off, and stock
market price index formula explained by Bodie
et al (2005), Hamzah (2006), Tandelillin
(2001), Palepu et al, Brigham et al (1999), Van
Horn & Wachoviz (1998), Jones et al. (2006),
Corrado & Jordan (2002), Weston et al (2006),
Reilley & Brown (2011), Sharpe (2000),
Keown et al (2005), Ross et al (2003), Levy
(1996), David & Kurniawan (2010), Sunariyah
(2003), Levin & Rubin (2008), dll.
Chordia et al (2002), Haugen & Baker (1996), Mac
Kinley (1995), Itan & Syakhroza (2002), Kim &
Verrechia (1991), Olibe (2002), Gupta & Heufner
(1992), Cheung & Sami (2000), Bauman (1996),
Bamber & Cheon (1995), Chan (2003), Lwellen
(1999), Abarbanel & Bushee (1997), Teets (1992),
Bloomfield & Hales (2002), Brown & Han (2000),
Natarsyah (2002), Sudarto dkk. (1999), Bandhari
(1998), Zulbahridan & Jonius (2002), Healy & Palepu
(1990), Haugen & Baker (1996), Lui et al (2007), Shin
(2006), dll.
Figure 2. Conceptual Framework
EXOGENOUS
VARIABLES (X) ENDOGENOUS
VARIABLES (Z)
INTERMEDIARY
VARIABLES (Y)
COMPANY PERFORMANCE
(FUNDAMENTAL THEORY)
WITH INDICATORS : EPS, PER,
BV, PBV, DER, ROA, ROE, NPM,
OPM
INVESTOR’S XPECTATION
(TECHNICAL THEORY) WITH
INDICATORS : PT, LR, AR, RT,
LR%, AR%, RT%
INVESTMENT RISKS (RISK-
RETURN THEORY) WITH
INDICATORS : SD, CV,
BETA
TRANSACTION
VOLUME
(INDEX
FORMULA)
MARKET
PRICE
(INDEX
FORMULA)
INDIVIDUAL
STOCK PRICE
INDEX
Research Journal of Finance and Accounting www.iiste.org
ISSN 2222-1697 (Paper) ISSN 2222-2847 (Online)
Vol.6, No.1, 2015
113
Tabel 1. Road Map of Analysis Steps
No. Analysis Analysis Objective Acceptance Criteria
1 Identification Examine for existence of multivariate
outlier and multicolliniarity
MD < χ2
P-value > 0,05
Pearson Correlation < 0,85
2 Correlation analysis Examine the relationship between
indicators
P Value < 0,05
3 Exploratory Factor
Analysis
Obtain a proper composition of indicators FL > 0,5
4 Confirmatory Factor
Analysis
Examine the validity and reliability of
indicators and variables
LF ≥ 0,5 and statistic t ≥ 1,96
AVE ≥ 0,5 and CR ≥ 0,6
AVE > Square of correlation
between constructs
5 SEM Analysis Obtain the equations and diagram model Diagram and Equation
6 Evaluation of
structural model
Testing the hypotheses partially. t > 1,96
7 Goodness of Fit Test Examine the fitness level of model. GoF Criteria
8 Effect Size (f2)
analysis
Examine the effect of the intermediary
variables
Category of Effect:
0,02 - small
0,15 - medium
0,35 – large
4. Type, Source and Collection Method of Data
This study uses secondary data which are the indicators of CP, IE, IR, MP, TV and ISPI. Such indicators are EPS,
PER, BV, PBV, DER, ROA, ROE, NPM, OPM, PT, LR, AR, RT, LR%, AR%, RT%, SD, CV, and Beta at the
end of May 2014, and also for MP, TV and ISPI at the end of June 2014 from 110 samples of stock. Samples
were taken from a population of 425 shares using stratified random sampling, the sample size was determined
using Slovin formula in order to obtain a proportional sample of ±26% from each industry. Data was obtained
directly from the IDX publication, and partly need to be calculated by the researcher. Stocks data that needed are
last 34 months (September 2009 - June 2012) in order to get stock return every month for 33 months.
5. The Result
5.1 Identification
The examination of Mahalanobis Distance defined10 companies as multivariate outliers, which has value of D2
are more than 48,268 (Tabachnick & Fidell, 2005). All of ten companies were eliminated from further analysis,
so that the subsequent analysis involving 100 companies as sample.
The examination of multicollinearity define that there is no multicollinearity among the exogenous
variables, where the value of the correlation between the latent variables is less than 0.85 (Kline, Rex B., 2011).
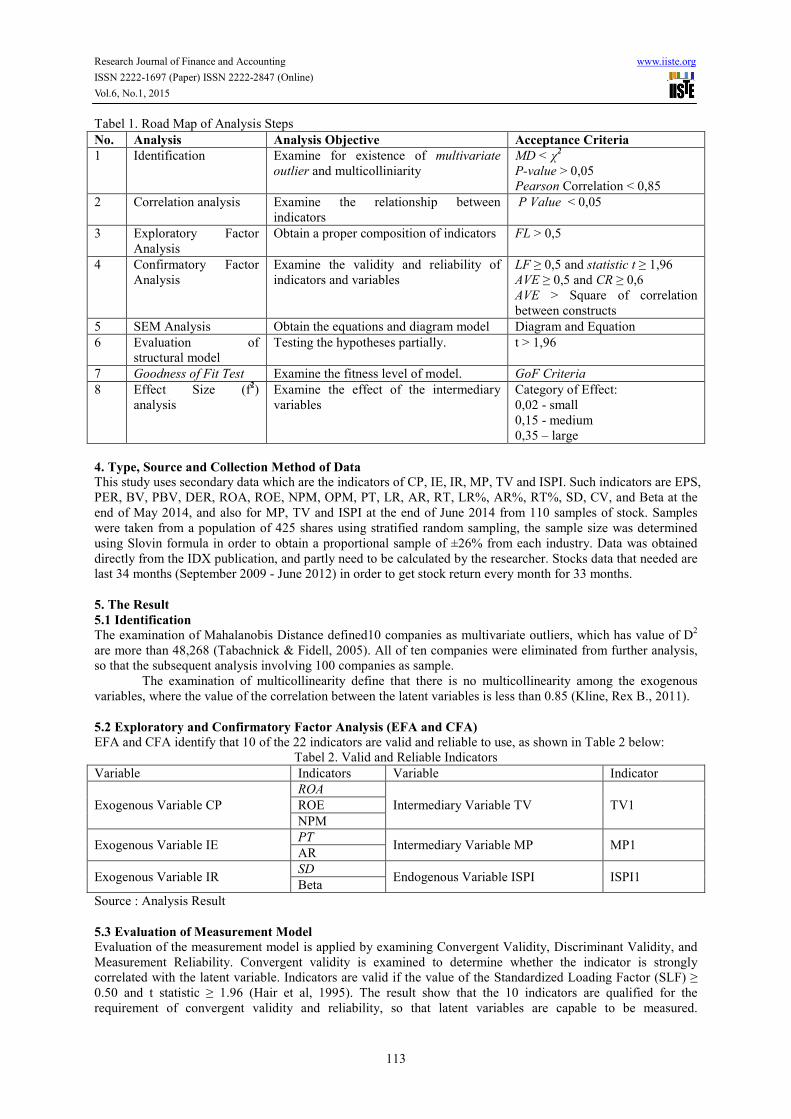
5.2 Exploratory and Confirmatory Factor Analysis (EFA and CFA)
EFA and CFA identify that 10 of the 22 indicators are valid and reliable to use, as shown in Table 2 below:
Tabel 2. Valid and Reliable Indicators
Variable Indicators Variable Indicator
Exogenous Variable CP
ROA
Intermediary Variable TV TV1 ROE
NPM
Exogenous Variable IE PT
Intermediary Variable MP MP1 AR
Exogenous Variable IR SD
Endogenous Variable ISPI ISPI1 Beta
Source : Analysis Result
5.3 Evaluation of Measurement Model
Evaluation of the measurement model is applied by examining Convergent Validity, Discriminant Validity, and
Measurement Reliability. Convergent validity is examined to determine whether the indicator is strongly
correlated with the latent variable. Indicators are valid if the value of the Standardized Loading Factor (SLF) ≥
0.50 and t statistic ≥ 1.96 (Hair et al, 1995). The result show that the 10 indicators are qualified for the
requirement of convergent validity and reliability, so that latent variables are capable to be measured.
Research Journal of Finance and Accounting www.iiste.org
ISSN 2222-1697 (Paper) ISSN 2222-2847 (Online)
Vol.6, No.1, 2015
114
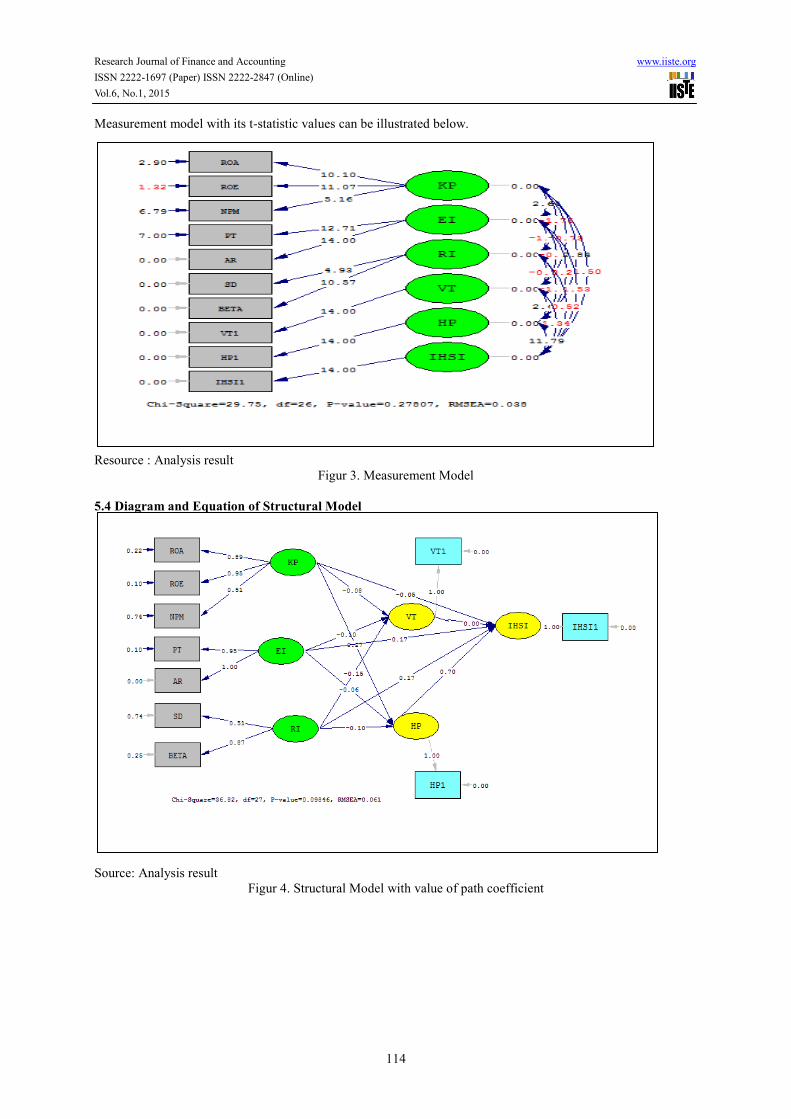
Measurement model with its t-statistic values can be illustrated below.
Resource : Analysis result
Figur 3. Measurement Model
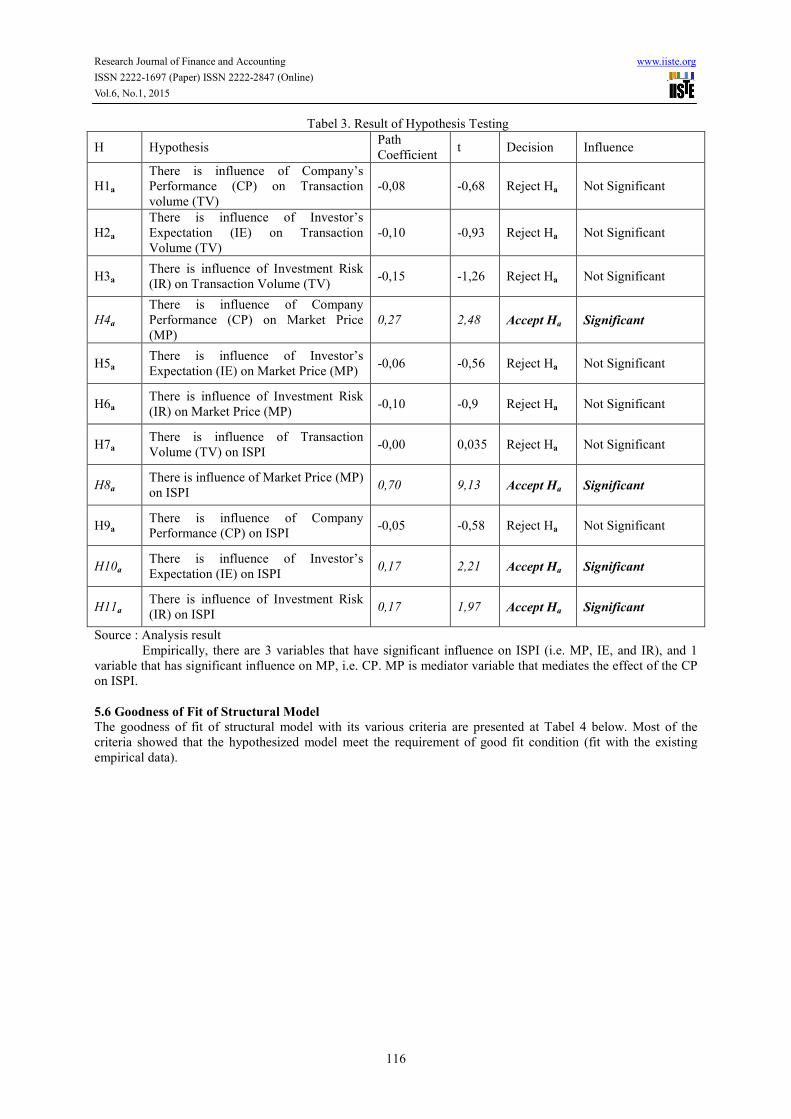
5.4 Diagram and Equation of Structural Model
Source: Analysis result
Figur 4. Structural Model with value of path coefficient

Research Journal of Finance and Accounting www.iiste.org
ISSN 2222-1697 (Paper) ISSN 2222-2847 (Online)
Vol.6, No.1, 2015
115
Source: Analysis result
Figur 5. Structural Model with t-value statistics
5.5 Evaluation of Structural Model (HypothesisTesting)
Hypothesis testing is applied to determine which variables are significantly influential. The steps are as follows
(Example: test of hypothesis H1):
• H10: There is no influence of Company's Performance on Transaction Volume.
H1a: There is influence of Company's Performance on Transaction Volume.
• Testing Criteria: t-value statistics. The decision is to reject H0 when the value of t is greater than t-table (1.96).
• Accept Ho and reject Ha means that there is no significant effect, on the other hand reject H0 and accept Ha
means that there is a significant effect.
• t-statistics = -0.68.
• Decision: Accept H0 and Ha rejected because t-statistics < 1.96.
• Conclusion: Company’s Performance has no significant effect on Transaction Volume.
Hypothesis testing of H2 - H11 are conducted in the same manner as the hypothesis testing of H1 above. The
results are presented at Tabel 3 below.
Research Journal of Finance and Accounting www.iiste.org
ISSN 2222-1697 (Paper) ISSN 2222-2847 (Online)
Vol.6, No.1, 2015
116
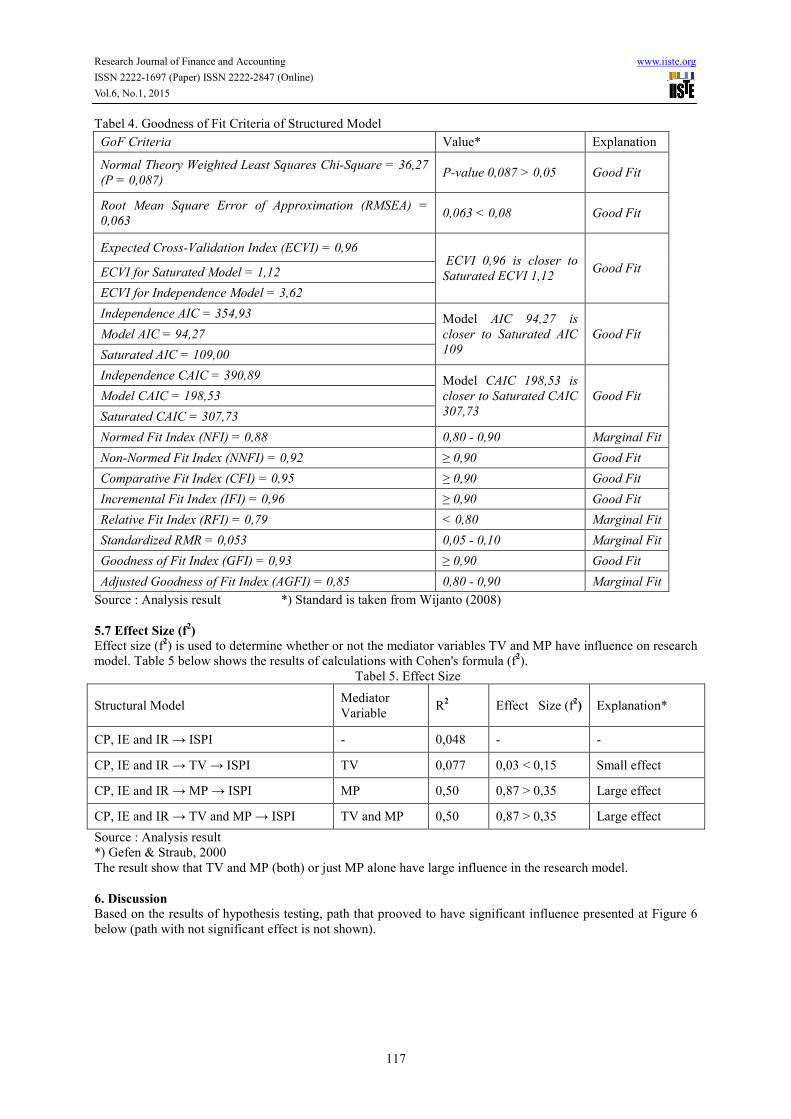
Tabel 3. Result of Hypothesis Testing
H Hypothesis Path
Coefficient t Decision Influence
H1a
There is influence of Company’s
Performance (CP) on Transaction
volume (TV)
-0,08 -0,68 Reject Ha Not Significant
H2a
There is influence of Investor’s
Expectation (IE) on Transaction
Volume (TV)
-0,10 -0,93 Reject Ha Not Significant
H3a There is influence of Investment Risk
(IR) on Transaction Volume (TV) -0,15 -1,26 Reject Ha Not Significant
H4a
There is influence of Company
Performance (CP) on Market Price
(MP)
0,27 2,48 Accept Ha Significant
H5a There is influence of Investor’s
Expectation (IE) on Market Price (MP) -0,06 -0,56 Reject Ha Not Significant
H6a There is influence of Investment Risk
(IR) on Market Price (MP) -0,10 -0,9 Reject Ha Not Significant
H7a There is influence of Transaction
Volume (TV) on ISPI -0,00 0,035 Reject Ha Not Significant
H8a There is influence of Market Price (MP)
on ISPI 0,70 9,13 Accept Ha Significant
H9a There is influence of Company
Performance (CP) on ISPI -0,05 -0,58 Reject Ha Not Significant
H10a There is influence of Investor’s
Expectation (IE) on ISPI 0,17 2,21 Accept Ha Significant
H11a There is influence of Investment Risk
(IR) on ISPI 0,17 1,97 Accept Ha Significant
Source : Analysis result
Empirically, there are 3 variables that have significant influence on ISPI (i.e. MP, IE, and IR), and 1
variable that has significant influence on MP, i.e. CP. MP is mediator variable that mediates the effect of the CP
on ISPI.
5.6 Goodness of Fit of Structural Model
The goodness of fit of structural model with its various criteria are presented at Tabel 4 below. Most of the
criteria showed that the hypothesized model meet the requirement of good fit condition (fit with the existing
empirical data).
Research Journal of Finance and Accounting www.iiste.org
ISSN 2222-1697 (Paper) ISSN 2222-2847 (Online)
Vol.6, No.1, 2015
117
Tabel 4. Goodness of Fit Criteria of Structured Model
GoF Criteria Value* Explanation
Normal Theory Weighted Least Squares Chi-Square = 36,27
(P = 0,087) P-value 0,087 > 0,05 Good Fit
Root Mean Square Error of Approximation (RMSEA) =
0,063 0,063 < 0,08 Good Fit
Expected Cross-Validation Index (ECVI) = 0,96 ECVI 0,96 is closer to
Saturated ECVI 1,12 Good Fit ECVI for Saturated Model = 1,12
ECVI for Independence Model = 3,62
Independence AIC = 354,93 Model AIC 94,27 is
closer to Saturated AIC
109
Good Fit Model AIC = 94,27
Saturated AIC = 109,00
Independence CAIC = 390,89 Model CAIC 198,53 is
closer to Saturated CAIC
307,73
Good Fit Model CAIC = 198,53
Saturated CAIC = 307,73
Normed Fit Index (NFI) = 0,88 0,80 - 0,90 Marginal Fit
Non-Normed Fit Index (NNFI) = 0,92 ≥ 0,90 Good Fit
Comparative Fit Index (CFI) = 0,95 ≥ 0,90 Good Fit
Incremental Fit Index (IFI) = 0,96 ≥ 0,90 Good Fit
Relative Fit Index (RFI) = 0,79 < 0,80 Marginal Fit
Standardized RMR = 0,053 0,05 - 0,10 Marginal Fit
Goodness of Fit Index (GFI) = 0,93 ≥ 0,90 Good Fit
Adjusted Goodness of Fit Index (AGFI) = 0,85 0,80 - 0,90 Marginal Fit
Source : Analysis result *) Standard is taken from Wijanto (2008)
5.7 Effect Size (f2)
Effect size (f2) is used to determine whether or not the mediator variables TV and MP have influence on research
model. Table 5 below shows the results of calculations with Cohen's formula (f2).
Tabel 5. Effect Size
Structural Model Mediator
Variable R
2 Effect Size (f
2) Explanation*
CP, IE and IR → ISPI - 0,048 - -
CP, IE and IR → TV → ISPI TV 0,077 0,03 < 0,15 Small effect
CP, IE and IR → MP → ISPI MP 0,50 0,87 > 0,35 Large effect
CP, IE and IR → TV and MP → ISPI TV and MP 0,50 0,87 > 0,35 Large effect
Source : Analysis result
*) Gefen & Straub, 2000
The result show that TV and MP (both) or just MP alone have large influence in the research model.
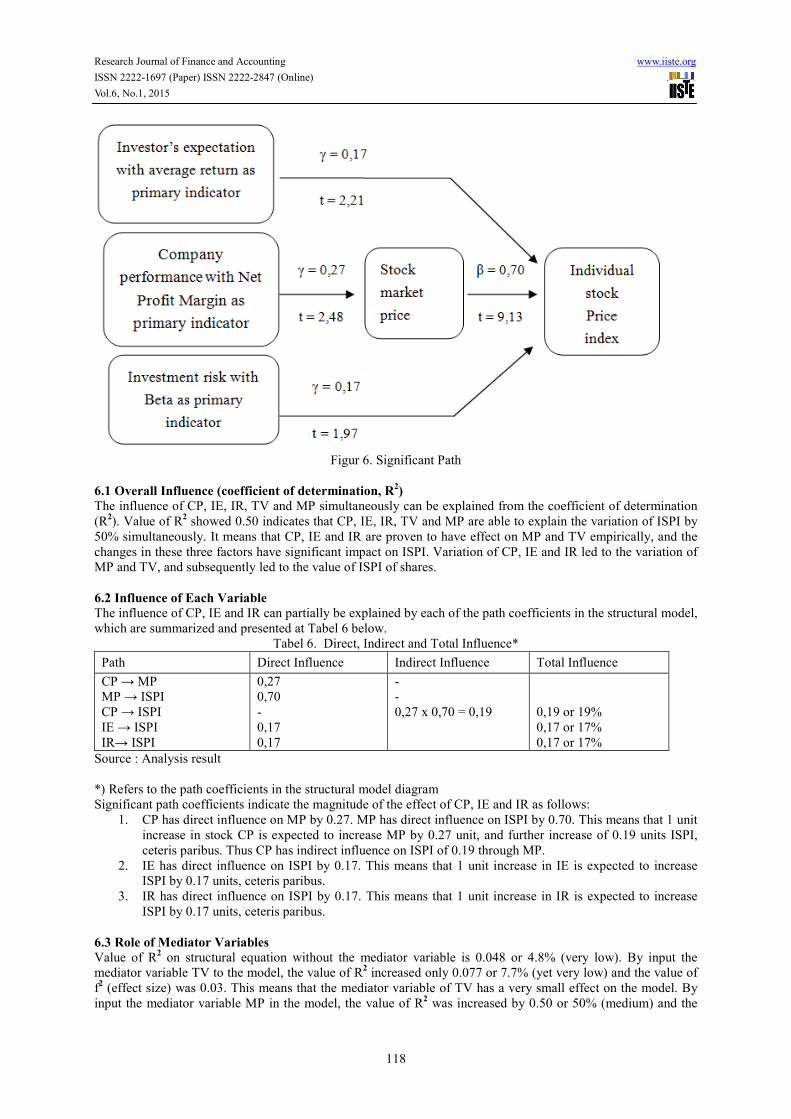
6. Discussion
Based on the results of hypothesis testing, path that prooved to have significant influence presented at Figure 6
below (path with not significant effect is not shown).
Research Journal of Finance and Accounting www.iiste.org
ISSN 2222-1697 (Paper) ISSN 2222-2847 (Online)
Vol.6, No.1, 2015
118
Figur 6. Significant Path
6.1 Overall Influence (coefficient of determination, R2)
The influence of CP, IE, IR, TV and MP simultaneously can be explained from the coefficient of determination
(R2). Value of R
2 showed 0.50 indicates that CP, IE, IR, TV and MP are able to explain the variation of ISPI by
50% simultaneously. It means that CP, IE and IR are proven to have effect on MP and TV empirically, and the
changes in these three factors have significant impact on ISPI. Variation of CP, IE and IR led to the variation of
MP and TV, and subsequently led to the value of ISPI of shares.
6.2 Influence of Each Variable
The influence of CP, IE and IR can partially be explained by each of the path coefficients in the structural model,
which are summarized and presented at Tabel 6 below.
Tabel 6. Direct, Indirect and Total Influence*
Path Direct Influence Indirect Influence Total Influence
CP → MP
MP → ISPI
CP → ISPI
IE → ISPI
IR→ ISPI
0,27
0,70
-
0,17
0,17
-
-
0,27 x 0,70 = 0,19
0,19 or 19%
0,17 or 17%
0,17 or 17%
Source : Analysis result
*) Refers to the path coefficients in the structural model diagram
Significant path coefficients indicate the magnitude of the effect of CP, IE and IR as follows:
1. CP has direct influence on MP by 0.27. MP has direct influence on ISPI by 0.70. This means that 1 unit
increase in stock CP is expected to increase MP by 0.27 unit, and further increase of 0.19 units ISPI,
ceteris paribus. Thus CP has indirect influence on ISPI of 0.19 through MP.
2. IE has direct influence on ISPI by 0.17. This means that 1 unit increase in IE is expected to increase
ISPI by 0.17 units, ceteris paribus.
3. IR has direct influence on ISPI by 0.17. This means that 1 unit increase in IR is expected to increase
ISPI by 0.17 units, ceteris paribus.
6.3 Role of Mediator Variables
Value of R2 on structural equation without the mediator variable is 0.048 or 4.8% (very low). By input the
mediator variable TV to the model, the value of R2 increased only 0.077 or 7.7% (yet very low) and the value of
f2 (effect size) was 0.03. This means that the mediator variable of TV has a very small effect on the model. By
input the mediator variable MP in the model, the value of R2 was increased by 0.50 or 50% (medium) and the
Research Journal of Finance and Accounting www.iiste.org
ISSN 2222-1697 (Paper) ISSN 2222-2847 (Online)
Vol.6, No.1, 2015
119
value of f2 was 0.87 (large). It means that the mediator variable MP has a significant influence on the model. By
input both the mediator variables (MP and TV) in the model, the value of R2 was also increased by 0.50 or 50%,
and the value of f2 was 0.87. It means that the TV and MP have an influence simultaneously to the model as well
as MP only. In other words, MP is the only mediator variable that has dominant effect.
7. Conclussion and Suggestion
7.1 Conclusions
From the analysis and discussion has been described in previous chapters can be delivered the following
conclusions:
1. Investor’s expectation and investment risk have direct influence on ISPI, while company performance
has indirect influence on ISPI through market prices.
2. Stock transaction volume and market prices have role in simultaneously as mediator, but only market
price have dominant role as a mediator partially.
3. Three out of 9 indicators of corporate performance are quite good: ROA, ROE, and NPM, with ROE as
the most reliable indicator (most of its ability to reflect the company performance).
Two out of 7 indicators of investor’s expectations are quite good: PT and AR, with AR as the most
reliable indicator.
Two out of 3 indicators of investment risk are quite good: SD and Beta, with Beta or systematic risk as
the most reliable indicator.
7.2 Suggestions for Academic Interests For those who are interested in the development of knowledge as an attempt to develop a theory of investment,
particularly investment in shares, need to pay attention to the following matters:
a. Investment risk factors as factors that affect the stock market price and transaction volume in addition
to the fundamental factors (corporate performance) and technical factors (investor’s expectations).
b. Company performance, investor’s expectations and investment risk affect the individual stock price
index, not only individually but also together.
c. Not all of indicators are able to represent in measuring company performance, investor’s expectation
and investment risk. The primary indicators that need to be concerned are ROE, AR and Beta.
7.3 Suggestions for Further Research
For those who are interested in doing research on stocks, kindly to develop further research on this study, for
example in the following way:
- Add or change variables, indicators, or stock sample.
- Using different research methodologies.
- Examine and compare the effect of the company performance, investor’s expectations and investment risks on
the stock price index for each industry (Industrial stock price index, the combined companies in the same
industry).
7.4 Suggestions for Practice
The implications of the results of this study can be stated as follows:
1. The results of this study indicate that ISPI influenced by fundamental factors (company performance),
technical factors (investor’s expectations) and investment risks of stock. This fact needs to be
considered in practice of predictive analysis on ISPI or stock return (Note: increase in ISPI is a source
of stock return).
2. The results showed that ISPI is influenced by three factors simultaneously. Investors, analysts and
issuers can predict the rise of ISPI or stock return based on the value of three factors simultaneously.
3. Theoretically Company performance is measured by 9 indicators, investors' expectations is measured by
7 indicators, and stock investment risk is measured by 3 indicators (SD, CV and Beta). The results of
this study indicate that good indicators for measuring the company's performance are ROA, ROE, and
NPM (especially NPM), good indicators to measure investors' expectations are PT and AR (especially
AR), good indicators to measure the investment risk is SD of stock return and Beta coefficient
(especially Beta). Therefore investors, analysts and issuers need to consider NPM, AR and Beta
References
Abarbanell, J.S. and Bushee, B.J. (Spring 1997). Fundamental Analysis, Future Earnings, and Stock Prices.
Journal of Accounting Research, 35(1), 1-23.
Bagozzi, R.P. & Yi Yi (1988). On the Evaluation of Structural Equation Modeling. Journal of Academy of
Marketing Science, 16 (Spring), 17-94.

Research Journal of Finance and Accounting www.iiste.org
ISSN 2222-1697 (Paper) ISSN 2222-2847 (Online)
Vol.6, No.1, 2015
120
Bamber, L.S. and Y.S. Cheon (July 1995). Differential Price and Volume Reactions to Accounting Earnings
Announcements. The Accounting Review, 70(3), 417-441.
Bauman, M.P. (1996). A Review of Fundamental Analysis Research in Accounting. Journal of Accounting
Literature, 15, 1-33.
Bhandari, L.C. (June 1998). D/E Ratio and Expected CS Return : Empirical Evidence. Journal of Finance, 63,
12-22.
Bloomfield, R. and Hales, J. (2002). Predicting the Next Step of a Random Walk : Experimental Evidence of
Regime-Shifting Beliefs. Journal of Financial Economics, 65, 397-414.
Bodie, Kane and Marcus (2008). Investment. (7th ed.). New York: McGraw Hill.
Brown, L.D. and Han, J.C.V. (Spring 2000). Do Stock Price Fully Reflect the Implications of Current Earnings
for Future Earnings for ARI Firms?. Journal of Accounting Research, 38(1), 149-163.
Brown and Warner (1985), Analisis Perbandingan Trading Volume. [Online] Available: eprints.undip.ac.id.,
(November 10th
, 2013).
Chan, W.S. (2003). Stock Price Reaction to News and No-news : Drift and Reversal After Headlines. Journal of
Financial Economics, 70, 223-260.
Cheung, D.K.C. and Sami, H. (2000). Price and Trading Volume Reaction : The Case of Hong Kong
Companies’ Earning Announcements. Journal of International Accounting, Auditing and Taxation, 9(10) 19-42.
Chordia, T., Roll, R. and Subrahmanyam, A. (2002). Order Imbalance, Liquidity, and Market Returns. Journal
of Financial Economics, 65, 111-130.
Corrado, C.J. and Jordan, B.D. (2002). Fundamentals of Investment Analysis. (5th ed.). Singapore: McGraw-Hill.
Daito, Apollo (2011). Pencarian Ilmu Melalui Pendekatan Ontologi, Epistemologi, Aksiologi. Jakarta: Mitra
Wacana Media.
David, S.K dan Kurniawan, I. (2010). Manajemen Investasi - Pendekatan Teknikal dan Fundamental Untuk
Analisis Saham. Yogyakarta: Graha Ilmu.
Gefen and Straub (2000). Structural Equation Modelling and Regression : Guidelines for Research Practice,
Communications of AIS, 4, Article 7.
Gupta, M.C. and Heufner, R.J. (1972). A Cluster Analysis Study of Financial Ratios and Industry Characteristics.
Journal of Accounting Research,10(1), 77-95
Hair, Anderson, Tatham and Black (1998). Multivariate Data Analysis. (7th ed.). New Jersey: Prentice-Hall.
Halim, Abdul dan N. Hidayat (2000). Volume Perdagangan Saham. [Online] Available: Ekonomi.kabo.biz.
(November 10th
, 2013)
Hamzah, A., Desember (2006). Analisis Kinerja Saham Perbankan Sebelum dan Sesudah Reverse Stock Split di
BEJ. Jurnal Manajemen dan Bisnis Sriwijaya, Vol. 4 No. 8, 14-68.
Haugen, R.A. and Baker, N.L. (1996). Commonality in the Determinants of Expected Stock Returns. Journal of
Financial Economics, 41, 401-439.
Healy, P.M. and Palepu, K.G.. (Spring 1990). Earnings and Risk Changes Surrounding Primary Stock Offers.
Journal of Accounting Research, 28 (1), 25-39.
Hox and Bechger (1998). An Introduction to SEM. Family Science Review, 11, 354-373.
Husnan, Suad (Februari 2001). Corporate Governance dan Keputusan Pendanaan - Perbandingan Kinerja
Perusahaan dengan Pemegang Saham Pengendali Perusahaan Multinasional dan Bukan Multinasional. Jurnal
Riset Akuntansi, Manajemen, Ekonomi, 1(1), 1 – 11.
Husnan, Suad dan Enny Pudjiastuti (2004). Dasar-dasar Manajemen Keuangan – Seri Penutup Pembelanjaan.
Yogyakarta: UPP AMP YKPN.
Husnan, Suad (2005). Dasar-dasar Teori Portofolio dan Analisis Sekuritas. Yogyakarta: UPP AMP YKPN.
Itan, I. and Syakhroza, A. (2002). The Influence of Financial Performance to the Price of LQ45 Stocks at JSE.
Simposium Nasional Akuntansi VI Surabaya, 163-170.
Jones, C.P., Shamsuddin, A. and Nauman, K. (2006). Investment Analysis and Management. (2nd ed.). Australia:
John Willey & Sons, Inc.
Jorg Henseler et al (2009) The Use Of Partial Least Squares Path Modeling In International Marketing, New
Challenges to International Marketing. Advances International Marketing, 20, 277–319, Copyright r 2009 by
Emerald Group Publishing Limited.
Keown, Martin, Petty, Scott Jr., and David, F. (2005). Financial Management Principles and Applications, (11th
ed.). New Jersey: Prentice-Hall.
Kim, O. and Verrechia, R.E. (Autumn 1991). Trading Volume and Price Reactions to Public Announcements.
Journal of Accounting Research, 29(2), 302-316.
Klein, P. (2001). The Capital Gain Lock-in Effect and Long-Horizon Return Reversal. Journal of Financial
Economics, 59, 33-62.
Kline, R.B. (2011). Principles and Practices of Structural Equation Modeling. (3rd ed.). New York: The
Guildford Press.

Research Journal of Finance and Accounting www.iiste.org
ISSN 2222-1697 (Paper) ISSN 2222-2847 (Online)
Vol.6, No.1, 2015
121
Levin, R.I. and Rubin, D.S. (2008). Statistics for Management. (7th ed.). New Jersey: Prentice-Hall International,
Inc.
Levy, R.A. (1996). Conceptual Foundation of Technical Analysis. Financial Analyst Journal, 22(4), 83-89.
Lewellen, J. (1999). The Time-Series Relations Among Expected Returns, Risk, and Book-to-Market. Journal of
Financial Economics, 54, 5-53.
Lui, D., Markov, S. and Tamayo, A. (March 2007). What Makes a Stock Risky? Evidence from Sell-Side
Analysts’ Risk Rating. Journal of Accounting Research, 45(1), 650-660.
MacKinlay, A.C. (1995), Multifactor Models Do Not Explain Deviations from the CAPM, Journal of Financial
Economics, No. 38, 3-28.
Magdalena (2004), Volume Perdagangan Saham. [Online] Available: Ekonomi.kabo.biz. (November 10th
, 2013)
Natarsyah, S. (2002). Analisis Pengaruh Beberapa Faktor Fundamental dan Risiko Sistematik Terhadap Harga
Saham – Bunga Rampai Kajian Teori Keuangan. Yogyakarta: BPFE.
Olibe, K.O. (2002), The Information Content of Annual General Meeting : A Price and Trading Volume
Analysis, Journal of International Accounting, Auditing and Taxation, 11, 19-37.
Palepu, Healy and Bernard (2006). Business Analysis and Valuation. (3rd ed.). London: Thomson Learning.
Prihadi (2008). Analisis Laporan Keuangan [Online] Available: fadhilanalisis.blogspot.com. (November 10th
,
2013)
Reilly, F.H. and Brown, K.C. (2011). Investment Analysis and Portfolio Management. (10th ed.), Florida: The
Dryden Press.
Ross, A.S., Westerfield, P.W. and Jordan, B.D. (2008). Corporate Finance Fundamentals. (6th ed.). New York:
McGraw-Hill.
Sekaran, U. (2010). Research Methods for Business. New York: John Willey & Sons Inc.
Sevilla, Consuelo G. et. al. (2007). Research Methods. Quezon City: Rex Printing Co.
Sharpe, W. (2000). Investment. (3rd ed.). New Jersey: Prentice Hall.
Shin, H.S. (May 2006). Disclosure Risk and Price Drift. Journal of Accounting Research, 44(2), 359-373.
Sudarto, Khrisnoe and Tohir (1999). Analisis Return Saham dan Faktor-faktor yang Mempengaruhinya. JERA,
1(1), 43-51.
Sunariyah (2003). Pengantar Pengetahuan Pasar Modal. (3rd ed.). Yogyakarta: UUP AMP YKPN.
Susanto, D. dan Agus Sabardi (2010). Analisis Teknikal di Bursa Efek. Yogyakarta: UPP STIM YKPN.
Tabachnick and Fidell (2005). Using Multivariate Statistics. (5th ed.). New Jersey: Pearson Education, Inc.
Tandelillin, E. (2010). Analisis Investasi dan Manajemen Portofolio. Yogyakarta: BPFE.
Teets, W. (Autumn 1992). The Association Between Stock Market Responses to Earnings Announcements and
Regulation of Electric Utilities. Journal of Accounting Research, 30(2), 270-284
Umar, Husein (2010). Desain Penelitian Manajemen Strategik. (1st ed.). Jakarta: Raja Grafindo Persada.
Van Horne, J.C. and Wachowicz, Jr., J.M. (2001). Fundamental of Financial Management. (11th ed.). New
Jersey: Prentice-Hall International.
Weston, J.F., Besley and Brigham (2006). Essentials of Managerial Finance. (11th ed.). Oak Brook: The Dryden
Press.
Wijanto, S.H. (2008). Structural Equation Modeling dengan Lisrel 8.8 - Konsep dan Tutorial, Yogyakarta:
Graha Ilmu.
Yuwono, Sukarno and Ichsan (2003). Analisis Laporan Keuangan. [Online] Available:
fadhilanalisis.blogspot.com. (November 10th
, 2013).
Zulbahnidar and Jontus (2002). Pengaruh Risiko dan Leverage Keuangan Riau-Pekanbaru Terhadap Tingkat
Keuntungan Dalam Sektor Properti dan Real Estat di BEJ, Jurnal Penelitian Riset Akuntansi IX.
Indek HargaSaham. [Online] Available: http://fayku.files.wordpress.com. (November 10th
, 2013)
.Index Harga Saham. [Online] Available: http://www.idx.co.id. (Januari 5th
, 2013)
Author: Muhammad Anhar born at Klaten (Indonesia), September 19th
, 1959. Education : Doctor (S3) in
Business Management, University of Pancasila, Jakarta, Indonesia, 2014.

The IISTE is a pioneer in the Open-Access hosting service and academic event management.
The aim of the firm is Accelerating Global Knowledge Sharing.
More information about the firm can be found on the homepage:
http://www.iiste.org
CALL FOR JOURNAL PAPERS
There are more than 30 peer-reviewed academic journals hosted under the hosting platform.
Prospective authors of journals can find the submission instruction on the following
page: http://www.iiste.org/journals/ All the journals articles are available online to the
readers all over the world without financial, legal, or technical barriers other than those
inseparable from gaining access to the internet itself. Paper version of the journals is also
available upon request of readers and authors.
MORE RESOURCES
Book publication information: http://www.iiste.org/book/
Academic conference: http://www.iiste.org/conference/upcoming-conferences-call-for-paper/
IISTE Knowledge Sharing Partners
EBSCO, Index Copernicus, Ulrich's Periodicals Directory, JournalTOCS, PKP Open
Archives Harvester, Bielefeld Academic Search Engine, Elektronische Zeitschriftenbibliothek
EZB, Open J-Gate, OCLC WorldCat, Universe Digtial Library , NewJour, Google Scholar