the diet of sau ropod dinosau rs – implications from
TRANSCRIPT

See discussions, stats, and author profiles for this publication at: https://www.researchgate.net/publication/252628376
The diet of sauropod dinosaurs – Implications from carbon isotope analysis of
teeth, bones, and plants
Chapter · April 2011
CITATIONS
36READS
1,870
1 author:
Some of the authors of this publication are also working on these related projects:
PALÄODIÄT View project
Symposium "Experimental Approaches in Palaeontology: New Data from Old Fossils” View project
Thomas Tütken
Johannes Gutenberg-Universität Mainz
96 PUBLICATIONS 2,697 CITATIONS
SEE PROFILE
All content following this page was uploaded by Thomas Tütken on 17 May 2014.
The user has requested enhancement of the downloaded file.

BIOLOGY OF THE
SAUROPODDINOSAURS
Understanding theLife of Giants
E D I T E D B Y
NICOLE KLE IN
KR IST IAN REMES
CAROLE T. GEE
P. MART IN SANDER
Indiana University Press Bloomington and Indianapolis

This book is a publication of
Indiana University Press
601 North Morton Street
Bloomington, IN 47404-3797 USA
iupress.indiana.edu
Telephone orders 800-842-6796
Fax orders 812-855-7931
Orders by e-mail [email protected]
∫ 2011 by Indiana University Press
All rights reserved
No part of this book may be reproduced or utilized in any
form or by any means, electronic or mechanical, including
photocopying and recording, or by any information storage
and retrieval system, without permission in writing from
the publisher. The Association of American University
Presses’ Resolution on Permissions constitutes the only
exception to this prohibition.
! The paper used in this publication meets the minimum
requirements of the American National Standard for
Information Sciences—Permanence of Paper for Printed
Library Materials, ANSI Z39.48-1992.
Manufactured in the United States of America
Library of Congress Cataloging-in-Publication Data
Biology of the sauropod dinosaurs : understanding the life of
giants / edited by Nicole Klein ... [et al.].
p.cm. — (Life of the past)
Includes bibliographical references and index.
ISBN 978-0-253-35508-9 (cloth : alk. paper) 1. Saurischia.
I. Klein, Nicole, [date]
QE862.S3B56 2011
567.913—dc22
2010046735
1 2 3 4 5 16 15 14 13 12 11

57
4
The Diet of Sauropod Dinosaurs: Implications of Carbon IsotopeAnalysis on Teeth, Bones, and Plants
THOMAS TÜTKEN
sauropods were megaherbivores that fed predomi-
nantly on nonangiosperm vegetation such as gymno-
sperms, sphenophytes, and pteridophytes. In this chap-
ter, the potential of carbon isotope (d13C) analysis in skele-
tal apatite for inferring the diet and niche partitioning of
sauropods was tested. The carbon isotope composition of
food plants is transferred with a metabolic offset to higher
trophic levels along the food chain, which suggests that
differences in isotopic composition of sauropod food
plants can be used to infer sauropod feeding behavior. For
this purpose, the d13C values of sauropod bones and teeth,
primarily from the Late Jurassic Morrison Formation,
USA, and the Tendaguru Beds, Tanzania, East Africa, were
analyzed, as were the leaves of extant and fossil potential
sauropod food plants such as Araucaria, cycads, ferns,
horsetails, and ginkgo. The metabolic carbon isotope frac-
tionation between diet and enamel apatite estimated for
sauropods is 16‰. By means of this fractionation, a diet
based only on terrestrial C3 plants can be reconstructed for
sauropods. Therefore, sauropods did not ingest significant
amounts of plants with high, C4 plant-like d13C values
such as marine algae or C4 plants. However, plants that
used crassulacean acid metabolism for biosynthesis and
possibly freshwater aquatic plants may have contributed
to the diet of sauropods. A more detailed discrimination of
exactly which type of food plants was consumed by sau-
ropods based on apatite d13C values alone is difficult
because taxon-specific differences between C3 plants are
small and not well constrained. Mean enamel d13C val-
ues of sympatric sauropods differ by approximately 3‰,
which may indicate a certain niche partitioning. Differ-
ences in mean d13C values for the living representatives
of potential sauropod food plants suggest that a differ-
entiation between low-browsing taxa feeding on ferns
or horsetails with lower d13C values and high-browsing
taxa feeding on conifers with higher d13C values might
be possible.
Sauropod Feeding Behavior:
What Do We Know?
Sauropod dinosaurs are one of the most successful groups
of dinosaurs in terms of taxon longevity (Late Triassic to Late
Cretaceous), taxonomic diversity, and geographic distribu-
tion (Dodson 1990; Wilson 2002; Rees et al. 2004; Upchurch
et al. 2004; Barrett & Upchurch 2005; Sander et al. 2010a).
They reached their highest abundance and diversity during
the Jurassic, and as megaherbivores, they had an important
influence on terrestrial ecosystems (Upchurch & Barrett
2000). Sauropods lived in a gymnosperm- and pteridophyte-
dominated environment with a variety of conifers, as well as
some ginkgoes, cycads, ferns, seed ferns, and horsetails (Plate
4.1) that potentially constituted the major sauropod food
plants (Coe et al. 1987; Tiffney 1997; Rees et al. 2004; Hummel

58 tütken
et al. 2008; Gee, this volume). In contrast, during the Late
Cretaceous, sauropods lived in angiosperm-rich environ-
ments and probably also fed on angiosperm plants (Bakker
1978; Barrett & Willis 2001; Mohabey & Samant 2003) or even
occasionally on grass (Prasad et al. 2005) or algae (Ghosh et al.
2003; Mohabey & Samant 2003).
As a result of their simple dentition, most sauropods had lim-
ited masticatory abilities for oral food processing (Sander et al.
2010a, 2010b; Hummel & Clauss, this volume). Therefore, sau-
ropods (especially Diplodocus) were initially interpreted as hav-
ing fed on soft aquatic plants or even invertebrates such as
clams (Holland 1924; Haas 1963). Differences in dental mor-
phology and wear, as well as reconstructed feeding envelopes
and inferred browsing heights, suggest a certain degree of
specialization and niche partitioning for sauropods and use of
food resources at different heights above ground level (Bakker
1978; Stevens & Parrish 1999, 2005a, 2005b; Christian &
Dzemski, this volume). Especially the long necks of sauropods
could be a fundamental adaptation for increasing the vertical
and horizontal feeding envelope (Bakker 1971, 1978; Stevens
& Parrish 1999, 2005a, 2005b; Sander et al. 2009). Those taxa
with a full battery of spatulate teeth presumably used some oral
processing and likely were specialized for tougher forage, and
those with a reduced battery of peg-like teeth may have fed pre-
dominantly on softer plants or possibly used their teeth to strip
branches. Even an ontogenetic switching of diets has been pos-
tulated for certain taxa (e.g., Fiorillo 1991). However, it is diffi-
cult to constrain exactly which plants the different sauropod
taxa used as food resources. Because sauropods were large
megaherbivores, a more generalized feeding strategy is also
likely, as known in living megaherbivores (Owen-Smith 1988).
Often several (up to five) different sauropod taxa co-occur at
one site (Dodson 1990), which also supports the idea of a
certain niche partitioning. The lack of well preserved definite
sauropod gastrointestinal products such as coprolites makes it
difficult to determine which plants and parts thereof formed
the diet of individual sauropod taxa (see recent critical review
by Sander et al. 2010b). The sole exceptions may be some Late
Cretaceous putative sauropod coprolites from India with pre-
served silicified plant remains and phytoliths, indicating that
a variety of different plants, including grasses, were ingested
indiscriminately by titanosaurs (Mohabey & Samant 2003;
Mohabey 2005; Prasad et al. 2005), if indeed these structures
were coprolites and can be assigned to the titanosaurs (Sander
et al. 2010b). Therefore, the reconstruction of sauropod diets
and feeding behavior remains rather speculative.
A chemical proxy to infer diet, feeding behavior, and parti-
tioning of food resources of extant and extinct vertebrates is
the carbon isotope composition of bones and teeth (Cerling et
al. 1997; Koch 1998, 2007; Kohn & Cerling 2002). Most studies
have investigated the diet of mammals using carbon isotopes,
but only a few have looked at the carbon isotopes of dinosaur
skeletal remains (Bocherens et al. 1993; Ostrom et al. 1993;
Stanton Thomas & Carlson 2004; Tütken et al. 2004, 2007;
Fricke & Pearson 2008; Fricke et al. 2008, 2009), coprolites
(Ghosh et al. 2003), or eggshells (Folinsbee et al. 1970; Erben et
al. 1979; Sarkar et al. 1991; Cojan et al. 2003; Mohabey 2005) to
infer their diet and feeding behavior. One major problem with
analyzing the isotope composition of dinosaur remains is the
diagenetic alteration of the ancient skeletal tissues. A recent
detailed study of Fricke et al. (2008) showed that ecological
information on diet and environment can indeed be pre-
served, at least in the enamel of dinosaur teeth. The preserva-
tion of original isotope compositions is, however, less likely for
dinosaur bone (Kolodny et al. 1996; Trueman et al. 2003). In
this study, carbon isotope analysis of sauropod bones and teeth
as well as of their potential food plants will be used to explore
sauropod feeding behavior and niche partitioning.
Carbon Isotopes in Plants
and Dinosaur Fossils
CARBON ISOTOPES
Carbon is the most important building block of organic mat-
ter and life, and it is thus the major element in all living organ-
isms. It can be either bound in soft tissues (e.g., muscles, skin,
hair) or in biogenic hard parts (e.g., shell, eggshells, vertebrate
skeletal tissues made of biogenic apatite such as bones and
teeth). The element carbon consists of three different isotopes:
two stable isotopes, 12C and 13C, and one radioactive isotope,14C, which disintegrates over time, with a constant half-life of
5,730 years and which is used for 14C radiocarbon dating. The
light carbon isotope 12C is by far the most abundant (98.89%),
followed by the heavy isotope 13C (1.11%), and negligible
amounts of the radioactive isotope 14C (Hoefs 2008). The
three isotopes, and the molecules containing them, react
chemically in the same way but at different rates because their
atoms have different atomic masses. Thus, different chemical
and metabolic processes change the ratios of the isotopes in
characteristic ways. Carbon isotope composition is expressed
by the ratio of the heavy to light isotope (13C/12C). The carbon
isotope composition of any substance is reported as a d13C
value in the conventional d notation in per mil (‰), relative
to the known isotope reference standard V-PDB (Vienna Pee
Dee Belemnite) (Coplen 1994). The d value is defined accord-
ing to equation (1), where Rsample and Rstandard are the 13C/12C
ratios in the sample and the standard, respectively.
d13C (‰) = [(Rsample/Rstandard) – 1] — 1,000. (1)
By definition, the V-PDB standard itself has a d value of 0‰.
Samples enriched in the heavy isotope 13C relative to the stan-
dard have positive d13C values, and those that are depleted in
the heavy isotope 13C have negative d13C values.
Diet of Sauropod Dinosaurs 59
Carbon isotope composition can change significantly dur-
ing the formation processes of inorganic and especially or-
ganic matter. Most organisms preferentially incorporate the
light carbon isotope 12C so that biogenic tissues are normally
enriched in the light isotope relative to inorganic substances.
The discrimination of isotopes against each other during for-
mation processes is called fractionation. The fractionation of
carbon isotopes during chemical and biological reactions and
processes is responsible for the different isotope compositions
of carbon-containing materials, which are in our case plant
and animal tissues. The carbon isotope composition can be
measured and allows inferences on the processes involved in
tissue formation. The d13C value is usually measured in CO2
gas generated by the phosphoric acid dissolution of carbon-
aceous or carbonate-containing minerals (in our case, the
carbonate-containing skeletal bioapatite, Fig. 4.1), or in CO2
gas liberated by thermal combustion for organic matter. The
CO2 gas is analyzed with a gas mass spectrometer with an
analytical precision better than †0.1‰.
CARBON ISOTOPES IN PLANTS
Plant groups show significant differences in d13C values as a
result of different photosynthetic pathways. Additionally, en-
vironmental and climatic conditions during biosynthesis can
greatly influence plant d13C values. These isotopic differences
enable us to reconstruct the diet of herbivorous animals be-
cause they fractionate carbon isotopes taken up from the
plants in a predictable way (DeNiro & Epstein 1978, 1981;
Cerling & Harris 1999; Passey et al. 2005; Clementz et al. 2007).
The primary production of plants forms the basis of the
food chain on land and in the ocean. Plants consist of biomass
produced by the photosynthetic assimilation of atmospheric
CO2. During photosynthesis, plants strongly fractionate the
carbon isotopes of this atmospheric CO2 (Park & Epstein 1960;
Farquhar et al. 1989). Therefore, plants are depleted in 13C
relative to atmospheric CO2. The plant d13C values are mainly
determined by the following: (1) the type of photosynthetic
pathway, (2) the d13C value of atmospheric CO2 (O’Leary
1988; Farquhar et al. 1989; Arens et al. 2000), and (3) local
environmental factors (e.g., water stress, light, nutrients, tem-
perature) (Heaton 1999). The three different photosynthetic
pathways used by plants are referred to as C3 pathway, C4
pathway, and crassulacean acid metabolism (CAM).
Terrestrial Plants
During photosynthesis, most plants use the Calvin cycle,
which utilizes the enzyme ribulose bisphosphate carboxy-
lase–oxygenase (RuBisCo) to fix atmospheric CO2, forming a
three-carbon sugar, hence the term C3. The majority of extant
angiosperms, gymnosperms, pteridophytes, and spheno-
phytes, use the C3 photosynthetic pathway. C3 plants include
trees, shrubs, cool-growing-season, high-altitude, and high-
latitude grasses, and many aquatic plants. C3 plants represent
about 85% of the world’s terrestrial plant biomass today. C4
plants use the Hatch-Slack cycle during photosynthesis and a
different enzyme to fix atmospheric CO2, the phos-
phoenolpyruvate carboxylase, resulting in a four-carbon acid
(as an intermediate product of photosynthesis), and hence the
term C4. Three fourths of all C4 plants are tropical and temper-
ate grasses and sedges growing in warm, dry habitats. C4
plants are characterized by a special leaf anatomy known as
Kranz anatomy that is documented in grass fossils as old as the
late Miocene (Thomasson et al. 1986). C4 plants account for
10% of terrestrial plant biomass. However, the C4 photo-
synthetic pathway is restricted to angiosperms. Because this
pathway presumably evolved in the mid Tertiary (20–30 mil-
lion years ago) (Keeley & Rundel 2003), C4 plants were not a
component of Mesozoic floras (e.g., Bocherens et al. 1993) and
accordingly were not available as food plants to dinosaurs.
The third photosynthetic pathway, CAM, is common in
desert succulents (Cactaceae), tropical epiphytes, the fern
families Polypodiaceae and Vittariaceae, and aquatic plants
such as Isoetes (Keeley & Rundel 2003), but represents only 5%
of terrestrial plant biomass (Ehleringer et al. 1991). CAM is an
ancient photosynthetic pathway that likely has been present
ever since the Paleozoic in plants from shallow-water pa-
lustrine habitats, and it is thought that CAM evolved con-
vergently many times (Keeley & Rundel 2003). In terrestrial
settings, CAM plants often grow in climatically stressful con-
ditions (e.g., arid settings) too inhospitable for C3 plants. On
the basis of carbon isotope data of soil organic matter, it has
been suggested that CAM plants may have existed in water-
stressed environments in the Mesozoic (Decker & de Wit
2006).
Carbon Isotopes in Terrestrial C3 and C4 Plants
Because C3 plants discriminate more against the heavy 13C
isotope during photosynthesis than C4 plants, both plant
groups have different carbon isotopic compositions (Farquhar
et al. 1989). The average d13C value of extant C3 plants is
–27‰ (ranging from –36 to –20‰), while C4 plants have an
average d13C value of –13‰ (ranging from –17 to –9‰)
(Deines 1980; O’Leary 1988) (Fig. 4.1). CAM plants exhibit a
wide range of d13C values (–30 to –11‰) that can overlap
with that of C3 and C4 plants (Bender 1971; Deines 1980; Far-
quhar et al. 1989; Fig. 4.1). d13C values for C3 plants were
mainly determined in angiosperms; however, gymnosperms,
pteridophytes, and sphenophytes show similar values (see Fig.
4.4; Smith & Epstein 1971; Tütken et al. 2007). The distinctly
different d13C values of C3 and C4 plants (mostly C4 grasses) are
often used in paleoecological and paleodietary studies to dis-
tinguish browsers from grazers in ecosystems where both types
of plants were present (e.g., Cerling et al. 1997; MacFadden et

60 tütken
al. 1999). The occurrence of a C4 component in the diet of
herbivorous mammals is interpreted as the intake of C4 grass
and thus as feeding in open grasslands. However, C4 grasses
became only globally widespread since the late Miocene (ap-
proximately 7 million years ago) (Cerling et al. 1993, 1997).
Recently, grass phytoliths have been found in putative
sauropod coprolites from the Late Cretaceous of India, indi-
cating the presence of some C3 grasses by the end of the Meso-
zoic (Prasad et al. 2005). It has been suggested that CAM
plants may have served as food for some dinosaurs (Bocherens
et al. 1993; Stanton Thomas & Carlson 2004; Fricke et al.
2008), but this is questionable, given the extremely few non-
angiosperm plants that use CAM today.
As noted above, C3 plants can vary significantly in their d13C
values because of environmental factors such as light, humid-
ity, and the canopy effect (e.g., O’Leary 1988; Tieszen 1991;
Heaton 1999; Arens et al. 2000). Therefore, plants that use the
same photosynthetic pathway, or even plants from the same
species that grow in different environments (xeric, mesic,
aquatic, or canopy), may show a few per mil difference in d13C
values (Ehleringer et al. 1986; Tieszen 1991; Fig. 4.1). The in-
traspecific variability of d13C values caused by environmental
factors at a single locality is mostly less than 2–3‰ for liv-
ing and fossil C3 plants (O’Leary 1988; Bocherens et al. 1993;
Nguyen Tu et al. 1999). d13C values of terrestrial plants vary
seasonally and spatially with fluctuations in soil moisture and
water use efficiency (Farquhar et al. 1989) as well as with the
growth cycle, because some metabolic products are enriched
in 13C (e.g., sugars) or depleted in 13C (e.g., lignin) (Park &
Epstein 1960; Deines 1980; DeNiro & Hastorf 1985; Schleser et
al. 1999). This is also the reason why different plant organs
(e.g., leaves, fruits, seeds, wood) may have different d13C
values (e.g., Tieszen 1991).
Another important local effect on plant d13C values is the
canopy effect. In densely forested ecosystems, plants growing
under a closed canopy with low irradiance and using 13C-
depleted CO2 from biomass degradation near the forest floor
for photosynthesis have d13C values as low as –36 to –32‰
(van der Merwe & Medina 1991). In such forest ecosystems,
there are gradients of plant d13C values from the canopy to-
ward the ground level. If such gradients are seen in herbivore
communities in such habitats, they suggest that feeding oc-
curs on different levels and on different food plants (Cerling et
al. 2004).
Aquatic Plants
Aquatic plants in freshwater or marine ecosystems assimi-
late most of their carbon from the surrounding waters and
have a broad range of d13C values from –30 to –8‰ (Fig. 4.1).
Most fully marine plants (including sea grasses) use the C3
photosynthetic pathway. However, the d13C values of marine
C3 plants are more enriched than those of terrestrial C3 plants
because the carbon in the oceans may be derived from bi-
carbonate (HCO3–), which is enriched in 13C relative to atmo-
spheric CO2, as well as from dissolved atmospheric CO2 (Bout-
ton 1991; Keeley & Sandquist 1992; Hemminga & Mateo
1996). Most marine phytoplankton has d13C values similar to
those of C3 plants, whereas some intertidal kelps and seaweeds
tend to resemble C4 plants (Sackett et al. 1965; Clementz et al.
2006 and references therein). Aquatic plants have distinct
mean d13C values of approximately –11‰ for sea grasses, ap-
proximately –18.5‰ for marine algae, and approximately
–27‰ for freshwater plants (Clementz et al. 2007 and refer-
ences therein). The d13C values of coastal aquatic plants are
variable because of the multiple sources from which plants
draw and fractionate carbon (Boutton 1991; Keeley & Sandqu-
ist 1992). Salt marsh C4 plants have a mean d13C value of
–14.9‰ (ranging from –17.7 to –12.8‰), while C3 halo-
phytes have similar d13C values as terrestrial C3 plants. How-
ever, they vary (up to 10‰) with substrate salinity (Cloern et
al. 2002). On average, marine C3 plants and algae have higher
d13C values than terrestrial C3 plants, and animals feeding on
marine food resources therefore have values about 7‰ higher
than those feeding on terrestrial and/or freshwater plants
(Chrisholm et al. 1982; Clementz et al. 2006, 2007). Thus, on
the basis of carbon isotopes, herbivores that feed on marine
and terrestrial food resources can be differentiated from one
another.
In freshwater systems, as well as in the oceans, the car-
bon sources for photosynthesis include carbonate, bicarbon-
ate, and dissolved carbon dioxide. d13C values of freshwater
aquatic plants can be quite variable, but in general, they re-
semble those of terrestrial C3 plants (Clementz et al. 2007),
although they may sometimes have lower d13C values than
terrestrial C3 plants (Fig. 4.1). Low d13C values in aquatic fresh-
water plants occur because the assimilated carbon from the
bicarbonate has low d13C values that originate from the degra-
dation of organic matter with low d13C values. Thus, the tissue
of herbivores that fed on freshwater plants show lower d13C
values than herbivores feeding on terrestrial vegetation.
MESOZOIC PLANTS
The d13C value of atmospheric CO2 has a globally constant
mean value that shifts only as a result of changes in the global
carbon cycle. For example, because of the burning of 12C-rich
fossil hydrocarbons, the current atmospheric CO2 (d13CCO2 =
–8‰) is 1.5‰ depleted in 13C, compared to preindustrial
CO2, with a d13C value of –6.5‰ (Friedli et al. 1986). d13C val-
ues of carbonized plant fossils do not shift significantly during
fossilization (DeNiro & Hastorf 1985) or experimental diagen-
esis and coalification (e.g., Schleser et al. 1999; Turney et al.

Diet of Sauropod Dinosaurs 61
FIGURE 4.1. Carbon isotope
composition of plants. Ranges of
d13C values in extant terrestrial
and aquatic plants are given.
Thick vertical bars represent
ranges in d13C values for
terrestrial (Bender 1971; Deines
1980) and aquatic vegetation
(Clementz et al. 2006 and
references therein). The
distribution of the d13C values of
terrestrial C3 and C4 plants is also
given in histogram form.
Environmental influences and
their effects on the d13C values of
C3 plants (Tieszen 1991; Heaton
1999; Gröcke 2002) are
schematically shown. POM,
particulate organic matter, a
proxy for phytoplankton.
Modified after Clementz et al.
(2006 and references therein).
2006). For example, only small shifts (� 1.3‰), often toward
slightly more negative d13C values due to the preferential loss
of isotopically heavy 13C-rich components, were observed
during experimental coalification of wood (e.g., Schleser et al.
1999; Turney et al. 2006). Therefore, it can be assumed that
carbonized plant remains from the Mesozoic have roughly
retained their original carbon isotope composition.
Mesozoic plants have d13C values ranging from –28 to
–20‰ (e.g., Bocherens et al. 1993; Nguyen Tu et al. 1999;
Gröcke 2002). Values higher than –23‰ are rare and proba-
bly reflect water-stressed C3 and/or CAM plants. The occur-
rence of CAM plants in arid Mesozoic terrestrial ecosystems
is supported by d13C values of sedimentary organic matter
lower than –20‰ in Upper Triassic to Jurassic strata of South
Africa (Decker & de Wit 2006). However, CAM plants were not
a major component of Mesozoic floras. Apart from a few
global carbon isotope excursions, Mesozoic plant remains and
wood have predominantly yielded d13C values typical for C3
plants, with an average value of approximately –24‰
(Gröcke 2002). Late Cretaceous soil organic matter yielded
similar mean d13C values—approximately –24.7 to –24.5‰
(Fricke et al. 2008). These d13C values are about 3‰ higher
than for extant C3 plants, probably as a result of higher
d13CCO2 values of the Mesozoic atmosphere (Gröcke 2002).
They likely represent the average carbon isotope composition
of plants that dinosaurs fed on during most of the Mesozoic.
SKELETAL TISSUES: BONES, TEETH, AND EGGSHELLS
As noted, dietary isotopic signals are recorded in both soft
tissues (muscles, skin, hair) and hard tissues (bones, teeth, egg-
shells) of vertebrates (Kohn & Cerling 2002; Koch 2007; Tüt-
ken 2010). Soft tissues are generally not preserved in dinosaur
fossils, except for rare cases of protein preservation in dino-
saur bones (Ostrom et al. 1993; Bocherens et al. 1993; Schweit-
zer et al. 2005, 2007). Therefore, mineralized hard tissues such
as teeth, bones, and eggshells hold the best potential for re-
cording the diet of dinosaurs.
Bones consist of a protein matrix of collagen (approxi-
mately 30 wt%) and a mineral phase of bioapatite (approxi-
mately 70 wt%). Bioapatite is a carbonate containing non-
stoichiometric hydroxyapatite (Ca5(PO4, CO3)3(OH, CO3))
and is also the major mineral phase of enamel and dentin.
Carbonate replaces several percent (by weight) of the PO43–
ion and the subordinate OH group in the hydroxyapatite lat-
tice (Fig. 4.2). Both bone collagen and bone mineral may rec-
ord dietary information. However, the collagen usually de-
grades within a few thousand to 10,000 years, and only the
mineral phase is preserved in fossil bones over millions of
years. In addition, the nanometer-sized bioapatite crystals
of bone recrystallize during fossilization and may chemically
interact with the embedding sediment. Bones can record a
long-term dietary signal because they form over several years

62 tütken
and are remodeled throughout the lifetime of the animal.
Fast-growing fibrolamellar bone of sauropods should register
a record of several years of dietary intake over most of the life
span of the individual sauropod (Curry 1999; Sander 1999;
Klein & Sander 2008).
Dinosaur teeth were replaced continuously, and replace-
ment teeth grew over the course of several months in most
dinosaurs, but for up to two years in some theropods (Erick-
son 1996; Straight et al. 2004; D’Emic et al. 2009). Sauropods
seem to have had very fast tooth replacement rates of only a
few weeks to months. This was determined for Diplodocus (ap-
proximately 1 month) and Camarasaurus (approximately 2
months) by counts of von Ebner lines laid down in dentin
(D’Emic et al. 2009). Thus, sauropod teeth represent the iso-
topic composition of the diet over a period of a few months.
The third skeletal tissue that provides information on dino-
saur diets is tooth enamel. Its formation time is about the
same as for dentin. Enamel, with its low organic content
([1%), large apatite crystal size, and low porosity, shows the
best preservation of original isotope compositions and dietary
information (Stanton Thomas & Carlson 2004; Straight et al.
2004; Fricke et al. 2008).
Dinosaurs had calcareous eggshells, with a record extend-
ing back to the Late Triassic. In modern birds, eggshell forms
within one day (e.g., 21 hours in a chicken; Folinsbee et al.
1970), and it is reasonable to assume a similar time frame for
the formation of dinosaur eggs. Therefore, the calcitic egg-
shells likely record a short-term dietary signal of only a few
days. The stable isotope composition of eggshell calcite seems
to be preserved relatively well over millions of years, and it
allows dietary and environmental inferences to be drawn for
sauropods (Erben et al. 1979; Sarkar et al. 1991; Cojan et al.
2003; Mohabey 2005). Eggshell d13C data indicate that sau-
ropods fed exclusively on C3 plants (Erben et al. 1979; Sarkar
et al. 1991; Cojan et al. 2003; Mohabey 2005).
CARBON ISOTOPES AS AN INDICATOR
OF DIET AND ECOLOGY
The carbon isotope composition of fossil bioapatite of bones
and teeth has been widely used as an archive for reconstructing
the paleoecology and paleodiet of extinct vertebrates (Koch
1998, 2007; Kohn & Cerling 2002; Kohn et al. 2005). The car-
bon isotope composition of skeletal bioapatite is directly con-
trolled by the d13C values of an animal’s diet (Ambrose & Norr
1993; Tieszen & Fagre 1993). Plant carbon ingested by her-
bivores is metabolized and incorporated as carbonate (CO32–)
into the biogenic apatite and eggshell carbonate. The skeletal
bioapatite forms in isotopic equilibrium with the blood.
Before dietary reconstructions can be made, the magnitude
of the carbon isotope fractionation between skeletal apatite
and diet, that is, the metabolic offset between apatite and diet
FIGURE 4.2. Schematic drawing of the incorporation of carbon
from food into the bioapatite of bones and teeth of a sauropod by
ingestion, metabolism, and tissue mineralization. Plant drawings
modified after Hinz (2010).
(qd13Capatite-diet), must be known. However, it varies among dif-
ferent animals; in large mammalian herbivores, it ranges from
approximately 12–15‰ (Koch 1998; Cerling & Harris 1999;
Passey et al. 2005). The most extensive field study of wild Afri-
can large herbivorous ungulates (which consists of grazers and
browsers as well as foregut and hindgut fermenters) found an
average qd13Cenamel-diet enrichment factor of 14.1 † 0.5‰ (Cer-
ling & Harris 1999). In a controlled feeding study, Passey et al.
(2005) found different qd13Cenamel-diet enrichment factors of
13.3 † 0.3‰ for nonruminant pigs and 14.6 † 0.3‰ for
ruminant cows raised on an isotopically identical diet. There-
fore, digestive physiology (e.g., the rate of 12C-rich methane
production and its loss during digestion and rumination) can
have an important influence on the qd13Cenamel-diet enrichment
factor (Passey et al. 2005). Thus, enamel d13C values mostly
reflect the diet of the animal, but they may be additionally
affected to some degree by its digestive physiology (Passey et
al. 2005; Zanazzi & Kohn 2008). This may have applied to
dinosaurs as well (Fricke et al. 2008). The 13Ceggshell-diet enrich-
ment factor between eggshell carbonate and bulk diet for large
birds (ostriches) is 16.2‰ (von Schirnding et al. 1982; John-
son et al. 1998). Because the qd13Capatite-diet enrichment factor
of extant reptiles and dinosaurs is unknown, the use of the
ostrich enrichment factor for sauropods seems justified as a
first approximation because these birds are surviving sauris-
chian dinosaurs—the group to which the sauropods belong
as well.
Recently, Fricke et al. (2008) found a qd13Capatite-diet value of
18‰ in ornithischian dinosaurs, based on the d13C differ-
ence between soil organic matter (assumed to represent the
average d13C value of the plants that the dinosaurs fed on)
and tooth enamel of Late Cretaceous herbivorous hadrosaurid
dinosaurs. This value is even higher than that in extant her-
bivorous birds. This study attempts to derive a qd13Capatite-diet

Diet of Sauropod Dinosaurs 63
value for sauropods using enamel and food plant d13C data
from the same locality. On the basis of this fractionation fac-
tor, d13C values of the food plants ingested by other sauropods
can be calculated.
DIAGENESIS: PRESERVATION OF ORIGINAL
CARBON ISOTOPE COMPOSITIONS?
For all geochemical, paleoecological, and paleodietary recon-
structions based on fossil skeletal remains, it is critical to eval-
uate whether the original isotopic composition of the living
animal tissue is still preserved. Chemical and biological pro-
cesses during the fossilization of skeletal tissues can lead
to significant changes of this in vivo isotope composition of
the bioapatite (e.g., Kolodny et al. 1996; Tütken 2003; Tütken
et al. 2008). Such changes hamper, or in the worst case even
prevent, reconstruction of diet and environmental condi-
tions. Because of its physical and chemical properties (see
above), enamel is least affected by diagenesis (Ayliffe et al.
1994; Kohn et al. 1999; Tütken et al. 2008), and the original
carbon isotope composition of fossil enamel can be preserved
over millions of years (e.g., Lee-Thorp & van der Merwe 1987;
Wang & Cerling 1994; Lee-Thorp & Sponheimer 2005), even
in Mesozoic reptile and dinosaur teeth (Botha et al. 2005;
Fricke et al. 2008; Fricke & Pearson 2008).
In fossil bone, however, the original carbon and oxygen
isotope composition of the bone mineral can be partly or
even completely altered (Schoeninger & DeNiro 1982; Nelson
et al. 1986; Kolodny et al. 1996; Trueman et al. 2003; Kohn &
Law 2006). In the latter case, they should equilibrate with soil
carbonates (Kohn & Law 2006). Therefore, sauropod bones
should at least reflect the long-term average d13C value of
vegetation cover, but not the specific values of the preferred
food plants ingested by the sauropods.
There are four different geochemical approaches to test for
preservation of original isotopic composition and to monitor
diagenetic alteration. First is comparison of skeletal tissues
with different diagenetic resistance (e.g., enamel Ø dentin Ø
bone) (Ayliffe et al. 1994; Tütken et al. 2008). Even though
different skeletal tissues may form at different times in the life
of the animal, they should have similar isotope compositions
if no major dietary shifts occurred during ontogeny. Dentin
and bone should more readily equilibrate with the diagenetic
environment than enamel. Second is the comparison of the
isotope composition of the fossil bioapatite and the carbonate
from the embedding sediment (Fricke et al. 2008). If there are
significant d13C differences between them, this confirms that
no or only limited isotope exchange and alteration occurred
and that at least a partial preservation of the original composi-
tions is likely. Third is the preservation of expected differences
in isotopic composition between ecologically and/or physio-
logically different taxa (Kolodny et al. 1996; Fricke & Rogers
2000; Trueman et al. 2003; Fricke & Pearson 2008). Finally, the
mineralogical and chemical composition of the fossil skeletal
tissues may be compared to that of fresh tissues by analyzing
parameters such as apatite crystallinity, secondary mineral
content, and the concentration of diagenetically incorporated
trace elements such as rare earth elements (e.g., Hubert et al.
1996; Trueman 1999; Trueman & Tuross 2002; Pucéat et al.
2004; Trueman et al. 2004).
However, rare earth elements are not a good proxy for the
diagenetic alteration of stable carbon and oxygen isotope sig-
natures (e.g., Tütken et al. 2008). The same is true for apatite
crystallinity (Pucéat et al. 2004). As long as the P-O and C-O
bonds of the phosphate and carbonate, respectively, in the
apatite are not broken, the isotope composition will not
change (e.g., Fricke 2007). Nevertheless, the enamel of the
sauropod teeth analyzed here has concentrations of rare earth
elements one to two orders lower than sauropod bones from
the same strata (Herwartz et al. 2010), indicating a less severe
diagenetic alteration of the enamel than of the bones. This is
further supported by the fact that the enamel has a d18OCO3
a few per mil higher (Tütken, pers. obs.) than the dentin
from the same teeth and the bones from the same taxon. The
enamel also has in most cases lower d13C values than the den-
tin and bone (see also Figs. 4.6, 4.8). The carbon isotope com-
position of enamel is generally less susceptible to diagenetic
alteration than the oxygen isotope composition of enamel
carbonate (Wang & Cerling 1994). Enamel d13C differences
between teeth of different sauropod taxa from the same lo-
cality that underwent a similar diagenetic history suggest
preservation of the original biogenic composition.
Carbon Isotope Analysis of Sauropod Skeletal
Apatite, Potential Food Plants, and
Living Relatives of Mesozoic Plants
SAMPLE OF SAUROPOD SKELETAL REMAINS
Long bones (mostly femora and humeri, n = 64) from 12 dif-
ferent sauropod taxa and teeth (n = 19) from five different
sauropod taxa, mostly of Late Jurassic age, and teeth and
bones of one prosauropod (Plateosaurus) of Late Triassic age
were analyzed for their carbon isotope composition (Table
4.1). Most of the specimens come from different outcrops in
either the Morrison Formation, USA, or the Tendaguru Beds,
Tanzania, both of Late Jurassic age. These two rock formations
have yielded a large number of sauropods and are among the
richest and most famous dinosaur-bearing strata worldwide.
In both formations, there were several sympatric sauropod
taxa, at least five in the Tendaguru Beds and up to seven in the
Morrison Formation (Dodson et al. 1980; Weishampel et al.
2004). The Tendaguru and Morrison sauropods lived in ter-
restrial floodplain environments characterized by a season-
64 tütken
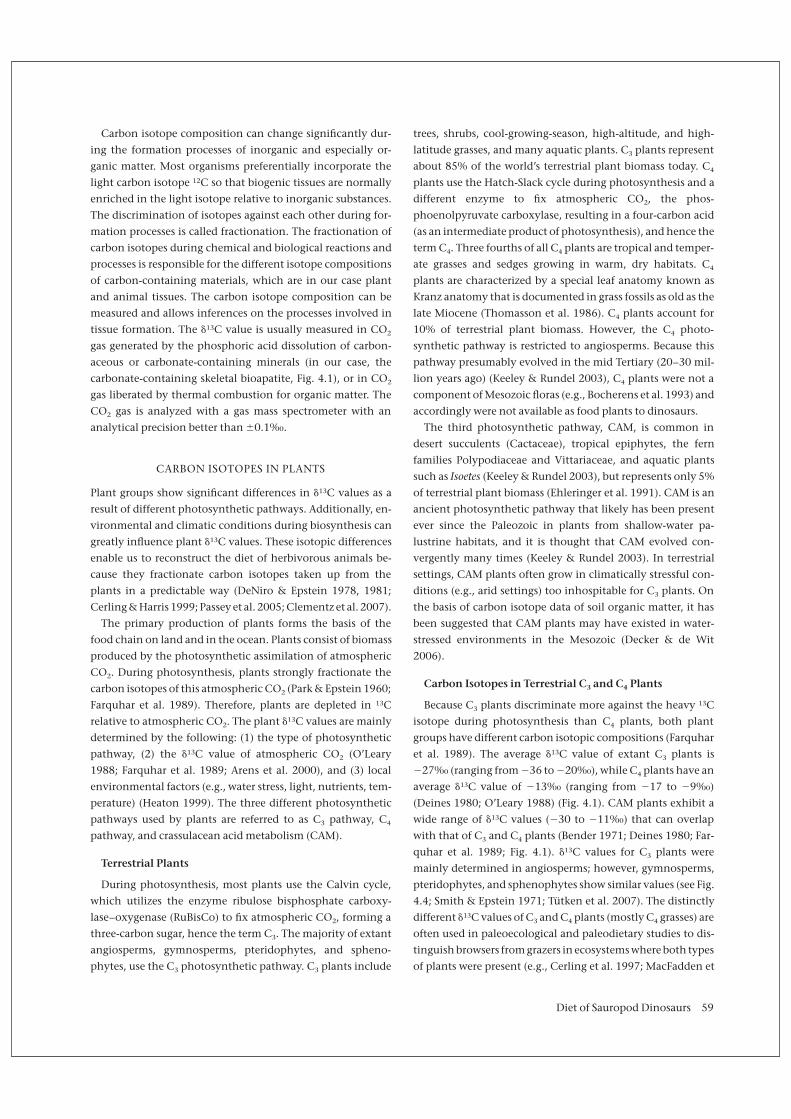
Table 4.1. Sauropod Bones and Teeth Analyzed for Their d13C Values
Taxon
Skeletal
tissue n Locality Age
Ampelosaurus atacis Bone 5 Espéraza, France Late Cretaceous
Apatosaurus sp. Bone 6 Howe-Stephens Quarry, Morrison Formation, USA Late Jurassic
Bone 3 Dinosaur National Monument, Morrison Formation, USA Late Jurassic
Bone 1 Kenton Quarry, Morrison Formation, USA Late Jurassic
Bone 1 Dry Mesa Quarry, Morrison Formation, USA Late Jurassic
Tooth 2 Howe-Stephens Quarry, Morrison Formation, USA Late Jurassic
Barosaurus sp. Bone 3 Tendaguru Beds, Tanzania Late Jurassic
Brachiosaurus sp. Bone 1 Howe-Stephens Quarry, Morrison Formation, USA Late Jurassic
Brachiosaurus brancai Bone 4 Tendaguru Beds, Tanzania Late Jurassic
Tooth 7 Tendaguru Beds, Tanzania Late Jurassic
Camarasaurus sp. Bone 2 Dry Mesa Quarry, Morrison Formation, USA Late Jurassic
Bone 2 Freezeout Hills, Morrison Formation, USA Late Jurassic
Bone 1 Dinosaur National Monument, Morrison Formation, USA Late Jurassic
Bone 1 Kenton Quarry, Morrison Formation, USA Late Jurassic
Tooth 2 Howe-Stephens Quarry, Morrison Formation, USA Late Jurassic
Cetiosauriscus greppini Bone 4 Moutier, Switzerland Late Jurassic
Diplodocus sp. Bone 8 Howe-Stephens Quarry, Morrison Formation, USA Late Jurassic
Bone 3 Dry Mesa Quarry, Morrison Formation, USA Late Jurassic
Tooth 2 Howe-Stephens Quarry, Morrison Formation, USA Late Jurassic
Dicraeosaurus sp. Bone 1 Tendaguru Beds, Tanzania Late Jurassic
Europasaurus holgeri Bone 2 Oker, Germany Late Jurassic
Janenschia robusta Bone 1 Tendaguru Beds, Tanzania Late Jurassic
Mamenchisaurus sp. Bone 3 Junggar Basin, China Late Jurassic
Tooth 4 Junggar Basin, China Late Jurassic
Isanosaurus sp. Bone 1 Nam Phong Formation, Thailand Late Triassic
Plateosaurus engelhardti Bone 4 Frick, Switzerland Late Triassic
Bone 7 Trossingen, Germany Late Triassic
Tooth 1 Frick, Switzerland Late Triassic
Tooth 1 Trossingen, Germany Late Triassic
The bone specimens analyzed were taken from the cortex of sauropod long bone shafts, mostly femora and humeri. The specimens (n = number ofspecimens) originate mostly from different quarries in the Morrison Formation and from the Tendaguru Beds. Sauropod teeth from the MorrisonFormation all come from the Howe-Stephens Quarry, whereas the Brachiosaurus teeth are from different microsites within the Tendaguru Beds.
ally dry climate (Aberhan et al. 2002; Engelmann et al. 2004;
Rees et al. 2004; Foster 2007). However, Tendaguru was situ-
ated closer to the paleocoastline than the Morrison Formation
environment. Within the Tendaguru Formation, the sauro-
pod remains were deposited in fine-grained sediments of a
coastal to tidal flat setting (Bussert et al. 2009). A few bones
from Cetiosauriscus and Europasaurus from Late Jurassic ma-
rine near-shore settings of northern Switzerland and northern
Germany, respectively, were also analyzed (Sander et al. 2006;
Meyer & Thüring 2003). Furthermore, a few Mamenchisaurus
bones and teeth from the terrestrial Late Jurassic sediments of
the Junggar Basin in northwest China, Ampelosaurus bones
from Late Cretaceous strata of the Pyrenean foreland in south-
western France, and one humerus of the Late Triassic early
sauropod Isanosaurus from Thailand (Buffetaut et al. 2002)
were analyzed.
METHODS
Carbon Isotope Measurement of Bones and Teeth
Bulk samples of bone, dentin, and enamel were taken with a
handheld drill with diamond-studded drill bits. The sample
powder (10 mg) was chemically pretreated with 2% NaOCl
and 1 M calcium acetate acetic acid buffer solution, accord-
ing to the methods described by Koch et al. (1997), to remove
organics and diagenetic or non-lattice-bound carbonate, re-
spectively. To measure the carbon isotope composition of the
skeletal apatite, the structurally bound carbonate has to be
extracted from the apatite lattice. This is achieved by the clas-
sic phosphoric acid (H3PO4) reaction used for carbonates fol-
lowing McCrea (1950), which liberates CO2 from the sample.
About 2 mg pretreated bone, dentin, or enamel powder was
allowed to react with 100% H3PO4 for 90 minutes at 70\C with
Diet of Sauropod Dinosaurs 65
a ThermoFinnigan Gas Bench II (Spötl & Vennemann 2003).
In this reaction, the acid fractionation factor between calcite
and CO2 applies. Carbon and oxygen isotope ratios of the
generated CO2 were measured in continuous flow mode in a
Finnigan MAT 252 isotope ratio gas mass spectrometer at
the University of Tübingen. The carbon and oxygen isotopic
compositions measured were normalized to the in-house Car-
rara marble calcite standard that has been calibrated against
the international NBS-19 calcite standard. The international
phosphorite rock standard NBS 120c, treated and measured in
the same way as the samples, yielded a d13C value of –6.37 †
0.07‰ (n = 27).
Carbon Isotope Measurement of
Extant and Fossil Plants
The leaves of extant plants were air dried and then powdered
and homogenized in a ball mill. About 150 mg of the powder
was placed into tin capsules. The carbonized fossil plant speci-
mens were treated with 1 M HCl for several hours to remove
potential carbonate contamination, then rinsed several times
with deionized water. A total of 50–80 mg of the pretreated
material was placed into tin capsules. To measure the carbon
isotope composition, the tin capsules were thermally com-
busted at 1,050\C in a Carlo Erba 1500 Elemental Analyzer. The
released CO2 was separated in a gas chromatographic column
and then injected via a CONFLO II interface into a Finnigan
MAT DeltaPlus XL continuous-flow isotope ratio gas mass
spectrometer to measure the carbon isotopic composition. The
reproducibility for d13C measurements was better than 0.1‰.
Results
d13C VALUES OF EXTANT NONANGIOSPERM PLANTS
The carbon isotope composition of 240 leaf samples of extant
gymnosperms (cycads, conifers, ginkgoes), pteridophytes
(ferns, tree ferns), and sphenophytes (horsetails) were ana-
lyzed (Table 4.2). Plant samples were collected from different
geographic settings, mostly from botanical gardens in Bonn,
Germany, and Cape Town, South Africa. The d13C values of all
nonangiosperm leaf samples range from –36.4 to –21.9‰
(n = 240) and cover the entire spectrum of values typical for
terrestrial angiosperm C3 plants with a mean d13C value of
–27.5‰ (Tütken et al. 2007; Fig. 4.3). No d13C values charac-
teristic of C4 plants of approximately –12‰ were detected.
However, CAM plants may be represented in this data set,
especially because a few extant cycads and ferns are known to
be CAM plants (Ong et al. 1986; Vovides et al. 2002).
Though all extant leaf samples have d13C values in the range
of C3 plants, differences in the carbon isotope composition
exist (Fig. 4.3). The mean d13C values are highest for cycads
(–26.0 † 2.0‰) and Araucaria (–26.5 † 1.6‰), other coni-
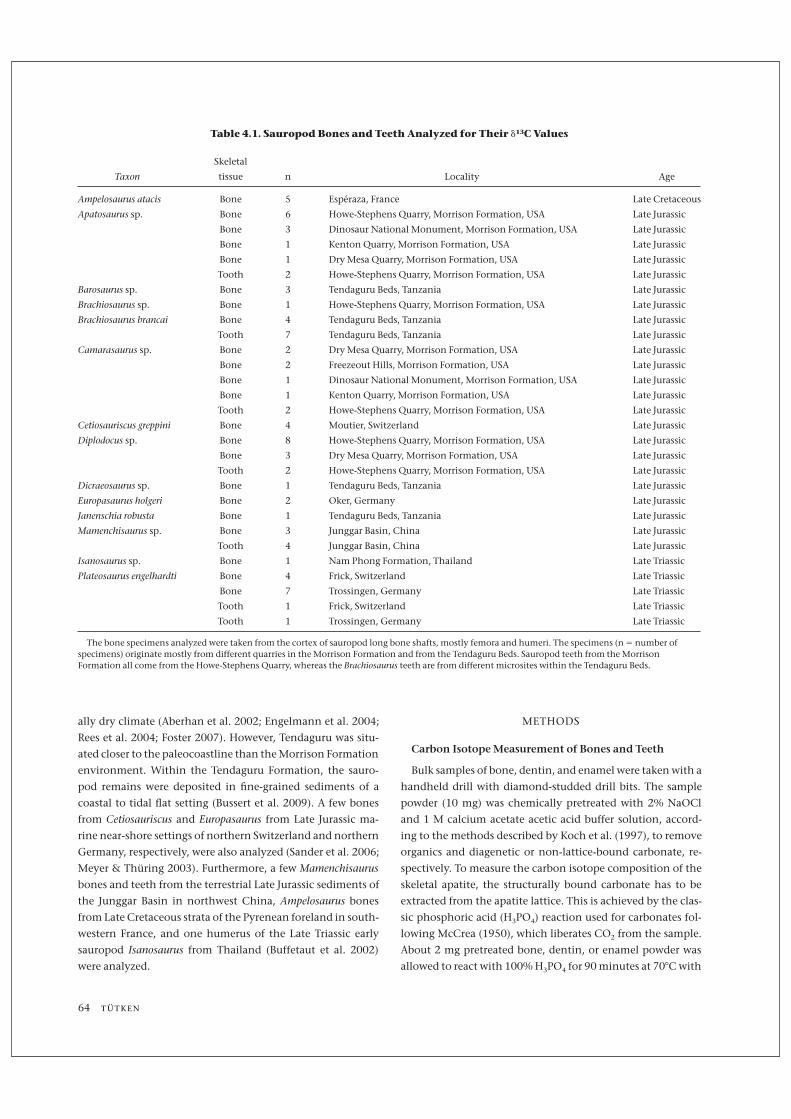
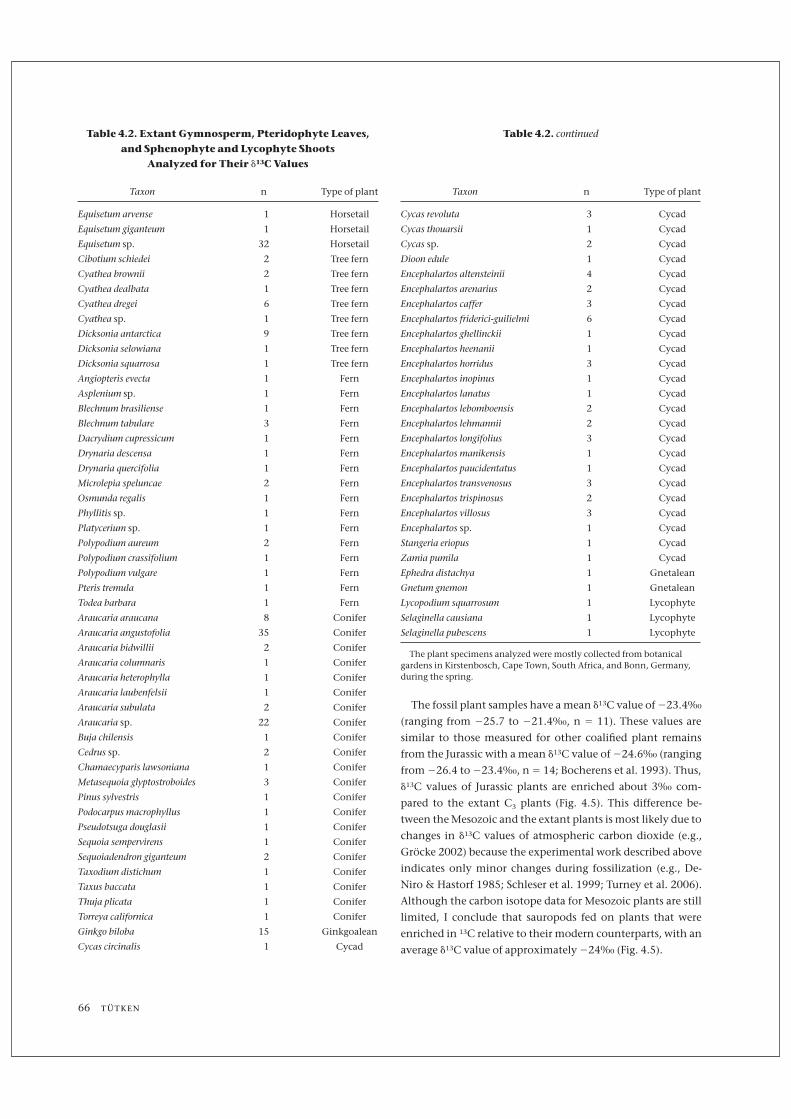
FIGURE 4.3. Histogram of d13C values of leaves in extant
gymnosperms, pteridophytes, and horsetails (Table 4.2) collected
from different botanical gardens in comparison to those of
extant angiosperm C3 and C4 plants (Deines 1980). All the
nonangiosperm plants analyzed have d13C values typical of C3
plants. The d13C values calculated for the food plants ingested by
the sauropods (see text for details) fall into the upper range of
living C3 plants.
fers have intermediate values (–27.3 † 1.2‰), and the lowest
values occur in horsetails (–28.9 † 2.1‰), tree ferns (–29.2 †
0.9‰), and ferns (–29.5 † 2.4‰). The observed differences
of 3.4‰ between the mean d13C values for these plant groups
are much smaller than those between C3 and C4 plants (Fig.
4.3). Furthermore, the ranges of d13C values of the different
groups overlap (Fig. 4.4). This makes a distinction between
dinosaurs feeding on specific plant groups difficult because
of the environmental factors discussed above that can also
change plant d13C values by a few per mil (Tieszen 1991;
Heaton 1999). However, there is a growing body of carbon
isotope studies that have successfully determined niche par-
titioning and feeding behavior of herbivorous mammals in
modern and ancient C3 plant ecosystems (Cerling et al. 2004;
MacFadden & Higgins 2004; Feranec & MacFadden 2006; Fer-
anec 2007; Fricke et al. 2008; Zanazzi & Kohn 2008; Tütken &
Vennemann 2009).
d13C VALUES OF CARBONIZED MESOZOIC PLANTS
In addition to the leaves of living, nonangiosperm plants,
seven coalified fossil plant specimens (mostly leaves) from ex-
tinct groups such as bennettitaleans and pteridosperms from
six different Jurassic and Early Cretaceous floras were analyzed
for their carbon isotope composition. Furthermore, d13C val-
ues of four pieces of conifer charcoal from sauropod-bearing
strata of the Howe-Stephens Quarry, Morrison Formation,
Wyoming, were also analyzed (Table 4.3).
66 tütken
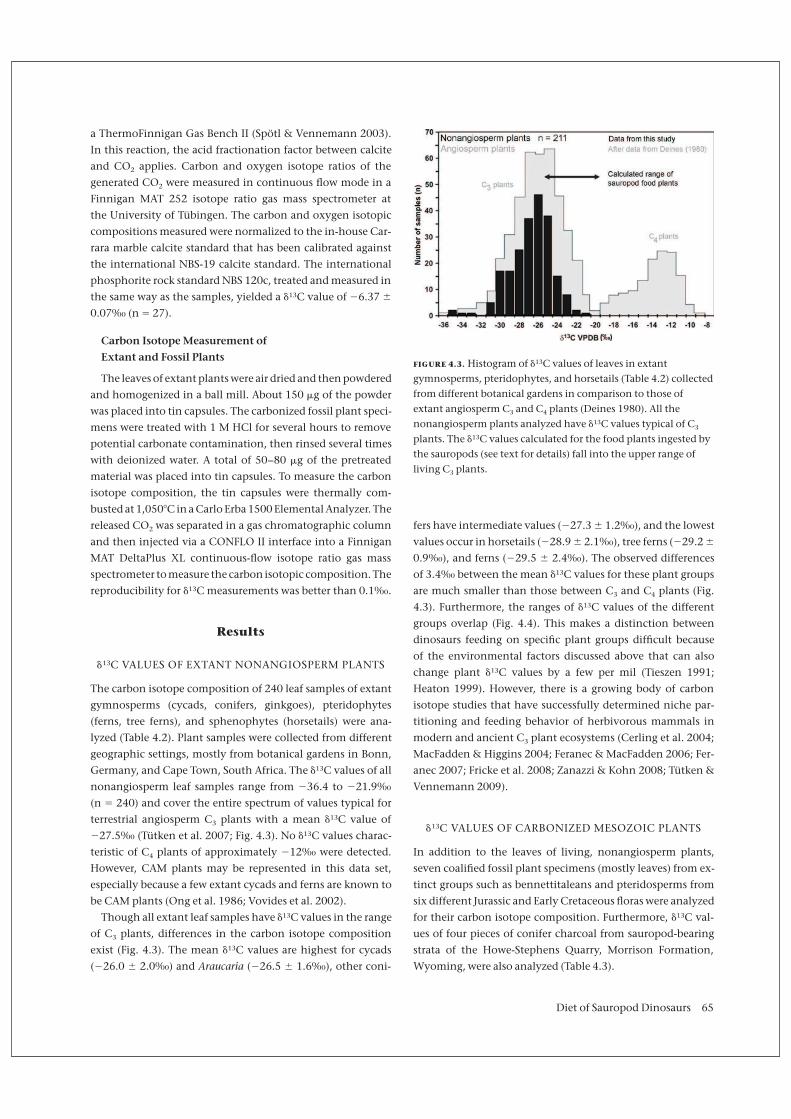
Table 4.2. Extant Gymnosperm, Pteridophyte Leaves,
and Sphenophyte and Lycophyte Shoots
Analyzed for Their d13C Values
Taxon n Type of plant
Equisetum arvense 1 Horsetail
Equisetum giganteum 1 Horsetail
Equisetum sp. 32 Horsetail
Cibotium schiedei 2 Tree fern
Cyathea brownii 2 Tree fern
Cyathea dealbata 1 Tree fern
Cyathea dregei 6 Tree fern
Cyathea sp. 1 Tree fern
Dicksonia antarctica 9 Tree fern
Dicksonia selowiana 1 Tree fern
Dicksonia squarrosa 1 Tree fern
Angiopteris evecta 1 Fern
Asplenium sp. 1 Fern
Blechnum brasiliense 1 Fern
Blechnum tabulare 3 Fern
Dacrydium cupressicum 1 Fern
Drynaria descensa 1 Fern
Drynaria quercifolia 1 Fern
Microlepia speluncae 2 Fern
Osmunda regalis 1 Fern
Phyllitis sp. 1 Fern
Platycerium sp. 1 Fern
Polypodium aureum 2 Fern
Polypodium crassifolium 1 Fern
Polypodium vulgare 1 Fern
Pteris tremula 1 Fern
Todea barbara 1 Fern
Araucaria araucana 8 Conifer
Araucaria angustofolia 35 Conifer
Araucaria bidwillii 2 Conifer
Araucaria columnaris 1 Conifer
Araucaria heterophylla 1 Conifer
Araucaria laubenfelsii 1 Conifer
Araucaria subulata 2 Conifer
Araucaria sp. 22 Conifer
Buja chilensis 1 Conifer
Cedrus sp. 2 Conifer
Chamaecyparis lawsoniana 1 Conifer
Metasequoia glyptostroboides 3 Conifer
Pinus sylvestris 1 Conifer
Podocarpus macrophyllus 1 Conifer
Pseudotsuga douglasii 1 Conifer
Sequoia sempervirens 1 Conifer
Sequoiadendron giganteum 2 Conifer
Taxodium distichum 1 Conifer
Taxus baccata 1 Conifer
Thuja plicata 1 Conifer
Torreya californica 1 Conifer
Ginkgo biloba 15 Ginkgoalean
Cycas circinalis 1 Cycad
Table 4.2. continued
Taxon n Type of plant
Cycas revoluta 3 Cycad
Cycas thouarsii 1 Cycad
Cycas sp. 2 Cycad
Dioon edule 1 Cycad
Encephalartos altensteinii 4 Cycad
Encephalartos arenarius 2 Cycad
Encephalartos caffer 3 Cycad
Encephalartos friderici-guilielmi 6 Cycad
Encephalartos ghellinckii 1 Cycad
Encephalartos heenanii 1 Cycad
Encephalartos horridus 3 Cycad
Encephalartos inopinus 1 Cycad
Encephalartos lanatus 1 Cycad
Encephalartos lebomboensis 2 Cycad
Encephalartos lehmannii 2 Cycad
Encephalartos longifolius 3 Cycad
Encephalartos manikensis 1 Cycad
Encephalartos paucidentatus 1 Cycad
Encephalartos transvenosus 3 Cycad
Encephalartos trispinosus 2 Cycad
Encephalartos villosus 3 Cycad
Encephalartos sp. 1 Cycad
Stangeria eriopus 1 Cycad
Zamia pumila 1 Cycad
Ephedra distachya 1 Gnetalean
Gnetum gnemon 1 Gnetalean
Lycopodium squarrosum 1 Lycophyte
Selaginella causiana 1 Lycophyte
Selaginella pubescens 1 Lycophyte
The plant specimens analyzed were mostly collected from botanicalgardens in Kirstenbosch, Cape Town, South Africa, and Bonn, Germany,during the spring.
The fossil plant samples have a mean d13C value of –23.4‰
(ranging from –25.7 to –21.4‰, n = 11). These values are
similar to those measured for other coalified plant remains
from the Jurassic with a mean d13C value of –24.6‰ (ranging
from –26.4 to –23.4‰, n = 14; Bocherens et al. 1993). Thus,
d13C values of Jurassic plants are enriched about 3‰ com-
pared to the extant C3 plants (Fig. 4.5). This difference be-
tween the Mesozoic and the extant plants is most likely due to
changes in d13C values of atmospheric carbon dioxide (e.g.,
Gröcke 2002) because the experimental work described above
indicates only minor changes during fossilization (e.g., De-
Niro & Hastorf 1985; Schleser et al. 1999; Turney et al. 2006).
Although the carbon isotope data for Mesozoic plants are still
limited, I conclude that sauropods fed on plants that were
enriched in 13C relative to their modern counterparts, with an
average d13C value of approximately –24‰ (Fig. 4.5).

Diet of Sauropod Dinosaurs 67
FIGURE 4.4. Histograms of the leaf d13C values of six different extant plant groups. Conifers such as Araucaria and Ginkgo as well as
cycads have higher d13C values with mean values of approximately –27 to –26‰. Ferns, tree ferns, and horsetails, however, have lower
d13C values with mean values of approximately –29‰. n = number of samples.
d13C VALUES OF SAUROPOD BONES AND TEETH
Bones and tooth enamel measured in this study (Table 4.1)
have similar mean d13C values of –7.1 † 1.4‰ (ranging from
–10.9 to –4.7‰; n = 64) and –8.0 † 1.2‰ (ranging from
–9.1 to –4.1‰; n = 19), respectively (Fig. 4.5). All these d13C
values fall within the range of terrestrial C3 plant feeders; how-
ever, most enamel and bone d13C values are near the upper
limit of other herbivores feeding on terrestrial C3 plants (Fig.
4.6). Higher d13C apatite values characteristic of vertebrates
feeding on C4 and marine plants were not found.
In addition to the bulk bone samples, one femur bone of an
adult Apatosaurus and one tooth of an adult Camarasaurus
(Fig. 4.7), both from the Howe-Stephens Quarry of the Morrison
Formation in Wyoming, as well as a tooth from a Brachiosaurus
from the Tendaguru Beds, were serially sampled to determine
the range of intraindividual d13C variation. The Apatosaurus
bone yielded a mean d13C value of –7.4 † 0.1‰ (ranging

68 tütken
Table 4.3. Mesozoic Plant Specimens Analyzed for Their Carbon Isotope Composition
Taxon n Type of plant Locality Age
Pinus sp. 1 Conifer La Louvière, Belgium Early Cretaceous
Cycadopteris cycadeoidea 1 Bennettitalean Samogy, Hungary Early Jurassic
undetermined conifer 4 Conifer Howe-Stephens Quarry, USA Late Jurassic
Podozamites feneonis 1 Conifer Jura, France Late Jurassic
Baiera gracilis 1 Ginkgoalean Yorkshire, England Middle Jurassic
Ginkgo huttonii 1 Ginkgoalean Yorkshire, England Middle Jurassic
Otozamites beanii 1 Bennettitalean Yorkshire, England Middle Jurassic
Williamsonia sp. 1 Bennettitalean Yorkshire, England Middle Jurassic
Coalified leaf specimens of Jurassic and Early Cretaceous age are from the collection of the Goldfuss Museum, University of Bonn. The charcoal ofundetermined conifer wood comes from the sauropod-bearing strata of the Howe-Stephens Quarry, from which all the sauropod teeth of the MorrisonFormation analyzed in this study originate.
FIGURE 4.5. Histogram of d13C values of extant and Mesozoic
nonangiosperms as well as sauropod bones and enamel samples.
Mean d13C values of each histogram are also given. Carbon
isotope fractionation between diet and hard tissues for different
vertebrates is given: qd13Cenamel-diet for large, herbivorous
mammals approximately 14‰ (Cerling & Harris 1999),
qd13Ceggshell-diet for birds approximately 16‰ (von Schirnding
et al. 1982), qd13Cenamel-diet for hadrosaurs approximately 18‰
(Fricke et al. 2008). d13C data for carbonized Jurassic plant
remains were generated in this study and were taken from
Bocherens et al. (1993). The Jurassic plant remains have a mean
d13C value about 3‰ higher than extant C3 plants. The
qd13Ccarbonate-diet fractionation between these plants remains and
the enamel of sauropods is approximately 16‰, which is similar
to the value for extant ostrich.
from –7.6 to –6.7‰; n = 40), and the Camarasaurus tooth has
a d13C value of –6.8 † 0.3‰ (ranging from –7.4 to –6.4‰; n
= 25). Thus, the intratissue variability of d13C values is less than
1‰ in both sauropods. The same is true in the serially sampled
Brachiosaurus tooth with a mean d13C value of –9.0 † 0.1‰
(ranging from –9.2 to –8.8; n = 9). These limited data indicate
only a small intraindividual d13C variability of 1‰ or less.
The enamel of the sauropod teeth analyzed has in most cases
lower d13C values than dentin and the mean bone d13C value in
the same taxon (Figs. 4.6, 4.8). Although a certain degree of
diagenetic alteration cannot be excluded, enamel d13C values
should most closely reflect dietary intake. Brachiosaurus from
Tendaguru (–8.6 † 0.8‰, n = 7) has the lowest enamel d13C
value of all sauropods analyzed, similar to that of the Late
Triassic Plateosaurus from Trossingen, Germany, and Frick,
Switzerland (–8.5 † 0.3‰, n = 2) (Fig. 4.8). The other sau-
ropod taxa all have higher enamel d13C values, including Ma-
menchisaurus from the Junggar Basin in China (–7.2 † 0.8‰,
n = 4) and the sympatric sauropods from the Morrison Forma-
tion: Diplodocus (–7.9 † 0.3‰, n = 2), Camarasaurus (–6.8 †
0.1‰, n = 2), and Apatosaurus (–5.2 † 0.5‰, n = 2), which
has the highest enamel d13C value of all sauropod taxa investi-
gated (Fig. 4.8). Because dentin is more prone to diagenesis
than enamel, d13C values of dentin are always higher than
enamel values (Fig. 4.8). This suggests at least a partial preser-
vation of original enamel d13C values. Although the dentin of
the teeth of different sauropods from the Morrison Formation
has similar d13C values, the enamel values are different.
Implications of Carbon Isotopes for
the Diet of Sauropods
Because of the small number of sauropod teeth analyzed
here, the following discussion of the carbon isotope data and
their implication for potential sauropod niche partitioning
must be considered as preliminary. Additional enamel d13C
data are needed to substantiate and refine the interpretations

Diet of Sauropod Dinosaurs 69
FIGURE 4.6. d13C values of apatite of
bones and teeth from different sauropod
and prosauropod taxa. For comparison,
d13C values for rib bones of the extant sea
cow (Dugong dugon), a marine herbivo-
rous mammal feeding on aquatic plants,
predominantly sea grass, are given. Most
d13C values of the sauropod bones and
teeth occur in the upper range of values
expected for extant large herbivorous
mammals consuming on C3 plants. No
values fall in the range of C4-plant-like
values, which suggests feeding on
terrestrial C3 plants and that marine food
resources or C4 plants were not used by
sauropods. Note that enamel d13C values
are always lower than the dentin values
of the same tooth. Both dentin and bone
d13C values are likely to be biased by
diagenetic alteration toward more
positive values.
about sauropod resource partitioning and feeding behavior
given below.
To study the diet and feeding behavior of sauropods by ana-
lyzing the d13C values of their skeletal tissues, it is important to
know the carbon isotope fractionation during metabolism of
the food and incorporation into the bioapatite. The carbon
isotope fractionation has been determined for extant her-
bivorous mammals (approximately 14‰; Cerling & Harris
1999; Passey et al. 2005) and birds (approximately 16‰; von
Schirnding et al. 1982), but not for reptiles. However, a recent
study of herbivorous ornithischian dinosaurs has estimated
the qd13Capatite-diet to be approximately 18‰ (Fricke et al.
2008). To determine whether the qd13Capatite-diet values for or-
nithischian dinosaurs also applies to saurischian dinosaurs, a
qd13Capatite-diet value for sauropods was estimated. This was
done by using the mean d13C value of enamel (–8.0‰) and
that of carbonized Jurassic plant remains (–24‰), yielding a
qd13Capatite-diet value of approximately 16‰ (Fig. 4.5). This
value is identical to the qd13Ccalcite-diet value found for ostrich
eggshells (von Schirnding et al. 1982; Johnson et al. 1998).
However, this value is 2‰ lower than the qd13Capatite-diet value
of 18‰ (Fricke et al. 2008). The reason for this 2‰ difference
is unclear. One explanation might be that the limited number
of Jurassic plant remains used to calculate the qd13Capatite-diet
value are not from the same strata as the sauropod teeth. Thus,
their d13C values may not exactly represent those of the food
plants ingested by the sauropods.
Although diagenesis might have altered the original d13C
values of sauropod enamel, this likely does not apply to fossil
plant tissue, as discussed above. If we assume that the 2‰
difference between the qd13Capatite-diet value of ornithischian
and saurischian dinosaurs (sauropods) is real, it might reflect
differences in biochemical processes during metabolism and
digestion of the food plants, such as the rate of methane pro-
duction, which have an important influence on the
qd13Capatite-diet value (Passey et al. 2005). Fricke et al. (2008)
speculated that the herbivorous hadrosaurs might have had
higher rates of methane production and thus degassing of 12C-
rich methane from the gastrointestinal tract, which is respon-
sible for their higher qd13Capatite-diet value compared to large
herbivorous mammals. If this hypothesis is correct, then the
lower, bird-like qd13Capatite-diet value of 16‰ determined for
sauropods in this study might suggest that sauropods had in-
termediate rates of methane production compared to large
herbivorous mammals and hadrosaurs. Assuming that a con-
stant qd13Capatite-diet value of 16‰ applies to all sauropod taxa,
the d13C values of their ingested food plants can be calculated
as –25.1 to –20.1‰ and –26.7 to –20.7‰ on the basis of the
enamel and bone samples, respectively. All sauropod enamel
and bone d13C values are consistent with those expected for
terrestrial herbivores purely feeding on C3 plants (Fig. 4.6). The
calculated d13C values of sauropod food plants fall within the
range measured for extant gymnosperm and fern foliage and
sphenophyte shoots but lie in the upper range of extant C3
plants (Fig. 4.3). This may be due to higher d13CCO2 values in
the Mesozoic atmosphere (e.g., Gröcke 2002) and/or water-
stressed environments, which would agree with the seasonally
dry settings currently being proposed for the Morrison Forma-
tion and Tendaguru Beds (Aberhan et al. 2002; Engelmann et
al. 2004; Rees et al. 2004).

70 tütken
FIGURE 4.7. Intratooth and intrabone variation of the carbon
isotope composition of a Camarasaurus tooth and an Apatosaurus
femur bone, respectively. The grooves on the bone section are
the sample marks. The enamel of the Camarasaurus tooth was
serially sampled every 2 mm in a fashion similar to sampling of
the bone. The top photo shows the tooth before sampling. Both
skeletal elements are from the Late Jurassic Morrison Formation
at the Howe-Stephens Quarry, Wyoming.
SAUROPOD DIET AND NICHE PARTITIONING
Sauropod diets so far have been inferred mostly from tooth
morphology, dental wear, and neck posture and resulting
feeding envelope, as well as digestibility and abundance of
potential food plants (Bakker 1978; Weaver 1983; Fiorillo
1998; Stevens & Parrish 1999, 2005a, 2005b; Upchurch & Bar-
rett 2000; Hummel et al. 2008; Christian & Dzemski, this vol-
ume; Gee, this volume; Hummel & Clauss, this volume). De-
spite different neck lengths and feeding envelopes, there is a
considerable overlap in browse height among the different
sauropod genera (Fig. 4.9). Nevertheless, high-browsing taxa
such as Brachiosaurus and Camarasaurus (Fig. 4.9) were poten-
tially able to feed on all arborescent gymnosperms that may
have been out of reach of low-browsing taxa such as Dicraeo-
saurus and Diplodocus.
Because the differences of mean enamel d13C values between
sauropod taxa (Fig. 4.8) are larger than intraspecific variability
(Fig. 4.7), d13C values may be used to study preferential feeding
on isotopically distinct food plants. Especially the comparison
FIGURE. 4.8. Mean d13C values of sauropod and prosauropod
enamel and dentin samples. Sauropods marked with an asterisk
are from the Howe-Stephens Quarry, Wyoming (Morrison
Formation). They were likely sympatric and thus lived and died
in the same environmental setting. Differences in enamel d13C
values between these taxa may therefore reflect the ingestion of
isotopically distinct food plants and thus a certain niche
partitioning. Note that the number of teeth (n = 2 to 4) per
taxon analyzed is small, which means that these results are
preliminary.
of enamel d13C data from sympatric sauropods can yield infor-
mation about niche partitioning. All teeth analyzed from Di-
plodocus, Apatosaurus, and Camarasaurus (Fig. 4.8) come from
the Howe-Stephens Quarry, Wyoming (cf. Ayer 1999). Thus,
presumably these sauropods lived under the same environ-
mental conditions. Assuming a similar physiology and carbon
isotope fractionation, the differences in enamel d13C values
(Fig. 4.8) likely reflect feeding on plants or parts thereof with
different d13C values, and thus imply a certain niche partition-
ing between these sympatric sauropods.
Diplodocus
Diplodocus has the lowest mean enamel d13C value, indicat-
ing the ingestion of food plants with lower d13C values than
the other two sympatric sauropods. On the basis of the differ-
ences in mean d13C values between modern gymnosperms,
pteridophytes, and sphenophytes (Fig. 4.4), Diplodocus might
have preferentially fed on ferns and/or horsetails, which have
lower d13C values than that of conifers and cycads (Fig. 4.4).
Such a low-browsing behavior of Diplodocus also accords with

Diet of Sauropod Dinosaurs 71
FIGURE 4.9. Vertical feeding ranges of different sauropod taxa in comparison to a giraffe and an elephant. BR, Brachiosaurus; BA,
Barosaurus; MAM, Mamenchisaurus; CA, Camarasaurus; AP, Apatosaurus; DI, Diplodocus; CE, Cetiosauriscus; DIC, Dicraeosaurus. Sauropod
necks modified after Paul (1998). Although the exact feeding heights and envelopes of the long-necked sauropods are still a matter of
debate (Stevens & Parrish 1999, 2005a, 2005b; Christian & Dzemski, this volume), certain taxa such as Brachiosaurus, Barosaurus, and
Mamenchisaurus were probably capable of high browsing on arborescent plants while other taxa were more likely low browsers, for
example, Dicraeosaurus. Modified after data from Upchurch & Barrett (2000) and Stevens & Parrish (2005a).
the vertical feeding range of 4 m or less, the horizontal neck
posture, and the ventral inclination of its skull as an adapta-
tion for downward feeding, which allowed the animal to feed
even below ground level (Stevens & Parrish 1999, 2005a).
However, dorsoventral neck flexibility of Diplodocus was larger
than suggested by Stevens & Parrish (1999) allowing it to raise
the head well above the height of the shoulders and to utilize
different neck postures during feeding (Dzemski & Christian
2007; Christian & Dzemski, this volume). Lacustrine feeding
on water plants in Diplodocus, as suggested by Stevens & Par-
rish (2005a), does not seem to be supported by the limited
d13C data. Feeding on ferns is more plausible because ferns
may have been an abundant ground cover in the ecosystem of
the Morrison Formation (e.g., Taggart & Cross 1997). The den-
tal wear of Diplodocus suggests unilateral branch stripping as
feeding mechanism, and thus may represent a more selective
food-gathering strategy (Barrett & Upchurch 1994).
Camarasaurus
The mean enamel d13C value of Camarasaurus is intermedi-
ate between that of Diplodocus and Apatosaurus and might indi-
cate a more mixed or generalistic feeding strategy and inges-
tion of a broader range of plants. Such an interpretation is
in agreement with the large spatulate teeth of Camarasaurus
(Fig. 4.7), which enable grasping of coarser food plants and
limited oral food processing. This is also supported by the
variable dental microwear patterns (Fiorillo 1991, 1998),
which indicate a varied diet. Finally, on the basis of its neck
length and posture, Camarasaurus is interpreted to be a high
browser with a large vertical feeding range of approximately
8.5 m (Upchurch & Barrett 2000; Fig. 4.9). This allowed for
feeding in the canopy of conifers, which have higher leaf d13C
values than ferns and horsetails (Fig. 4.4). The intermediate
enamel d13C values of Camarasaurus probably reflect both feed-
ing on plants with low d13C values such as ferns and horsetails,
and on plants with high d13C values such as Araucaria, other
conifers, and cycads. Thus, Camarasaurus had a higher dietary
flexibility compared to other sauropods.
Brachiosaurus
Brachiosaurus brancai from the Tendaguru Beds has the low-
est mean enamel d13C value of all Late Jurassic sauropods ana-
lyzed (Fig. 4.8). The estimated vertical feeding range (?9 m) of
Brachiosaurus is the largest for all sauropods (Fig. 4.9). Thus,
Brachiosaurus is an undisputed high browser that probably fed
on conifers such as Podocarpaceae, Cheirolepidoiaceae, and
Araucariaceae (Fig. 4.10), which were abundant in the coastal
plain depositional environment of the Tendaguru Beds (Schrank
2010). However, because Araucaria leaves have higher d13C val-
ues than other plant foliage (Fig. 4.4), increased enamel d13C
values would be expected if Araucaria or other conifers were the
main food plants. Unfortunately, so far, no enamel d13C data of
other sympatric sauropods from the Tendaguru Beds—that is,
from low-browsing Dicraeosaurus—could be measured for
comparison. It may be possible that enamel d13C values of
Brachiosaurus are low despite feeding on conifer foliage with
lower d13C values as a result of the more mesic environment in
the coastal plain of Tendaguru, resulting in lower plant d13C
values compared to the more continental, in part seasonally
dry setting of the Morrison Formation. The small enamel d13C

72 tütken
FIGURE 4.10. Schematic drawing of the influence of
different vertical feeding ranges on the feeding strategy
and niche partitioning in sauropods. On the basis
of the differences in d13C values of extant ferns,
sphenophytes, and gymnosperm foliage (Fig. 4.4) as
well as on the so-called canopy effect (van der Merwe
& Medina 1991), low (fern) browsing may result in low
d13C values of skeletal apatite, while high (conifer)
browsing may lead to higher d13C values. Sauropod
reconstructions are taken from Paul (1998), and plant
drawings are from Hinz (2010).
intratooth variation ([0.4‰) for one Brachiosaurus tooth is in
accordance with feeding on plants with similar d13C values
that possibly suffered little water stress. The alternative in-
terpretation would be that Brachiosaurus, despite its high-
browsing capability, fed on nonarborescent plants with low
d13C values such as ferns and horsetails (Fig. 4.4), or even on
freshwater plants (Fig. 4.1), although moisture-loving plants
such as ferns and tree ferns growing in the understory of dense,
closed forests would have been much less accessible to fully
grown individuals of Brachiosaurus (Gee, this volume).
SEASONAL OR ONTOGENETIC SHIFTS IN THE DIET
The analysis of intrabone and intratooth d13C profiles (Fig.
4.1) does not reveal significant seasonal shifts in feeding strategy
even though the investigated sauropods may have lived in sea-
sonal environments (Aberhan et al. 2002; Engelmann et al.
2004; Rees et al. 2004). Dietary shifts during ontogeny are
likely to have occurred because young sauropods had much
smaller feeding envelopes than adult individuals (Fig. 4.9) and
were thus restricted to low browsing. They probably had to
compete for low-growing vegetation with other sympatric non-
sauropod herbivorous dinosaurs and low-browsing adult sauro-
pods before attaining their giant adult size and the ability, at
least for some taxa, to exploit the high-browsing niche. Onto-
genetic dietary changes can only be recorded in bones of sauro-
pods that grew at high growth rates over several years to decades
(Curry 1999; Sander & Tückmantel 2003; Klein & Sander 2008).
However, the carbon isotope composition of bone is prone
to diagenetic alteration (e.g., Kohn & Law 2006) and may not
reflect the original dietary composition. Therefore, the intra-
bone variation of the d13C values from the Apatosaurus bone
(Fig. 4.7) must be interpreted with caution because original
heterogeneities might have been reduced and/or absolute
values may have shifted as a result of diagenetic alteration.
Nevertheless, such a high-resolution intrabone d13C profile
of a predominantly nonremodeled, fibrolamellar bone is the
only way to look at a long-term, multiple year dietary record
of an individual sauropod. Though likely altered, the small
intrabone d13C variability seems to suggest no significant
change of the d13C values of the ingested diet.
A better way to infer potential ontogenetic shifts in the diet
of sauropods is the analysis of enamel from teeth of juvenile
and adult individuals. However, dinosaurs constantly replace
their teeth throughout their lifetime (Erickson 1996; D’Emic
et al. 2009). Sauropods generally have fast tooth replace-
ment rates of about one to two months, although tooth for-
mation takes longer in Camarasaurus—several months to a
year (D’Emic et al. 2009). Therefore, sauropod teeth only rec-
ord short-term (from a few months to a year) dietary signals
in their chemical composition and dental wear. Fiorillo (1998)
found different microwear patterns for juvenile and adult
Camarasaurus teeth and interpreted these as an indication of
an ontogenetic shift in diet. Intratooth variability of enamel
d13C values of a Camarasaurus tooth is �1‰ (Fig. 4.7). Thus,
no major shift in the carbon isotope composition of the diet of
this individual occurred during the tooth formation period of
several months (D’Emic et al. 2009). Enamel d13C values of
teeth from a juvenile and an adult individual of Mamenchi-
saurus differ by only 0.7‰ (Fig. 4.6). Thus, no significant shift
in the carbon isotope composition of the diet occurred during
the ontogeny of this very long-necked sauropod. However, on
the basis of these very limited d13C data, it is not possible to
infer whether sauropods changed their diets during ontogeny.

Diet of Sauropod Dinosaurs 73
SAUROPODS FEEDING ON AQUATIC PLANTS?
Marine Feeding?
Sauropod tracks are often found in coastal environments
and on tidal flats (e.g., Dodson 1990; Meyer 1993; Lockley
1994; Meyer & Thüring 2003; Wright 2005). Some sauropods,
such as Europasaurus and Magyarosaurus, seem to have lived on
islands (Sander et al. 2006; Stein et al. 2010). In the absence of
sufficient terrestrial plants, these sauropods presumably had
to, at least on a short-term basis, rely on marine food resources
such as algae. Because marine C3 plants and algae have higher
d13C values than terrestrial C3 plants (Fig. 4.1), animals feeding
on marine food resources have about 7‰ higher d13C values
than terrestrial animals (Chrisholm et al. 1982).
Consumption of marine food resources should therefore be
recorded in the skeletal apatite by increased d13C values com-
pared to terrestrial C3 plant feeders. The extant herbivorous
sea cow Dugong dugon, for example, has significantly higher
d13C values than all sauropod skeletal remains (Fig. 4.6). Only
the ingestion of three dietary resources could generate such
high skeletal apatite d13C values: (1) terrestrial C4 grasses,
(2) sea grass, and (3) certain marine algae (Cloern et al. 2002;
Clementz et al. 2007). C4 plants evolved in the Tertiary
(Thomasson et al. 1986; Cerling et al. 1997), and thus, no C4
grasses were present in Mesozoic ecosystems; sea grasses did
not evolve before the Late Cretaceous (van der Ham et al.
2007). Therefore, only marine algae with C4-like d13C values
(Fig. 4.1) remain as a possible near-coastal food resource for
Jurassic sauropods.
To test the hypothesis of sauropods that used marine food
resources, bones from Late Jurassic sauropods that lived in
near-coastal settings, such as Cetiosauriscus from Moutier,
Switzerland, and Europasaurus holgeri from Oker, Germany
(Sander et al. 2006), were analyzed for their carbon isotope
composition and compared to those of sauropods from terres-
trial settings (e.g., the Morrison Formation). Despite being fos-
silized in marine near-coastal settings with high d13C values
of the embedding sediments (Tütken, pers. obs.), the Europa-
saurus and Cetiosauriscus bone specimens do not have the in-
creased d13C values typical of marine feeders, but fall well
within the range of other sauropods from terrestrial settings
(Fig. 4.6). Thus, they did not ingest significant amounts of
marine plants, and the bone apatite did not equilibrate with
the carbonate from the embedding marine sediment with high
d13C values. Similarly, the low d13C values of the Brachiosaurus
fossils indicate that this animal did not ingest marine food
plants, although the Tendaguru locality was near the Jurassic
coastline. On the basis of skeletal apatite d13C values, the con-
sumption of significant amounts of marine plants by sau-
ropods can thus be excluded.
Freshwater Feeding?
The diplodocids Apatosaurus and Diplodocus had sufficient
neck flexibility to reach below ground level (Stevens & Parrish
1999, 2005a; Dzemski & Christian 2007; Christian & Dzem-
ski, this volume) to feed on water plants. Because the d13C
values of freshwater and terrestrial C3 plants largely overlap
(Fig. 4.1), a differentiation of feeding on terrestrial versus
freshwater C3 plants is difficult. Some lacustrine plants, how-
ever, have lower d13C values than terrestrial plants (Fig. 4.1).
Therefore, sauropods feeding on freshwater plants may have
lower apatite d13C values than terrestrial feeders. Freshwater
plants were probably restricted to perennial rivers (Parrish et
al. 2004) and may not have been an abundant food source in
the Morrison Formation. Furthermore, the enamel d13C values
of Diplodocus teeth are well within the range of terrestrial C3
plant feeders (Fig. 4.6). Therefore, aquatic feeding does not
seem to have been of major importance in Diplodocus. The
same is true for Apatosaurus, which has even higher enamel
d13C values than Diplodocus (Fig. 4.8).
Conclusions
The carbon isotope composition of living nonangiosperm
plants (gymnosperms, pteridophytes, and horsetails), which
represent the relatives of potential dinosaur food plants, is
similar to angiosperm C3 plants. Thus, the effects of the paleo-
floral change on sauropod feeding behavior and niche shift-
ing toward an angiosperm-dominated ecosystem during the
Cretaceous cannot be detected by means of carbon isotope
analysis. However, the foliage of extant Araucaria and other
conifers as well as cycads have, on average, about 3‰ higher
d13C values than ferns and horsetails. On the basis of these leaf
carbon isotope data, low (fern) browsing sauropods are ex-
pected to have lower apatite d13C values than high (conifer)
browsing and/or low (cycad) browsing taxa.
Carbon isotope compositions of their bones and tooth
enamel suggest that sauropods fed predominantly, if not ex-
clusively, on terrestrial C3 plants. A certain degree of niche
partitioning is likely because the different sauropods display
intertaxon differences in mean enamel and bone d13C values
of about 3‰, while, in contrast, intraspecific and intraindi-
vidual differences are less than 1‰. Thus, presumably no sig-
nificant ontogenetic shift of the diet occurred. Sauropods did
not ingest a significant portion of plants with high C4-plant-
like d13C values, such as marine vascular plants and algae.
However, the consumption of freshwater aquatic plants can-
not be excluded. Sauropods fed on C3 plants with d13C values
increased a few per mil compared to modern C3 plants. The
higher plant d13C values are most likely due to increased at-
mospheric d13CCO2 values and/or feeding on water-stressed C3

74 tütken
plants in drier settings. Beyond this, pinpointing exactly
which food plants were consumed by sauropods by means of
skeletal apatite d13C values is difficult.
On the basis of the difference between mean d13C values
of carbonized Jurassic plant remains and sauropod enamel, a
qd13Capatite-diet value of 16‰ was determined for sauropods.
This value is higher than for large herbivorous mammals but
similar to that of birds; however, it is lower than that of or-
nithischian dinosaurs (Fricke et al. 2008). This suggests that
sauropods may have had a different digestive physiology and
carbon isotope fractionation compared to large herbivorous
mammals and hadrosaurs, possibly as a result of intermediate
rates of methane production during digestion.
Acknowledgments
Special thanks must go to Hans-Jakob Siber (Sauriermuseum
Aathal), Nicole Klein (then Museum für Naturkunde, Berlin),
and Daniela Schwarz-Wings (Museum für Naturkunde, Berlin)
for generously supplying skeletal remains and for permission
to sample sauropod teeth for isotope analysis. Furthermore,
I thank Martin Sander (University of Bonn) for the supply of
all the sauropod bone samples from the Morrison Formation
and the Tendaguru Beds, for the Europasaurus specimens, and
for discussions about sauropod paleobiology; Oliver Wings
(Museum für Naturkunde, Berlin) for the supply of Mamenchi-
saurus specimens; Christian Meyer (Natural History Museum,
Basel) for access to Cetiosauriscus and Plateosaurus bone ma-
terial; and Rainer Schoch (State Museum of Natural History,
Stuttgart) for the sampling of a skull and postcranial material
of Plateosaurus. The botanical gardens of Bonn and Cape Town
as well as the Cologne Zoo are acknowledged for permission
to sample plant leaves for carbon isotope analysis. Jürgen
Hummel and Carole Gee (both University of Bonn) are ac-
knowledged for kindly supplying leaf samples of extant gym-
nosperms, pteridophytes, and horsetails and for some Jurassic
charcoal and fossil plant remains, and for discussions on
Mesozoic plants. Further, I want to thank Sebastian Vieh-
mann (University of Bonn) for sampling and chemical pre-
treatment of sauropod teeth and Bernd Steinhilber (Univer-
sity of Tübingen) for carbon isotope measurements. Finally,
Juliane Hinz (University of Tübingen) is acknowledged for
the graphic reconstructions of Araucaria and the fern Os-
munda. This chapter benefited from the critical comments of
an anonymous reviewer and Carole Gee. This research was
funded by the Deutsche Forschungsgemeinschaft (grant TU
148/1-1) and the Emmy Noether Program (grant TU 148/2-1).
This is contribution number 63 of the DFG Research Unit
533 ‘‘Biology of the Sauropod Dinosaurs: The Evolution of
Gigantism.’’
References
Aberhan, M., Bussert, R., Heinrich, W.-D., Schrank, E.,
Schultka, S., Sames, B., Kriwet, J. & Kapilima, S. 2002. Palaeo-
ecology and depositional environments of the Tendaguru Beds
(Late Jurassic to Early Cretaceous, Tanzania).—Mitteilungen aus
dem Museum für Naturkunde in Berlin, Geowissenschaftliche Reihe
5: 19–44.
Ambrose, S. H. & Norr, L. 1993. Experimental evidence for the
relationship of the carbon isotope ratios of whole diet and
dietary protein to those of bone collagen and carbonate. In
Lambert, J. B. & Grupe, G. (eds.). Prehistoric Human Bone—
Archaeology at the Molecular Level. Springer Verlag, Berlin:
pp. 1–37.
Arens, N. C., Jahren A. H. & Amundson R. 2000. Can C3 plants
faithfully record the carbon isotopic composition of atmo-
spheric carbon dioxide?—Paleobiology 26: 137–164.
Ayer, J. 1999. The Howe Ranch Dinosaurs. Sauriermuseum Aathal,
Switzerland.
Ayliffe, L. K., Chivas, A. R. & Leakey, M. G. 1994. The retention of
primary oxygen isotope compositions of fossil elephant skeletal
phosphate.—Geochimica et Cosmochimica Acta 58: 5291–5298.
Bakker, R. T. 1971. Ecology of the brontosaurs.—Nature 229: 172–
174.
Bakker, T. B. 1978. Dinosaur feeding behaviour and the origin of
flowering plants.—Nature 274: 661–663.
Barrett, P. M. & Upchurch, P. 1994. Feeding mechanisms of
Diplodocus.—Gaia 10: 195–204.
Barrett, P. M. & Upchurch, P. 2005. Sauropod diversity through
time: macroevolutionary and paleoecological implications. In
Curry Rogers, K. A. & Wilson, J. A. (eds.). The Sauropods: Evolu-
tion and Paleobiology. University of California Press, Berkeley:
pp. 125–156.
Barrett, P. M. & Willis, K. J. 2001. Did dinosaurs invent flowers?
Dinosaur–angiosperm coevolution revisited.—Biological
Reviews 76: 411–447.
Bender, M. M. 1971. Variations in the 13C/12C ratios of plants in
relation to the pathway of photosynthetic carbon dioxide
fixation.—Phytochemistry 10: 1239–1244.
Bocherens, H., Friis, E. M., Mariotti, A. & Pedersen, K. R. 1993.
Carbon isotopic abundances in Mesozoic and Cenozoic fossil
plants: palaeoecological implications.—Lethaia 26: 347–358.
Botha, J., Lee-Thorp, J. & Chinsamy, A. 2005. The palaeoecology
of the nonmammalian cynodonts Diademodon and Cynog-
nathus from the Karoo Basin of South Africa, using stable light
isotope analysis.—Palaeogeography, Palaeoclimatology, Palaeo-
ecology 223: 303–316.
Buffetaut, E., Suteethorn, V., Le Loeuff, J., Cuny, C., Tong, H. &
Khansubha, S. 2002. The first giant dinosaurs: a large sauropod
from the Late Triassic of Thailand.—Comptes Rendue Palevol
1: 103–109.
Boutton, T. W. 1991. Stable carbon isotope ratios of natural ma-
terials: II. Atmospheric, terrestrial, marine, and freshwater
environments. In Coleman, D. C. & Fry, B. (eds.). Carbon Iso-
tope Techniques. Academic Press, New York: pp. 173–185.

Diet of Sauropod Dinosaurs 75
Bussert, R., Heinrich, W.-D. & Aberhan, M. 2009. The Tendaguru
Formation (Late Jurassic to Early Cretaceous, southern Tan-
zania): definition, palaeoenvironments, and sequence stratig-
raphy.—Fossil Record 12: 141–174.
Cerling, T. E. & Harris, J. M. 1999. Carbon isotope fractionation
between diet and bioapatite in ungulate mammals and
implications for ecological and paleoecological studies.—
Oecologica 120: 347–363.
Cerling, T. E., Wang, Y. & Quade, J. 1993. Expansion of C4 eco-
systems as an indicator of global ecological change in the late
Miocene.—Nature 361: 344–345.
Cerling, T. E., Harris, J. M., MacFadden, B. J., Leakey, M. G.,
Quade, J., Eisenmann, V. & Ehleringer, J. R. 1997. Global vege-
tation change through the Miocene/Pliocene boundary.—
Nature 389: 153–158.
Cerling, T. E., Hart, J. A. & Hart, T. B. 2004. Stable isotope ecology
in the Ituri Forest.—Oecologia 138: 5–12.
Chrisholm, B. S., Nelson D. E. & Schwarz, H. P. 1982. Stable-
carbon isotope ratios as a measure of marine versus terrestrial
protein in ancient diet.—Science 216: 1131–1132.
Christian, A. & Dzemski, G. This volume. Neck posture in sauro-
pods. In Klein, N., Remes, K., Gee, C. T. & Sander, P. M. (eds.).
Biology of the Sauropod Dinosaurs: Understanding the Life of
Giants. Indiana University Press, Bloomington: pp. 251–260.
Clementz, M. T., Goswami, A., Gingerich, P. D. & Koch, P. L.
2006. Isotopic records from early whales and sea cows: con-
trasting patterns of ecological transition.—Journal of Vertebrate
Paleontology 26: 355–370.
Clementz, M., Koch, P. L. & Beck, C. A. 2007. Diet induced differ-
ences in carbon isotope fractionation between sirenians and
terrestrial ungulates.—Marine Biology 151: 1773–1784.
Cloern, J. E., Canuel, E. A. & Harris, D. 2002. Stable carbon and
nitrogen isotope composition of aquatic and terrestrial plants
of the San Francisco Bay estuarine system.—Limnology and
Oceanography 47: 713–729.
Coe, M. J., Dilcher, D. L., Farlow, J. O., Jarzen, D. H. & Russell,
D. A. 1987. Dinosaurs and land plants. In Friis, E. M., Chaloner,
W. G. & Crane, P. R. (eds.). The Origins of Angiosperms and Their
Biological Consequences. Cambridge University Press, Cam-
bridge: pp. 225–258.
Cojan, I., Renard, M. & Emmanuel, L. 2003. Palaeoenvironmen-
tal reconstruction of dinosaur nesting sites based on a geo-
chemical approach to eggshells and associated palaeosols
(Maastrichtian, Provence Basin, France).—Palaeogeography, Pa-
laeoclimatology, Palaeoecology 191: 111–138.
Coplen, T. B. 1994. Reporting of stable hydrogen, carbon, and
oxygen isotopic abundances.—Pure Applied Chemistry 66: 273–
276.
Curry, K. A. 1999. Ontogenetic histology of Apatosaurus (Dino-
sauria: Sauropoda): new insights on growth rates and
longevity.—Journal of Vertebrate Paleontology 19: 654–665.
Decker, J. E. & de Wit, M. J. 2006. Carbon isotope evidence
for CAM photosynthesis in the Mesozoic.—Terra Nova 18:
9–17.
Deines, P. 1980. The isotopic composition of reduced organic car-
bon. In Fritz, P. & Fontes, J. C. (eds.). Handbook of Environmental
Isotope Geochemistry. Elsevier, New York: pp. 331–406.
DeNiro, M. J. & Epstein, S. 1978. Influence of diet on the distri-
bution of carbon isotopes in animals.—Geochimica et Cosmo-
chimica Acta 42: 495–506.
DeNiro, M. J. & Epstein, S. 1981. Influence of diet on the distri-
bution of nitrogen isotopes in animals.—Geochimica et Cosmo-
chimica Acta 45: 341–351.
DeNiro, M. J. & Hastorf, C. A. 1985. Alteration of 15N/14N and13C/12C ratios of plant matter during the initial stages of dia-
genesis: studies utilising archaeological specimens from Peru.—
Geochimica et Cosmochimica Acta 49: 97–115.
D’Emic, M., Wilson, J. & Fisher, D. 2009. The evolution of tooth
replacement rates in sauropod dinosaurs.—Journal of Vertebrate
Paleontology 29: 84A.
Dodson, P. 1990. Sauropod paleoecology. In Weishampel, D. B.,
Dodosn, P. & Osmólka, H. (eds.). The Dinosauria. University of
California Press, Berkeley: pp. 402–407.
Dodson, P., Behrensmeyer, A. K., Bakker, R. T. & McIntosh, J. S.
1980. Taphonomy and paleoecology of the dinosaur beds of
the Jurassic Morrison Formation.—Paleobiology 6: 208–232.
Dzemski, G. & Christian, A. 2007. Flexibility along the neck of
the ostrich (Struthio camelus) and consequences for the recon-
struction of dinosaurs with extreme neck length.—Journal of
Morphology 268: 701–714.
Ehleringer, J. R., Field, C. B., Lin, Z. F. & Kuo, C. Y. 1986. Leaf car-
bon isotope and mineral-composition in subtropical plants
along an irradiance cline.—Oecologia 70: 520–526.
Ehleringer, J. R., Sage, R. F., Flanagan, L. B. & Pearcy, R. W. 1991.
Climate change and the evolution of C4 photosynthesis.—
Trends in Ecology and Evolution 6: 95–99.
Engelmann, G. F., Chure, D. J. & Fiorillo, A. R. 2004. The implica-
tions of a dry climate for the paleoecology of the fauna of the
Upper Jurassic Morrison Formation.—Sedimentary Geology 167:
297–308.
Erben, H. K., Hoefs, J. & Wedepohl, K. H. 1979. Paleobiological
and isotopic studies of eggshells from a declining dinosaur
species.—Paleobiology 5: 380–414.
Erickson, G. M. 1996. Incremental lines of von Ebner in dino-
saurs and the assessment of tooth replacement rates using
growth line counts.—Proceedings of the National Academy of Sci-
ences of the United States of America 93: 14623–14627.
Farquhar, G. D., Ehleringer, J. R. & Hubrick, K. T. 1989. Carbon
isotope fractionation and photosynthesis.—Annual Reviews of
Plant Physiology and Molecular Biology 44: 503–537.
Feranec, R. S. 2007. Stable carbon isotope values reveal evidence
of resource partitioning among ungulates from modern C3-
dominated ecosystems in North America.—Palaeogeography,
Palaeoclimatology, Palaeoecology 252: 575–585.
Feranec, R. S. & MacFadden, B. J. 2006. Isotopic discrimination of
resource partitioning among ungulates in C3-dominated com-
munities from the Miocene of Florida and California.—
Paleobiology 32: 190–205.
Fiorillo, A. R. 1991. Dental microwear on the teeth of Camara-
saurus and Diplodocus: implications for sauropod paleoecology.

76 tütken
—Contributions of the Palaeontological Museum, University of Oslo
364: 23–24.
Fiorillo, A. R. 1998. Dental microwear patterns of the sauropod
dinosaurs Camarasaurus and Diplodocus: evidence for resource
partitioning in the Late Jurassic of North America.—Historical
Biology 13: 1–16.
Folinsbee, R. E., Fritz, P., Krouse, H. R. & Robblee, A. R. 1970. Car-
bon-13 and oxygen-18 in dinosaur, crocodile, and bird egg-
shells indicate environmental conditions.—Nature 168: 1353–
1356.
Foster, J. 2007. Jurassic West: The Dinosaurs of the Morrison Forma-
tion and Their World. Indiana University Press, Bloomington.
Fricke, H. C. 2007. Stable isotope geochemistry of bonebed fos-
sils: reconstructing paleoenvironments, paleoecology, and pa-
leobiology. In Rogers, R. R., Eberth, D. A. & Fiorillo, A. R. (eds.).
Bonebeds: Genesis, Analysis, and Paleobiological Significance. Uni-
versity of Chicago Press, Chicago: pp. 437–490.
Fricke, H. C. & Pearson, D. A. 2008. Stable isotope evidence for
changes in dietary niche partitioning among hadrosaurian
and ceratopsian dinosaurs of the Hell Creek Formation.—
Paleobiology 34: 534–552.
Fricke, H. C. & Rogers, R. R. 2000. Multiple taxon–multiple
locality approach to providing oxygen isotope evidence for
warm-blooded theropod dinosaurs.—Geology 28: 799–802.
Fricke, H. C., Rogers, R. R., Backlund, R., Dwyer, C. N. & Echt, S.
2008. Preservation of primary stable isotope signals in dino-
saur remains, and environmental gradients of the Late Creta-
ceous of Montana and Alberta.—Palaeogeography, Palaeoclima-
tology, Palaeoecology 266: 13–27.
Fricke, H. C., Rogers, R. R. & Gates, T. A. 2009. Hadrosaurid
migration: inferences based on stable isotope comparisons
among Late Cretaceous dinosaur localities.—Paleobiology 35:
270–288.
Friedli, H., Lotscher, H., Oeschger, H., Siegenthaler, U. &
Stauver, B. 1986. Ice core record of the 13C/12C ratio of atmo-
spheric CO2 in the past two centuries.—Nature 324: 237–238.
Gee, C. T. This volume. Dietary options for the sauropod dino-
saurs from an integrated botanical and paleobotanical perspec-
tive. In Klein, N., Remes, K., Gee, C. T. & Sander, P. M. (eds.).
Biology of the Sauropod Dinosaurs: Understanding the Life of
Giants. Indiana University Press, Bloomington: pp. 34–56.
Ghosh, P., Bhattacharya, S. K., Sahni, A., Kar, R. K., Mohabey,
D. M. & Ambwani, K. 2003. Dinosaur coprolites from the Late
Cretaceous (Maastrichtian) Lameta Formation of India: iso-
topic and other markers suggesting a C3 plant diet.—Cretaceous
Research 24: 743–750.
Gröcke, D. R. 2002. The carbon isotope composition of ancient
CO2 based on higher-plant organic matter.—Philosophical
Transactions of the Royal Society A: Mathematical, Physical and
Engineering Sciences 360: 633–658.
Haas, G. 1963. A proposed reconstruction of the jaw musculature
of Diplodocus.—Annals of the Carnegie Museum of Natural History
36: 139–157.
Heaton, T. H. E. 1999. Spatial, species, and temporal variations
in the 13C/12C ratios of C3 plants: implications for palaeodiet
studies.–Journal of Archaeological Science 26: 637–649.
Hemminga, M. A. & Mateo, M. A. 1996. Stable carbon isotopes in
seagrasses: variability in ratios and use in ecological studies.—
Marine Ecology Progress Series 140: 285–298.
Herwartz, D., Tütken, T., Münker, C., Jochum, K.-P., Stoll, B. &
Sander, P. M. 2010. Timescales and mechanisms of REE and Hf
uptake in fossil bones.—Geochimica et Cosmochimica Acta. doi:
10.1016/j.gca.2010.09.036.
Hinz, J. K., Smith, I., Pfretzschner, H.-U., Wings, O. & Sun, G.
2010. A high-resolution three-dimensional reconstruction of a
fossil forest (Upper Jurassic and Shishugou Formation, Junggar
Basin, Northwest China).—Palaeobiodiversity and Palaeoenviron-
ments 90: 215–240.
Hoefs, J. 2008. Stable Isotope Geochemistry. Springer, Berlin.
Holland, W. J. 1924. The skull of Diplodocus.—Memoires of the Car-
negie Museum 9: 379–403.
Hubert, J. F., Panish, P. T., Chure, D. J. & Prostak, K. S. 1996.
Chemistry, microstructure, petrology and diagenetic model
of Jurassic dinosaur bones, Dinosaur National Monument,
Utah.—Journal of Sedimentary Research 66: 531–547.
Hummel, J. & Clauss, M. This volume. Sauropod feeding and
digestive physiology. In Klein, N., Remes, K., Gee, C. T. &
Sander, P. M. (eds.). Biology of the Sauropod Dinosaurs: Under-
standing the Life of Giants. Indiana University Press, Bloom-
ington: pp. 11–33.
Hummel, J., Gee, C., Südekum, K.-H., Sander, P. M., Nogge, G. &
Clauss, M. 2008. In vitro digestibility of fern and gymnosperm
foliage: implications for sauropod feeding ecology and diet
selection.—Proceedings of the Royal Society B: Biological Sciences
275: 1015–1021.
Johnson, B. J., Fogel, M. L. & Miller, G. H. 1998. Stable isotopes
in modern ostrich eggshell: a calibration for paleoenviron-
mental applications in semi-arid regions of southern Africa.—
Geochimica et Cosmochimica Acta 62: 2451–2461.
Keeley, J. E. & Rundel, P. W. 2003. Evolution of CAM and C4
carbon-concentration mechanisms.—International Journal of
Plant Sciences 164: 55–77.
Keeley, J. E. & Sandquist, D. R. 1992. Carbon: freshwater plants
[commissioned review].–Plant, Cell and Environment 15: 1021–
1035.
Klein, N. & Sander, P. M. 2008. Ontogenetic stages in the long
bone histology of sauropod dinosaurs.—Paleobiology 34: 247–
263.
Koch, P. L. 1998. Isotopic reconstruction of past continental
environments.—Annual Reviews in Earth and Planetary Science
26: 573–613.
Koch, P. L. 2007. Isotopic study of the biology of modern and fos-
sil vertebrates. In Michener, R. & Lajtha, K. (eds.).—Stable Iso-
topes in Ecology and Envrionmental Science. Blackwell, Malden,
Mass.: pp. 99–154.
Koch, P. L., Tuross, N. & Fogel, M. L. 1997. The effects of sample
treatment and diagenesis on the isotopic integrity of carbonate
in biogenic hydroxylapatite.—Journal of Archaeological Science
24: 417–429.
Kohn, M. J. & Law, J. M. 2006. Stable isotope chemistry of fossil
bone as a new paleoclimate indicator.—Geochimica et Cosmo-
chimica Acta 70: 931–946.

Diet of Sauropod Dinosaurs 77
Kohn, M. J., Schoeninger, M. J. & Barker, W. B. 1999. Altered
states: effects of diagenesis on fossil tooth chemistry.—
Geochimica et Cosmochimica Acta 63: 2737–2747.
Kohn, M. J. & Cerling, T. E. 2002. Stable isotope compositions of
biological apatite. In Kohn, M. J., Rakovan, J. & Hughes, J. M.
(eds.).—Phosphates: Geochemical, Geobiological, and Materials
Importance. Reviews in Mineralogy and Geochemistry. Mineralogi-
cal Society of America, Washington, D.C.: pp. 455–488.
Kohn, M. J., McKay, M. P. & Knight, J. L. 2005. Dining in the
Pleistocene—who’s on the menu?—Geology 33: 649–652.
Kolodny, Y., Luz, B., Sander, M. & Clemens, W. A. 1996. Dinosaur
bones: fossils or pseudomorphs? The pitfalls of physiology
reconstruction from apatitic fossils.—Palaeogeography, Palaeo-
climatology, Palaeoecology 126: 161–171.
Lee-Thorp, J. A. & Sponheimer, M. 2005. Opportunities and con-
straints for reconstructing palaeoenvironments from stable
light isotope ratios in fossils.—Geological Quarterly 49: 195–204.
Lee-Thorp, J. A. & van der Merwe, N. J. 1987. Carbon isotope
analysis of fossil bone apatite.—South African Journal of Science
83: 712–715.
Lockley, M. G. 1994. Dinosaur ontogeny and population struc-
ture: interpretations and speculations based on fossil foot-
prints. In Carpenter, K. & Currie, P. J. (eds.). Dinosaur System-
atics: Approaches and Perspectives. Cambridge University Press,
Cambridge: pp. 211–220.
MacFadden, B. J. & Higgins, P. 2004. Ancient ecology of 15-
million-year-old browsing mammals within C3 plant commu-
nities from Panama.—Oecologia 140: 169–182.
MacFadden, B., Solounias, N. & Cerling, T. E. 1999. Ancient diets,
ecology, and extinction of 5-million-year-old horses from
Florida.—Science 283: 824–827.
McCrea, J. M. 1950. On the isotopic chemistry of carbonates and
a paleo-temperature scale.—Journal of Chemical Physics 18: 849–
857.
Meyer, C. A. 1993. A sauropod dinosaur megatracksite from the
Late Jurassic of northern Switzerland.—Ichnos 3: 29–38.
Meyer, C. A. & Thüring, B. 2003. Dinosaurs of Switzerland.—
Comptes Rendus Palevol 2: 103–117.
Mohabey, D. M. 2005. Late Cretaceous (Maastrichtian) nests,
eggs, and dung mass (coprolites) of sauropods (titanosaurs)
from India. In Curry Rogers K. A. & Wilson, J. A. (eds.). The
Sauropods: Evolution and Paleobiology. University of California
Press, Berkeley: pp. 467–489.
Mohabey, D. M. & Samant, B. 2003. Floral remains from Late
Cretaceous fecal mass of sauropods from central India:
implications to their diet and habitat.—Gondwana Geological
Magazine, Special Volume 6: 225–238.
Nelson, B. K., DeNiro, M. J., Schoeninger, M. J., DePaolo, D. J. &
Hare, P. E. 1986. Effects of diagenesis on strontium, carbon,
nitrogen and oxygen concentration and isotopic composition
of bone.—Geochimica et Cosmochimica Acta 50: 1941–1949.
Nguyen Tu, T. T., Bocherens, H., Mariotti, A., Baudin, F., Pons, D.,
Broutin, J., Derenne, S. & Largeau, C. 1999. Ecological distri-
bution of Cenomanian terrestrial plants based on 13C/12C
ratios.—Palaeogeography, Palaeoclimatology, Palaeoecology 145:
79–93.
O’Leary, M. H. 1988. Carbon isotopes in photosynthesis.—
BioScience 38: 328–336.
Ong, B. L., Kluge, M. & Friemert, V. 1986. Crassulacean acid
metabolism in the epiphytic ferns Drymoglossum piloselloides
and Pyrrosia longifolia: studies on responses to environmental
signals.—Plant, Cell and Environment 9: 547–557.
Ostrom, P. H., Macko, S. A., Engel, M. H. & Russell, D. A. 1993. As-
sessment of trophic structure of Cretaceous communities based
on stable nitrogen isotope analyses.—Geology 21: 491–494.
Owen-Smith, R. N. 1988. Megaherbivores: The Influence of Large
Body Size on Ecology. Cambridge University Press, Cambridge.
Passey, B. J., Robinson, T. F., Ayliffe, L. K., Cerling, T. E., Spon-
heimer, M., Dearing, M. D., Roeder, B. L. & Ehleringer, J. R.
2005. Carbon isotope fractionation between diet, breath CO2,
and bioapatite in different mammals.—Journal of Archaeological
Science 32: 1459–1470.
Park, R. & Epstein, S. 1960. Carbon isotope fractionation during
photosynthesis.—Geochimica et Cosmochimica Acta 21: 110–
126.
Parrish, J. T., Peterson, F. & Turner, C. E. 2004. Jurassic ‘‘savan-
nah’’-plant taphonomy and climate of the Morrison Forma-
tion (Upper Jurassic, Western USA).—Sedimentary Geology 167:
137–162.
Paul, G. S. 1998. Terramegathermy and Cope’s rule in the land of
titans.—Modern Geology 23: 179–217.
Prasad, V., Strömberg, C. A. E., Alimohammadian, H. & Sahni, A.
2005. Dinosaur coprolites and the early evolution of grasses
and grazers.—Science 310: 1177–1180.
Pucéat, E., Reynard, B. & Lécuyer, C. 2004. Can crystallinity be
used to determine the degree of chemical alteration of biogenic
apatites.—Chemical Geology 205: 83–97.
Rees, P. M., Noto, C. R., Parrish, J. M. & Parrish, J. T. 2004. Late
Jurassic climates, vegetation, and dinosaur distributions.—
Journal of Geology 112: 643–653.
Sackett, W. M., Eckelmann, W. R., Bender, M. C. & Be, A. W. H.
1965. Temperature dependence of carbon isotope composition
in marine plankton and sediment.—Science 148: 235–237.
Sander, P. M. 1999. Life history of the Tendaguru sauropods as
inferred from long bone histology.—Mitteilungen aus dem
Museum für Naturkunde in Berlin, Geowissenschaftliche Reihe
2: 103–112.
Sander, P. M. & Tückmantel, C. 2003. Bone lamina thickness,
bone apposition rates, and age estimates in sauropod humeri
and femora.—Paläontologische Zeitschrift 76: 161–172.
Sander, P. M., Mateus, O., Laven, T. & Knötschke, N. 2006. Bone
histology indicates insular dwarfism in a new Late Jurassic sau-
ropod dinosaur.—Nature 441: 739–741.
Sander, P. M., Christian, A. & Gee, C. T. 2009. Sauropods kept
their heads down. Response.—Science 323: 1671–1672.
Sander, P. M., Christian, A., Clauss, M., Fechner, R., Gee, C. T.,
Griebeler, E. M., Gunga, H.-C., Hummel, J., Mallison, H.,
Perry, S., Preuschoft, H., Rauhut, O., Remes, K., Tütken, T.,
Wings, O. & Witzel, U. 2010a. Biology of the sauropod dino-
saurs: the evolution of gigantism.—Biological Reviews of the
Cambridge Philosophical Society. doi: 10.1111/j.1469=185X
.2010.00137.x.
78 tütken
Sander, P. M., Gee, C. T., Hummel, J. & Clauss, M. 2010b. Meso-
zoic plants and dinosaur herbivory. In Gee, C. T. (ed.). Plants in
Mesozoic Time: Morphological Innovations, Phylogeny, Ecosystems.
Indiana University Press, Bloomington: 331–359.
Sarkar, A., Bhattacharya, S. K. & Mohabey, D. M. 1991. Stable iso-
tope analyses of dinosaur egg shells: palaeoenvironmental
implications.—Geology 19: 1068–1071.
Schleser, G. H., Frielingsdorf, J. & Blair, A. 1999. Carbon isotope
behaviour in wood and cellulose during artificial aging.—
Chemical Geology 158: 121–130.
Schoeninger, M. J. & DeNiro, M. J. 1982. Carbon isotope ratios of
apatite from fossil bone cannot be used to reconstruct diets of
animals.—Nature 297: 557–578.
Schrank, E. 2010. Pollen and spores from the Tendaguru Beds,
Upper Jurassic and Lower Cretaceous of southeast Tanzania:
palynological and paleoecological implications.—Palynology
43: 3–42.
Schweitzer, M. H., Wittmeyer, J. L., Horner, J. L. & Toporski, J. K.
2005. Soft-tissue vessels and cellular preservation in Tyran-
nosaurus rex.—Science 307: 1952–1954.
Schweitzer, M. H., Suo, Z., Avci, R., Asara, J. M., Allen, M. A., Arce,
F. T. & Horner, J. R. 2007. Analyses of soft tissue from Tyranno-
saurus rex suggest the presence of protein.—Science 316: 277–
280.
Smith, B. N. & Epstein, S. 1971. Two categories of 13C/12C ratios
for higher plants.—Plant Physiology 47: 380–384.
Spötl, C. & Vennemann, T. W. 2003. Continuous-flow IRMS anal-
ysis of carbonate minerals.—Rapid Communications in Mass
Spectrometry 17: 1004–1006.
Stanton Thomas, K. J. & Carlson, S. J. 2004. Microscale d18O and
d13C isotopic analysis of an ontogenetic series of the hadro-
saurid dinosaur Edmontosaurus: implications for physiology
and ecology.—Palaeogeography, Palaeoclimatology, Palaeoecology
206: 257–287.
Stein, K., Csikib, Z., Curry Rogers, K., Weishampel, D. B., Redel-
storff, R., Carballidoa, J. L. & Sander, P. M. 2010. Small body
size and extreme cortical bone remodelling indicate phyletic
dwarfism in Magyarosaurus dacus (Sauropoda: Titanosauria).—
Proceedings of the National Academy of Sciences of the United
States of America 107: 9258–9263.
Stevens, K. A. & Parrish, J. M. 1999. Neck posture and feeding hab-
its of two Jurassic sauropod dinosaurs.—Science 284: 798–800.
Stevens, K. A. & Parrish, J. M. 2005a. Neck posture, dentition,
and feeding strategies in Jurassic sauropod dinosaurs. In Tid-
well, V. & Carpenter, K. (eds.). Thunder-Lizards: The Sau-
ropodomorph Dinosaurs. Indiana University Press, Bloom-
ington: pp. 212–232.
Stevens, K. A. & Parrish, J. M. 2005b. Digital reconstructions of
sauropod dinosaurs and implications for feeding. In Curry
Rogers, K. A. & Wilson, J. A. (eds.). The Sauropods: Evolution and
Paleobiology. University of California Press, Berkeley: pp. 178–
200.
Straight, W. H., Barrick, R. E. & Eberth, D. A. 2004. Reflections of
surface water, seasonality and climate in stable oxygen iso-
topes from tyrannosaurid tooth enamel.—Palaeogeography, Pa-
laeoclimatology, Palaeoecology 206: 239–256.
Taggert, R. E. & Cross, A. T. 1997. The relationship between land
plant diversity and productivity and patterns of dinosaur her-
bivory. In Wolberg, D. L., Stump, E. & Rosenberg, G. D. (eds.).
Dinofest International. Academy of Natural Sciences, Phila-
delphia: pp. 403–416.
Tieszen, L. L. 1991. Natural variations in the carbon isotope
values of plants: implications for archaeology, ecology and
paleoecology.—Journal of Archaeological Science 18: 227–248.
Tieszen, L. L. & Fagre, T. 1993. Effect of diet quality and composi-
tion on the isotopic composition of respiratory CO2, bone col-
lagen, bioapatite and soft tissues. In Lambert, J. B. & Grupe, G.
(eds.). Prehistoric Human Bone: Archaeology at the Molecular
Level. Springer Verlag, Berlin: pp. 121–155.
Tiffney, B. H. 1997. Land plants as food and habitat in the Age of
Dinosaurs. In Farlow, J. O. & Brett-Surman, M. K. (eds.). The
Complete Dinosaur. Indiana University Press, Bloomington:
pp. 352–370.
Trueman, C. N. 1999. Rare earth element geochemistry and ta-
phonomy of terrestrial vertebrate assemblages.—Palaios 14:
555–568.
Trueman, C. N. G. & Tuross, N. 2002. Trace elements in recent
and fossil bone apatite.—Reviews in Mineralogy and Geochemistry
48: 489–521.
Trueman, C. N. G., Chenery, C., Eberth, D. A. & Spiro, B. 2003.
Diagenetic effects on the oxygen isotope composition of bones
of dinosaurs and other vertebrates recovered from terrestrial
and marine sediments.—Journal of the Geological Society 160:
895–901.
Trueman, C. N. G., Behrensmeyer, A. K., Tuross, N. & Weiner, S.
2004. Mineralogical and compositional changes in bones
exposed on soil surfaces in Amboseli National Park, Kenya:
diagenetic mechanisms and the role of sediment pore fluids.—
Journal of Archaeological Science 31: 721–739.
Thomasson, J. R., Nelson, M. E. & Zakrzewski, R. J. 1986. A fossil
grass (Gramineae: Chloridoideae) from the Miocene with
Kranz anatomy.—Science 233: 876–878.
Tütken, T. 2003. Die Bedeutung der Knochenfrühdiagenese für die
Erhaltungsfähigkeit in vivo erworbener Element-und Isotopenzu-
sammensetzungen in fossilen Knochen. Ph.D. Dissertation.
Eberhard-Karls Universität, Tübingen.
Tütken, T. & Vennemann, T. 2009. Stable isotope ecology of
Miocene large mammals from Sandelzhausen, southern
Germany.—Paläontologische Zeitschrift 83: 207–226.
Tütken, T., Pfretzschner, H.-U., Vennemann, T. W., Sun, G. &
Wang, Y. D. 2004. Paleobiology and skeletochronology of
Jurassic dinosaurs: implications from the histology and oxygen
isotope compositions of bones.—Palaeogeography, Palaeoclima-
tology, Palaeoecology 206: 217–238.
Tütken, T., Sander, M., Hummel, J. & Gee, C. 2007. Ernährung
und Mobilität von Sauropoden: Informationspotential der
Isotopenzusammensetzung von Knochen und Zähnen.—
Hallesches Jahrbuch der Geowississenschaften, Beiheft 23:
85–92.
Tütken, T., Vennemann, T. W. & Pfretzschner, H.-U. 2008. Early
diagenesis of bone and tooth phosphate in fluvial and marine
settings: constraints from combined oxygen isotope, nitrogen
Diet of Sauropod Dinosaurs 79
and REE analysis.—Palaeogeography, Palaeoclimatology, Palaeo-
ecology 266: 254–268.
Tütken, T. 2010. Die Isotopenanalyse fossiler Skelettreste: Be-
stimmung der Herkunft and Mobilität von Menschen und
Tieren. In Meller, H. & Alt, K. W. (eds.). Anthropologie, Isotopie
und DNA: Biografische Annäherung an namenlose vor-
geschichtliche Skelette. Tagungsband 2. Mitteldeutscher
Archäologentag.—Tagungen des Landesmuseums für Vor-
geschichte Halle, Band 3: 33–51.
Turney, C. S. M., Wheeler, D. & Chivas A. R. 2006. Carbon iso-
tope fractionation in wood during carbonization.—Geochimica
et Cosmochimica Acta 70: 960–964.
Upchurch, P. & Barrett, P. M. 2000. The evolution of sauropod
feeding. In Sues, H.-D. (ed.). Evolution of Herbivory in Terrestrial
Vertebrates: Perspectives from the Fossil Record. Cambridge Uni-
versity Press, Cambridge: pp. 79–122.
Upchurch, P., Barrett, P. M. & Dodson, P. 2004. Sauropoda. In
Weishampel D. B., Dodson, P. & Osmólska, H. (eds.). The Dino-
sauria. 2nd edition. University of California Press, Berkeley:
pp. 259–322.
van der Ham, R. W. J. M., van Konijnenburg-van Cittert, J. H. A.
& Indeherberge, L. 2007. Seagrass foliage from the Maastrich-
tian type area (Maastrichtian, Danian; NE Belgium, SE Nether-
lands).—Review of Palaeobotany and Palynology 144: 301–321.
van der Merwe, N. J. & Medina, E. 1991. The canopy effect, car-
bon isotope ratios and foodwebs in Amazonia.—Journal of
Archaeological Science 18: 249–259.
von Schirnding, Y., van der Merwe, N. J. & Vogel, J. C. 1982.
Influence of diet and age on carbon isotope ratios in ostrich
eggshell.—Archaeometry 24: 3–20.
Vovides, A. P., Etherington, J. R., Dresser, P. Q., Groenhof, A.,
Iglesias, C. & Ramirez, J. F. 2002. CAM-cycling in the cycad
Dioon edule Lindl. in its natural tropical deciduous forest habi-
tat in central Veracruz, Mexico.—Botanical Journal of the Lin-
nean Society 138: 155–162.
Wang, Y. & Cerling, T. E. 1994. A model of fossil tooth and bone
diagenesis: implications for paleodiet reconstruction from sta-
ble isotopes.—Palaeogeography, Palaeoclimatology, Palaeoecology
107: 281–289.
Weaver, J. C. 1983. The improbable endotherm: energetics of the
sauropod dinosaur Brachiosaurus.—Paleobiology 9: 173–182.
Weishampel, D. B., Barrett, P. M., Coria, R. A., Le Loeuff, J., Xu,
X., Zhao X., Sahni, A., Gomani, E. M. P. & Noto, C. R. 2004.
Dinosaur distribution. In Weishampel, D. B., Dodson, P. &
Osmólska H. (eds.). The Dinosauria. 2nd edition. University of
California Press, Berkeley: pp. 517–607.
Wilson, J. A. 2002. Sauropod dinosaur phylogeny: critique and
cladistic analysis.—Zoological Journal of the Linnean Society of
London 136: 217–276.
Wright, J. L. 2005. Steps in understanding sauropod biology: the
importance of sauropod tracks. In Curry Rogers, K. A. &
Wilson, J. A. (eds.). The Sauropods: Evolution and Paleobiology.
University of California Press, Berkeley: pp. 252–284.
Zanazzi, A. & Kohn, M. 2008. Ecology and physiology of White
River mammals based on stable isotope ratios of teeth.—
Palaeogeography, Palaeoclimatology, Palaeoecology 257: 22–37.
View publication statsView publication stats