the development of lightweight cellular structures for
TRANSCRIPT

1
The Development of Lightweight Cellular Structures for
Metal Additive Manufacturing
Submitted by Ahmed Yussuf Hussein to the University of Exeter
as a thesis for the degree of
Doctor of Philosophy in Engineering
In November 2013
This thesis is available for Library use on the understanding that it is copyright
material and that no quotation from the thesis may be published without proper
acknowledgement.
I certify that all material in this thesis which is not my own work has been
identified and that no material has previously been submitted and approved for
the award of a degree by this or any other University.
Signature: …………………………………………………………..
2
Abstract
Metal Additive Manufacturing (AM) technologies in particular powder bed
fusion processes such as Selective Laser Melting (SLM) and Direct Metal Laser
Sintering (DMLS) are capable of producing a fully-dense metal components
directly from computer-aided design (CAD) model without the need of tooling.
This unique capability offered by metal AM has allowed the manufacture of
inter-connected lattice structures from metallic materials for different
applications including, medical implants and aerospace lightweight components.
Despite the many promising design freedoms, metal AM still faces some major
technical and design barriers in building complex structures with overhang
geometries. Any overhang geometry which exceeds the minimum allowable
build angle must be supported. The function of support structure is to prevent
the newly melted layer from curling due to thermal stresses by anchoring it in
place. External support structures are usually removed from the part after the
build; however, internal support structures are difficult or impossible to remove.
These limitations are in contrast to what is perceived by designers as metal
AM being able to generate all conceivable geometries. Because support
structures consume expensive raw materials, use a considerable amount of
laser consolidation energy, there is considerable interest in design optimisation
of support structure to minimize the build time, energy, and material
consumption. Similarly there is growing demand of developing more advanced
and lightweight cellular structures which are self-supporting and manufacturable
in wider range of cell sizes and volume fractions using metal AM.
The main focuses of this research is to tackle the process limitation in metal
AM and promote design freedom through advanced self-supporting and low-
density Triply Periodic Minimal Surface (TPMS) cellular structures. Low density
uniform, and graded, cellular structures have been developed for metal AM
processes. This work presents comprehensive experimental test conducted in
SLM and DMLS processes using different TPMS cell topologies and materials.
This research has contributed to new knowledge in understanding the
manufacturability and mechanical behaviour of TPMS cellular structures with
varying cell sizes, orientations and volume fractions. The new support structure
method will address the saving of material (via low volume cellular structures
and easy removal of powder) and saving of energy (via reduced build-time).
3
List of Contents
Abstract ............................................................................................................. 2 List of Contents ................................................................................................. 3 List of Figures ................................................................................................... 8 List of Tables .................................................................................................. 14 Acknowledgement ........................................................................................... 15 List of Publications .......................................................................................... 16
Part One: Introduction and Literature Review .................................. 17
Chapter 1: Introduction ....................................................................................... 18
1.1 Background ................................................................................................... 18 1.2 Powder bed fusion Processes ....................................................................... 20 1.3 Materials and process bottlenecks ................................................................. 20 1.4 Definition of the research ............................................................................... 22 1.5 Research objectives ...................................................................................... 23 1.6 Outline of this dissertation ............................................................................. 24
Chapter 2: Literature Review ................................................................ 27
2.1 Introduction .................................................................................................... 27 2.2 Additive manufacturing technologies – state of the art ................................... 27
2.2.1 Additive manufacturing processes ........................................................ 29 2.2.2 Product development process in AM .................................................... 33
2.3 Opportunities and limitations of metal AM process ........................................ 34 2.3.1 Opportunities ........................................................................................ 34
2.3.1.1 Tool-less manufacturing of complex geometries ............................. 34 2.3.1.2 Complex tooling with conformal cooling channels .......................... 35 2.3.1.3 Lightweight structures and performance improvements ................. 35 2.3.1.4 Available Materials .......................................................................... 35 2.3.2 Limitations ............................................................................................ 36 2.3.2.1 Vaporization .................................................................................... 36 2.3.2.2 Balling phenomenon ....................................................................... 36 2.3.2.3 Anisotropic part properties .............................................................. 37 2.3.2.4 Thermal stresses and deformation ................................................. 37 2.3.2.5 Material and energy consumption of support structures ................. 38 2.3.2.6 Lack of knowledge of design rules in AM ........................................ 38
2.4 Sacrificial Support structure ........................................................................... 38 2.4.1 Support structure for SLA and FDM processes .................................... 38 2.4.1.1 Minimize support volume by optimizing orientation ......................... 38 2.4.1.2. Generating support structures ....................................................... 40 2.4.1.3. Structural design of support structure ............................................ 41 2.4.2 Support structures for metal PBF processes ........................................ 42 2.4.3 Commercial software tools for generating support structure ................. 44
2.5 Cellular lattice structures ................................................................................ 44 2.5.1 Cellular solids ....................................................................................... 44 2.5.2 Classification of cellular solids .............................................................. 46
2.5.3 3D periodic lattice structures ................................................................ 47

4
2.5.4 Additive manufacturing of periodic cellular structures ........................... 48 2.5.4.1 Triply periodic minimal surfaces (TPMS) ........................................ 50 2.6 Conclusion ...................................................................................................... 51
Part Two: Materials and Methods, Preliminary experiment, and
Finite Element Simulation .................................................................. 53
Chapter 3: Materials and Methods ........................................................ 54
3.1 Introduction .................................................................................................... 54 3.2 Powder Materials ........................................................................................... 54 3.2.1 316L Stainless steel .............................................................................. 54
3.2.2 Ti-6Al-4V ............................................................................................... 55 3.2.3 AlSi10Mg .............................................................................................. 56
3.3 Machine set-up ............................................................................................... 57 3.3.1 SLM MCP-Realizer 125 ........................................................................ 57
3.3.2 DMLS EOSINT M270 & M280 .............................................................. 60 3.4 Post-Processing ............................................................................................. 61 3.4.1 Heat treatment ..................................................................................... 61 3.4.2 Wire-Electric Discharge Machine (Wire- EDM) .................................... 61 3.4.3 Bead blasting – finishing ...................................................................... 62 3.5 Measurements ............................................................................................... 62 3.5.1 Micro-CT analysis ................................................................................. 62 3.5.2 Scanning Electron Microscopy (SEM) .................................................. 63 3.5.3 Optical Microscopy ............................................................................... 64 3.5.4 Uni-axial compression test .................................................................... 65 3.5.5 Deformation measurement ................................................................... 65
Chapter 4: Preliminary experiment on single layers built on powder bed in SLM Process ............................................................................. 67
4.1 Introduction ................................................................................................... 67 4.2 Experiment procedure ................................................................................... 67 4.3 Results and discussion .................................................................................. 68
4.3.1 Effect of scanning speed on layer thickness ......................................... 68 4.3.2 Surface morphology of the processed single layers ............................. 70
4.4 Conclusion ..................................................................................................... 71
Chapter 5: Finite Element Simulation of the Temperature and Stress Fields in Floating Single Layer Built on the Powder Bed in SLM ........... 73
5.1 Introduction ................................................................................................... 73 5.2 Modelling the temperature and stress gradient in metal AM processes ........ 73 5.3 Three-dimensional Finite element modelling ................................................. 75 5.3.1 Thermal modelling ................................................................................. 78 5.3.2 Heat source modelling ........................................................................... 80
5.3.3 Mechanical modelling ........................................................................... 80 5.4 Results and discussion .................................................................................. 82
5.4.1 Temperature distribution ....................................................................... 82
5
5.4.2 Melt pool dimensions ............................................................................ 87 5.4.3 Thermal stress analysis ........................................................................ 89
5.5 Conclusion .................................................................................................... 92
Part Three: Design, Manufacturing, and Evaluation of the
Mechanical Behaviour of Cellular Structures ................................... 94
Chapter 6: Design and Generation of TPMS Cellular Structures .......... 95
6.1 Introduction .................................................................................................... 95 6.2 Triply Periodic Minimal Surfaces (TPMS) ....................................................... 95 6.3 The potential of TPMS for SLM/DMLS Manufacture ...................................... 96
6.4 Computer modelling of TPMS cellular structures .................................. 98 6.4.1 Surface Representations ...................................................................... 98 6.4.2 Mesh Generation ................................................................................ 100
6.5 Simpleware software .................................................................................... 102 6.5.1 Overview ............................................................................................ 102 6.5.2 Creating cellular structures in +CAD ................................................... 103 6.5.2.1 Cell size ........................................................................................... 103 6.5.2.2 Volume fraction ................................................................................ 103
6.6 Conclusion ................................................................................................... 105
Chapter 7: Manufacturability Evaluation of TPMS Cellular Structures using Metal Additive Manufacturing .................................................... 107
7.1 Introduction .................................................................................................. 107 7.2 Experimental procedure ............................................................................... 108
7.2.1 Rationale ............................................................................................ 108 7.2.1.1 Cell type ..................................................................................... 108 7.2.1.2 Cell size ..................................................................................... 109 7.2.1.3 Cell orientation ........................................................................... 109 7.2.1.4 Volume fraction .......................................................................... 110
7.2.2 Experiments........................................................................................ 112 7.2.2.1 Exp.1: The Effect of Cell Type and Size on Manufacturability ... 112 7.2.2.2 Exp.2: The Effect of Volume-Fraction on Manufacturability ....... 112 7.2.2.3 Exp.3: The Effect of Cell-Orientation on Manufacturability ........ 113
7.2.2.4 Exp.4: Further Tests on the Effect of Cell and Volume Fraction on Manufacturability ....................................................................... 114 7.2.2.5 Exp.5: Further Tests on the Effect of Cell orientation on Manufacturability .......................................................................................... 116
7.3 Results and discussion ................................................................................. 117 7.3.1 316L stainless steel cellular structures ................................................ 117 7.3.1.1 Manufacturability Analysis .......................................................... 117 7.3.1.2 µ-CT Analysis ............................................................................. 120 7.3.1.3 SEM analysis .............................................................................. 124 7.3.1.4 Optical Microscopy ..................................................................... 129
7.3.2 AlSi10Mg cellular structures ........................................................ 131 7.3.2.1 µ-CT Analysis .............................................................................. 131
6
7.3.2.2 SEM analysis 7.3.2.3 Optical Microscopy ...................................................................... 133
7.3.3 Ti-6Al-4V Cellular Structures ........................................................ 135 7.3.3.1 Manufacturability study ................................................................ 137 7.3.3.2 µ-CT Analysis .............................................................................. 139 7.3.3.3 SEM analysis ............................................................................... 141
7.4 Conclusion ......................................................................................... 142
Chapter 8: Evaluation of the Mechanical Behaviour of Cellular Structures ........................................................................................... 146
8.1 Introduction………………………………………………………………… .......... 146 8.2 Gibson-Ashby (GA) Model………………………………………. ...................... 147 8.3 Uniaxial compression test………………………………………… ................... .149 8.4 Results and Discussion…………………………………………………… ......... 150
8.4.1 316L Stainless steel cellular structures ............................................ 150 8.4.1.1 Effect of cell size on compressive behaviour ............................. 150 8.4.1.2 Effect of cell orientation on compressive behavior ..................... 153 8.4.1.3 Experimental result vs. Gibson-Ashby model ............................ 155 8.4.2 AlSi10Mg cellular structures ............................................................... 157
8.4.2.1 Effect of cell size and volume fraction on compressive behaviour ..................................................................................................... 157
8.4.2.2 Experimental result vs. Gibson-Ashby model ......................... 161 8.4.3 Ti-6Al-4V cellular structures ................................................................ 162
8.4.3.1 Effect of cell size and volume fraction on compressive behaviour ..................................................................................................... 162
8.4.3.2 Experimental result Vs. Gibson-Ashby model ........................ 165 8.5 Conclusion ..................................................................................................... 167
Part Four: Developing Low-Volume, Uniform and Graded
Cellular Support Structures .............................................................. 171
Chapter 9: Advanced Uniform Cellular Support Structures for Metal Additive Manufacturing ..................................................................................... 172
9.1 Introduction .................................................................................................. 172 9.2 Support Structures in metal AM processes .................................................. 172 9.3 Design and manufacturing of the cellular support structure ......................... 175 9.4 Experimental procedure ............................................................................... 176
9.4.1 Design process ................................................................................... 176 9.4.2 Manufacturing process ....................................................................... 177 9.4.3 Characterisation and Analysis ............................................................ 177
9.5 Results and discussion................................................................................. 177 9.5.1 Manufacturability of cellular support structures ................................... 177 9.5.2 Scanning time and weight of cellular support structures ..................... 180 9.5.3 Deformation analysis .......................................................................... 184
9.6 Conclusion ................................................................................................... 186
7
Chapter 10: Developing Functionally-Graded Cellular Support Structures for Metal Additive Manufacturing ....................................... 188
10.1 Introduction ................................................................................................ 188 10.2 Graded cellular support structures ............................................................. 188 10.3 Experimental procedure .............................................................................. 189 10.3.1 Design process ....................................................................................... 189
10.3.2 Manufacturing Process ..................................................................... 192 10.3.3 Characterisation and Analysis .......................................................... 192
10.4 Results and discussion............................................................................... 192 10.4.1 Manufacturability analysis ................................................................. 192
10.4.1.1 Manufacturability of cellular support structures .......................... 193 10.4.1.2 Manufacturability of supported surface ...................................... 195 10.4.1.3 Graded cellular support for curved geometries .......................... 197 10.4.1.4 Permanent internal cellular structures for lightweight
applications ........................................................................................................ 198 10.4.2 Dimensional accuracy of the supported part ..................................... 199 10.4.3 Deflection method for estimating the residual stress ........................ 203
10.5 Conclusion ................................................................................................. 206
Chapter 11: Conclusion and Recommendations .................................. 208 References ......................................................................................... 213
Appendix A: Analytical Model for Energy Consumption .................... 225

8
List of Figures
Figure 1.1 Capabilities of AM technology ................................................................... 19
Figure 1.2 SLM Part with support structures (Castillo, L. 2005) .................................. 21
Figure 1.3 Flowchart of the dissertation ..................................................................... 24
Figure 2.1 Market distribution of AM industry (Wohlers report, 2013) ......................... 28
Figure 2.2 Application areas of AM industry (Wohlers report, 2013) ........................... 28
Figure 2.3 Schematic illustrations of AM processes ................................................... 31
Figure 2.4 Schematic of Powder bed fusion process (Courtesy: Hieta.co.uk) ............ 32
Fig. 2.5 Generic process of CAD to part, showing all 8 stages (Gibson et al., 2010) .. 34
Figure 2.6 (a) The overhang in Face B needs support structure but Face A does not
(b) Support structure for to floating geometry (c) Support structure tall and thin
geometry .................................................................................................................... 39
Figure 2.7 Recommended support structure for SLA (3D Systems, Inc., 1989). ......... 41
Figure 2.8 Some airy support structures designed by Putte et al. (1997) ................... 42
Figure 2.9 Geometric features that require support structures in SLM ....................... 43
Figure 2.10 some of the support structure designs available in Magics software
(courtesy: Materialise.com) ........................................................................................ 44
Figure 2.11 Examples of cellular solids found in biological systems. These materials
generally consist of reticulated (open cell) materials such as sponge and bone, and
membrane (closed cell) materials such as the various wood based materials (courtesy
L.J. Gibson, Cellular Solids, 1997). ............................................................................. 45
Figure 2.12 Examples of several metal foams currently available. The Cymat, Alporas
and ERG Duocel foams are made from aluminum alloys by particle decomposition
(Cymat), gas melt injection (Alporas), and pressure casting (ERG Duocel). The nickel
based Incofoam is made by an electroless deposition process. ................................. 46
Figure 2.13 Five samples of prismatic cellular topologies, of these only (a) hexagonal
honeycomb has seen widespread application as core material for sandwich panel
constructions. (b) triangulated, (c) square, (d) Kagomé, (e) Star-hex ......................... 47
Figure 2.14 Lattice truss topologies recently investigated. All have been made by
investment casting. The tetrahedral (b) and pyramidal (d) trusses have also been
fabricated by the folding of perforated sheet. In (b),(d) and (e) the lattice truss structure
is bounded by solid face sheets. ................................................................................ 47
Figure 2.15 Unit cell types in Magics software ........................................................... 50
Figure 2.16 Dimensional tessellations of Schwarz's Primitive (left), and Diamond
(centre) and Schoen's Gyroid (right) Triply Periodic Minimal Surfaces ........................ 51
Figure 3.1 Typical SEM micrograph of 316L stainless steel powder .......................... 55
Figure 3.2 SEM micrograph of Titanium alloy (Ti-6Al-4V) powder with different

9
Magnification ............................................................................................................. 56
Figure 3.3 SEM images with different magnifications of the AlSi10Mg alloy powder .. 57
Figure 3.4 SLM MCP- Realizer 250 Machine (University of Exeter) ........................... 58
Figure 3.5 Scanning strategy used in SLM (a) Uni-directional (b) Bi-directional ......... 59
Figure 3.6 EOS GmbH M270 Machine, source; (www.eos.info) ................................. 61
Figure 3.7 Schematic of Wire-EDM process [Source: ................................................. 62
Figure 3.8 (a) X-Tek Bench top CT 160 Xi (b) Scanning Electron Microscope (SEM)
Hitachi S3200N (University of Exeter) ......................................................................... 64
Figure 3.9 Dino-Lite optical Microscopy (University of Exeter) .................................... 64
Figure 3.10 (a) EZ20 Universal Material Testing Machine c) LR300K Universal Material
Testing Machine (University of Exeter) ...................................................................... 65
Figure 3.11 3D scanner - Rolland MDX-20 (University of Exeter) ............................... 66
Figure 4.1 Measured layer thickness for various scanning speeds ............................. 70
Fig.4.2 SEM micrograph of top surface of the single layer parts (a) 100 mm/s (b) 200
mm/s (c) 300 mm/s .................................................................................................... 71
Figure 5.1 (a) 3D finite element model (b) Gaussian laser energy density ................. 77
Figure 5.2 (a) Enthalpy of 316L stainless steel as a function of temperature (b) Thermal
conductivity of 316L stainless steel as a function of temperature ............................... 79
Figure 5.3 Transient temperature distribution during layer melting (a) at the beginning
of the first track scan (b) at the end of the first track scan at time =0.091 seconds (c) at
the end of the 5th track scan at time = 0.455 seconds ................................................ 83
Figure 5.4 Comparison of temperature distribution after the 1st track scan (a) built on a
powder bed (b) built on solid substrate ...................................................................... 85
Figure 5.5 (a) Temperature distribution along the path of the 1st track (b) Cyclic
melting/heating and cooling of the 1st track (c) Cyclic melting/heating and cooling of 5
subsequent tracks in the layer built on powder bed. ................................................... 86
Figure 5.6 (a) predicted melt pool temperature contours after scanning the 5th track (b)
Melt pool width of various scanning speeds (c) Melt pool depth of various scanning
speeds (d) comparison of the predicted melt pool dimensions as function of scanning
speed (e) Comparison of the melting depth of simulation and experiment ................. 88
Figure 5.7 (a) VonMises stress profile of the 1st track (b) VonMises stress of three
different tracks in layer ............................................................................................... 90
Figure 5.8 Residual stress distributions (a) X-component of stress along the scan
direction (b) Y- component of stress and transversal to the scan direction, (c) Z-
component of stress through the thickness of the layer .............................................. 91
Figure 6.1 Triply periodic minimal surfaces (courtesy: susqu.edu) ............................. 96
Figure 6.2 – TPMS cellular structures with 15% volume fraction ................................ 98
Figure 6.3 Binary slice representing the Schwarz Primitive using 20 × 20 px ........... 101
10
Figure 6.4 (a) Greyscale slice representing the Schoen gyroid (b) Reconstructed
surface of the Schoen Gyroid ................................................................................... 102
Figure 6.5 Simpleware software products (courtesy: Simpleware.com)..................... 102
Figure 6.6 Steps involved in generating cellular structure in +CAD ........................... 104
Figure 7.1 CAD models of four TPMS cell types used in the experiments ................ 109
Figure 7.2 (a) Cell orientations of Gyroid structure (Front view) (b) Worst cell
orientations of four cell types (Isometric view) .......................................................... 114
Figure 7.3 Schoen Gyroid structure with variable cell size and fixed volume fraction. 116
Figure 7.4 Schoen Gyroid with variable cell orientation (Front view) ........................ 117
Figure 7.5 Manufactured cellular structures [SLM MCP-Realizer, 316 L stainless steel]
................................................................................................................................. 119
Figure 7.6 µ-CT 3D reconstruction models of the Schoen Gyroid cellular structure with
fixed volume fraction of 15% and varying unit cell sizes [SLM MCP-Realizer, 316 L
stainless steel]. ........................................................................................................ 121
Figure 7.7 2D cross sectional µ-CT images of the Gyroid cellular structures with fixed
volume fraction of 15% and various unit cell sizes [SLM MCP-Realizer, 316 L stainless
steel]. ....................................................................................................................... 122
Figure 7.8 Comparisons of the µ-CT 3D reconstructed surface and 3D CAD model of
the Schoen gyroid cellular structure with fixed volume fraction of 15% (a) cell
size=2mm (b) cell size = 5.5mm [SLM MCP-Realizer, 316 L stainless steel]. ........... 123
Figure 7.9 µ-CT 3D reconstruction models of the Gyroid cellular structures with fixed
cell size of 5mm and different volume fractions: (a) 6%, (b) 8%, (c) 10%, (d) 12%, (e)
15% and (f) 15% (worst orientation) [SLM MCP-Realizer, 316 L stainless steel] ...... 124
Figure 7.10 SEM micrographs of (a) the struts of the Gyroid cellular structure with cell
size of 2 mm and the volume fraction of 15%, (b) A magnified cross section of a strut
(c) Tiny particles bonded to the surfaces of the struts and (d) Magnified single tiny
particle on the surface of the strut [SLM MCP-Realizer, 316 L stainless steel]. ........ 125
Figure 7.11 SEM images of the Gyroid cellular structures with different volume fractions
and fixed cell size of 5mm [SLM MCP-Realizer, 316 L stainless steel] ..................... 127
Figure 7.12 (a) High magnification SEM micrograph of the strut and (b) schematic
illustration of the SLM manufacturing process of the circular strut [SLM MCP-Realizer,
316 L stainless steel]. .............................................................................................. 128
Figure 7.13 Optical microscope images of the Gyroid cellular structures with different
volume fractions and fixed cell size of 5mm [SLM MCP-Realizer, 316 L stainless steel]
................................................................................................................................. 129
Figure 7.14 Strut sizes measured from optical as a function of volume fraction [SLM
MCP-Realizer, 316 L stainless steel]. ...................................................................... 130
11
Figure 7.15 (a) optical microscope images of gyroid cellular structure worst orientation
(volume fraction=15% and cell size=5mm) (b) top (c) bottom and (d) side view. Insets
in (b- d) exhibit the corresponding CAD model of the worst orientation respectively
[SLM MCP-Realizer, 316 L stainless steel]. .............................................................. 131
Figure 7.16 DMLS-Manufactured AlSi10Mg Schwartz Diamond cellular structures .. 132
Figure 7.17 µ-CT reconstruction models and cross section images of diamond cellular
structures at different unit cell sizes [DMLS M280, AlSi10Mg] .................................. 133
Figure 7.18 µ-CT reconstruction models and cross section images of diamond cellular
structures at different volume fractions [DMLS M280, AlSi10Mg]. ............................. 133
Figure 7.19 SEM images of the struts of Diamond cellular structures before the heat
treatment (Volume fraction=15%; unit cell size=3.5mm) [DMLS M280, AlSi10Mg] ... 134
Figure 7.20 SEM images of the struts of Diamond cellular structures after it has been
bead-blasted and heat treated (Volume fraction=7.5%; unit cell size=3mm) [DMLS
M280, AlSi10Mg] ..................................................................................................... 135
Figure 7.21 Optical microscope images of the DMLS-manufactured cellular structures
with volume fraction = 10% and different cell sizes [DMLS M280, AlSi10Mg] ............ 135
Figure 7.22 Strut and pore sizes measured from optical microscope image
(experimental) and CAD models (designed) in function of the unit cell size. The volume
fraction is set as a constant of 10% [DMLS M280, AlSi10Mg]. ................................. 136
Figure 7.23 Strut and pore sizes measured from optical microscope image
(experimental) and CAD models (designed) in function of the volume fraction. The unit
cell size is set as a constant of 5.5 mm [DMLS M280, AlSi10Mg]. ........................... 137
Figure 7.24 Manufactured Gyroid cellular structures with various cell sizes and volume
fractions [DMLS M270, Ti-6Al-4V] ............................................................................ 138
Figure 7.25 Manufactured Diamond cellular structures with various cell sizes and
volume fractions [DMLS M270, Ti-6Al-4V] ............................................................... 138
Figure 7.26 Manufactured Gyroid cellular structures with cell size = 5mm, volume
fraction=15%, and various cell orientations (200-1800) [DMLS M270, Ti-6Al-4V] ...... 139
Figure 7.27 CT reconstruction 3D models of Gyroid cellular structure with varying cell
size [DMLS M270, Ti-6Al-4V] ................................................................................... 140
Figure 7.28 CT reconstruction 3D models of Gyroid cellular structure with varying cell
orientation [DMLS M270, Ti-6Al-4V] ......................................................................... 140
Figure 7.29 µ-CT cross-sectional images of the struts of Gyroid cellular structures at
various cell orientations [DMLS M270, Ti-6Al-4V] .................................................... 140
Figure 7.30 Comparisons of the µ-CT 3D reconstructed surface and 3D CAD model of
the Schoen Gyroid cellular structure with fixed volume fraction of 7.5% (a) cell
size=4mm (b) cell size = 7mm [DMLS M270, Ti-6Al-4V]. ......................................... 141

12
Figure 7.31(a) SEM micrographs of cellular strut without post-processing, (b) Strut and
fractured surfaces of Gyroid with post-processing [cell size =3mm, volume fraction =8%
- DMLS M270, Ti-6Al-4V]. ........................................................................................ 142
Figure 8.1 A cubic model for an open-cell foam showing the edge length, l, and edge
thickness, t [Gibson and Ashby] ............................................................................... 147
Figure 8.2 Gyroid and Diamond compression test samples ..................................... 150
Figure 8.3 (a) Stress-strain curve of various cell sizes (b) Displacement steps of the
test sample during compression test [cell size=5.5mm, volume fraction = 15% ,
stainless steel, SLM – MCP Realizer] ...................................................................... 151
Figure 8.4 Effect of cell orientation on elastic modulus [stainless steel, SLM – MCP
Realizer] .................................................................................................................. 154
Figure 8.5 Stress-strain curves obtained from the compression tests on the gyroid
cellular lattice structures at the normal or worst orientations. [Volume fraction is 15%
and unit cell size is 5mm [stainless steel, SLM – MCP Realizer] .............................. 155
Figure 8.6 Experimental results of the Gyroid cellular structure compared to the
modified Gibson-Ashby model with the identified parameters (a) compressive modulus
and (b) compressive strength as a function of relative density [stainless steel, SLM –
MCP Realizer] .......................................................................................................... 156
Figure 8.7 Stress-strain curves of Gyroid cellular structures with constant cell size of 4
mm and volume fractions ranging from 5 to 15% [AlSi10Mg, DMLS M280] .............. 158
Figure 8.8 Comparison of modified Gibson-Ashby model and experimental result (a)
compressive elastic modulus and (b) compressive yield strength [Schwartz Diamond,
Cell size=3-7mm, Volume fraction=5-15%, AlSi10Mg – DMLS M280]. 159Figure 8.9 Comparison of experimental results and the modified Gibson-Ashby model as a function of volume fraction (a) Compressive elastic modulus and (b) compressive yield strength [AlSi10Mg, DMLS M280] 162
Figure 8.10 Stress-strain curves of the TPMS cellular structures (a) Gyroid structure
with variable cell sizes and volume fractions (b) Gyroid and Diamond structures with
cell size of 4 mm and volume fraction of 10%. ......................................................... 163
Figure 8.11 Effect of cell size and volume fraction on compressive properties (a) Gyroid
elastic modulus (b) Diamond elastic modulus (c) Gyroid yield strength (d) Diamond
yield strength ........................................................................................................... 164
Figure 8.12 (a-c) Fitting graphs used from the experimental test data to obtain the
constants C1 and C2 (e-h) indicate the experimental and GA curves and shows
compressive elastic modulus and yield strength as a function of relative density (i.e.
volume fraction) of the gyroid and diamond cellular structures. ................................ 166
Figure 9.1 Straight solid walls or block support ........................................................ 174
Figure 9.2 CAD model of gyroid and diamond lattice structures ..................................... 176
Figure 9.3 CAD Geometry of the cantilever part supported with lattice structures ..... 176
Figure 9.4 Manufactured cantilever parts still attached on the base plate (DMLS -
M270) ...................................................................................................................... 178

13
Figure 9.5 Large gaps between lattice support points at the cantilever bottom surface
................................................................................................................................. 179
Figure 9.6 Comparison of the laser scanning time of cellular support structures ...... 182
Figure 9.7 2D slice view of single layer of lattice support structure........................... 183
Figure 9.8 Comparison of the measured weights of lattice support structures .......... 183
Figure 9.9 Deflection in the cantilever part after wire-cutting (a) supported with Gyroid
Cellular structure and (b) supported with Diamond cellular structure. ....................... 185
Figure 10.1 CAD models of the Schoen Gyroid cellular support structure (a) uniform
cellular structure (b) Graded cellular structure 8% - 50% (c) Graded structure 8% -
100% (d) Step graded with solid layer separating the two cell sizes (e) Internal graded
cellular structure with increasing density towards the surface (f) Exponential transition
function for the smoothly graded cellular structures ................................................. 189
Figure 10.2 CAD representations of external and internal cellular structures for support
structure and lightweight applications ...................................................................... 191
Figure 10.3 (a) and (b) External and internal cellular support structures manufactured in
DMLS machine (c) relationship between cell size, % volume fraction, and strut size
[DMLS M270, Ti-6Al-4V] .......................................................................................... 194
Figure 10.4 (a) Stages of building the cantilever part and graded cellular support
simultaneously layer-upon-layer (b) Distorted cantilever edges during the build (c) Gap
between adjacent supports points of graded cellular structure (d) Support pins used to
facilitate the removal of the support. ........................................................................ 196
Figure 10.5 (a) CAD model showing the cellular support stages for curved geometry (b)
DMLS manufactured part using small cell sizes. ...................................................... 198
Figure 10.6 (a) Optical scan micrograph showing the dimensional loss in cantilever
edges supported with uniform cellular structures manufactured in DMLS (b)
Dimensional loss profile of the supported surface of cantilever overhang after 3D
scanning. ................................................................................................................. 200
Figure 10.7 Average dimensional error of the measured cantilever part .................. 202
Figure 10.8 Determination of residual stresses by deflection method ....................... 204
Figure 10.9(a) - Measured deflection of the cantilever parts (b) Calculated residual
stress for various cellular support structure methods. .............................................. 205
Figure A.1 Comparison of the energy consumption of tall cylinder and large Disc
shaped parts ............................................................................................................ 227

14
List of Tables
Table 3.1 - Chemical compositions of 316L stainless steel powder, wt.-% [21] .......... 55
Table 3.2- Chemical compositions of Ti-6Al-4V powder, wt. % [LPW Technology] ..... 56
Table 3.3- Chemical compositions of Ti-6Al-4V powder, wt. % [LPW Technology] ..... 56
Table 3.4 -Processing parameters of SLM MCP-Realizer machine ............................ 57
Table 3.5- Processing parameters used in DMLS EOSINT M280 & M270 machines .. 60
Table 3.6 -Optical microscope ................................................................................... 64
Table 5.1- Finite element simulation parameters ........................................................ 77
Table 5.2-Temperature-dependant mechanical properties of 316L stainless steel ...... 81
Table 6.1-Implicit surface in/out convention ............................................................... 99
Table 6.2 -Different cell types in Simpleware +CAD software ................................... 105
Table 7.1-Experimental framework of manufacturing cellular structures ................... 111
Table 7.2-Comparison between the designed and experimental volume fractions ... 124
Table 8.1-Compressive Yield strength and Elastic modulus of Gyroid cellular structures
with constant volume fraction of 15% and the variable unit cell sizes [316L stainless
steel, MCP-Realizer]. ............................................................................................... 152
Table 8.2 Compressive Yield strength of Gyroid cellular structures [AlSi10Mg, DMLS
M280] ...................................................................................................................... 160
Table 8.3 Compressive Elastic modulus of Gyroid cellular structures [AlSi10Mg, DMLS
M280] ...................................................................................................................... 161
Table 9.1- Manufacturability of cellular support structures ........................................ 179
Table 9.2- Laser scanning time and weight of lattice support structures .................. 182
Table 10.1-Dimensional error of the cantilever overhang edges .............................. 202
Table A.1 Comparison of energy consumption of different parts .............................. 227

15
Acknowledgement
All praise and thanks to Allah the exalted, the Lord of the universe, the One who, by
His blessing and favour, good works are accomplished.
I would like to express my sincere gratitude to my supervisor Dr. Liang Hao for the
continuous support of my PhD study, for his patience, motivation, and enthusiasm.
His guidance helped me in all aspects of this research.
I would like to thank my second supervisor Prof. Richard Everson for his valuable
advice and support during this project. His contribution in my modelling work was
crucial to my understanding of the metal AM process.
I would like to express my special thanks to Dr. Chunze Yan for his support in my
experimental work. This PhD work would not have been possible without his
guidance, encouragement, and experience.
For the provision of research facilities, I would like to thank Exeter Advanced
Technologies (X-AT) and Centre for Additive Layer Manufacturing (CALM).
For the materials analysis, I would like to thank Dr. Lesley Wears and Dr. Hong
Chang. I would like to thank all my colleagues in the college of engineering and
mathematics who supported me directly or indirectly.
I would like to thank the SAVING project partners (3T RPD Ltd, Simpleware Ltd.,
DELCAM, Crucible Industrial Design Ltd, EOS GmbH, and Plunkett Associates Ltd)
for their collaboration in the project. Special thanks to 3T RPD Ltd., for allowing me
to conduct experimental works in their machines and in particular Dr. Simon Bubb
for his technical support. Special thanks also go to Simpleware for providing me
their software and in particular Dr. David Raymont for his continuous support.
I would like to thank the Technology Strategy Board (TSB) for providing the
financial support for this project.
I would like to express very special thanks to my lovely wife for her patience,
prayers, sacrifice, and ideas throughout my study period. Many thanks to my
beloved son and daughter for bringing joy and happiness to my life.
I acknowledge my sincere indebtedness and gratitude to my dearest parents and
sibling for their continuous love throughout my life.

16
List of Publications
Journal Papers:
Hussein A, Hao L, Yan C, Everson R, Raymont D, Young P. (2014) Developing
Functionally Graded Cellular Support Structures for Metal Additive
Manufacturing, International journal of solids and structures . (Submitted)
Yan, C., Hao, L., Hussein, A., Young, P., & Raymont, D. (2014). Advanced
lightweight 316L stainless steel cellular lattice structures fabricated via selective
laser melting. Materials & Design, volume 55, pages 533-541. (Accepted)
Hussein A, Hao L, Yan C, Everson R. (2013) Finite element simulation of the
temperature and stress fields in single layers built without-support in selective
laser melting, Materials and Design, volume 52, pages 638-647. (Accepted)
Hussein A, Hao L, Yan C, Everson R, Young P. (2013) Advanced lattice support
structures for metal additive manufacturing, Journal of Materials Processing
Technology, volume 213, pages 1019-1026. (Accepted)
Yan, C., Hao, L., Hussein, A., Bubb, S. L., Young, P., & Raymont, D. (2013).
Evaluation of light-weight AlSi10Mg periodic cellular lattice structures fabricated
via direct metal laser sintering. Journal of Materials Processing Technology,
volume 214, pages 856-864. (Accepted)
Yan C, Hao L, Hussein A, Raymont D. (2012) Evaluations of cellular lattice
structures manufactured using selective laser melting, International Journal of
Machine Tools and Manufacture, volume 62, pages 32-38. (Accepted)
Conference Papers:
Hussein, A., Yan; C., Everson, R; Hao, L. (2012). Preliminary investigation on
cellular support structures using SLM process. Innovative developments in
virtual and physical prototyping-Bartolo et al. (eds). 609-612, Taylor & Francis
Group, London. (Accepted)
Hao, L.; Raymont, D.; Yan, C.; Hussein, A.; Young, P. (2012). Design and
additive manufacturing of cellular lattice structures. Innovative developments in
virtual and physical prototyping-Bartolo et al. (eds). 249-254, Taylor & Francis
Group, London. (Accepted)

17
Part One: Introduction and Literature
Review
18
CHAPTER 1 Introduction
1.1 Background
Additive Manufacturing (AM) describes a family of technologies that, in an
automatic process, produce three dimensional objects directly from a digital
model by the successive addition of material(s), without the use of a specialized
tooling. It is also known as 3D printing, Solid Freeform Fabrication (SFF) and
Additive Layer Manufacturing (ALM). AM is considered as one of the most
important emerging material processing technologies that will drive the future
manufacturing industry. Many of the traditional Design for Manufacture (DFM)
principles are no longer applicable to AM as it can produce parts with complex
internal and re-entrant features (Hopkinson et al., 2005).
AM has been increasingly used to produce topologically optimized parts to
save materials and costs. It also makes high value products without using
tooling, jigs and fixtures. This particularly helps to save a considerable amount
of additional material and process cost for the production of one-off or small
volume parts or products. In addition, the non-processed raw materials can be
recycled and re-used by AM to reduce material waste drastically. AM is
therefore considered as a sustainable manufacturing approach for new
products, in particular lightweight and sustainable products which are now
highly demanded by many industries due to the tighter environmental
regulations.
AM is potential to enable Manufacturing for Design (MfD) to produce
complex, lightweight and high value products. Additive manufacturing is now
being recognized as a serious method of manufacturing. Many events
conducted by industry, academia, and government have presented examples of
how the technology is being applied to the production of parts for products. The
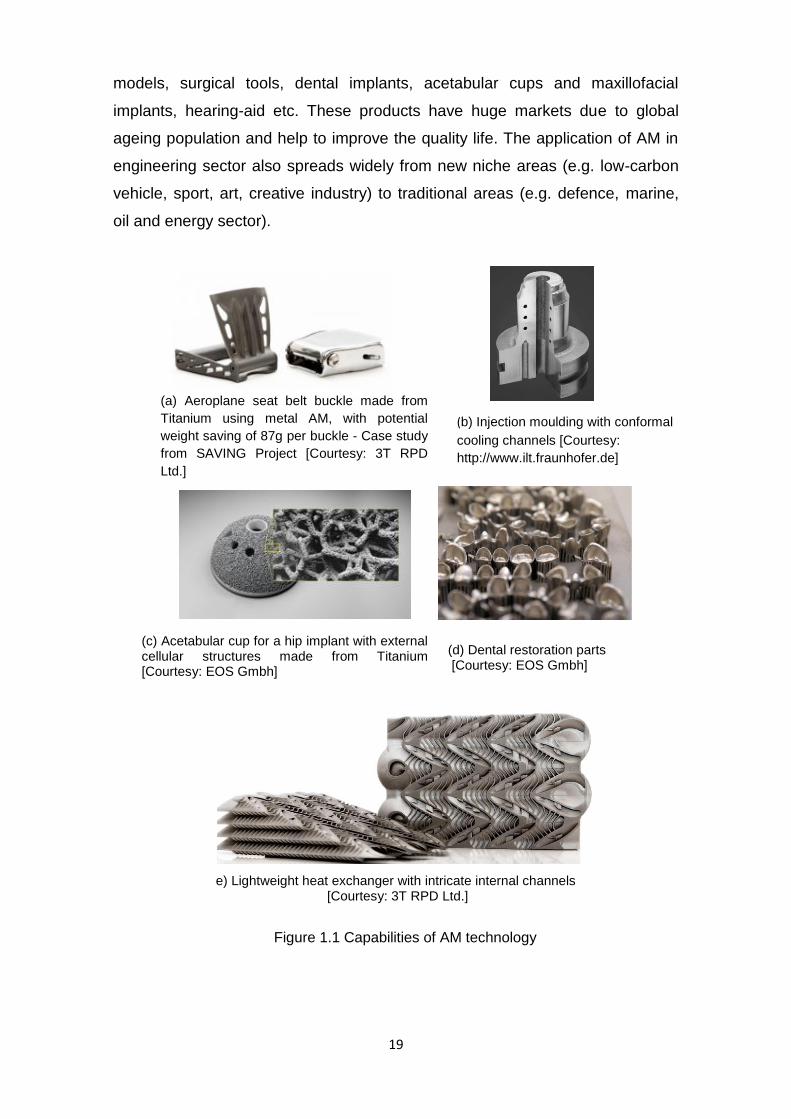
examples shown in Fig. 1.1 fully demonstrate the metal AM capabilities which
allows the redesign of the existing products or design of new products that
cannot made by conventional methods. Worldwide research also investigates
the use of AM for the production of low-volume aerospace components in
particular considering the opportunities to reduce their weights and make them
be more sustainable in its life-time operation. Medical industry represents the
most diversified market place for AM parts. AM is used to produce medical
19
models, surgical tools, dental implants, acetabular cups and maxillofacial
implants, hearing-aid etc. These products have huge markets due to global
ageing population and help to improve the quality life. The application of AM in
engineering sector also spreads widely from new niche areas (e.g. low-carbon
vehicle, sport, art, creative industry) to traditional areas (e.g. defence, marine,
oil and energy sector).
e) Lightweight heat exchanger with intricate internal channels [Courtesy: 3T RPD Ltd.]
Figure 1.1 Capabilities of AM technology
(a) Aeroplane seat belt buckle made from
Titanium using metal AM, with potential
weight saving of 87g per buckle - Case study
from SAVING Project [Courtesy: 3T RPD
Ltd.]
(b) Injection moulding with conformal
cooling channels [Courtesy:
http://www.ilt.fraunhofer.de]
(c) Acetabular cup for a hip implant with external cellular structures made from Titanium [Courtesy: EOS Gmbh]
(d) Dental restoration parts [Courtesy: EOS Gmbh]
20
1.2 Metal Based Powder Bed Fusion Processes
Metal based powder bed fusion (PBF) describes AM processes in which
electron beams or laser beams construct engineered parts from metal powders
in a powder bed. The thermal energy melts the powder material, which then
changes to a solid phase as it cools. Terms that are also used in the AM
industry for powder bed fusion processes and systems include selective laser
melting (SLM), direct metal laser sintering (DMLS), LaserCusing, and electron
beam melting (EBM). Metal based PBF processes are one of the most versatile
and used AM processes to fabricate complex 3D functional components from
various metal powders including stainless steel, cobalt-chrome, Inconel,
titanium and aluminium alloys.
At present parts produced with metal PBF systems have reached a status
which makes them competitive to conventionally produced parts concerning
material properties as density and strength. Geometrical accuracy and surface
quality have reached a level which requires only very little post treatment. For
example, SLM and DMLS has become an essential method of producing highly
complex small scale components in the aerospace industry. By using these
technologies, the time to produce replacement parts is reduced significantly
compared to previous fabrication techniques.
1.3 Materials and process bottlenecks
Metal AM processes are expensive due to high machines and material costs.
According to The Economist, UK “Industrial 3D printing systems start at about
£100,000 for polymer systems and go up to nearly £1 million for metal AM
systems”. In addition, the cost of raw material materials is very high (e.g. £ 70-
80/kg of 316 L stainless steel, 250-£450/kg of titanium powders). Furthermore,
metal AM processes including SLM and DMLS have to solidify extra materials
into sacrificial support structures to manufacture overhang geometries (See Fig.
1.2). Meantime, SLM/DMLS use relatively high energy tools such as laser to
consolidate metal powders. They could require large energy consumption if
more layers of support structure are needed to be consolidated for a large size
product. To minimize the electrical energy consumption, build time must be
minimized as this is the most influential parameter of AM processes (Mognol et
al. 2006). There are other difficulties also associated with recovering raw

21
powder trapped inside the support structure after the build. Hence, the
functional metal parts produced in SLM/DMLS can be disproportionately
expensive when compared to cast or even machined parts, simply due to the
cost of raw materials, slower build-time and the use of sacrificial support
structures. These downstream issues result some restrictions to metal AM even
in high value aerospace, medical and engineering sectors.
Figure 1.2 SLM Part with support structures (Castillo, L. 2005)
One of the potential area in which the largest gain in SLM/DMLS can be
attained is through the use of lightweight cellular lattice structure which require
less material and energy during processing while offering enhanced functional
performance required in metal products. Development of SLM/DMLS for the
manufacture of these lattice structures from high performance light alloys would
pace their application. A key advantage offered by internal structures is high
strength accompanied by a relatively low mass (Chu et al. 2008). These
structures can provide good energy absorption characteristics and good thermal
and acoustic insulation properties as well (Gibson and Ashby, 1997). The
emerging applications for metal cellular lattice structures range from ultra-light
weight multifunctional structures to automobile, medical and aerospace
components.
In recent years, various types of lattice structures have been designed and
produced in AM processes, however, a very little effort has been made to study
the constraints and challenges for the manufacturability of these structures in
metal AM processes. Internal geometries with very fine structures below 1 mm
still are a technical challenge in SLM/DMLS processes. The manufacturability is
Support structures

22
an important factor for the selection of the cell type, size, build orientation, and
density of cellular structure for specific applications.
1.4 Definition of the Research
This pioneering research investigates the manufacturability and mechanical
behavior of advanced lightweight cellular structures in metal AM processes. The
cellular structures are based on Triply Periodic Minimal Surface (TPMS) cell
topologies. The study includes the novel application of low-density cellular
structures as supports for overhanging geometries of metal AM parts. The aim
of the cellular support is to tackle the process limitation in building complex
geometreis with internal voids having a solid shell that will otherwise require
non-removable support structures by replacing them with multifunctional
permanant cellular support structure. The concept of lightweight cellular
structure is motivated by the desire to put material only where it is needed for a
specific application. The build time and cost of making parts can be significantly
decreased by using internal low-volume structures that can replace bulk
materials.
These multi-functional celular structures are expected to fullfil the following
design and performance requirements,
1. To promote design freedom and enhance the manufacturabiltiy of, complex
geometries with internal cavities that result an internal overhang, by using
self-supporting permanent cellular support structures that are suitable for
metal AM processes.
2. To meet the functional design requirements such as stiffness and strength
while providing lightweight solution for metal AM parts.
3. To reduce the material, build-time and energy consumption of external
support for geometries with external overhang, by using low-density, uniform
and graded cellular support structures that can be easily removed.
This work presents a comprehensive experimental tests conducted at
different cell topologies using commerically available 316L stainless steel,
Titanium alloy (Ti-6Al-4V), and Aluminium alloy (AlSi10Mg) metal powders. The
fabrication of cellular structures has been investigated in SLM MCP Realizer
and DMLS EOSINT M270/M280, two of the most commonly used metal AM
23
systems. The research has contributed to new knowledge on the
manufacturability and mechanical properties of low-density TPMS cellular
structures with varying cell size, orientation and volume fractions from various
metallic powders. The evaluation on the mechanical properties of these cellular
structures aims to illustrate the compressive behaviour of various cell types,
sizes, orientation, and volume fractions. The mechanical properties will aid the
designer on the selection and use of the right cell type, size, and volume
fraction to suit the functional demands of particular application.
The study also contributes to the design and manufacturing of support
structures through the novel applications of low-density uniform and graded
cellular support structures for metal AM process. The new uniform and graded
support structure method will address the saving of energy (via reduced built-
time and material) which could waste very expensive raw metal materials and
time in building complex parts that require large support. Knowledge gained
from thermal modelling aids in our understanding on the temperature and stress
fields during SLM processing. Proper knowledge on temperature and stress
gradients is essential for the design of more efficient support structure for
overhang geometries in metal AM parts.
1.5 Research Objectives
1. To predict the temperature and stress fields of overhang single layers built
on powder bed without-support in SLM.
2. To evaluate the manufacturability of cellular structure with various cell types,
sizes, orientations, and volume fractions using different metallic powders in
SLM and DMLS processes.
3. To determine the effect of cell type, size, orientation, and volume fraction on
the mechanical behaviour of cellular structure under compressive loading.
4. To develop low-density uniform cellular support structures, to reduce
material and energy consumption of metal AM parts.
5. To develop low-density functionally graded cellular support structure to be
used as temporary/removable external support and permanent internal
support structures of sustainable light-weight parts.
24
1.6 Outline of this Thesis
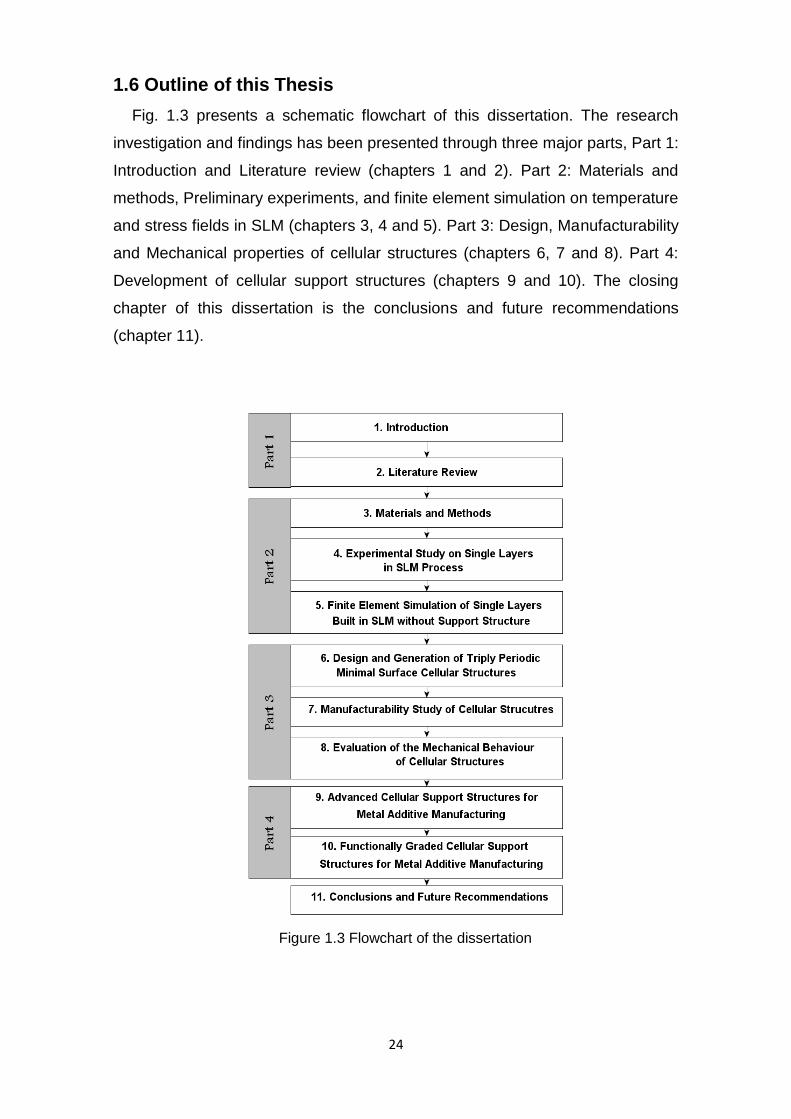
Fig. 1.3 presents a schematic flowchart of this dissertation. The research
investigation and findings has been presented through three major parts, Part 1:
Introduction and Literature review (chapters 1 and 2). Part 2: Materials and
methods, Preliminary experiments, and finite element simulation on temperature
and stress fields in SLM (chapters 3, 4 and 5). Part 3: Design, Manufacturability
and Mechanical properties of cellular structures (chapters 6, 7 and 8). Part 4:
Development of cellular support structures (chapters 9 and 10). The closing
chapter of this dissertation is the conclusions and future recommendations
(chapter 11).
Figure 1.3 Flowchart of the dissertation

25
Chapter 1 Provides a background on additive manufacturing technology;
current issues in metal based AM processes; and the research definition and
objectives to tackle design and process limitations in SLM and DMLS.
Chapter 2 Discusses the current state-of-the-art in AM technologies and
available materials, and provides the necessary background for this
dissertation. The opportunities and limitations of metal AM technologies are
discussed, in particular their applications in manufacturing complex cellular
structures. Literature pertaining to structural design and use of sacrificial
support structure and thermal gradients in SLM are included. Furthermore, an
overview is given to the cellular structure for lightweight applications to provide
understanding on their geometrical and mechanical characteristics as well as
the structure-property relations between them.
Chapter 3 Describes the powder materials, manufacturing machines and
experimental set-up, and measurement instruments used during the
experimental work. It also illustrates the post-processing steps used for the
cellular structures such as stress-relieving heat treatment cycles, wire-EDM
cutting, and Air/bead blasting operations.
Chapter 4 Presents experimental work on single 316L stainless steel layers
built on the powder without-support in SLM. It investigates the effect of scanning
speed on melted depth in the powder bed.
Chapter 5 Uses three-dimensional finite element simulation to investigate the
temperature and stress fields in single 316L stainless steel layers built on the
powder bed without support in SLM. A non-linear transient model based on
sequentially coupled thermo-mechanical field analysis code was developed in
ANSYS parametric design language (APDL).
Chapter 6 Presents the design procedure and the software tools used for
generating cellular structures. It presents different cell types used in the
experimental tests and the characteristics of these cellular structures.
Chapter 7 Evaluates the manufacturability of cellular structures using SLM-
MCP Realizer and DMLS-M270 and M280 machines using different metal
powders such as 316L Stainless steel, Ti-6Al-4V, and AlSi10Mg. The effect of
cell type, size, volume fraction, and cell orientation on the manufacturability was
investigated.
Chapter 8 Evaluates the compressive behaviour of cellular structures
manufactured in SLM and DMLS processes. Rigorous mechanical testing was

26
performed to provide the understanding of the behaviour of periodic cellular
structures under monotonic compression loading. The effect of cell size, volume
fraction, and cell orientation on compressive elastic modulus and yield strength
was examined for both gyroid and diamond type cellular structure. Experimental
results were compared with analytical model of Gibson and Ashby to determine
the accuracy of the model and to provide a prediction approach.
Chapter 9 Develops a novel application of cellular lattices as support structure
for metallic AM parts. It presents a comprehensive experimental study to prove
this new concept and illustrate the effects of type, volume fraction and size of
cellular lattice structures on the support performance in terms of
manufacturability, building time, weight of support, and preventing the thermal
deformations.
Chapter 10 Proposes a functionally graded cellular structure with variant
porosity and cell size for temporary and permanent support structure
applications in metal additive manufacturing. Different cell sizes and volume
fractions were tested to establish a relationship between cellular topology and
manufacturability. Dimensional accuracy and residual stresses were studied for
various methods of graded cellular support structure.
Chapter 11 provides general conclusions as well as future recommendation
perspectives for the continuation of this work.

27
CHAPTER 2 Literature Review
2.1 Introduction
The aim of this chapter is to provide the necessary background and state-of-
the-art regarding the AM processes, support structure, and cellular lattice
structures.
To provide some background on AM technology, section 2.2 gives an
overview of AM techniques, materials, and applications. In section 2.3, the
opportunities and limitations of metal AM techniques are addressed. Emphasis
is given to the limitations that are related to the process as well as
manufacturing of complex designs in metal AM processes. Section 2.4
discusses the design and manufacturing of support structures that are used in
some AM processes to anchor/hold overhang and fragile geometries during the
build. The design and manufacturing of cellular structure is presented and
discussed in detail in section 2.5. The limitations of traditional manufacturing
techniques for metal foam and 2D periodic honey-comb solid structures are also
discussed in section 2.5, as well as the potential for the additive manufacturing
of promising new designs of triply periodic minimal surfaces paradigm that will
be pursued in the remainder of this work. Finally, the conclusion of this literature
review is presented in section 2.6, which puts the most important findings into
perspective, formulating concrete goals and guidelines regarding the work in
this dissertation.
2.2 Additive Manufacturing Technologies – State Of The Art
The ASTM International Committee F42 on AM Technologies defines
additive manufacturing as the process of joining materials to make objects from
3D model data, usually layer upon layer, as opposed to subtractive
manufacturing methods (ASTM-F42 Committee). The term 3D printing is
defined by the ASTM F42 committee as the fabrication of objects through the
deposition of a material using a print head, nozzle, or other printer technology.
However, the term is often used synonymously with AM In particular; it is
associated with machines that are lower in relative price and/or overall
functional capability. AM is the official industry standard term according to

28
ASTM and ISO, but 3D printing has become the de facto standard term, and
has become more popular than AM (Wohlers, 2013).
Design and manufacturing companies has increasingly adopted AM to make
products used in the consumer, industrial, medical products. In an effort to
reduce time to market, improve product quality, and reduce cost, companies of
all sizes have come to rely on AM as a mainstream tool for rapid product
development. AM processes help companies reduce the likelihood of delivering
flawed products, or the wrong products, to the marketplace. The chart in Fig.
2.1 shows the results of a survey conducted by Wohlers Associates on AM
market distribution (Wohlers, 2013). Consumer products/electronics is the
leading industrial sector, followed by motor vehicles. Medical/dental has
established itself as a strong sector for AM and has been the third largest over
the past 12 years.
Figure 2.1 Market distribution of AM industry (Wohlers, 2013)
Figure 2.2 Application areas of AM industry (Wohlers, 2013)
29
The survey results in Fig. 2.2 show that companies use AM technology to
produce functional parts more than anything else. The second most popular
application for AM parts is as prototypes for fit and assembly.
2.2.1 Additive Manufacturing Processes
The ASTM-F42 Committee whose primary work is the development of
standards for additive manufacturing technologies has classified additive
manufacturing into the following categories:
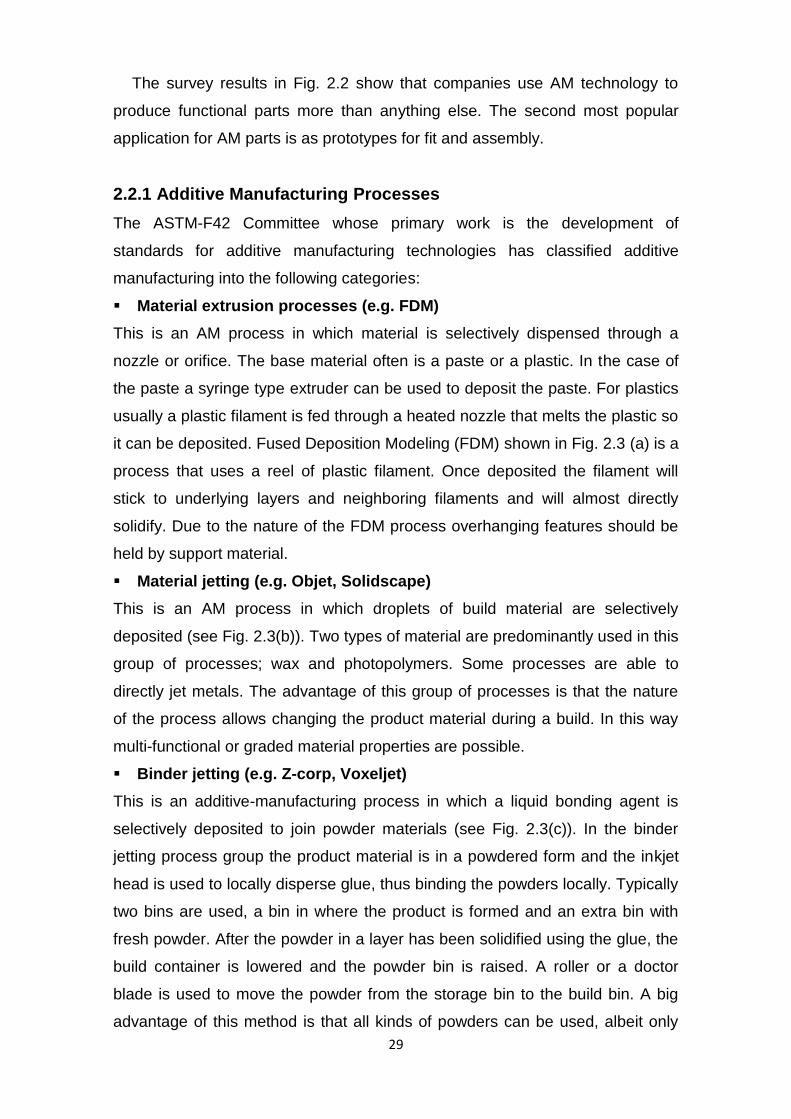
Material extrusion processes (e.g. FDM)
This is an AM process in which material is selectively dispensed through a
nozzle or orifice. The base material often is a paste or a plastic. In the case of
the paste a syringe type extruder can be used to deposit the paste. For plastics
usually a plastic filament is fed through a heated nozzle that melts the plastic so
it can be deposited. Fused Deposition Modeling (FDM) shown in Fig. 2.3 (a) is a
process that uses a reel of plastic filament. Once deposited the filament will
stick to underlying layers and neighboring filaments and will almost directly
solidify. Due to the nature of the FDM process overhanging features should be
held by support material.
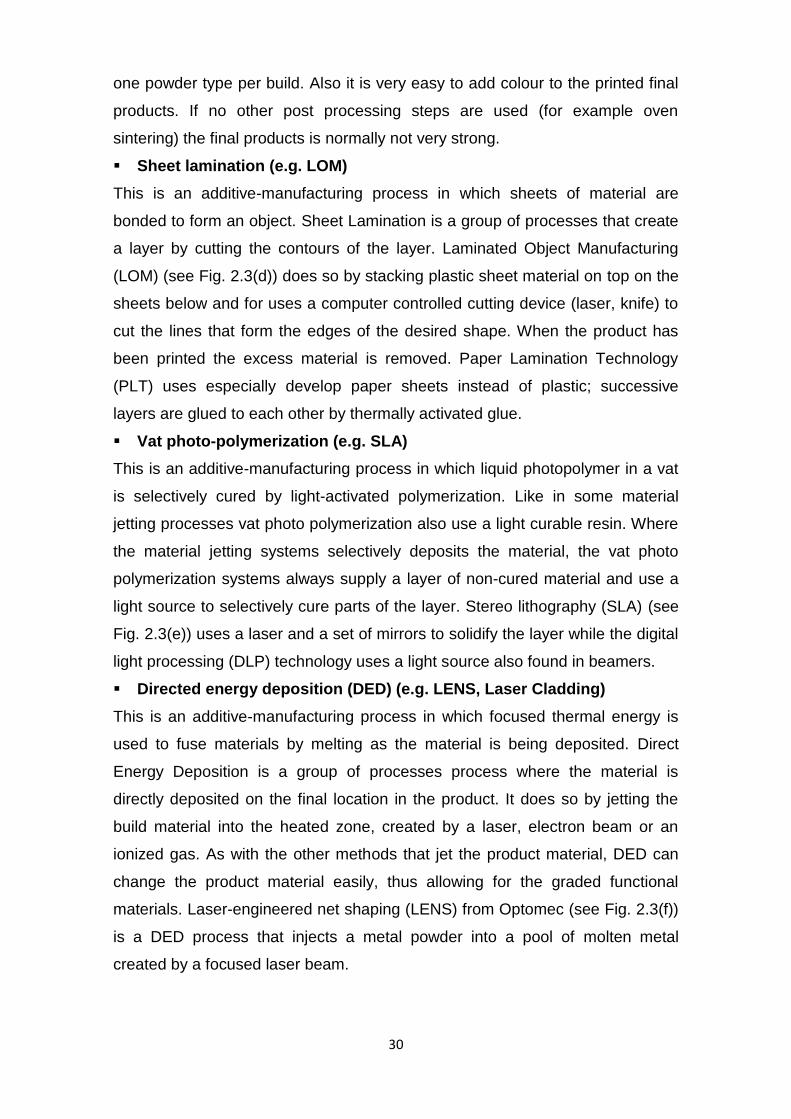
Material jetting (e.g. Objet, Solidscape)
This is an AM process in which droplets of build material are selectively
deposited (see Fig. 2.3(b)). Two types of material are predominantly used in this
group of processes; wax and photopolymers. Some processes are able to
directly jet metals. The advantage of this group of processes is that the nature
of the process allows changing the product material during a build. In this way
multi-functional or graded material properties are possible.
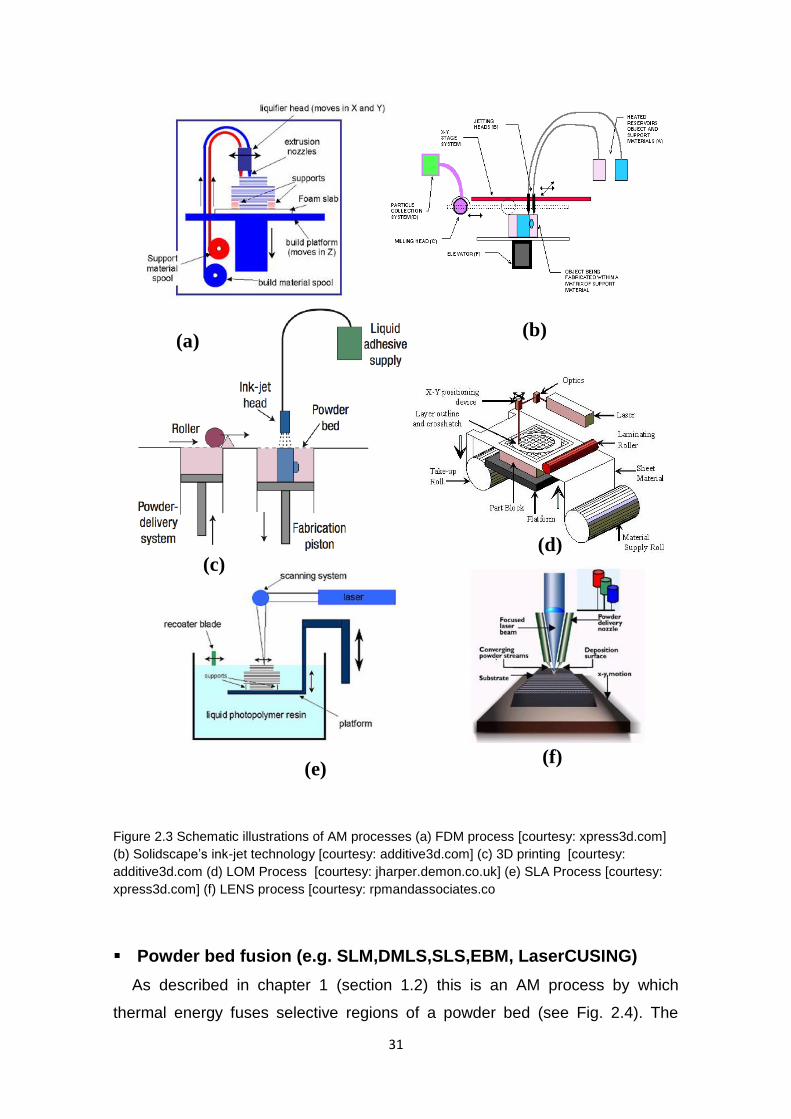
Binder jetting (e.g. Z-corp, Voxeljet)
This is an additive-manufacturing process in which a liquid bonding agent is
selectively deposited to join powder materials (see Fig. 2.3(c)). In the binder
jetting process group the product material is in a powdered form and the inkjet
head is used to locally disperse glue, thus binding the powders locally. Typically
two bins are used, a bin in where the product is formed and an extra bin with
fresh powder. After the powder in a layer has been solidified using the glue, the
build container is lowered and the powder bin is raised. A roller or a doctor
blade is used to move the powder from the storage bin to the build bin. A big
advantage of this method is that all kinds of powders can be used, albeit only
30
one powder type per build. Also it is very easy to add colour to the printed final
products. If no other post processing steps are used (for example oven
sintering) the final products is normally not very strong.
Sheet lamination (e.g. LOM)
This is an additive-manufacturing process in which sheets of material are
bonded to form an object. Sheet Lamination is a group of processes that create
a layer by cutting the contours of the layer. Laminated Object Manufacturing
(LOM) (see Fig. 2.3(d)) does so by stacking plastic sheet material on top on the
sheets below and for uses a computer controlled cutting device (laser, knife) to
cut the lines that form the edges of the desired shape. When the product has
been printed the excess material is removed. Paper Lamination Technology
(PLT) uses especially develop paper sheets instead of plastic; successive
layers are glued to each other by thermally activated glue.
Vat photo-polymerization (e.g. SLA)
This is an additive-manufacturing process in which liquid photopolymer in a vat
is selectively cured by light-activated polymerization. Like in some material
jetting processes vat photo polymerization also use a light curable resin. Where
the material jetting systems selectively deposits the material, the vat photo
polymerization systems always supply a layer of non-cured material and use a
light source to selectively cure parts of the layer. Stereo lithography (SLA) (see
Fig. 2.3(e)) uses a laser and a set of mirrors to solidify the layer while the digital
light processing (DLP) technology uses a light source also found in beamers.
Directed energy deposition (DED) (e.g. LENS, Laser Cladding)
This is an additive-manufacturing process in which focused thermal energy is
used to fuse materials by melting as the material is being deposited. Direct
Energy Deposition is a group of processes process where the material is
directly deposited on the final location in the product. It does so by jetting the
build material into the heated zone, created by a laser, electron beam or an
ionized gas. As with the other methods that jet the product material, DED can
change the product material easily, thus allowing for the graded functional
materials. Laser-engineered net shaping (LENS) from Optomec (see Fig. 2.3(f))
is a DED process that injects a metal powder into a pool of molten metal
created by a focused laser beam.
31
Figure 2.3 Schematic illustrations of AM processes (a) FDM process [courtesy: xpress3d.com]
(b) Solidscape’s ink-jet technology [courtesy: additive3d.com] (c) 3D printing [courtesy:
additive3d.com (d) LOM Process [courtesy: jharper.demon.co.uk] (e) SLA Process [courtesy:
xpress3d.com] (f) LENS process [courtesy: rpmandassociates.co
Powder bed fusion (e.g. SLM,DMLS,SLS,EBM, LaserCUSING)
As described in chapter 1 (section 1.2) this is an AM process by which
thermal energy fuses selective regions of a powder bed (see Fig. 2.4). The
(a) (b)
(c) (d)
(e) (f)
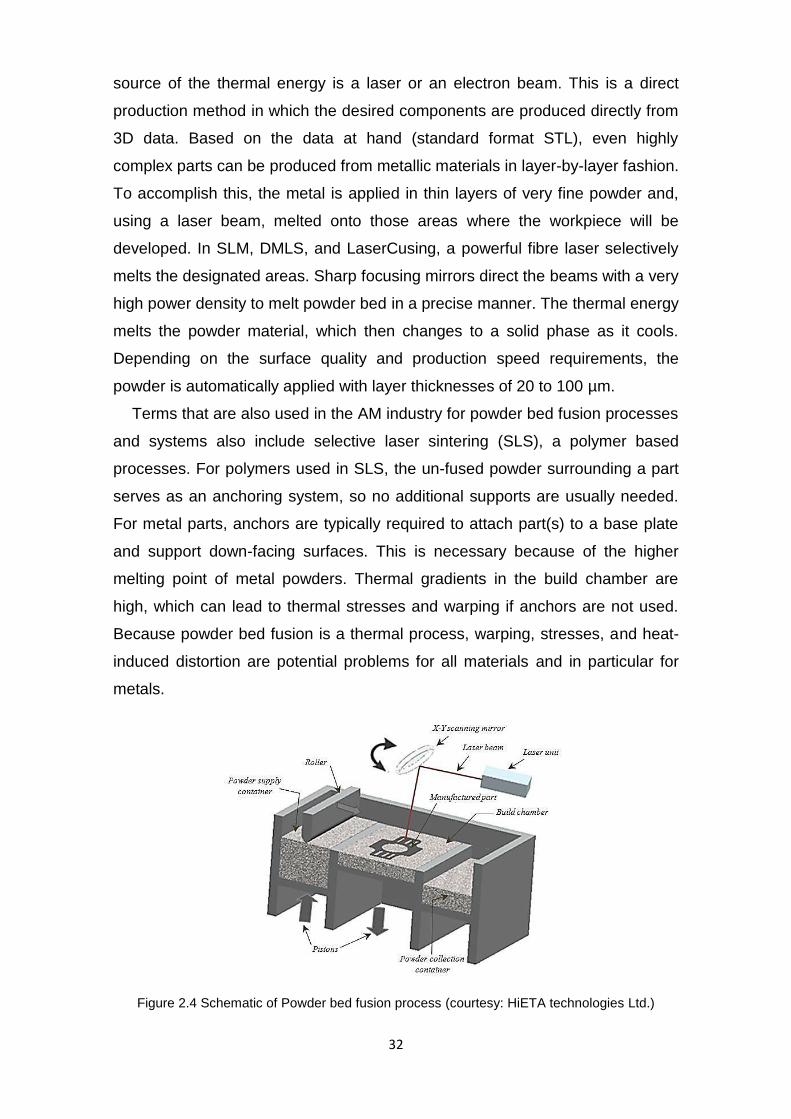
32
source of the thermal energy is a laser or an electron beam. This is a direct
production method in which the desired components are produced directly from
3D data. Based on the data at hand (standard format STL), even highly
complex parts can be produced from metallic materials in layer-by-layer fashion.
To accomplish this, the metal is applied in thin layers of very fine powder and,
using a laser beam, melted onto those areas where the workpiece will be
developed. In SLM, DMLS, and LaserCusing, a powerful fibre laser selectively
melts the designated areas. Sharp focusing mirrors direct the beams with a very
high power density to melt powder bed in a precise manner. The thermal energy
melts the powder material, which then changes to a solid phase as it cools.
Depending on the surface quality and production speed requirements, the
powder is automatically applied with layer thicknesses of 20 to 100 µm.
Terms that are also used in the AM industry for powder bed fusion processes
and systems also include selective laser sintering (SLS), a polymer based
processes. For polymers used in SLS, the un-fused powder surrounding a part
serves as an anchoring system, so no additional supports are usually needed.
For metal parts, anchors are typically required to attach part(s) to a base plate
and support down-facing surfaces. This is necessary because of the higher
melting point of metal powders. Thermal gradients in the build chamber are
high, which can lead to thermal stresses and warping if anchors are not used.
Because powder bed fusion is a thermal process, warping, stresses, and heat-
induced distortion are potential problems for all materials and in particular for
metals.
Figure 2.4 Schematic of Powder bed fusion process (courtesy: HiETA technologies Ltd.)

33
2.2.2 Product Development Process in AM Process
The design and manufacturing steps involved in AM are illustrated in Fig. 2.5.
The CAD model which represents the part to be manufactured is converted into
STL format. Nearly every AM technology uses the STL file format. The term
STL was derived from STereoLithograhy, which was the first commercial AM
technology from 3D Systems in the 1990s. Considered a de facto standard, STL
is a simple way of describing a CAD model in terms of its geometry alone. It
works by removing any construction data, modelling history, etc., and
approximating the surfaces of the model with a series of triangular facets
(Gibson et al. 2010). The minimum size of these triangles can be set within
most CAD software and the objective is to ensure the models created do not
show any obvious triangles on the surface. The basic rule of thumb is to ensure
that the minimum triangle offset is smaller than the resolution of the AM
machine.
This STL file is then transferred into the AM machine software which slices
the model into 2D slices with specified thicknesses. Different AM machines use
different slicing formats such as SLI (System layer interface) by 3D systems,
CLI (Common Layer Interface) by EOS, F&S (Fochele and Schwarze) by MTT
now Renishaw, SLC (Stratasys Layer Interface) by Stratasys. This is followed
by setting-up the processing parameters and preparing the materials. In metal
AM systems, an argon or nitrogen gas is pumped into the build chamber prior to
the build to evacuate the oxygen content and prevent the melt-pool
contamination. After the build is complete, the part is removed from the build
chamber and cleaned. Further post-processing may be required for parts
containing support structure. For metal parts, post stress-relieving heat
treatment cycle is required to relax the residual stresses accumulated in the part
during the build.
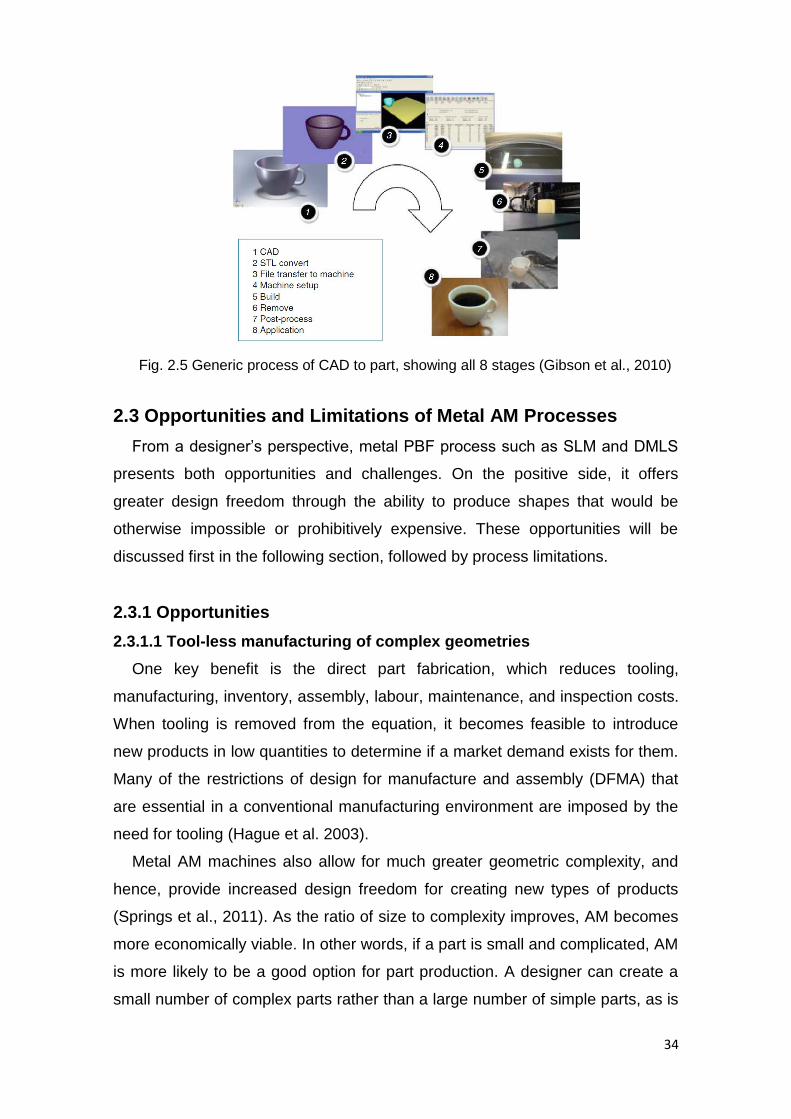
34
Fig. 2.5 Generic process of CAD to part, showing all 8 stages (Gibson et al., 2010)
2.3 Opportunities and Limitations of Metal AM Processes
From a designer’s perspective, metal PBF process such as SLM and DMLS
presents both opportunities and challenges. On the positive side, it offers
greater design freedom through the ability to produce shapes that would be
otherwise impossible or prohibitively expensive. These opportunities will be
discussed first in the following section, followed by process limitations.
2.3.1 Opportunities
2.3.1.1 Tool-less manufacturing of complex geometries
One key benefit is the direct part fabrication, which reduces tooling,
manufacturing, inventory, assembly, labour, maintenance, and inspection costs.
When tooling is removed from the equation, it becomes feasible to introduce
new products in low quantities to determine if a market demand exists for them.
Many of the restrictions of design for manufacture and assembly (DFMA) that
are essential in a conventional manufacturing environment are imposed by the
need for tooling (Hague et al. 2003).
Metal AM machines also allow for much greater geometric complexity, and
hence, provide increased design freedom for creating new types of products
(Springs et al., 2011). As the ratio of size to complexity improves, AM becomes
more economically viable. In other words, if a part is small and complicated, AM
is more likely to be a good option for part production. A designer can create a
small number of complex parts rather than a large number of simple parts, as is

35
typical for many conventional manufacturing processes (Gibson et al.2010). A
result of this reduction in part count also offers the possibility to reduce or
eliminate links in the traditional supply chain, thereby reducing lead times and
simplifying supply chain logistics.
2.3.1.2 Complex tooling with conformal cooling channels
The production of tools containing complex cooling channels (Conformal
Cooling) is already state of the art and allows the reduction of cycle time and
the improvement of the part quality in plastic injection moulding (Mansour and
Hague, 2003; Rännar et al., 2007). Example of this was shown in chapter 1
(Fig. 1.1)
2.3.1.3 Lightweight structures and performance improvements
Another area where AM can contribute to greater customer satisfaction is
through lightweight structures and improved product performance. The key is to
create a geometric shape that is closer to an “optimum” design rather than
settling for a compromise due to manufacturability constraints (Rosen et al.
2007). AM is capable of producing parts of unparalleled design complexity, and
when coupled to product functionality, the production of lightweight and more
efficient parts is possible. In AM, Lightweight structures are motivated by the
desire of putting material only where it is needed in the product. This also
requires tailoring the mechanical properties of lightweight structures to product
functional requirements. The build time and cost of making parts can be
significantly decreased by using internal low-volume structures that can replace
bulk materials.
Many of the highly structured organic forms in trees, bones, corals, and
sponges would be impossible to create using conventional manufacturing but
could be possible with AM. Such structures are can be used to reduce material
and weight or deliver more efficient heat transfer. These structures also offer
good aesthetic appearance.
2.3.1.4 Available Materials
The number of metal materials available for metal AM process is growing. A
lot of research has been conducted in AM processes on various metallic
materials such as stainless steels and tool steels (Childs et al. 2005, Kruth et al.
36
2004, Rombouts et al. 2006); Titanium alloys (Abe et al. 2003); Aluminum alloys
(Brandl et al. 2012); Nickel-based alloys (Amato et al. 2012); Cobalt–chromium
alloys (Wu et al., 2007; Jevremović et al. 2011); Copper-based alloys (Li et al.
2007); Gold (Hollander et al. 2003). Metal powders can vary widely in shape
(from spherical to irregular), size, and size distribution. For this reason,
processing characteristics in AM metal systems can vary widely as well. System
manufacturers work closely with powder suppliers to ensure consistency and
repeatability of metal powders to guarantee consistency and repeatability of
their AM processes. However, there are also a number of challenging limitations
on both process and design aspects that hinder a wider use of metal AM for the
production of functional parts, especially for sectors with high material
requirements like aerospace, automotive or medical. These limitations will be
highlighted in the following sections.
2.3.2 Limitations
2.3.2.1 Vaporization
One of undesirable phenomenon in metal AM is the vaporization that occurs
when the bed of powder is irradiated with high energy intensity. During the laser
melting process, the temperature of the powder particles exposed to the laser
beam exceeds the melting temperature of the material. A further increase in
temperature (about twice the material melting temperature) causes the
evaporation of the powder, so, there are fast-moving expansions of evaporated
particles, which generate an overpressure on the melted zone and the material
is ejected from its bed (Morgan et al., 2001).
2.3.2.2 Balling phenomenon
The other problem that may occur during the metal AM process is the
"balling" phenomenon, i.e. the formation of isolated spheres with a diameter
equal to the laser beam focus, which inhibits deposition and decreases the
density of produced part. It occurs when the molten material is unable to fully
wet the substrate because of surface tension. The phenomenon is caused by
an excessive amount of energy, which gives to the melted powder a too low
value in viscosity (Gu and Shen, 2009; Simchi 2006).

37
2.3.2.3 Anisotropic part properties
Most powder bed based metal AM systems that build metal parts melt the
materials and produce parts that approach 100% density. Metal parts produced
by metal AM have properties that can be quite different from conventional
wrought or cast metals. This has proven to be one of the biggest barriers to
widespread adoption of the technology. The properties of additive manufactured
metal materials are already widely analysed by many researchers: density
(Spierings & Levy 2009a), microstructure (Kruth et al. 2004, Simchi 2006) and
the static mechanical performance (Spierings et al. 2011, Yasa et al. 2010) are
well studied, pointing out that the static mechanical properties are typically in
the range of wrought conventional materials, although a specific anisotropy
exist which depend on build direction of the part. However, besides the
description of the material microstructure and some mechanical properties, the
today’s knowledge about the correlation between the microstructure of SLM
materials and corresponding properties are still poorly analysed.
2.3.2.4 Thermal stresses and deformation
In order to reach a high density in metal AM processes, the metallic powder
particles are fully molten, laser melting process is accompanied by the
development of residual stresses that derive from high thermal gradients in the
material. These stresses can cause distortion of the part, cracks or delamination
(Pohl et al., 2001; Matsumoto., 2002). As a result, sacrificial support structures
are needed for successful manufacturing of overhang and undercut sections in
complex metallic parts. These supports are essential for AM metallic parts
made by AM processes in order to prevent curling. After high power laser
irradiation, the metal which is cooled from high temperatures to room
temperature have a tendency to deform during the process due to thermal
stresses gradients generated which result a curling effects (Mercelis and Kruth,
2006). Support structure function is therefore to dissipate heat from the newly
melted layer and restrain part deflection caused by thermal stresses during
layer solidification. This ensures proper build condition and evenly distributed
layer for subsequent builds.

38
2.3.2.5 Material and energy consumption of support structures
The use of the support structures in AM are reported as being the main
restriction on part geometries, and the support placement is equally as
important as the part design (Pullin & Offen, 2008). Support structure influence
the amount of material used, build-time, surface finish, energy-consumption,
cost and post-processing requirements of the metal AM parts. Supports waste
materials and energy and add no direct value to the part and therefore, once the
manufacturing of the part is completed, it is necessary to remove them from the
part manually or in some cases by machining. AM machines consume
significant amounts of electrical energy per unit mass of material processed
(Mognol et al. 2006).
2.3.2.6 Lack of knowledge of design rules in AM
On the other hand, AM also poses some distinctive challenges for designers.
There is a need to learn and understand the specific constraints that AM brings
to manufacturing. Examples include minimum wall thickness, achievable
tolerances, support requirement, preferred build orientation, and
manufacturable cellular structures. These constraints are analogous to the
design-for-manufacture rules associated with conventional processes but are a
great deal less restrictive. Some AM design guidelines have been written to
help designers with this task. For example, a set of design rules for SLM was
developed by Thomas (2010). Some AM system manufacturers are also
providing guidelines for designers.
2.4 Sacrificial Support Structures
2.4.1 Support structure for SLA and FDM processes
Literatures involving the design and manufacturing of support structures in
AM are mainly related to polymer based processes such as Stereolithography
(SLA) and Fused Deposition Modelling (FDM) and have reported three main
aspects of work.
2.4.1.1 Minimize support volume by optimizing orientation
Many attempts have been made to minimize the support volume by changing
orientation of the parts of SLA (Allen and Dutta, 1994; Asberg, et al. 1997; Hur
and Lee, 1998; Majhi, et al. 1999; Yang, et al., 2001). Asberg, et al. (1997)
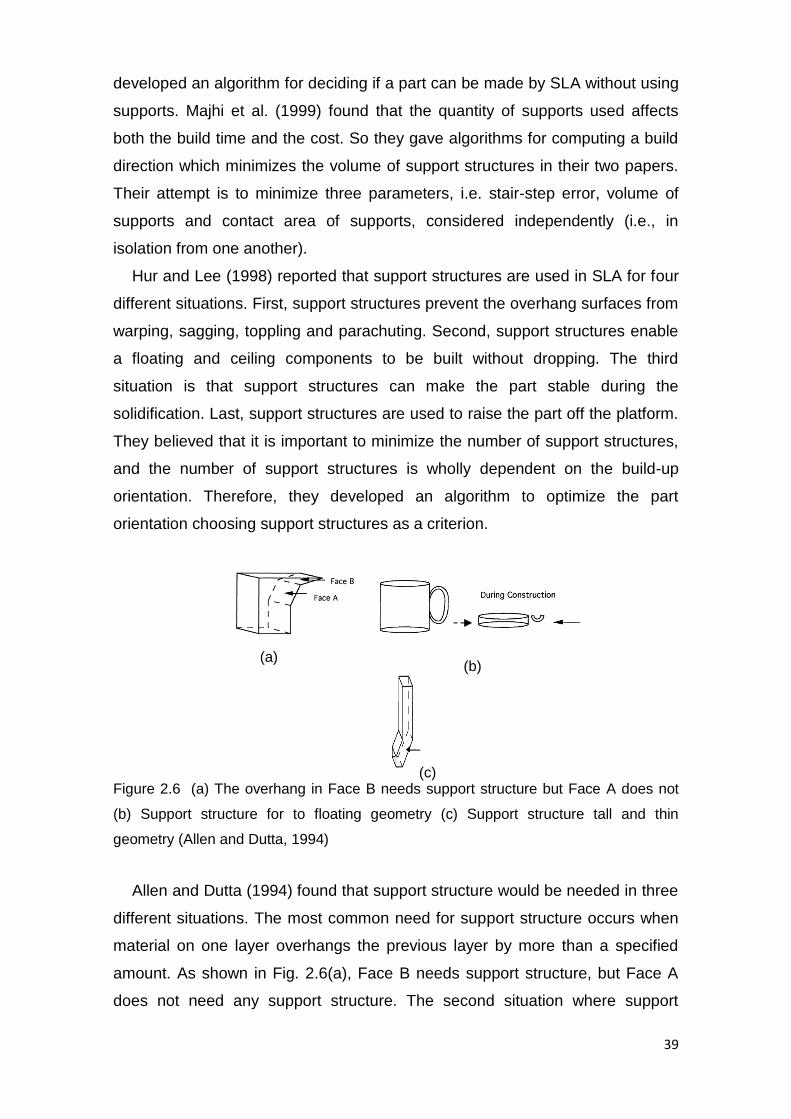
39
developed an algorithm for deciding if a part can be made by SLA without using
supports. Majhi et al. (1999) found that the quantity of supports used affects
both the build time and the cost. So they gave algorithms for computing a build
direction which minimizes the volume of support structures in their two papers.
Their attempt is to minimize three parameters, i.e. stair-step error, volume of
supports and contact area of supports, considered independently (i.e., in
isolation from one another).
Hur and Lee (1998) reported that support structures are used in SLA for four
different situations. First, support structures prevent the overhang surfaces from
warping, sagging, toppling and parachuting. Second, support structures enable
a floating and ceiling components to be built without dropping. The third
situation is that support structures can make the part stable during the
solidification. Last, support structures are used to raise the part off the platform.
They believed that it is important to minimize the number of support structures,
and the number of support structures is wholly dependent on the build-up
orientation. Therefore, they developed an algorithm to optimize the part
orientation choosing support structures as a criterion.
Figure 2.6 (a) The overhang in Face B needs support structure but Face A does not
(b) Support structure for to floating geometry (c) Support structure tall and thin
geometry (Allen and Dutta, 1994)
Allen and Dutta (1994) found that support structure would be needed in three
different situations. The most common need for support structure occurs when
material on one layer overhangs the previous layer by more than a specified
amount. As shown in Fig. 2.6(a), Face B needs support structure, but Face A
does not need any support structure. The second situation where support
(a) (b)
(c)

40
structures are needed is when a floating component is introduced during the
construction. See, for example, Fig. 2.6(b). The third case where external
supports might be required is when the object becomes unstable during the
construction, as shown in Fig. 2.6(c).
Support structures are built, layer by layer, simultaneously with the object.
After the object is constructed, the support structure must be removed, often
manually. For a complicated object this removal may be difficult, and also
reduce the quality of the surface finish. Therefore, Allen and Dutta (1994) found
the best direction for formation of an object with a minimal support structure. In
the orientation determined by the best direction of formation, the object needs a
minimal support structure, and has a lower centre of mass.
2.4.1.2. Generating support structures
In general, two methods are adopted to generate supports in practice. In the
past, supports were made by the design engineer working with the CAD
system. They were developed by trial and error, and were often too much or too
little for the parts being supported. Therefore, many researchers provided some
algorithms to automatically generate supports. Before designing an algorithm to
generate supports, researchers have to obtain some guidelines for support
structure design through practical experiments.
There also exist algorithms developed to automatically generate the support
structure for SLA and FDM processes (Kirschman et al., 1991; Oud-Heverlee
and Herenthout 2010; Huang et al., 2009; Kumar et al., 1995). Kirschman et al.
(1991) describes that support structures design consists of thin webbing,
usually the width of the laser beam. As illustrated in Fig. 2.7, the manufacturer
recommends that these webs should be 0.025mm thick, 6.35 to 12.7 mm tall
and 6.35 to 12.7mm apart in SLA (3D Systems, Inc., 1989). In addition, they
also recommend that the supports continue into the part for a distance of 1.0 to
1.5mm for proper adhesion. This adhesion is important for holding the part in
position. Some other guidelines for SLA support structures include: the base
support should be hatched at intervals of 17.8mm in an x-y pattern. All surfaces
within 20 degree of the horizontal and any perimeters must be supported. All
projections longer than 1.78 mm need gusset supports. Kirschman et al. (1991)
gives an automated support structure algorithm to relieve the user of the trial
and error approach to support design. This saves both time and money.

41
Supports that had taken over an hour to generate in CAD were successfully by
the program in less than one minute.
Figure 2.7 Recommended support structure for SLA (3D Systems, Inc., 1989).
Oud-Heverlee and Herenthout (2010) invented a new method to
automatically generate support structures for SLA or other RP technologies. In
their method, the region that requires support in each layer is first determined,
and a number of support points are defined in this region. In the next step, a
support mesh is generated connected to the object using these support points.
Finally, a support is generated from this support mesh. Their invention may
facilitate the generation of supports data by employing more automation and
less user analysis. Earl et al. (1999) provided an algorithm for automatically
generating support data from three-dimensional object data in their invention
patent. Huang et al. (2009) designed three different types of supports with
sloping walls. Compared to the generally adopted straight wall structure, these
sloping structures significantly reduce the volume of supports. They also
provided a robust algorithm to generate the sloping structures for FDM.
Three-Dimensional Printing (3DP) sometimes requires a larger support
structure to be used, and in some cases the downward facing surfaces of the
parts are completely encased in support material that can be removed by
breaking away or using a high-pressure water jet. FDM can also produce
supports in a soluble material that can be dissolved in a water-based solution
after the parts are produced.
2.4.1.3. Structural design of support structure
To remedy the disadvantages of the supporting structure made of solid
standing walls, some airier supporting structures are designed by Putte et al.

42
(1997). The author described the lattice as airier structures (i.e. more dispersed
and less dense) that can minimize the consumption of materials, time and
energy for making the RP components. Some airy supporting structures are
shown in Fig.2.8.
Figure 2.8 Some support structures designed by Putte et al. (1997)
2.4.2 Support structures for metal PBF processes
One of the major concerns in metal PBF processes such as SLM and DMLS
is the high residual stresses and distortion. Due to localised heating of laser
irradiation, complex thermal and phase transformation stresses are generated.
In addition, frequent thermal expansion and contraction of the previously
solidified layers during the process generate considerable thermal stresses and
stress gradients that can exceed the yield strength of the material. Residual
stresses can lead to part distortion, initiate fracture, and unwanted decrease in
strength of the part (Mercelis et al. 2006). In forming parts with overhanging
parts, it is important to make the first layer without distortion on the powder bed,
because the underlying powders do not restrict the distortion M. Matsumoto et
al. (2002).
Out of all the AM, metal based powder bed fusion processes have the most
difficult support requirements and most difficult to remove the supports as they
are dense metal, the traditional support methods and designs which are

43
developed for SLA and FDM are still used to support metallic functional
components built in PBF processes. The design of a part determines the
amount of support structures that is needed to prevent such distortion. Fig. 2.9
shows geometries that will require support structure in metal PBF process.
Support structures are needed to anchor the parts to a substrate, to prevent
movement during the process and to prevent overhang and floating surfaces
from curling up away from the correct geometry.
Figure 2.9 Geometric features that require support structures in SLM
There has been increasing demand and research of developing efficient
methods of making support structures for metallic AM process. Jhabvala et al.
(2012) propose a pulsed radiation for building the support structure. The pulsed
radiation utilizes different laser power for the part and the support, much lower
power used to consolidate the support structure which provides just enough
energy to bond the powder materials together. Mumtaz et al. (2011) developed
a method to eliminate the need for support by preventing parts from completely
solidifying during processing in certain low melting eutectic alloys such as
bismuth and zinc, but this method is currently restricted to only eutectic
materials. While much of these researches on metallic support are focused on
the process improvement, more effort is needed to enhance the structural
design of the support structure.
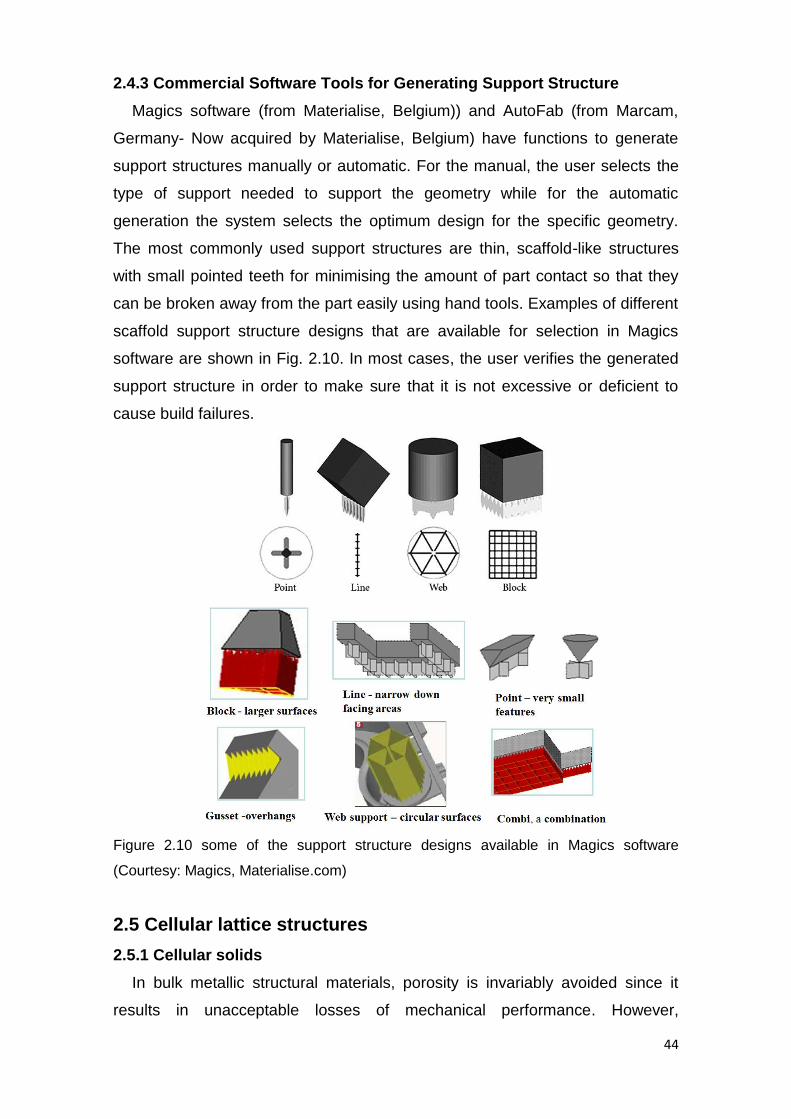
44
2.4.3 Commercial Software Tools for Generating Support Structure
Magics software (from Materialise, Belgium)) and AutoFab (from Marcam,
Germany- Now acquired by Materialise, Belgium) have functions to generate
support structures manually or automatic. For the manual, the user selects the
type of support needed to support the geometry while for the automatic
generation the system selects the optimum design for the specific geometry.
The most commonly used support structures are thin, scaffold-like structures
with small pointed teeth for minimising the amount of part contact so that they
can be broken away from the part easily using hand tools. Examples of different
scaffold support structure designs that are available for selection in Magics
software are shown in Fig. 2.10. In most cases, the user verifies the generated
support structure in order to make sure that it is not excessive or deficient to
cause build failures.
Figure 2.10 some of the support structure designs available in Magics software
(Courtesy: Magics, Materialise.com)
2.5 Cellular lattice structures
2.5.1 Cellular solids
In bulk metallic structural materials, porosity is invariably avoided since it
results in unacceptable losses of mechanical performance. However,

45
observations of natural materials (e.g., bone, and wood) have long indicated
that weight efficient load bearing members have a cellular structure consisting
of either reticulated ligaments (i.e., open cell) or encapsulated membranes (i.e.,
closed cell). Examples from the work of Gibson and Ashby (1997) are shown in
Fig. 2.11. Cellular solids are those made up of interconnected network of solid
strut or beam which form the edges and faces of cells. A significant body of
research into the structure and properties of these natural materials has now
been accumulated and organized (Gibson and Ashby, 1997). Metallic foams
may be considered the first attempt at creating engineered cellular solids. Fig.
2.12 shows examples of the topology of several metal foam products now
commercially available. A recently published design guide by Ashby M.F (2000)
reviews ways of making metal foams, their fundamental properties and some of
their current applications.
Figure 2.11 Examples of cellular solids found in biological systems. These materials
generally consist of reticulated (open cell) materials such as sponge and bone, and
membrane (closed cell) materials such as the various wood based materials (courtesy
Gibson and Ashby, Cellular Solids, 1997).

46
Figure 2.12 Examples of several metal foams. The Cymat, Alporas and ERG Duocel
foams are made from aluminum alloys by particle decomposition (Cymat), gas melt
injection (Alporas), and pressure casting (ERG Duocel). The nickel based Incofoam is
made by an electroless deposition process (Courtesy: Ashby, 2000).
2.5.2 Classification of cellular solids
Two common types of metal cellular structures include stochastic cellular
solids and non-stochastic periodic cellular solids (Chu et al., 2008). Example of
stochastic cellular structure is the metal foams shown in Fig. 2.12 which has a
random distribution of open or closed voids. Non-stochastic periodic structures
are those which have a characteristic 2-D or 3-D periodicity (i.e. repeating and
ordered unit cells). Honeycomb structure is good example of a prismatic cellular
solid. Fig. 2.13 shows a schematic profile representation of some common and
less common prismatic cellular solids. It should be noted that honeycomb is a
highly efficient 2-D load supporting topology, but nearly optimal for only a few
loading conditions, as is the case for all prismatic. There is another class of
cellular solids that is based upon 3-dimensional lattices of trusses (Gibson and
Ashby, 1997). 3-dimensional periodic lattice solids have uniform structures that
are based on repeating unit cells in three co-ordinates. They have been shown
to have superior mechanical properties including energy absorption, strength
and stiffness, as well as easier control of structure properties, better load
sustaining capabilities and higher surface area densities than stochastic and
prismatic cellular solids.
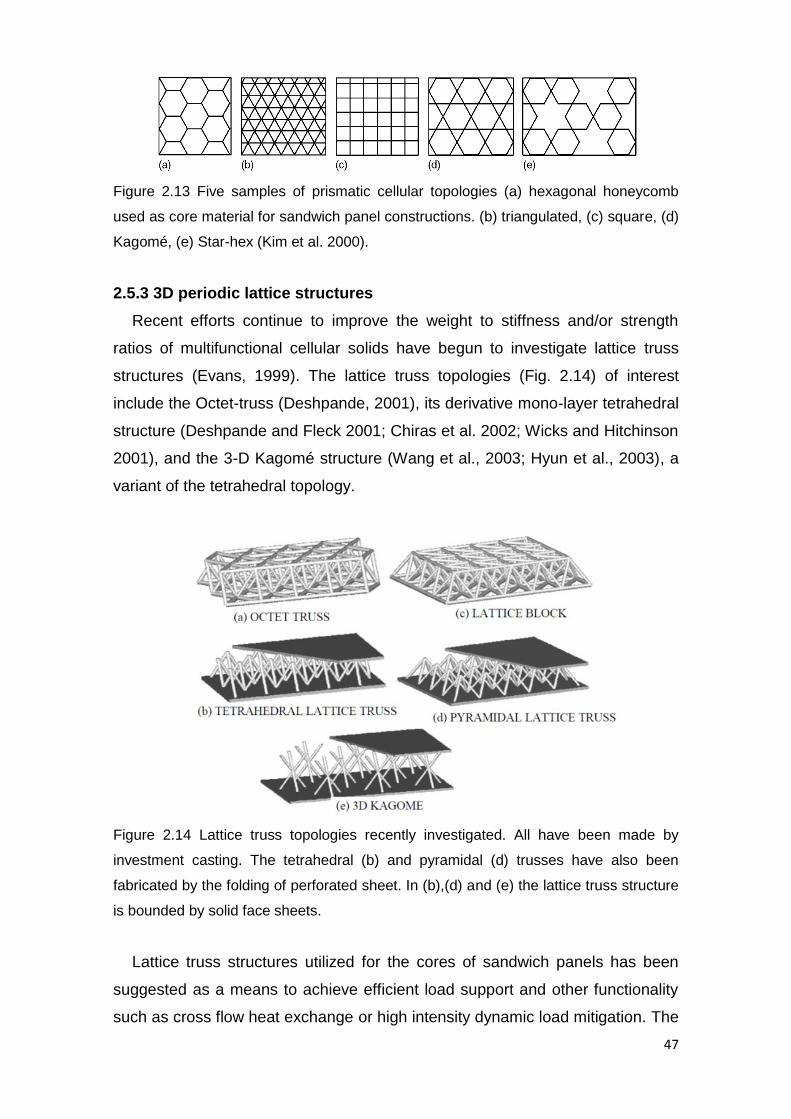
47
Figure 2.13 Five samples of prismatic cellular topologies (a) hexagonal honeycomb
used as core material for sandwich panel constructions. (b) triangulated, (c) square, (d)
Kagomé, (e) Star-hex (Kim et al. 2000).
2.5.3 3D periodic lattice structures
Recent efforts continue to improve the weight to stiffness and/or strength
ratios of multifunctional cellular solids have begun to investigate lattice truss
structures (Evans, 1999). The lattice truss topologies (Fig. 2.14) of interest
include the Octet-truss (Deshpande, 2001), its derivative mono-layer tetrahedral
structure (Deshpande and Fleck 2001; Chiras et al. 2002; Wicks and Hitchinson
2001), and the 3-D Kagomé structure (Wang et al., 2003; Hyun et al., 2003), a
variant of the tetrahedral topology.
Figure 2.14 Lattice truss topologies recently investigated. All have been made by
investment casting. The tetrahedral (b) and pyramidal (d) trusses have also been
fabricated by the folding of perforated sheet. In (b),(d) and (e) the lattice truss structure
is bounded by solid face sheets.
Lattice truss structures utilized for the cores of sandwich panels has been
suggested as a means to achieve efficient load support and other functionality
such as cross flow heat exchange or high intensity dynamic load mitigation. The
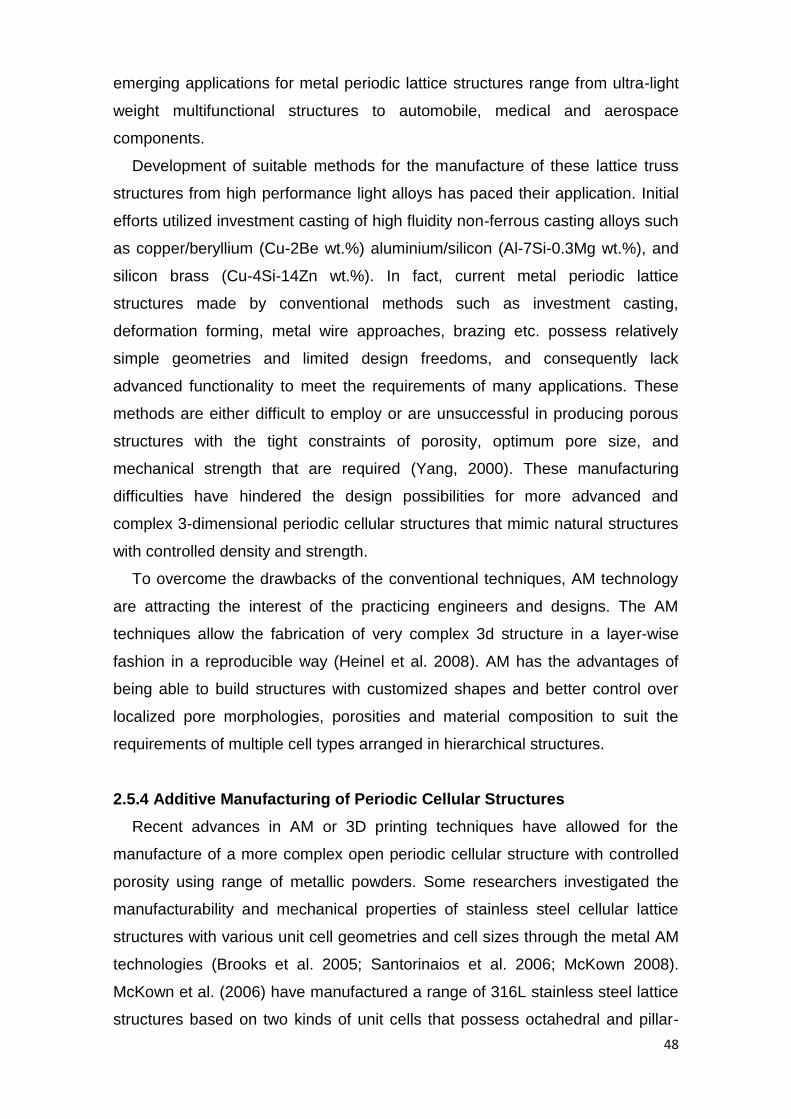
48
emerging applications for metal periodic lattice structures range from ultra-light
weight multifunctional structures to automobile, medical and aerospace
components.
Development of suitable methods for the manufacture of these lattice truss
structures from high performance light alloys has paced their application. Initial
efforts utilized investment casting of high fluidity non-ferrous casting alloys such
as copper/beryllium (Cu-2Be wt.%) aluminium/silicon (Al-7Si-0.3Mg wt.%), and
silicon brass (Cu-4Si-14Zn wt.%). In fact, current metal periodic lattice
structures made by conventional methods such as investment casting,
deformation forming, metal wire approaches, brazing etc. possess relatively
simple geometries and limited design freedoms, and consequently lack
advanced functionality to meet the requirements of many applications. These
methods are either difficult to employ or are unsuccessful in producing porous
structures with the tight constraints of porosity, optimum pore size, and
mechanical strength that are required (Yang, 2000). These manufacturing
difficulties have hindered the design possibilities for more advanced and
complex 3-dimensional periodic cellular structures that mimic natural structures
with controlled density and strength.
To overcome the drawbacks of the conventional techniques, AM technology
are attracting the interest of the practicing engineers and designs. The AM
techniques allow the fabrication of very complex 3d structure in a layer-wise
fashion in a reproducible way (Heinel et al. 2008). AM has the advantages of
being able to build structures with customized shapes and better control over
localized pore morphologies, porosities and material composition to suit the
requirements of multiple cell types arranged in hierarchical structures.
2.5.4 Additive Manufacturing of Periodic Cellular Structures
Recent advances in AM or 3D printing techniques have allowed for the
manufacture of a more complex open periodic cellular structure with controlled
porosity using range of metallic powders. Some researchers investigated the
manufacturability and mechanical properties of stainless steel cellular lattice
structures with various unit cell geometries and cell sizes through the metal AM
technologies (Brooks et al. 2005; Santorinaios et al. 2006; McKown 2008).
McKown et al. (2006) have manufactured a range of 316L stainless steel lattice
structures based on two kinds of unit cells that possess octahedral and pillar-

49
octahedral topologies respectively by the SLM process and studied the
compression and blast loading behavior of the lattice structures. A few studies
attempted to fabricate pure titanium and titanium alloy periodic cellular lattice
structures with interconnected pores by metal AM technologies, most of which
were aimed at medical applications such as bone implants because the
mechanical properties of periodic lattice structures can be tailored to match
those of natural bones. Example of this is the work by Heinl et al. (2008) who
manufactured periodic cellular Ti-6Al-4V structures with interconnected porosity
suitable for bone ingrowth using EBM.
The compressive strength and elastic modulus are similar to those of human
bone, which might minimize stress-shielding effects; Mullen et al. (2009) have
manufactured cellular titanium structures based on an octahedral unit cell
through SLM for the purpose of bone in-growth applications, and the produced
structures possessed the porosity of 10-95% and compression strength of 0.5-
350MPa comparable to the typical naturally occurring range of natural bones;
Bertol et al. (2010) reported the DMLS process and its constraints for the
production of customized implants in titanium alloy with complex geometry and
internal periodic lattice structures. More recently, Ramirez et al. (2011)
fabricated Cu open periodic mesh structures by EBM, which exhibit
considerable potential for complex multi-functional electrical and thermal
management systems, especially heat exchange devices due to the superior
thermal and electrical conductivity of Cu.
These 3D periodic lattice structures reported in literature mainly consist of
strait prismatic strut making up the unit cell with specific cell size and thickness.
The Magics software has recently introduced some of these structures including
Hexagon, Sphere, Octagon, Cube, Tower, Rhombic, Diamond, Diagonal cross,
X-cross, Circular-pipe, and Triangular etc. as shown in Fig. 2.15.
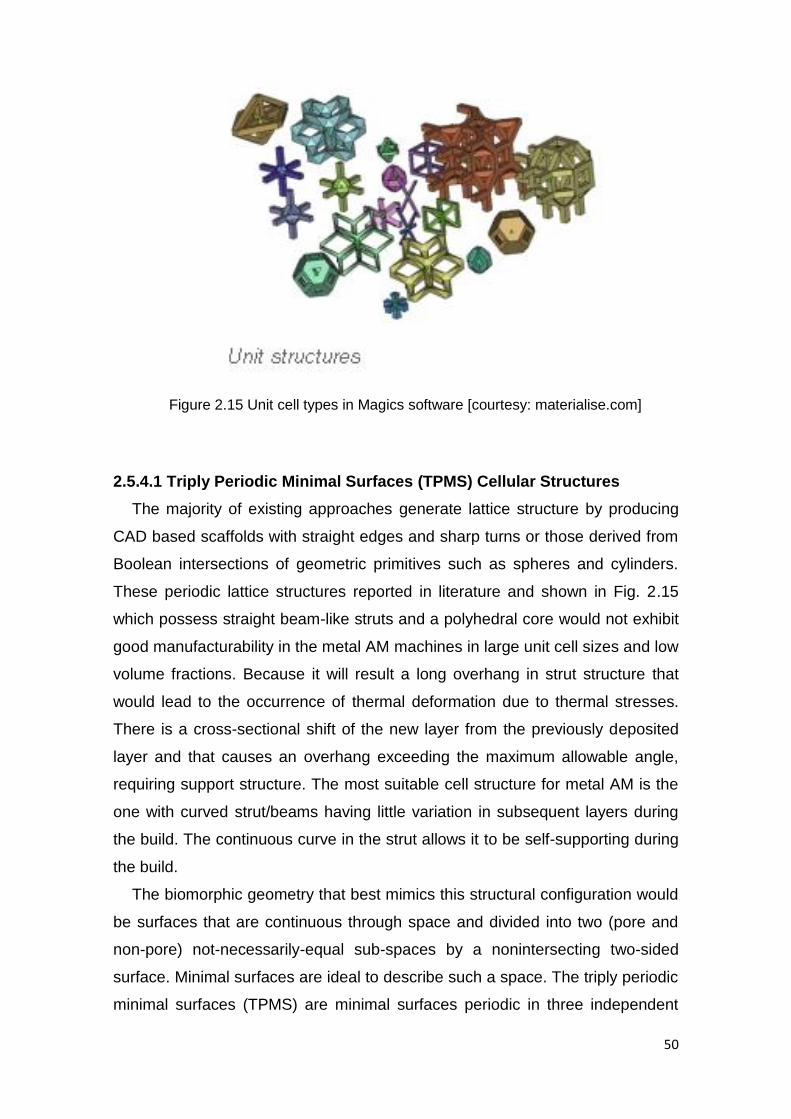
50
Figure 2.15 Unit cell types in Magics software [courtesy: materialise.com]
2.5.4.1 Triply Periodic Minimal Surfaces (TPMS) Cellular Structures
The majority of existing approaches generate lattice structure by producing
CAD based scaffolds with straight edges and sharp turns or those derived from
Boolean intersections of geometric primitives such as spheres and cylinders.
These periodic lattice structures reported in literature and shown in Fig. 2.15
which possess straight beam-like struts and a polyhedral core would not exhibit
good manufacturability in the metal AM machines in large unit cell sizes and low
volume fractions. Because it will result a long overhang in strut structure that
would lead to the occurrence of thermal deformation due to thermal stresses.
There is a cross-sectional shift of the new layer from the previously deposited
layer and that causes an overhang exceeding the maximum allowable angle,
requiring support structure. The most suitable cell structure for metal AM is the
one with curved strut/beams having little variation in subsequent layers during
the build. The continuous curve in the strut allows it to be self-supporting during
the build.
The biomorphic geometry that best mimics this structural configuration would
be surfaces that are continuous through space and divided into two (pore and
non-pore) not-necessarily-equal sub-spaces by a nonintersecting two-sided
surface. Minimal surfaces are ideal to describe such a space. The triply periodic
minimal surfaces (TPMS) are minimal surfaces periodic in three independent
51
directions, extending infinitely and, in the absence of self-intersections,
partitioning the space into two labyrinths. Fig.2.16 shows the TPMS Primitive
(P) surface, the Diamond (D) surface discovered by Schwartz (1890) and the
Gyroid (G) surface discovered by Schoen (1970). Surfaces whose mean
curvature H is everywhere zero are minimal surfaces – any sufficiently small
patch cut from a minimal surface has the least area of all surface patches with
the same boundary. The TPMS are particularly fascinating because they are
without self-intersections and partition in the space into two labyrinths.
Fig. 2.16 Dimensional tessellations of Schwarz's Primitive (left), and Diamond (centre)
and Schoen's Gyroid (right) Triply Periodic Minimal Surfaces [courtesy: susqu.edu]
2.6 Conclusion
Metal AM in particular powder bed fusion processes such as SLM and EBM
are capable of producing nearly fully-dense inter-connected metal components
directly from computer-aided design (CAD) models using a range of metallic
powders. Recently, metal AM technologies have been employed to build more
advanced metallic cellular lattice structures using several metal materials
including stainless steel, pure titanium, titanium alloy and copper. Despite the
many promising design freedoms, metal AM faces a major technical and design
barriers in building complex geometries. One of the main challenges is that
overhanging geometries require support structures during the build. The
function of support structure is to prevent part curling or distortion resulting from
thermal stresses by anchoring the newly melted layer in position. Because
support structures consume expensive raw materials, use a considerable
amount of laser consolidation energy and add to production time and cost there
is considerable interest of design optimisations to reduce support structures
materials.
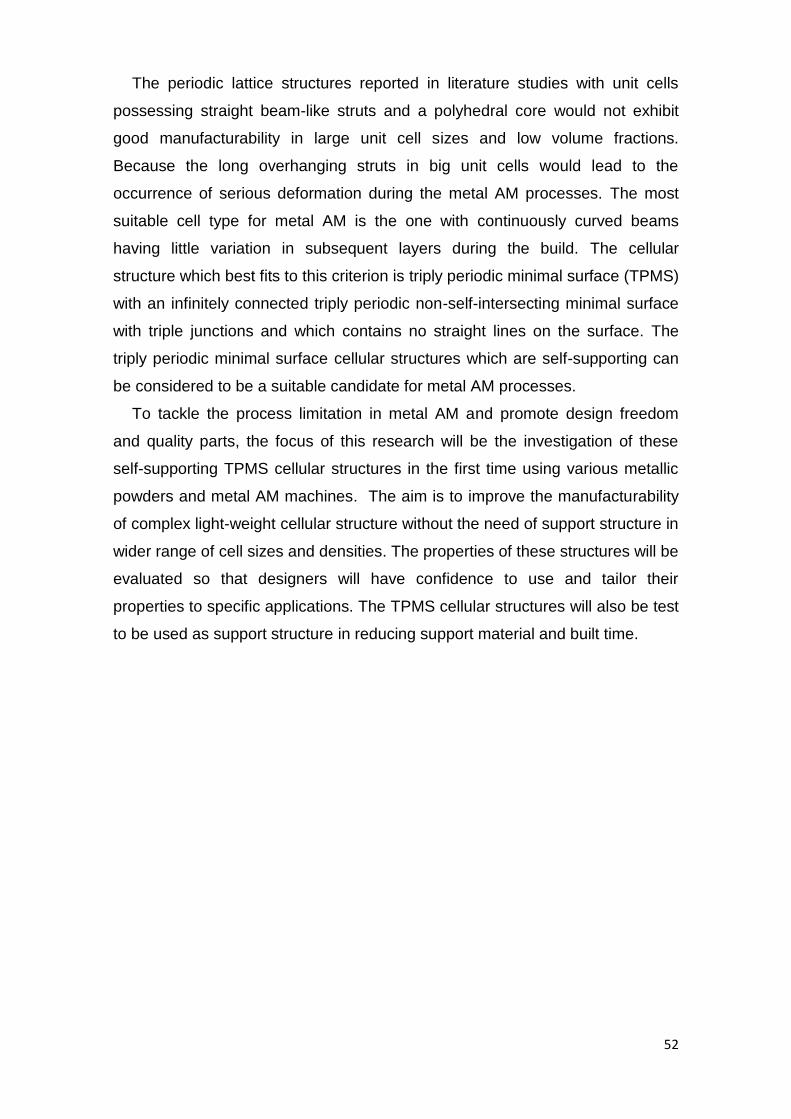
52
The periodic lattice structures reported in literature studies with unit cells
possessing straight beam-like struts and a polyhedral core would not exhibit
good manufacturability in large unit cell sizes and low volume fractions.
Because the long overhanging struts in big unit cells would lead to the
occurrence of serious deformation during the metal AM processes. The most
suitable cell type for metal AM is the one with continuously curved beams
having little variation in subsequent layers during the build. The cellular
structure which best fits to this criterion is triply periodic minimal surface (TPMS)
with an infinitely connected triply periodic non-self-intersecting minimal surface
with triple junctions and which contains no straight lines on the surface. The
triply periodic minimal surface cellular structures which are self-supporting can
be considered to be a suitable candidate for metal AM processes.
To tackle the process limitation in metal AM and promote design freedom
and quality parts, the focus of this research will be the investigation of these
self-supporting TPMS cellular structures in the first time using various metallic
powders and metal AM machines. The aim is to improve the manufacturability
of complex light-weight cellular structure without the need of support structure in
wider range of cell sizes and densities. The properties of these structures will be
evaluated so that designers will have confidence to use and tailor their
properties to specific applications. The TPMS cellular structures will also be test
to be used as support structure in reducing support material and built time.

53
Part Two:
Materials and Methods, Preliminary
experiments, and Finite Element Simulation
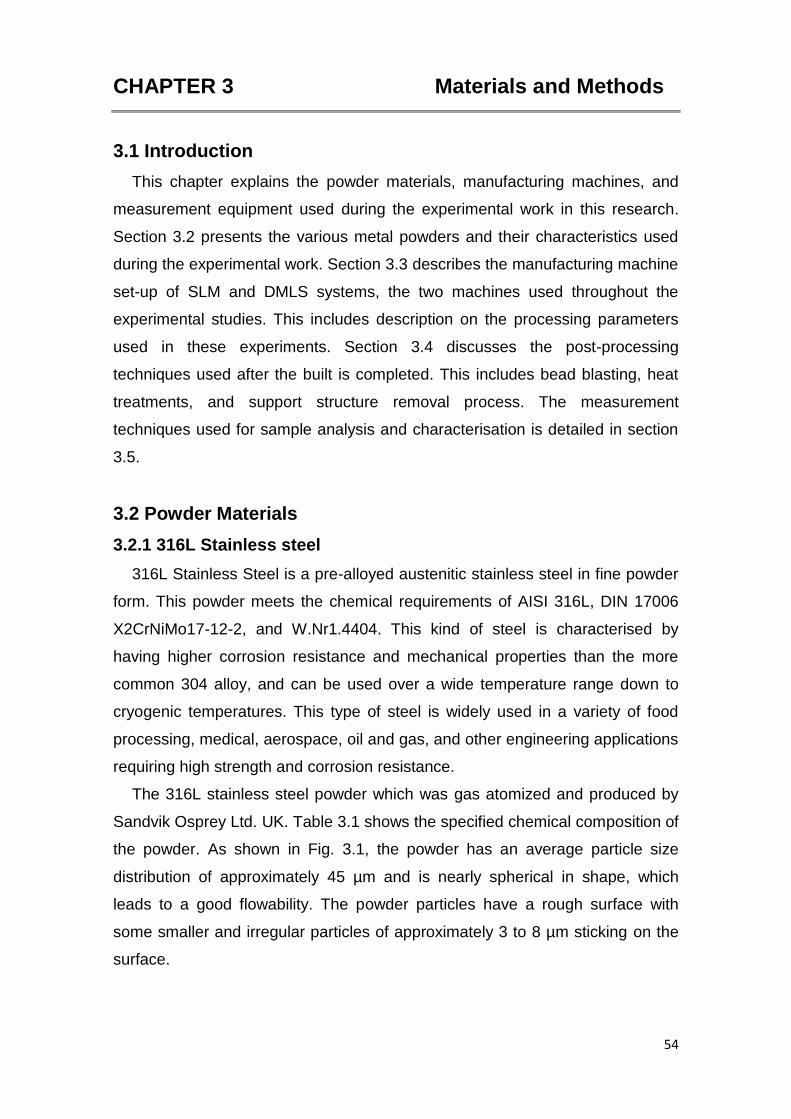
54
CHAPTER 3 Materials and Methods
3.1 Introduction
This chapter explains the powder materials, manufacturing machines, and
measurement equipment used during the experimental work in this research.
Section 3.2 presents the various metal powders and their characteristics used
during the experimental work. Section 3.3 describes the manufacturing machine
set-up of SLM and DMLS systems, the two machines used throughout the
experimental studies. This includes description on the processing parameters
used in these experiments. Section 3.4 discusses the post-processing
techniques used after the built is completed. This includes bead blasting, heat
treatments, and support structure removal process. The measurement
techniques used for sample analysis and characterisation is detailed in section
3.5.
3.2 Powder Materials
3.2.1 316L Stainless steel
316L Stainless Steel is a pre-alloyed austenitic stainless steel in fine powder
form. This powder meets the chemical requirements of AISI 316L, DIN 17006
X2CrNiMo17-12-2, and W.Nr1.4404. This kind of steel is characterised by
having higher corrosion resistance and mechanical properties than the more
common 304 alloy, and can be used over a wide temperature range down to
cryogenic temperatures. This type of steel is widely used in a variety of food
processing, medical, aerospace, oil and gas, and other engineering applications
requiring high strength and corrosion resistance.
The 316L stainless steel powder which was gas atomized and produced by
Sandvik Osprey Ltd. UK. Table 3.1 shows the specified chemical composition of
the powder. As shown in Fig. 3.1, the powder has an average particle size
distribution of approximately 45 µm and is nearly spherical in shape, which
leads to a good flowability. The powder particles have a rough surface with
some smaller and irregular particles of approximately 3 to 8 µm sticking on the
surface.
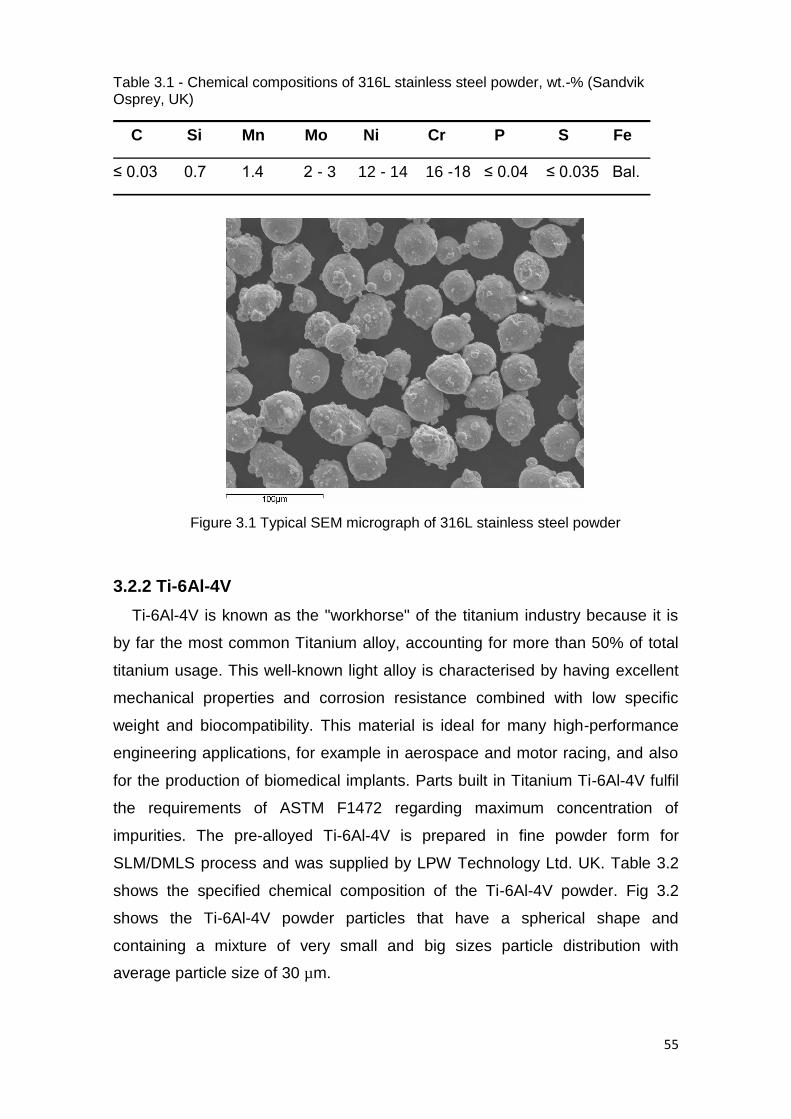
55
Table 3.1 - Chemical compositions of 316L stainless steel powder, wt.-% (Sandvik Osprey, UK)
C Si Mn Mo Ni Cr P S Fe
≤ 0.03 0.7 1.4 2 - 3 12 - 14 16 -18 ≤ 0.04 ≤ 0.035 Bal.
Figure 3.1 Typical SEM micrograph of 316L stainless steel powder
3.2.2 Ti-6Al-4V
Ti-6Al-4V is known as the "workhorse" of the titanium industry because it is
by far the most common Titanium alloy, accounting for more than 50% of total
titanium usage. This well-known light alloy is characterised by having excellent
mechanical properties and corrosion resistance combined with low specific
weight and biocompatibility. This material is ideal for many high-performance
engineering applications, for example in aerospace and motor racing, and also
for the production of biomedical implants. Parts built in Titanium Ti-6Al-4V fulfil
the requirements of ASTM F1472 regarding maximum concentration of
impurities. The pre-alloyed Ti-6Al-4V is prepared in fine powder form for
SLM/DMLS process and was supplied by LPW Technology Ltd. UK. Table 3.2
shows the specified chemical composition of the Ti-6Al-4V powder. Fig 3.2
shows the Ti-6Al-4V powder particles that have a spherical shape and
containing a mixture of very small and big sizes particle distribution with
average particle size of 30 µm.

56
Table 3.2- Chemical compositions of Ti-6Al-4V powder, wt. % (LPW Technology, UK)
Al N H2 O V C Fe Ti
5.5-6.5 0.3 Max. 0.0125 Max. 0.2 Max. 3.5-4.5 0.08 Max. 0.25 Max. Bal.
Figure 3.2 SEM micrograph of Titanium alloy (Ti-6Al-4V) powder with different
magnification
3.2.3 AlSi10Mg
Aluminium AlSi10Mg is a typical casting alloy used for parts with thin walls
and complex geometry. AlSi10Mg are ideal for applications which require a
combination of good thermal properties and low weight. Table 3.3 shows the
chemical composition of the AlSi10Mg powder. The AlSi10Mg powder which is
prepared for DMLS machines was supplied by EOS GmbH, Germany. Fig 3.3
depicts the SEM images of the as-received AlSi10Mg alloy powder. The powder
has a nearly spherical shape and smooth surfaces with an average particle size
of 40 µm.
Table 3.3- Chemical compositions of AlSi10Mg powder, wt. % (LPW Technology, UK)
Si Cu Mn Mg Zn Fe Al
9-11 <0.1. 0.05 0.45-0.6 0.05 <0.55 Bal.
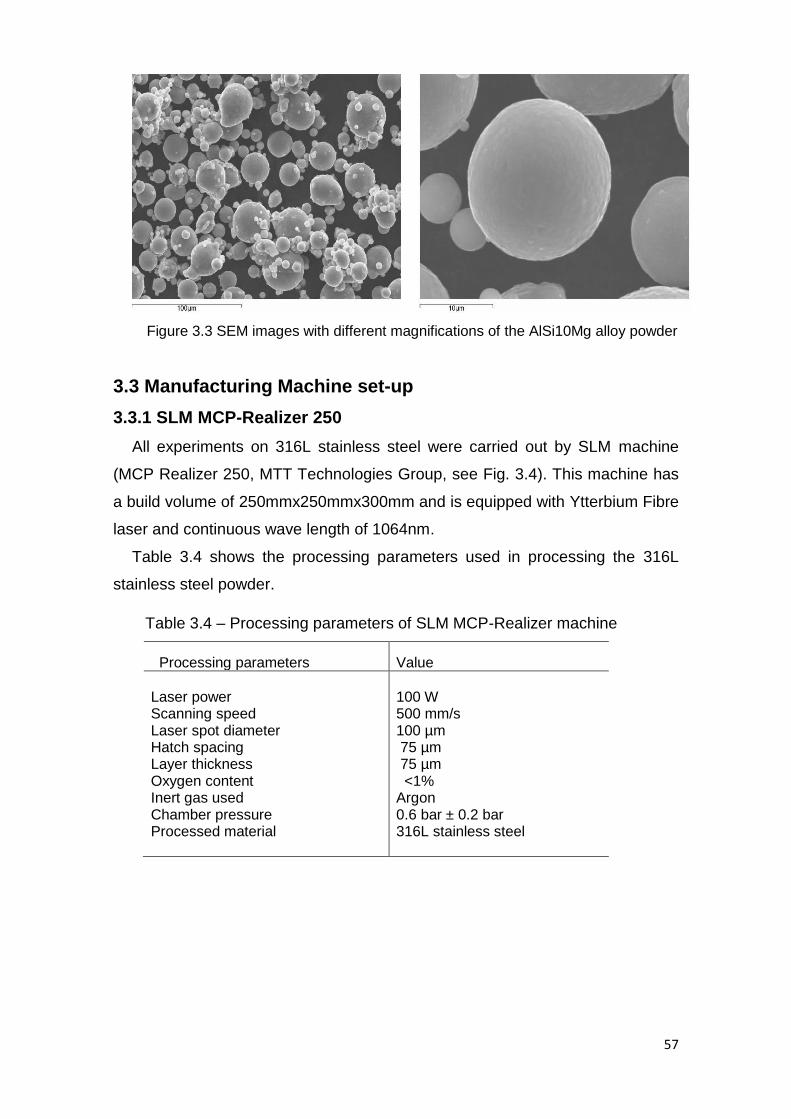
57
Figure 3.3 SEM images with different magnifications of the AlSi10Mg alloy powder
3.3 Manufacturing Machine set-up
3.3.1 SLM MCP-Realizer 250
All experiments on 316L stainless steel were carried out by SLM machine
(MCP Realizer 250, MTT Technologies Group, see Fig. 3.4). This machine has
a build volume of 250mmx250mmx300mm and is equipped with Ytterbium Fibre
laser and continuous wave length of 1064nm.
Table 3.4 shows the processing parameters used in processing the 316L
stainless steel powder.
Table 3.4 – Processing parameters of SLM MCP-Realizer machine
Processing parameters Value
Laser power Scanning speed Laser spot diameter Hatch spacing Layer thickness Oxygen content Inert gas used Chamber pressure Processed material
100 W 500 mm/s 100 µm 75 µm 75 µm <1% Argon 0.6 bar ± 0.2 bar 316L stainless steel
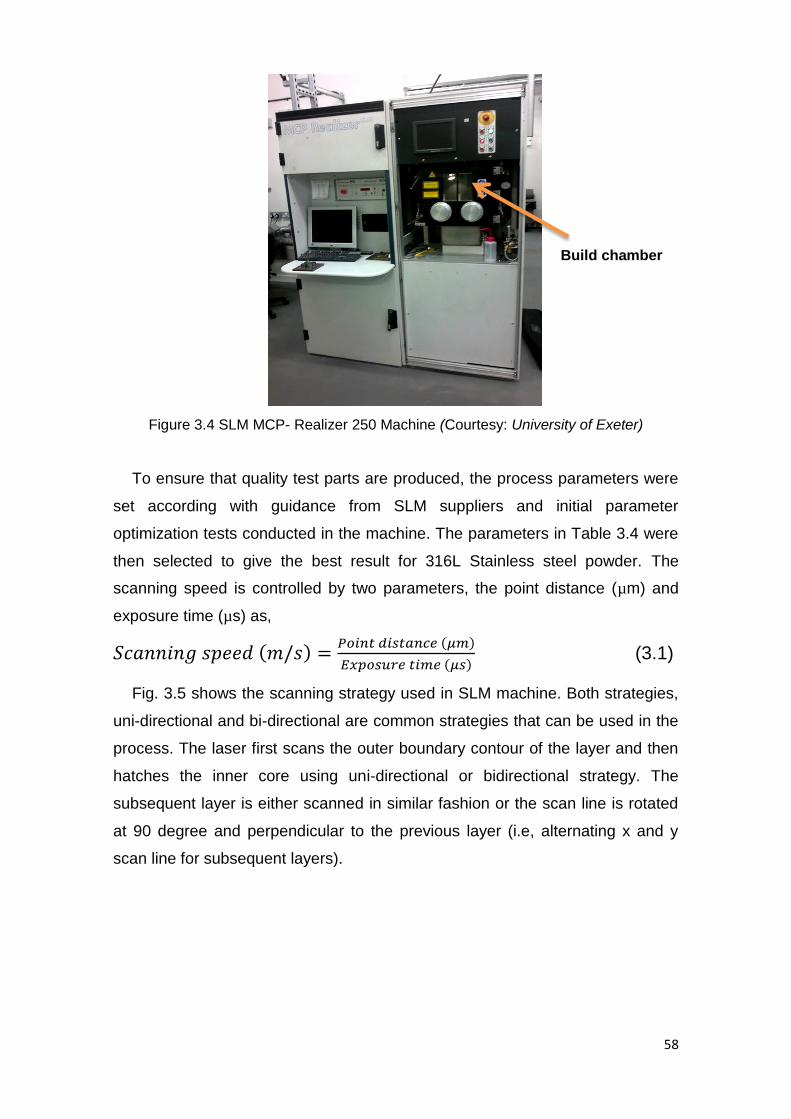
58
Figure 3.4 SLM MCP- Realizer 250 Machine (Courtesy: University of Exeter)
To ensure that quality test parts are produced, the process parameters were
set according with guidance from SLM suppliers and initial parameter
optimization tests conducted in the machine. The parameters in Table 3.4 were
then selected to give the best result for 316L Stainless steel powder. The
scanning speed is controlled by two parameters, the point distance (µm) and
exposure time (µs) as,
( ) ( )
( ) (3.1)
Fig. 3.5 shows the scanning strategy used in SLM machine. Both strategies,
uni-directional and bi-directional are common strategies that can be used in the
process. The laser first scans the outer boundary contour of the layer and then
hatches the inner core using uni-directional or bidirectional strategy. The
subsequent layer is either scanned in similar fashion or the scan line is rotated
at 90 degree and perpendicular to the previous layer (i.e, alternating x and y
scan line for subsequent layers).
Build chamber

59
Figure 3.5 Scanning strategy used in SLM (a) Uni-directional (b) Bi-directional
The powder deposition is controlled by the build platform movement in z-axis
and equivalent to the layer thickness and the back-and-forth movement of
recoater, which spreads a thin powder layer on the build plate. All parts were
built on a thick steel plate pinned on to the platform. To minimize disruptions
during the build, a sufficient amount of powder was stored in a tank located at
the back side of the machine. To reduce oxygen content in the chamber and
avoid oxidation during the build process, an Argon gas is pumped into the build
chamber with controlled pressure level and allowed to flash out oxygen until
oxygen level reads below 1%.
After the machine set-up and powder preparation is completed the part files
are loaded into the machine software (usually Magics software is used to slice
the geometry according to the layer thickness and choose the location of the
part in the platform). The machine controller software translates the 2D slice
data into key processing instructions consisting of co-ordinates, point distances,
exposure/dwell time of the laser beam etc.
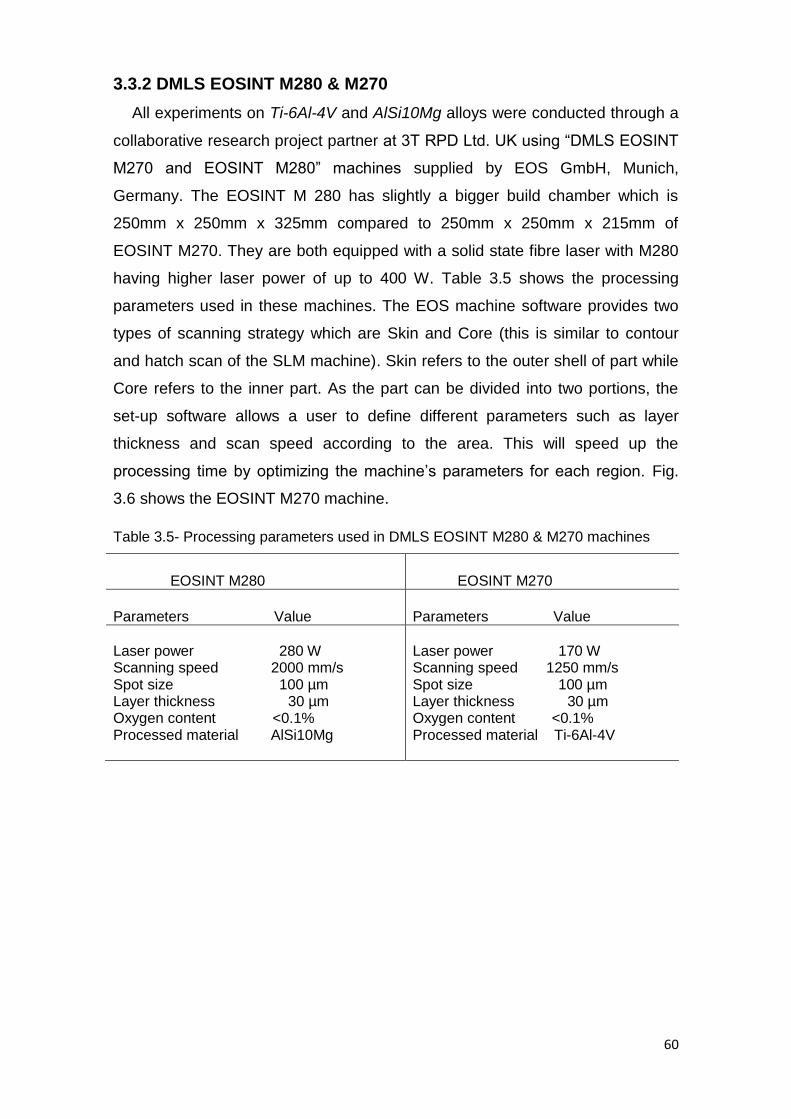
60
3.3.2 DMLS EOSINT M280 & M270
All experiments on Ti-6Al-4V and AlSi10Mg alloys were conducted through a
collaborative research project partner at 3T RPD Ltd. UK using “DMLS EOSINT
M270 and EOSINT M280” machines supplied by EOS GmbH, Munich,
Germany. The EOSINT M 280 has slightly a bigger build chamber which is
250mm x 250mm x 325mm compared to 250mm x 250mm x 215mm of
EOSINT M270. They are both equipped with a solid state fibre laser with M280
having higher laser power of up to 400 W. Table 3.5 shows the processing
parameters used in these machines. The EOS machine software provides two
types of scanning strategy which are Skin and Core (this is similar to contour
and hatch scan of the SLM machine). Skin refers to the outer shell of part while
Core refers to the inner part. As the part can be divided into two portions, the
set-up software allows a user to define different parameters such as layer
thickness and scan speed according to the area. This will speed up the
processing time by optimizing the machine’s parameters for each region. Fig.
3.6 shows the EOSINT M270 machine.
Table 3.5- Processing parameters used in DMLS EOSINT M280 & M270 machines
EOSINT M280 EOSINT M270
Parameters Value Parameters Value
Laser power 280 W Scanning speed 2000 mm/s Spot size 100 µm Layer thickness 30 µm Oxygen content <0.1% Processed material AlSi10Mg
Laser power 170 W Scanning speed 1250 mm/s Spot size 100 µm Layer thickness 30 µm Oxygen content <0.1% Processed material Ti-6Al-4V

61
Figure 3.6 EOS GmbH M270 Machine, source; (Courtesy: www.eos.info)
3.4 Post-processing
3.4.1 Heat treatment
In normal SLM and DMLS manufacturing practice, all parts go through
stress-relieving heat treatment process prior to support structure removal,
whereby all residual stresses are released from the part. Residual stresses if
not properly released through heat treatment processes could cause the part to
deflect after it is removed from base plat/platform and the supporting structure
due to stress relaxation. The Ti-6Al-4V and AlSi10Mg parts were annealed in an
electric oven with controllable temperature using the following stress-relieving
heat treatment cycles:
Heat Treatment Cycle:
Ramp to 720°C – 60mins
Hold at 720°C – 35mins
Ramp to 680°C – 25mins
Hold at 680°C – 180mins
Cool in argon to below 400˚C
Cool in air / argon to room temperature
3.4.2 Wire-Electric Discharge Machine (Wire- EDM)
Wire-Electric Discharge Machine (Agie Challenge V2 Wire EDM) was used to
remove the parts from the base plate and support structure. The schematic of
the wire-EDM process is as shown in Fig. 3.7. In this process a thin single-
Build chamber
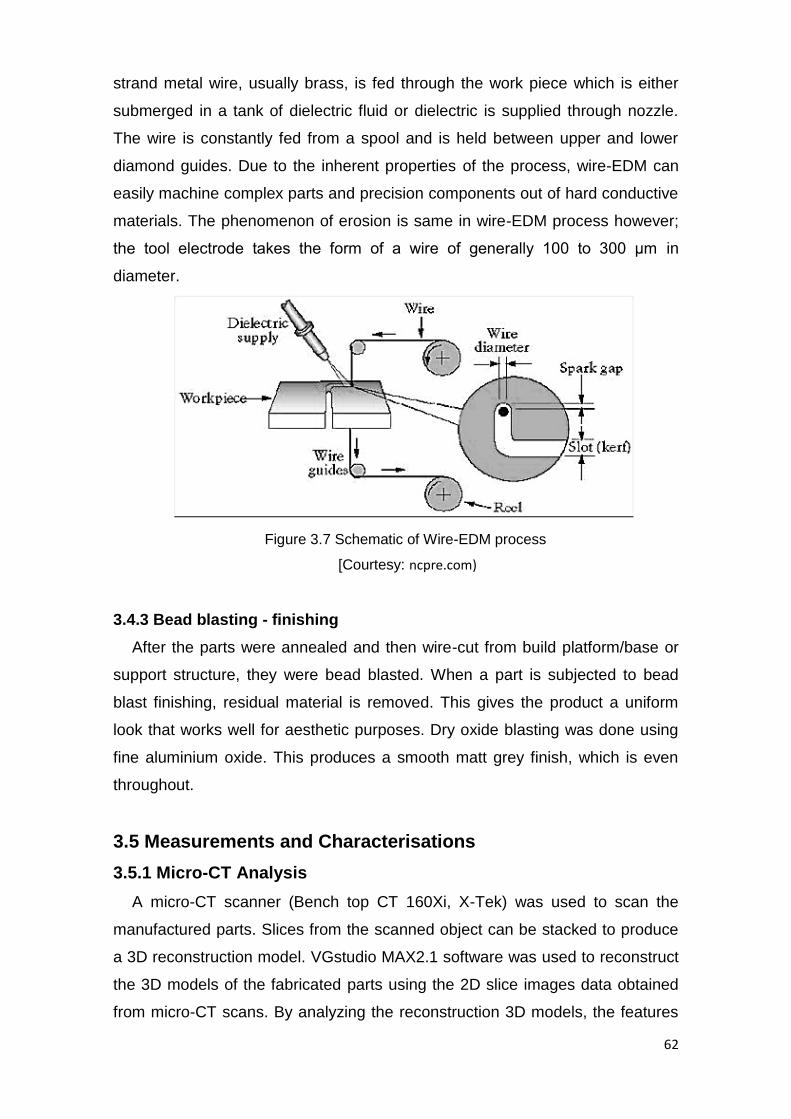
62
strand metal wire, usually brass, is fed through the work piece which is either
submerged in a tank of dielectric fluid or dielectric is supplied through nozzle.
The wire is constantly fed from a spool and is held between upper and lower
diamond guides. Due to the inherent properties of the process, wire-EDM can
easily machine complex parts and precision components out of hard conductive
materials. The phenomenon of erosion is same in wire-EDM process however;
the tool electrode takes the form of a wire of generally 100 to 300 μm in
diameter.
Figure 3.7 Schematic of Wire-EDM process
[Courtesy: ncpre.com)
3.4.3 Bead blasting - finishing
After the parts were annealed and then wire-cut from build platform/base or
support structure, they were bead blasted. When a part is subjected to bead
blast finishing, residual material is removed. This gives the product a uniform
look that works well for aesthetic purposes. Dry oxide blasting was done using
fine aluminium oxide. This produces a smooth matt grey finish, which is even
throughout.
3.5 Measurements and Characterisations
3.5.1 Micro-CT Analysis
A micro-CT scanner (Bench top CT 160Xi, X-Tek) was used to scan the
manufactured parts. Slices from the scanned object can be stacked to produce
a 3D reconstruction model. VGstudio MAX2.1 software was used to reconstruct
the 3D models of the fabricated parts using the 2D slice images data obtained
from micro-CT scans. By analyzing the reconstruction 3D models, the features
63
of the manufactured part such as internal defects and geometric irregularities
can be identified. Fig. 3.8 (a) shows the micro-CT scanner used to analyse the
experimental samples.
X-Tek Bench top CT 160 Xi:
5 µm Focal Spot X-Ray Source, 25 to 160 kV, 0 to 1000 µA (non
continuous) 60 Watt.
The 60W source operates at up to 160kV, giving good penetrating power of
heavier samples.
3 micron resolution, max diameter 90mm, 5kg max load.
5 axis manually controlled manipulator. Full system control and image
processing software.
3.5.2 Scanning Electron Microscopy (SEM)
The manufactured parts underwent a micro-morphological characterization
using HITACHI S-3200N Scanning Electron Microscope (SEM) (see Fig. 3.8
(b)). SEM was also used for studying the morphology of the processed powder.
The SEM is an instrument that produces a largely magnified image by using
electrons instead of light to form an image. Because the SEM utilizes vacuum
conditions and uses electrons to form an image, special preparations must be
done to the sample. All metals are conductive and require no preparation before
being used except proper cleaning process of the loose powder.
HITACHI S-3200N SEM:
27 µm resolution
120 KV voltages and
182 µA current

64
Figure 3.8 (a) X-Tek Bench top CT 160 Xi (b) Scanning Electron Microscope (SEM)
– Hitachi S3200N (Courtesy: University of Exeter)
3.5.3 Optical Microscopy
The optical microscopy (Dino-lite AM413ZT-A) shown in Fig. 3.9 was used to
measure the dimensional accuracy of the experimental parts. This allows the
comparison of the optical measurements with the original CAD dimensions.
Table 3.6 shows the specification of the optical microscope.
Table 3.6 – Optical microscopy
Figure 3.9 Dino-Lite optical
Microscope (Courtesy: University
of Exeter)
Specifications: Diameter Dimensions Frame rate Illuminated Interface type Length Magnifier power Resolution Weight
3.2 cm 3.2 Dia. X 10.5 cm 30 fps Yes USB 2.0 10.5 cm 1 50, 200 1300000 pixel 105 g

65
3.5.4 Uni-axial compression test
Uni-axial compression tests were carried out to assess the compression
properties of the manufactured parts using EZ20 and LR300K Universal
Material Testing Machine, Lloyd Instruments Ltd., UK equipped with a 20 kN
load cell (see Fig.3.10 (a)). The EZ20 machine was used for the compression
testing of 316L stainless steel while LR300K was used for the Ti-6Al-4V and
AlSi10Mg cellular structures (see Fig.3.10 (b)). Two smooth steel plates which
are polished and hardened were used to reduce friction in compression test.
The speed of loading was set a constant of 0.4 mm/min for all of the tests. The
stress-strain curves, yield strengths and Young’s modulus data were obtained
from machine installed software.
Figure 3.10 (a) EZ20 Universal Material Testing Machine c) LR300K Universal Material
Testing Machine (Courtesy: University of Exeter)
3.5.5 Deformation measurements
The resulting deflection in support structure geometries was measured using
Roland MDX-20 (see Fig. 3.11). This is a 3D scanner for scanning 3D objects
and creating 3D cloud data by using a moving needle probe to touch the
surface of the object and record data points. Dr. PICZA scanning software
which is installed in the machine is used for dynamic graphic display, curve
smoothing, and adjusting the height of the scanned surface. The scanned data
(a) (b)

66
was exported as a point cloud data (ASCII) and processed in MATLAB software
for visualization.
Figure 3.11 3D scanner - Rolland MDX-20 (Courtesy: University of Exeter)

67
CHAPTER 4
Preliminary Experiment on Single Layers Built on
Powder Bed Without-Support in SLM Process
4.1 Introduction
As has been discussed in literature (chapter 2), SLM process is associated
with large temperature and stress gradients during melting and solidification of
the material. The process is generally accompanied with the formation of
various defects such as deformation and cracks. In particular, overhanging and
floating layers which are built in SLM and DMLS processes are usually
associated with highest temperature gradients and thermal stresses.
This chapter presents the results of preliminary experiment of single
overhanging layers using 316L stainless steel powder. The objective is to
determine the effect of processing parameters on melt depth of single layers
built on powder bed without support structure. In fact, only one layer can be built
this way, otherwise, the powder recoater would wipe out if not supported
properly. The first layer in the build is always crucial, as it stands the foundation
for subsequent layer of the part. It is important that this base layer is built
successfully without deformation. Any irregularities in the base layer will be
transferred into the upper layers and could affect the whole build.
Measurements were taken on layer thickness of the processed single layers.
SEM micrographs were taken from sample surface to observe signs of defects
and porosities. This work aids in our understanding of the relationship between
process parameters and laser melting penetration depth and surface
characteristics of overhang layers introduced during the build.
This chapter is divided into the following sections: section 4.2 describes the
experimental procedures used during sample manufacturing. Section 4.3
presents results and discussions. Section 4.4 concludes the chapter highlighting
the most important findings in this chapter.
4.2 Experimental Procedure
Single layers have been produced on the loose powder bed from a
commercially available 316L stainless steel powder which was gas atomized
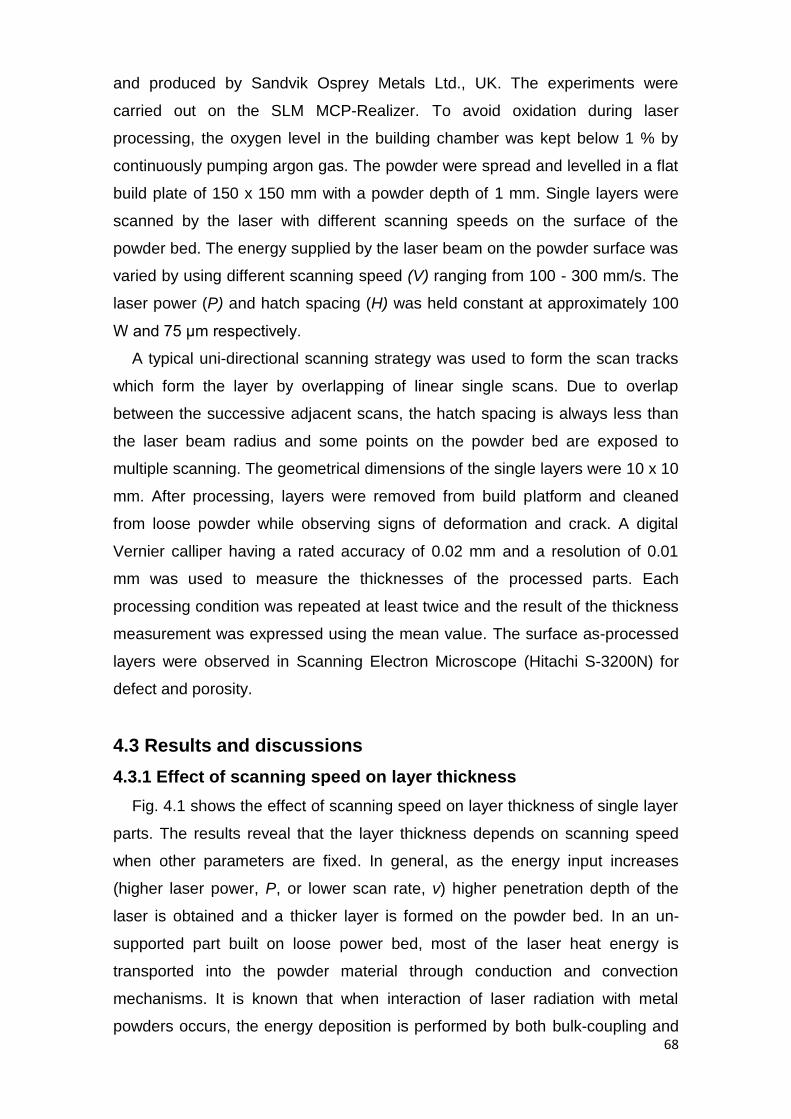
68
and produced by Sandvik Osprey Metals Ltd., UK. The experiments were
carried out on the SLM MCP-Realizer. To avoid oxidation during laser
processing, the oxygen level in the building chamber was kept below 1 % by
continuously pumping argon gas. The powder were spread and levelled in a flat
build plate of 150 x 150 mm with a powder depth of 1 mm. Single layers were
scanned by the laser with different scanning speeds on the surface of the
powder bed. The energy supplied by the laser beam on the powder surface was
varied by using different scanning speed (V) ranging from 100 - 300 mm/s. The
laser power (P) and hatch spacing (H) was held constant at approximately 100
W and 75 μm respectively.
A typical uni-directional scanning strategy was used to form the scan tracks
which form the layer by overlapping of linear single scans. Due to overlap
between the successive adjacent scans, the hatch spacing is always less than
the laser beam radius and some points on the powder bed are exposed to
multiple scanning. The geometrical dimensions of the single layers were 10 x 10
mm. After processing, layers were removed from build platform and cleaned
from loose powder while observing signs of deformation and crack. A digital
Vernier calliper having a rated accuracy of 0.02 mm and a resolution of 0.01
mm was used to measure the thicknesses of the processed parts. Each
processing condition was repeated at least twice and the result of the thickness
measurement was expressed using the mean value. The surface as-processed
layers were observed in Scanning Electron Microscope (Hitachi S-3200N) for
defect and porosity.
4.3 Results and discussions
4.3.1 Effect of scanning speed on layer thickness
Fig. 4.1 shows the effect of scanning speed on layer thickness of single layer
parts. The results reveal that the layer thickness depends on scanning speed
when other parameters are fixed. In general, as the energy input increases
(higher laser power, P, or lower scan rate, v) higher penetration depth of the
laser is obtained and a thicker layer is formed on the powder bed. In an un-
supported part built on loose power bed, most of the laser heat energy is
transported into the powder material through conduction and convection
mechanisms. It is known that when interaction of laser radiation with metal
powders occurs, the energy deposition is performed by both bulk-coupling and

69
powder-coupling mechanisms (Simchi 2006). This energy rapidly heats up the
particles above the melting point and cause particle bonding to occur. The
density change during irradiation and formation of metal agglomerates also
affect the coupling efficiency and thus influence the absorbed energy.
On the other hand, the effective thermal conductivity of the bed is lower than
that of single particle and it highly depends on the amount of porosity, the
arrangement of the particles and the contacts between them. The exposure
period of the laser irradiation (d/v) ranges between 0.2 and 8ms. In such time
scale, the heat flow distance during the interaction time is considerably less
than the particle diameter, leading to very fast heating up the skin of the
particles. The absorbed energy is then transferred to the surroundings by
thermal diffusion. The temperature of the exposed powder particles can easily
exceed the melting temperature, leading to full melting of the particles. As a
result, thick layers are formed when layer are built on powder. Since the laser
power was fixed during the experiment, the low scanning speeds are
accompanied with high energy density due to the longer interaction time with
the powder leading to higher penetration depth and layer thickness. As the
speed is increased from 100 mm/s to 200 and 300 mm/s, the measured layer
thickness is dropped. The layer thickness is formed by fully melted core solid
upper section and partially melted bonded particles at the bottom and boundary
of the layer.
When layers are built on solid material being a previous layer; base plate; or
even supporting structures, the layer thickness is fixed and ranges from 20 µm
to 100 µm. In these cases, much of the laser heat is dissipated through the
supporting solid material. As the conductivity of solid is higher compared to
porous powder, the heat is dissipated more quickly in the process and the layer
solidification time is shortened. On the other hand, large unstable melt pool is
formed in single layers built on powder as there is no sufficient time for the
previous tracks to cool and solidify.
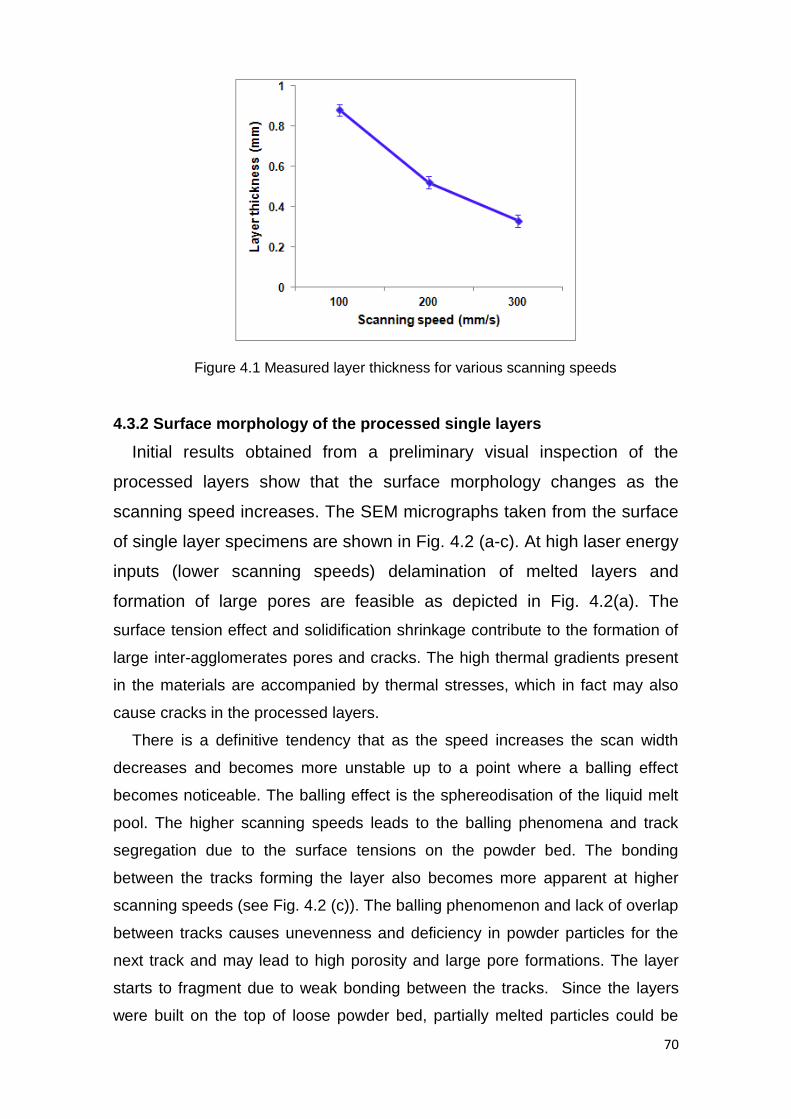
70
Figure 4.1 Measured layer thickness for various scanning speeds
4.3.2 Surface morphology of the processed single layers
Initial results obtained from a preliminary visual inspection of the
processed layers show that the surface morphology changes as the
scanning speed increases. The SEM micrographs taken from the surface
of single layer specimens are shown in Fig. 4.2 (a-c). At high laser energy
inputs (lower scanning speeds) delamination of melted layers and
formation of large pores are feasible as depicted in Fig. 4.2(a). The
surface tension effect and solidification shrinkage contribute to the formation of
large inter-agglomerates pores and cracks. The high thermal gradients present
in the materials are accompanied by thermal stresses, which in fact may also
cause cracks in the processed layers.
There is a definitive tendency that as the speed increases the scan width
decreases and becomes more unstable up to a point where a balling effect
becomes noticeable. The balling effect is the sphereodisation of the liquid melt
pool. The higher scanning speeds leads to the balling phenomena and track
segregation due to the surface tensions on the powder bed. The bonding
between the tracks forming the layer also becomes more apparent at higher
scanning speeds (see Fig. 4.2 (c)). The balling phenomenon and lack of overlap
between tracks causes unevenness and deficiency in powder particles for the
next track and may lead to high porosity and large pore formations. The layer
starts to fragment due to weak bonding between the tracks. Since the layers
were built on the top of loose powder bed, partially melted particles could be

71
attached to the bottom surface which result very rough surface. Hence, the
shape and the size of powder particles significantly influence the surface
roughness and densification of SLM parts.
Melt-pool stability is not the only result to consider in SLM. The optimum
result will be a scan track of constant, uniform width and adequate penetration.
Vector stability without penetration into the substrate or support structure is also
undesirable. Inadequate penetration into the substrate will cause an insufficient
bond between the substrate and the first layer of the processed part that will in
its turn cause the part to separate from the substrate and cause the SLM
machine to stop prematurely and the job will be a failure.
Fig.4.2 SEM micrograph of top surface of the single layer parts (a) 100 mm/s (b) 200
mm/s (c) 300 mm/s
4.4 Conclusion
The results of these experiments demonstrate the relation between layer
thickness, scanning speed and surface characteristics of processed single
layers built on powder bed in SLM process. The layer thickness increases at
lower scanning speed due to higher penetration depth resulting from longer

72
interaction time of the laser. Although the development of thermal stresses
highly depends on the scanning strategy. It is noteworthy that even at very
intensive laser energy full densification cannot be obtained in single layers built
on powder bed because of delamination of the layers due to thermal stresses,
formation of gas pores during solidification and porosity formation due to
material shrinkage and the balling effect. This work was important for our
understanding on the mechanisms of laser and material interactions in SLM
process. To understand these mechanisms better, the next chapter will address
the temperature and stress field in single layers processed in SLM process by
means of numerical simulation.

73
CHAPTER 5
Finite Element Simulation of the Temperature and
Stress Fields in Single Layers Built in SLM Process
5.1 Introduction
This Chapter presents a numerical approach using a three-dimensional finite
element simulation to investigate the temperature and stress fields in single
316L stainless steel floating layers built on the powder bed without support in
SLM. Experimental work alone, as was described in chapter 4 is not sufficient to
explain the thermal mechanism involved during laser and material interactions.
The simulation is expected to widen our knowledge on the mechanisms of
overhang layer consolidation and melt-pool characteristics in SLM process.
The magnitude of temperature and stresses could inform us the high stress
gradient regions in the layer so that proper support structure becomes
necessary.
Section 5.2 gives an overview of the modelling techniques used to study the
temperature and stresses in metal AM process. Section 5.3 describes the finite
element approach taken in this study. Section 5.4 presents the results and
discussion of the numerical model. Section 5.5 is a conclusion of the chapter
highlighting the main findings of the study.
5.2 Modeling the Temperature and Stress Fields in Metal AM
Processes
One of the major limitations of metal AM processes including SLM and DMLS
is the thermal distortion of the part during forming, which may lead to undesired
shrinkage and cracks. The elevated temperature gradients developed during
the SLM process yield a non-homogeneous permanent strains and residual
stresses distributed within consolidated layers (Kruth et al. 2004). These could
considerably affect the layer consolidation and deformation behaviours during
the SLM process and consequently the dimensional accuracy, geometric shape,
and mechanical properties of the fabricated parts. The processing parameters
such as laser power, scanning speed, laser spot size, and scanning strategy all
play a crucial role on the development of temperature gradients and residual
74
stresses in the consolidated layers and resulting three dimensional parts
(Mercelis et al. 2006). These parameters are usually optimized through
experimental means for specific machines and materials. However, detailed
investigation of all different parameters and materials for SLM through
experiments can be time consuming and costly. Therefore, numerical methods
could be used as an effective tool to study the role of these parameters on
temperature distribution, residual stress and other thermal mechanisms.
The finite element analysis (FEA) method is the most commonly used
numerical method for predicting temperature and stress fields in SLM. An
investigation was also carried out to illustrate the effect of layer thickness on
part deformation in SLM parts (Zaeh and Branner 2010), revealing that a thinner
layer thickness resulted in a higher deformation due to the effect of higher
temperature variation concentrated within thin layers. The work did not
investigate the temperature and stresses in tracks forming the layer. Matsumoto
et al., (2002) developed a FEA method to simulate the temperature and stress
field for single layer parts on the loose powder in SLM. A 2D non-linear heat
transfer with volumetric internal heat source problem is numerically solved
based on the coupling of Matlab and ANSYS FEM models (Patil and Yadava
2007). The work did not consider the melted depth of the layer which is
important in SLM process. The surface temperature distribution during SLM of
90W–7Ni–3F materials was predicted by (Zhang et al. 2010). The effect of laser
scanning strategy on residual thermal stresses and distortion was investigated
using FEA (Dai and Shaw 2002). This is one of the first such works conducted
in understanding the effect of scanning strategy on temperature distribution and
stresses. A FEA model was developed by Nickel et al. (2001) to simulate the
laser deposition process and found that the deposition pattern has a significant
effect on the part stresses and deflections. Researchers (Yin et al. 2012; Ameer
et al. 2003; Shuai et al. 2012) reported their research results of temperature
fields in single metallic layer SLM processes by using element birth and death
technique. A more comprehensive understanding of the SLM thermal field has
been achieved by creating a 3D model and considering the interval time for new
powder recoating (Roberts et al. 2009).
A 3D FEA model with fixed temperature heat source for calculating the
evolution of temperature and thermal stresses within a single metallic layer
formed on the powder bed using two different scanning patterns in SLM was

75
proposed Ma et al. (2007). It was found that the distortion and transient stresses
of a layer processed by a moving laser beam decreased with fractal scanning
pattern. From this review, it is evident that using 2D analysis with generalized
plane strain conditions seems to be convenient with less computer processing
requirements, but 3D analysis remains absolutely necessary to fully understand
the thermal induced problems in SLM process.
An in-depth understanding of the materials and laser interaction in
overhanging regions and its associated thermal and stress mechanisms has not
been properly investigated in literature. This is an essential step for
understanding the requirements of support structure design and development.
This study was undertaken to highlight these issues with regard to support
structure and to understand the magnitude of temperature and thermal stresses
that are developed in single layers built on the powder bed. The study also
takes into account the effect of the processing parameters such as the scanning
speed on temperature gradients and melt-pool dimensions (length, width, and
depth of melting).
The numerical approach taken is a 3D non-linear (i.e., material properties
are temperature dependant) transient finite element model based on
sequentially coupled thermo-mechanical field analysis was developed in
ANSYS programme to predict the temperature distribution, thermal stresses
and melt pool dimensions of laser scanned single layers built on the powder
bed. Simulation of the moving heat source and changing boundary conditions is
conducted through a user written subroutine implemented in ANSYS parametric
design language (APDL). Since the heat energy is transported well below the
surface of the powder bed in SLM, the laser energy density was applied as a
volumetric heat source rather than a surface heat flux which has been the route
taken in most literature works. Temperature dependent physical properties of
316L stainless steel powder material are taken into account and latent heat of
fusion is considered.
5.3 Three-Dimensional Finite Element Modelling
ANSYS is a general purpose finite element modelling package for
numerically solving a wide variety of mechanical and thermal problems. ANSYS
software is developed by ANSYS, Inc. (Pittsburgh, United States). ANSYS
provides the capability of performing indirect sequentially coupled thermo-
76
mechanical analysis for both heat and stress analysis. In this study, a multiple
physics environment was used in a single database as this allows a quick
switching between physics environments for subsequent stress analysis. A non-
linear transient thermal analysis was performed first to obtain the global
temperature history generated during the laser melting. A transient stress
analysis is then developed with an automatic exchange of the element type
from thermal-to-structural, and applying the temperatures obtained from
previous transient thermal analysis, as a thermal loading for the mechanical
analysis.
The 3D thermal and structural/mechanical element used was SOLID70 and
SOLID185 respectively. This element selection allows single meshing to be
performed with an automatic exchange of the element type from thermal-to-
structural during processing. SOLID70 has a 3-D thermal conduction capability.
It has eight nodes with a single degree of freedom, temperature, at each node
and is applicable to a three-dimensional, steady-state or transient thermal
analysis. SOLID185 is used for the 3-D modelling of solid structures and is
defined by eight nodes having three degrees of freedom at each node:
translations in the nodal x, y, and z directions. The element has plasticity, stress
stiffening, large deflection, and large strain capabilities. The 3D FEA model
representing the single layers built on the powder bed can be seen in Fig.
5.1(a). The model illustrates a single layer of 10mm long scanned by the laser
beam on the powder bed using a uni-directional scanning strategy. In order to
reduce computational time, only five adjacent tracks were scanned and the
elements which interact with the laser beam are finely meshed with hexahedral
element sizes equal to 75 µm and coarser mesh is used for the surrounding
loose powder. The FEA model assumes a powder thickness of 1mm; this was
deliberately selected to allow sufficient laser penetration into the powder bed
during scanning and so that un-melted material will still remain at the bottom of
the bed. Table 5.1 summarizes the parameters used in the finite element
simulation.
For the thermal analysis, the laser beam with calculated energy density as in
Fig. 5.1(b) strikes a number of elements equal to the laser spot size of 150 µm
and moves with the specific scanning speed in the X-direction on the powder
bed. When the laser moves to next load step, the previous load step is deleted
to account for the cooling cycle. The analysis is divided into several steps in
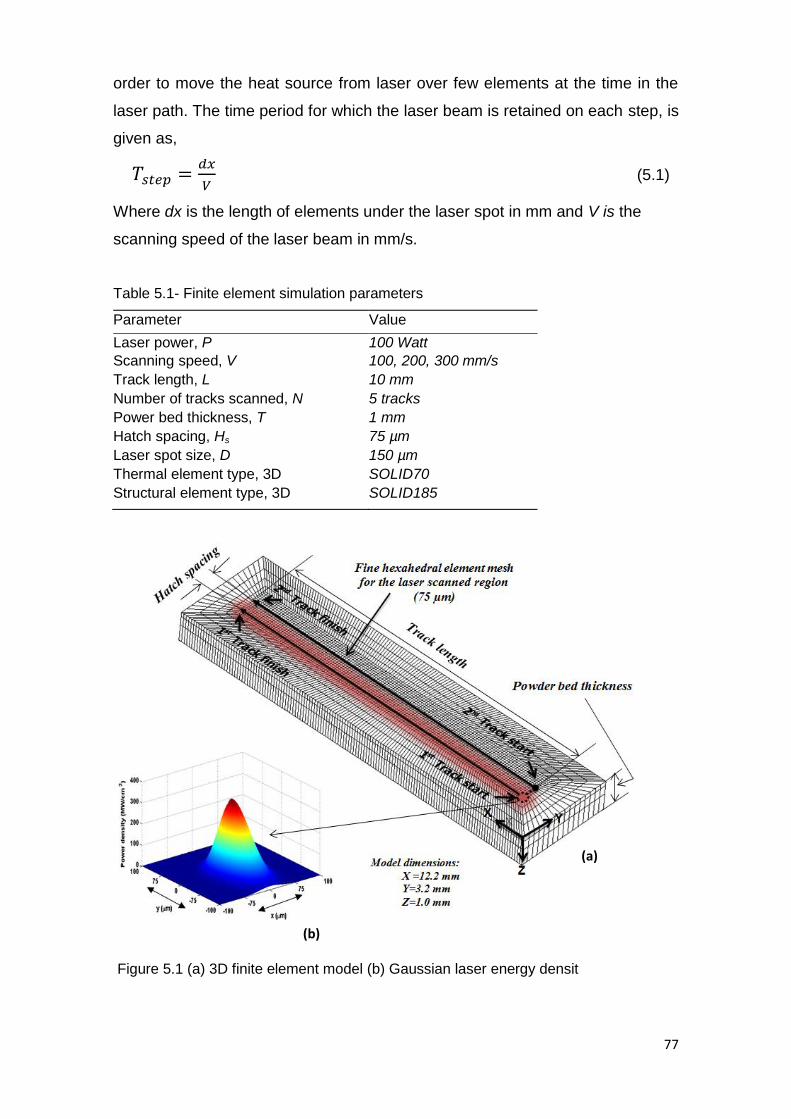
77
order to move the heat source from laser over few elements at the time in the
laser path. The time period for which the laser beam is retained on each step, is
given as,
(5.1)
Where dx is the length of elements under the laser spot in mm and V is the
scanning speed of the laser beam in mm/s.
Table 5.1- Finite element simulation parameters
Parameter Value
Laser power, P 100 Watt
Scanning speed, V 100, 200, 300 mm/s
Track length, L 10 mm
Number of tracks scanned, N 5 tracks
Power bed thickness, T 1 mm
Hatch spacing, Hs 75 µm
Laser spot size, D 150 µm
Thermal element type, 3D SOLID70
Structural element type, 3D SOLID185
Figure 5.1 (a) 3D finite element model (b) Gaussian laser energy densit
(a)
(b)

78
5.3.1 Thermal modelling
The thermal equilibrium equation satisfies the following classical 3D heat
conduction equation given by Carslaw and Jaeger (1959),
(
)
(
)
(
) (5.2)
Where is the material density ( ⁄ ); is the specific heat capacity
( ⁄ ); is the temperature; is the interaction time; is thermal
conductivity ( ⁄ ); and ( ) is the volumetric heat generation
( ⁄ ).
The effective thermal conductivity is a function of porosity of the powder (Dong
et al. 2009). The porosity of the powder can be calculated as,
(5.3)
Where is the porosity of the powder; and are the densities of the
bulk and powder materials. The porosity is assumed to vary from = 0.4 for
powder state to = 0 at solid state after solidification. However, in reality its
difficult to achieve full density.
The thermal conductivity of the powder can be expressed as (Thummler 1993),
( ) (5.4)
Where kpowder and kbulk are thermal conductivities of powder and bulk materials.
The latent heat of fusion is simulated by an artificial increase in the liquid
specific heat and the relationship between the enthalpy, H, density, p, and
specific heat, c can be written as,
∫ ( ) (5.5)
Fig. 5.2 shows the calculated temperature dependant thermal conductivity and
enthalpy of the material up to the melting temperature. The sudden change of
the thermal conductivity from low value calculated from eqn. (5.4) to higher
value in the curve is due to transition of material from powder state to liquid
state, in which case the corresponding bulk material properties is used (Mills
and Kenneth 2002),
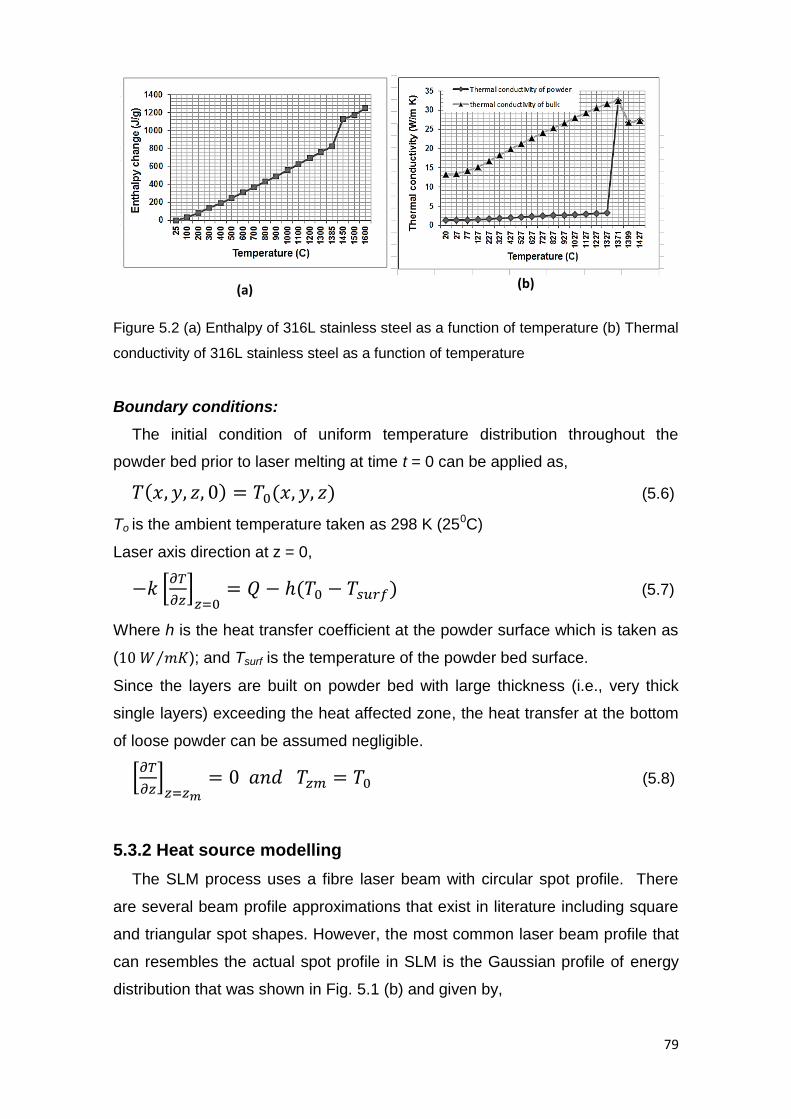
79
Figure 5.2 (a) Enthalpy of 316L stainless steel as a function of temperature (b) Thermal
conductivity of 316L stainless steel as a function of temperature
Boundary conditions:
The initial condition of uniform temperature distribution throughout the
powder bed prior to laser melting at time t = 0 can be applied as,
( ) ( ) (5.6)
To is the ambient temperature taken as 298 K (250C)
Laser axis direction at z = 0,
[
]
( ) (5.7)
Where h is the heat transfer coefficient at the powder surface which is taken as
( ⁄ ); and Tsurf is the temperature of the powder bed surface.
Since the layers are built on powder bed with large thickness (i.e., very thick
single layers) exceeding the heat affected zone, the heat transfer at the bottom
of loose powder can be assumed negligible.
[
]
(5.8)
5.3.2 Heat source modelling
The SLM process uses a fibre laser beam with circular spot profile. There
are several beam profile approximations that exist in literature including square
and triangular spot shapes. However, the most common laser beam profile that
can resembles the actual spot profile in SLM is the Gaussian profile of energy
distribution that was shown in Fig. 5.1 (b) and given by,
(b) (a)

80
(
) (5.9)
Where is the radial distance from the beam centre; Io is the intensity of the
beam at r = 0; and is the radius of the beam at which .
This can be written as,
( )
(
) (5.10)
Where A is the absorptivity of the powder material which can be calculated if
the reflectivity of the material λ is known. (A reflectivity of iron = 0.7
was considered for 316L stainless steel).
5.3.3 Mechanical modelling
The same FE mesh used in thermal analysis is employed here, except for the
element type and the boundary conditions. To calculate the distribution of
stress, the elastic FEA simulation is used. Stress is related to strain by (Boresi
1993),
{ } [ ]{ } (5.11)
Where { } is the stress vector, [D] is the stiffness matrix and
{ } { } { } (5.12)
Where { } the total is strain vector and { } is the thermal strain vector.
Equation (4.11) may be written as
{ } [ ] { } { } (5.13)
For isotropic material, the above stress-strain relationship can be written in
Cartesian co-ordinates as follows (Boresi 1993; Yilbas 2001),
[ ( )]
[ ( )]
[ ( )]
,
,
(5.14)
Where E, and are the modulus of elasticity, Poison’s ratio and coefficient of
linear thermal expansion respectively. represents a temperature rise at a
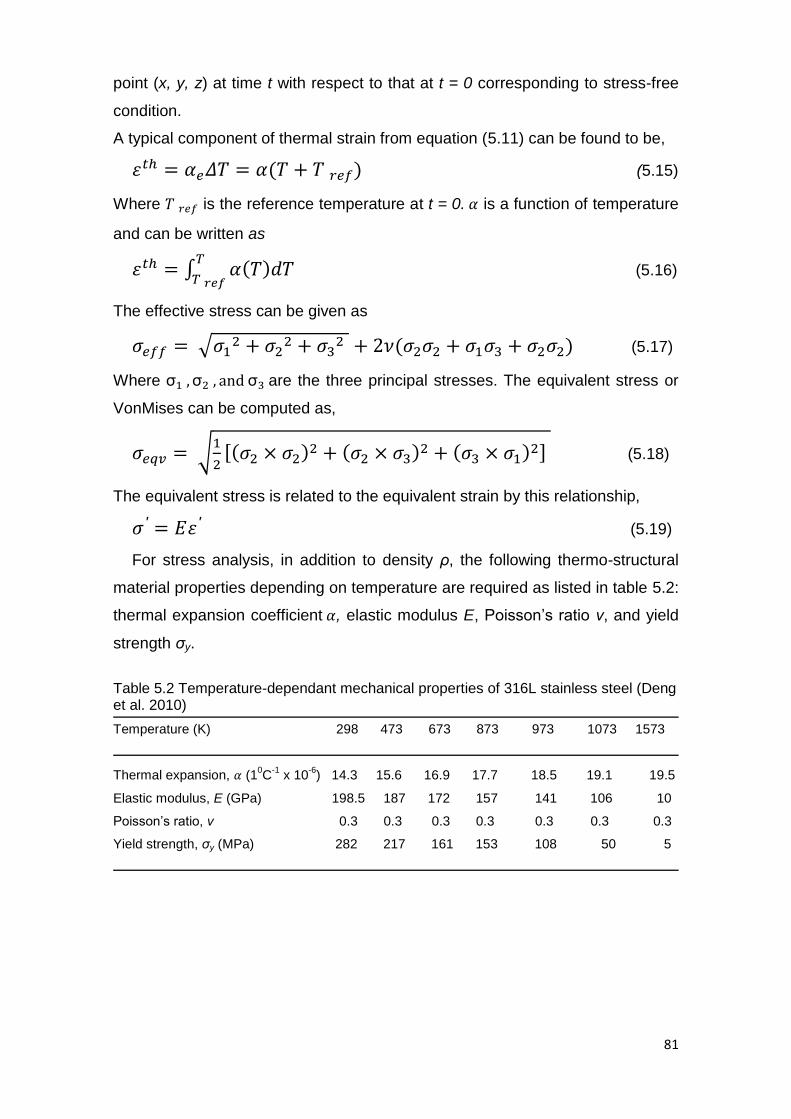
81
point (x, y, z) at time t with respect to that at t = 0 corresponding to stress-free
condition.
A typical component of thermal strain from equation (5.11) can be found to be,
( ) (5.15)
Where is the reference temperature at t = 0. is a function of temperature
and can be written as
∫ ( )
(5.16)
The effective stress can be given as
√
( ) (5.17)
Where are the three principal stresses. The equivalent stress or
VonMises can be computed as,
√
[( )
( ) ( )
] (5.18)
The equivalent stress is related to the equivalent strain by this relationship,
(5.19)
For stress analysis, in addition to density ρ, the following thermo-structural
material properties depending on temperature are required as listed in table 5.2:
thermal expansion coefficient , elastic modulus E, Poisson’s ratio ν, and yield
strength σy.
Table 5.2 Temperature-dependant mechanical properties of 316L stainless steel (Deng et al. 2010)
Temperature (K) 298 473 673 873 973 1073 1573
Thermal expansion, (10C
-1 x 10
-6) 14.3 15.6 16.9 17.7 18.5 19.1 19.5
Elastic modulus, E (GPa) 198.5 187 172 157 141 106 10
Poisson’s ratio, ν 0.3 0.3 0.3 0.3 0.3 0.3 0.3
Yield strength, σy (MPa) 282 217 161 153 108 50 5

82
5.4 Results and discussion
5.4.1 Temperature distribution
In SLM, the temperature distribution in the powder bed and consolidated
layers changes rapidly with time and space. Fig.5.3 (a) shows the temperature
at the beginning of the laser scanning, from which, the very high temperature
gradients in the vicinity of the laser spot on the powder bed can be clearly seen
due to an applied Gaussian heat source. The temperature of the powder
particles is elevated rapidly under the action of absorbed energy, causing a
molten pool when the temperature exceeds the melting temperature and heat
affected zones in the surrounding loose powder. Note that the energy intensity
of the source might also be high enough to cause the material to evaporate
(Dong et al. 2009).
The highest predicted temperature corresponding to the molten zone of the
powder material is 2600 K for [P=100 W, V=100 mm/s] and exceeds the melting
temperature of 316L stainless steel (1672 K). However, this maximum
temperature at the start of track 1 is reduced at the end of first track scan to
2392 K and so at the end of fifth track to 2225 K as shown in Fig.5.3 (b and c)
respectively. The drop of maximum temperature can be attributed to the
increased conductivity of the previously solidified regions of the track compared
to the low thermal conductivity available initially in the powder bed. The thermal
field changes as the laser source moves along the track and the melt pool
moves along with the laser source.

83
Figure 5.3 Transient temperature distribution during layer melting (a) at the beginning
of the first track scan (b) at the end of the first track scan at time =0.091 seconds (c) at
the end of the 5th track scan at time = 0.455 seconds
It is further observed that the temperature gradient in the front side of the
moving laser beam is much steeper than that in the rear side. The melt pool
shape resembles as in comet tail profile (see Fig. 5.3(c)). This trend of skewed
temperature distribution towards the rear of the laser was also reported in other
previous research on temperature simulations (Roberts et al. 2009; Shen et al.
2005). This can be attributed to the fact that the rapidly cooling molten material
(b)
(c)
(a)

84
has greater conductive properties than the untreated powder in front of the
laser.
The temperature distribution in the layer is very much affected by the energy
density which is a function of laser power, spot size, scanning speed, hatch
spacing and scanning strategy. Additionally, the temperature gradient in the
layer is similarly influenced by conductivity of the material underneath the
deposited layer being a loose powder bed, previously re-melted layer, support
structure or a solid substrate. Fig. 5.4(a and b) shows temporal variation of
temperature of single track deposited on powder bed and solid substrate
respectively. For the powder bed, the melted layer thickness depends on the
energy input from the laser, while for substrate a thin layer of 75 µm is
deposited on solid material and then melted with the laser beam. A fast cooling
rate can be observed when the track is built on a solid substrate. Because the
solid bulk material has higher conductivity compared to powder bed allowing
more heat sink through conduction in a shorter period of time and subsequent
solidification to room temperature.
Fig. 5.5(a) further shows that the temperature of the scanned first track for
powder bed and solid substrate decreases as the distance from the laser beam
focus position is increased. The region directly under the laser beam is in the
molten state, whereas the remaining portion of the track length experiences a
rapid fall in temperature and undergoes solidification. The solidification begins
when the temperature drops below the melting temperature of the material and
approaches to room temperature. The temperature gradient is higher at the
start of solidification and approaches minimum value at the end of solidification.
The rapid cooling of tracks built on solid substrate result a more stable molten
zone as well as heat affected zone at the vicinity of laser spot. The multiple
reflections effect between the powder particles during the laser strike leads to
higher optical penetration depths compared to bulk materials.

85
Figure 5.4 Comparison of temperature distribution after the 1st track scan (a) built on a
powder bed (b) built on solid substrate
The various heating and cooling cycles taking place in various tracks which
form the layer during laser scan are shown in Fig. 5.5 (b) and (c). The peak
temperatures represent the start of each track forming the layer and are taken
from neighbouring nodes in the Y-axis separated by a hatch spacing of 75 µm
between the tracks. For track 1 the recorded temperature are taken from a node
located at (X=1.225, Y=1.225, Z=0), track 2 at (X=1.225, Y=1.3, Z=0), tack 3 at
(X=1.225, Y=1.375, Z=0), track 4 at (X=1.225, Y=1.45, Z=0), and track 5 at
(X=1.225, Y=1.525, Z=0).
Due to overlap between subsequent tracks which depend on the hatch
spacing distance, some sections are exposed to multiple scans and melted
twice to bond adjacent tracks and form a fully dense layer. The temperature in
half portion of the 1st track is raised above its melting temperature while
scanning the 2nd track. However, as more tracks are deposited in 3rd and other
subsequent tracks, the temperature falls to below the melting temperature of the
material. The lower secondary peaks correspond to the laser scanning the
same position on successive tracks. This is also exhibited in multi-layer build
when upper layers are deposited and suggests that the addition of layers and
subsequent scanning are of significance to the temperature field in the model
(Roberts et al. 2009). The rate of overlap between track and layers influence the
surface roughness, porosity, and mechanical properties of SLM fabricated parts
(Guan et al. 2013).

86
Figure 5.5 (a) Temperature distribution along the path of the 1st track (b) Cyclic
melting/heating and cooling of the 1st track (c) Cyclic melting/heating and cooling of 5
subsequent tracks in the layer built on powder bed.
This cyclic melting/heating and cooling continues in all tracks forming the
layer. The heating and subsequent cooling to the ambient (chamber)
temperature occur within a few tenths of a millisecond of each other, thus
suggesting that the irradiated spots are subjected to rapid thermal cycles.
These rapid cycles are associated with commensurate thermal stress changes
(Dai and Shaw 2002). Long track length of the laser beam highly influences the
thermal gradients which occur within the layer, while shorter tracks tend to
produce more homogeneous temperature gradients but with increased melting
depth. As the vector length increases, the higher delay period between
successive irradiation leads to a decrease in the amount of energy stored on
the surface.
(a) (b)
(c)

87
5.4.2 Melt pool dimensions
Fig 5.6 (a) illustrates the predicted melt pool temperature contours after
scanning the 5th track of the layer. The melt pool size measurement was
achieved through temperature distribution plots recorded at the instant when the
laser had travelled along its path of scanning. The length represents the
distance of the molten material along the X-axis and parallel to the scan
direction while width is taken as the molten region along the Y-axis and
perpendicular the scanning direction of the laser. The melted depth is measured
from the powder surface to the molten depth inside the powder bed along the Z-
axis. Fig. 5.6 (b and c) shows the width and depth profiles of the melt pool for
scanning speeds of 100 mm/s, 200 mm/s, and 300 mm/s with a fixed laser
power of 100 W. With liquidus line imposed onto the plots, which represent
regions above the melting temperature of 316 L stainless steel; the melt pool
dimensions are identified.
The amount of liquid formation depends on the operating temperature of the
sintering system, which is controlled by two main parameters, i.e., laser power
and scan speed, during a single line scanning (Gu et al. 2009). As shown in Fig
5.6 (d) the length of the melt pool increases with increasing the scanning speed
while both width and depth of the melt pool decreases. At higher scanning
speeds (200 - 300 mm/s), there is no sufficient time for melted track to cool
down and solidify and longer region remain in a molten state. According to
Simchi and Pohl (2004) , the applied scan speed has a significant influence on
the capillary instability of the liquid track. As a result, pores or regions of non-
melted powder forms between layers (Brandl et al. 2012). Previous
experimental results reveal that at lower scan speeds of 0.05 m/s a continuous
sintered track was formed via the sufficient junction of inter-agglomerate
sintering necks, showing no apparent balling effect while with increasing scan
speed to 0.07 m/s, the surface of laser sintered track was considerably rough,
although the sintered track retained uninterrupted (Gu et al. 2009).
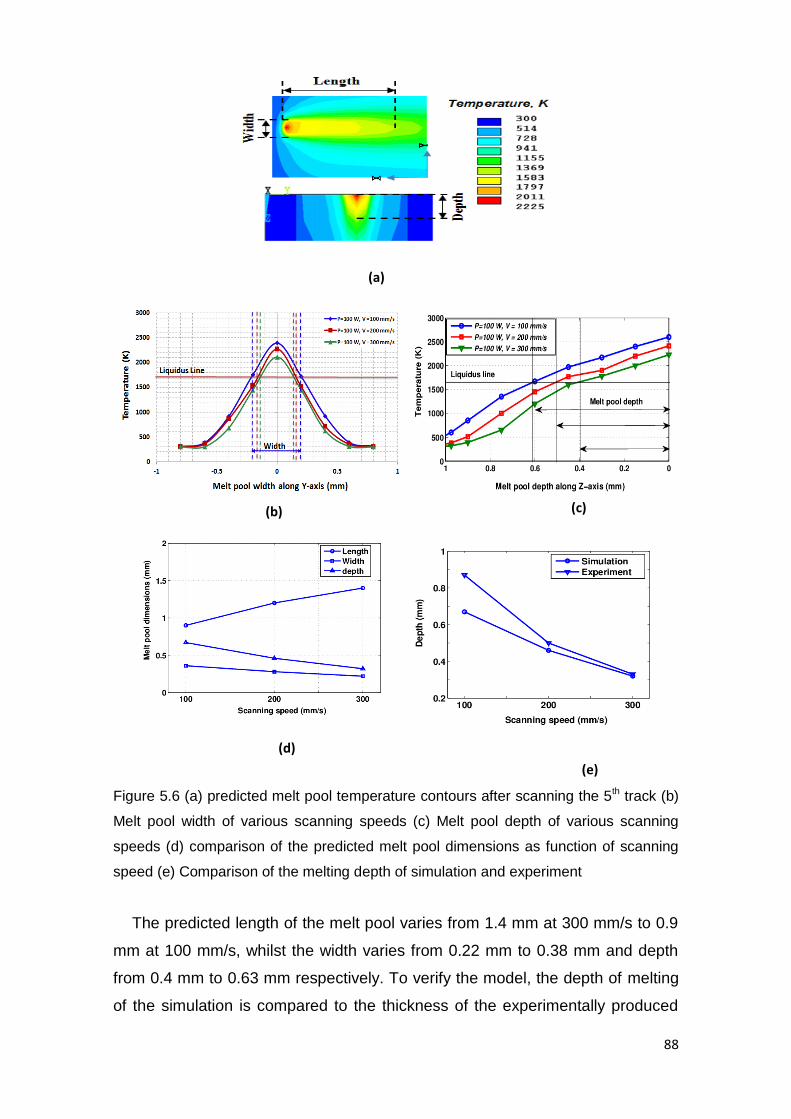
88
Figure 5.6 (a) predicted melt pool temperature contours after scanning the 5th track (b)
Melt pool width of various scanning speeds (c) Melt pool depth of various scanning
speeds (d) comparison of the predicted melt pool dimensions as function of scanning
speed (e) Comparison of the melting depth of simulation and experiment
The predicted length of the melt pool varies from 1.4 mm at 300 mm/s to 0.9
mm at 100 mm/s, whilst the width varies from 0.22 mm to 0.38 mm and depth
from 0.4 mm to 0.63 mm respectively. To verify the model, the depth of melting
of the simulation is compared to the thickness of the experimentally produced
(c)
(d)
(b)
(a)
(e)
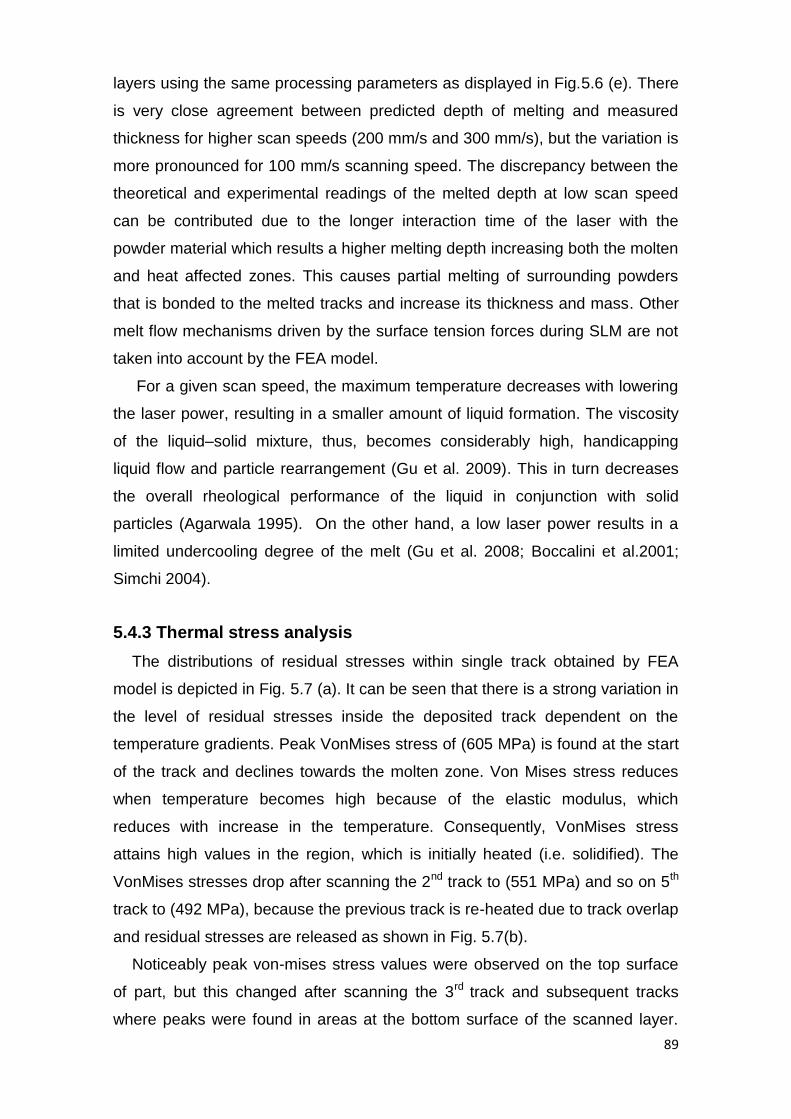
89
layers using the same processing parameters as displayed in Fig.5.6 (e). There
is very close agreement between predicted depth of melting and measured
thickness for higher scan speeds (200 mm/s and 300 mm/s), but the variation is
more pronounced for 100 mm/s scanning speed. The discrepancy between the
theoretical and experimental readings of the melted depth at low scan speed
can be contributed due to the longer interaction time of the laser with the
powder material which results a higher melting depth increasing both the molten
and heat affected zones. This causes partial melting of surrounding powders
that is bonded to the melted tracks and increase its thickness and mass. Other
melt flow mechanisms driven by the surface tension forces during SLM are not
taken into account by the FEA model.
For a given scan speed, the maximum temperature decreases with lowering
the laser power, resulting in a smaller amount of liquid formation. The viscosity
of the liquid–solid mixture, thus, becomes considerably high, handicapping
liquid flow and particle rearrangement (Gu et al. 2009). This in turn decreases
the overall rheological performance of the liquid in conjunction with solid
particles (Agarwala 1995). On the other hand, a low laser power results in a
limited undercooling degree of the melt (Gu et al. 2008; Boccalini et al.2001;
Simchi 2004).
5.4.3 Thermal stress analysis
The distributions of residual stresses within single track obtained by FEA
model is depicted in Fig. 5.7 (a). It can be seen that there is a strong variation in
the level of residual stresses inside the deposited track dependent on the
temperature gradients. Peak VonMises stress of (605 MPa) is found at the start
of the track and declines towards the molten zone. Von Mises stress reduces
when temperature becomes high because of the elastic modulus, which
reduces with increase in the temperature. Consequently, VonMises stress
attains high values in the region, which is initially heated (i.e. solidified). The
VonMises stresses drop after scanning the 2nd track to (551 MPa) and so on 5th
track to (492 MPa), because the previous track is re-heated due to track overlap
and residual stresses are released as shown in Fig. 5.7(b).
Noticeably peak von-mises stress values were observed on the top surface
of part, but this changed after scanning the 3rd track and subsequent tracks
where peaks were found in areas at the bottom surface of the scanned layer.
90
This can be contributed to the higher cooling rates and solidification at the
bottom side of the layer through conduction in the powder compared to the
upper surface resulting higher residual stresses at the bottom surface. It is
expected that the stress in the molten zone is tensile and it will transform to
compressive stress as the distance from molten zone increases. According to
the equilibrium of force and momentum of the part, the irradiated zone will
become surrounded by a zone of compressive stress. Other studies Matsumoto
et al., (2002) are on agreement that tensile stresses are developed at vicinity of
the laser spot while compressive stresses are more towards the edges.
Figure 5.7 (a) VonMises stress profile of the 1st track along X-axis (b) VonMises stress
of three different tracks in layer
To further understand the stress variation and history in X, Y, and Z
directions, two different nodes (node 1 located at the start of the 1st track, and
node 2 located at the start of the 5th track of the layer were investigated (see
Fig.5.8). As indicated in Fig. 5.8(a), the X-directional stress of node 1 is cyclic
compressive-tensile-compressive stresses; tensile stresses are developed
during the laser melting and turned into compressive during cooling cycle
(solidification). However, as the heating source moves away, the parts cools
down and the node remains compressive throughout. The X-directional stress
of node 2 is tensile most of the time and occasionally compressive. Similar
trend were also found in Y and Z directional stresses of the nodes as presented
in Fig. 5.8 (b) and (c). The highest stress was found in X-component along the
direction of laser scan of node 1 and reached (612 MPa), whereas the Y and Z
components of the stress reach (172 MPa) and (162 MPa) respectively.
(b) (a)

91
The high stress value in node 1 arises from the fact that it experiences an
early heating and cooling cycles and thus causes higher temperature gradients
and related thermal stresses. The temperature gradients are higher at the
beginning of the layer during laser processing due to the lower temperature of
the surrounding powder, and therefore have large effect on the distribution and
intensity of residual stresses. The first melted layer shrinks during cooling cycle,
but as more layers are deposited, the already solidified layers constrains and
prevents further shrinking in the top layer. Since this mechanism occurs for
each layer at each step of the SLM process, residual stresses may develop
inside the manufactured component. For this reason, SLM parts are stress
relieved through heat treated process prior to other finishing operations such as
the removal of the part from the solid substrate or supporting structures.
Otherwise, the residual stresses will cause part deflection due to stress
relaxation. The FEA model did not consider these heat treatment effects.
Figure 5.8 Residual stress distributions (a) X-component of stress along the scan
direction (b) Y- component of stress and transversal to the scan direction, (c) Z-
component of stress through the thickness of the layer
92
For layers freely built on the powder bed, there is no underlying solid material
to constrain the thermal stresses observed in the FEA model. The material
expansion (i.e. tensile stresses) during heating cycle and material contractions
during cooling (i.e. compressive stresses) cause shrinkages and cracks to the
layer. After the laser beam leaves that area, the irradiated zone will cool and
tends to shrink. The shrinkage is partially inhibited as a consequence of the
plastic deformation developed during heating, yielding a residual tensile stress
condition at the irradiated zone. The high tensile stresses generated in the high
x-direction (along the laser scanning direction) may also lead to transverse
cracking of the layer. Cracking can be avoided by preheating or by using shorter
scanning tracks which reduce the cooling rate. The mechanism that prevents
cracking by preheating increases the ductility of the material and enhances the
possibility of stress relief by plastic deformation.
Simulation results reveal the magnitude of the temperature and stress in
different locations of the layer and this provides insight on the regions requiring
more support structures so that the design aspects of reliable structures can be
implemented to withstand residual stress forces and dissipate heat during part
building in SLM.
5.5 Conclusion
Three dimensional transient finite element model was developed for predicting
the temperature and stress fields within a single metallic layer formed on the
bed without support in SLM process. The results generated from simulation
model can be summarized in the following points.
Highest temperature gradient was recorded at the start of first track scan
and drops subsequently for all scanning speeds.
High cooling rates were predicted when the layer is scanned over a solid
substrate compared to when layer is scanned on loose powder bed.
The predicted length of the melt pool increases at higher scan speeds while
both width and depth of the melt pool decreases.
High von mises stresses was predicted in the scanned layer caused by the
stepwise increase and decrease in the temperature with each successive
overlapping laser tracks which leads to alternating compressive and tensile
residual stresses within the layer.

93
Cracks usually found in experimental overhang layers not only initiate in
areas of compressive stress, but if tensile stress is present which occur if
compressive yield stress for the material is exceeded. Such cracks were
found in the experimental single layer parts presented in chapter 4.

94
Part Three:
Design, Manufacturing, and Evaluation of
the Mechanical Behaviour of TPMS Cellular
Structures

95
CHAPTER 6
Design and Generation of Triply Periodic Minimal
Surface Cellular Structures
6.1 Introduction
This chapter describes the design of cellular structure and the procedure of
generating cellular structures from a solid CAD model using Simpleware +CAD
software. It introduces the various cell topologies of Triply Periodic Minimal
Surface (TPMS) cellular structures used in this research. It also explains the
characteristics of TPMS cellular structures that make them potential for
SLM/DMLS manufacture. It described an efficient method for generating image
volumes representing the implicit functions so that both volume and surface
meshes can be constructed.
6.2 Triply-Periodic Minimal Surfaces
Minimal surfaces are defined within the language of differential geometry as
surfaces of zero mean curvature i.e. the sum of the principal curvatures at each
point is zero. This means they are equally convex and concave at all points and
their form is therefore saddle–like, or hyperbolic. They are
called minimal because given a fixed boundary curve the area of a “minimal
surface” which is minimal with respect to other surfaces with the same
boundary. Particularly fascinating are minimal surfaces that have a crystalline
structure, in the sense of repeating themselves in three dimensions, in other
words being triply periodic. Three–periodic minimal surfaces have three lattice
vectors, i.e., they are invariant under translation along three independent
directions. They are also called triply–periodic minimal surfaces (TPMS).
The first TPMS to be discovered and investigated was reported by Schwarz
(1890). He considered a soap-film across a quadrilateral frame, the edges of
which are four of the six edges of a regular tetrahedron and realised that such a
surface could be smoothly continued by joining the pieces edge to edge, the
edges becoming two-fold axes of symmetry of the resulting infinite object. The
surface is known as the D surface because its labyrinth graphs are 4-connected
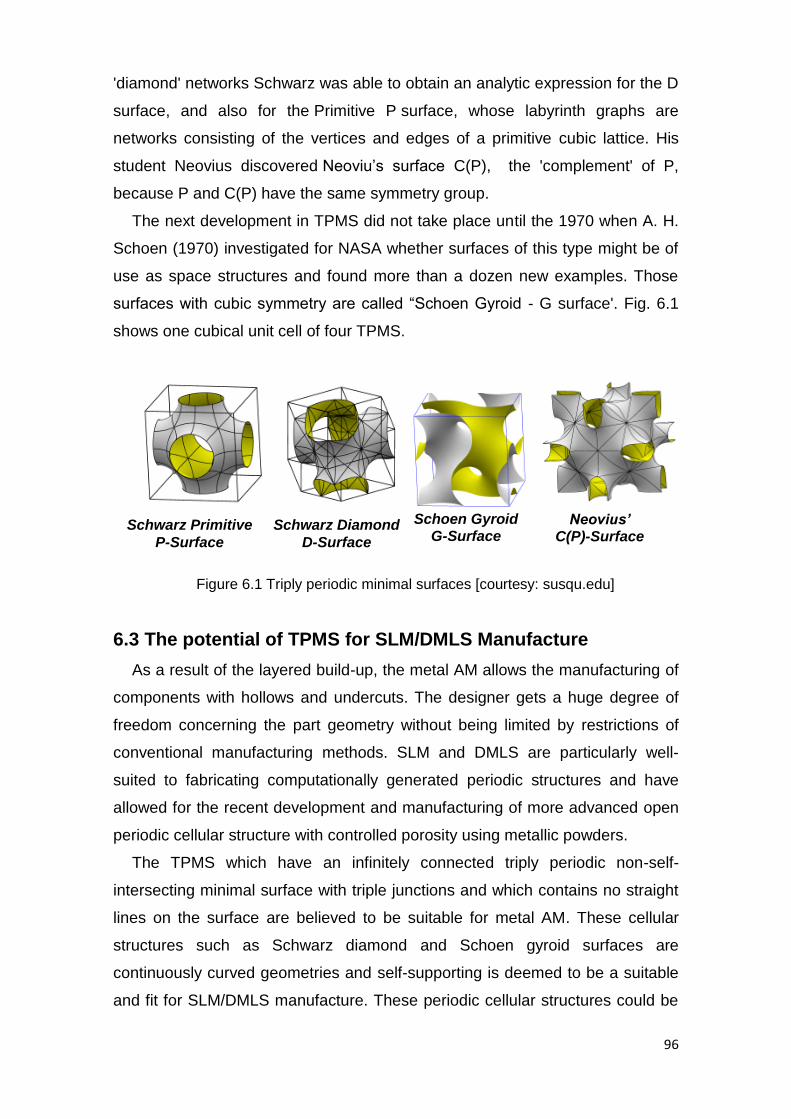
96
'diamond' networks Schwarz was able to obtain an analytic expression for the D
surface, and also for the Primitive P surface, whose labyrinth graphs are
networks consisting of the vertices and edges of a primitive cubic lattice. His
student Neovius discovered Neoviu’s surface C(P), the 'complement' of P,
because P and C(P) have the same symmetry group.
The next development in TPMS did not take place until the 1970 when A. H.
Schoen (1970) investigated for NASA whether surfaces of this type might be of
use as space structures and found more than a dozen new examples. Those
surfaces with cubic symmetry are called “Schoen Gyroid - G surface'. Fig. 6.1
shows one cubical unit cell of four TPMS.
Figure 6.1 Triply periodic minimal surfaces [courtesy: susqu.edu]
6.3 The potential of TPMS for SLM/DMLS Manufacture
As a result of the layered build-up, the metal AM allows the manufacturing of
components with hollows and undercuts. The designer gets a huge degree of
freedom concerning the part geometry without being limited by restrictions of
conventional manufacturing methods. SLM and DMLS are particularly well-
suited to fabricating computationally generated periodic structures and have
allowed for the recent development and manufacturing of more advanced open
periodic cellular structure with controlled porosity using metallic powders.
The TPMS which have an infinitely connected triply periodic non-self-
intersecting minimal surface with triple junctions and which contains no straight
lines on the surface are believed to be suitable for metal AM. These cellular
structures such as Schwarz diamond and Schoen gyroid surfaces are
continuously curved geometries and self-supporting is deemed to be a suitable
and fit for SLM/DMLS manufacture. These periodic cellular structures could be
Schwarz Primitive
P-Surface
Schwarz Diamond
D-Surface
Schoen Gyroid G-Surface
Neovius’ C(P)-Surface
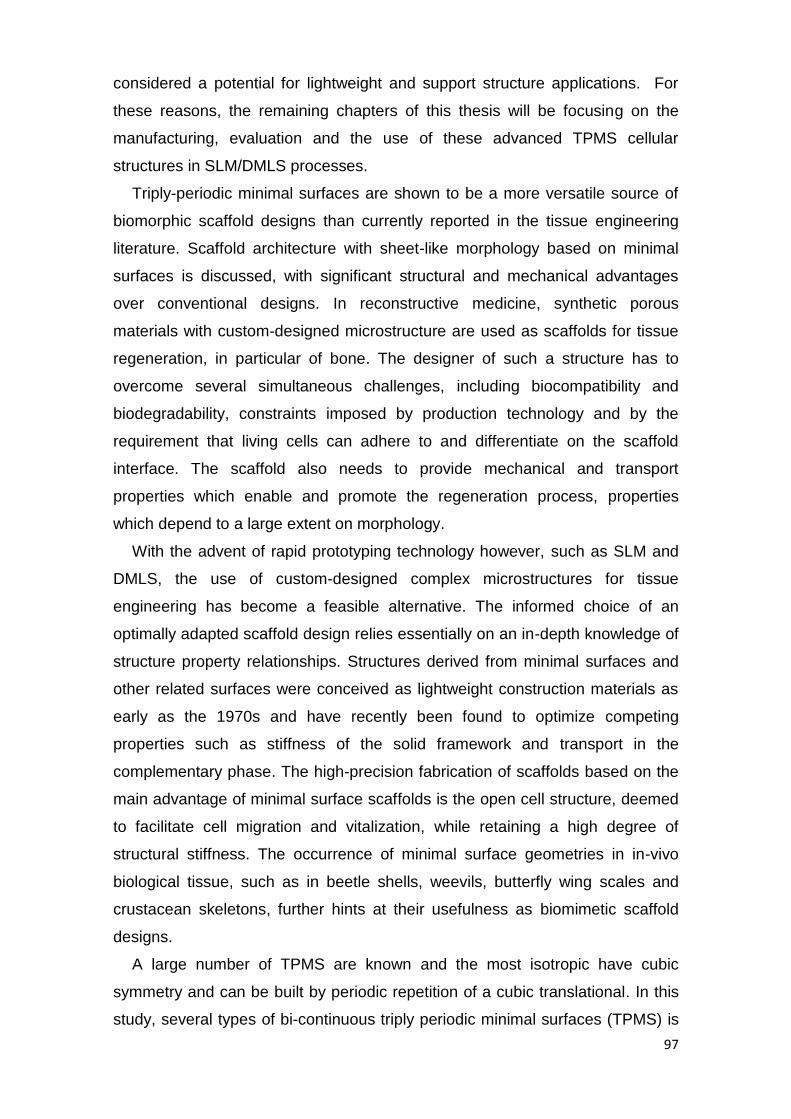
97
considered a potential for lightweight and support structure applications. For
these reasons, the remaining chapters of this thesis will be focusing on the
manufacturing, evaluation and the use of these advanced TPMS cellular
structures in SLM/DMLS processes.
Triply-periodic minimal surfaces are shown to be a more versatile source of
biomorphic scaffold designs than currently reported in the tissue engineering
literature. Scaffold architecture with sheet-like morphology based on minimal
surfaces is discussed, with significant structural and mechanical advantages
over conventional designs. In reconstructive medicine, synthetic porous
materials with custom-designed microstructure are used as scaffolds for tissue
regeneration, in particular of bone. The designer of such a structure has to
overcome several simultaneous challenges, including biocompatibility and
biodegradability, constraints imposed by production technology and by the
requirement that living cells can adhere to and differentiate on the scaffold
interface. The scaffold also needs to provide mechanical and transport
properties which enable and promote the regeneration process, properties
which depend to a large extent on morphology.
With the advent of rapid prototyping technology however, such as SLM and
DMLS, the use of custom-designed complex microstructures for tissue
engineering has become a feasible alternative. The informed choice of an
optimally adapted scaffold design relies essentially on an in-depth knowledge of
structure property relationships. Structures derived from minimal surfaces and
other related surfaces were conceived as lightweight construction materials as
early as the 1970s and have recently been found to optimize competing
properties such as stiffness of the solid framework and transport in the
complementary phase. The high-precision fabrication of scaffolds based on the
main advantage of minimal surface scaffolds is the open cell structure, deemed
to facilitate cell migration and vitalization, while retaining a high degree of
structural stiffness. The occurrence of minimal surface geometries in in-vivo
biological tissue, such as in beetle shells, weevils, butterfly wing scales and
crustacean skeletons, further hints at their usefulness as biomimetic scaffold
designs.
A large number of TPMS are known and the most isotropic have cubic
symmetry and can be built by periodic repetition of a cubic translational. In this
study, several types of bi-continuous triply periodic minimal surfaces (TPMS) is
98
considered, each of which can be realized as two different types of scaffold
architectures or topology. Bi-continuous TPMS are smooth infinite surfaces that
partition space into two intertwined labyrinthine domains and that are periodic in
three distinct lattices. By contrast, minimal surface sheet solids are porous
solids obtained by inflating the mathematical minimal surfaces to finite, spatially
homogeneous thickness until a solid volume fraction is reached, see Fig. 6.2.
The solid domain separates two network-like void domains which are infinite
and intertwined, but not interconnected.
Figure 6.2 – TPMS cellular structures with 15% volume fraction
6.4 Computer Modelling of TPMS Cellular Structures
6.4.1 Surface Representations
When dealing with solid 3D objects it is often convenient to only model the
object's boundaries using a mathematical representation of the surfaces. The
choice of surface representation is particularly important for the computational
modelling of 3D objects as each has its own advantages and disadvantages.
These include the availability and complexity of operations that can be used to
manipulate the surface (e.g. smoothing, Boolean operations) as well as the
efficiency of the representation. Each representation also has an impact on how
models are visualised and ultimately realised (e.g. via SLM/DMLS). The most
common representations can be classified as one of the following forms:
explicit, parametric or implicit.
In explicit surface representations points which lie exactly on the surface are
explicitly stored. The most common type of explicit surface is a mesh of
polygons; typically these are triangles or quadrilaterals although others can be
used. These polygons are often stored as an order list of vertex indices – the
order being used to define the direction the polygon is facing (i.e. the surface
Schoen gyroid Schwartz diamond
Schwartz primitive Neovius' surface

99
normal). Unlike explicit surfaces, parametric surfaces do not store points on a
surface. Instead, points on a parametric surface are expressed as a function of
the parametric variables (u,v), which can be generalised to lie on the unit
square [0,1] × [0,1]. Non-Uniform Rational B-Spline (NURBS) surfaces are a
form of parametric surface commonly used in CAD packages due to their
compact representation, smooth surfaces and easy of manipulation. Other
forms of parametric surfaces exist, such as Rational Gaussian (RaG) surfaces
and Fourier Shape Descriptions.
Implicit surfaces are defined as an iso-surface of some function f. In 3D the
surface is defined by a set of points p ∈ ℝ3 satisfying the equality:
( ) (6.1)
Where ℝ ℝ
As with parametric forms, implicit surfaces provide a compact representation
for potentially complex surfaces. They also offer a number of advantages,
notably their flexibility (as will be demonstrated later in this work) and well-
defined Boolean operations. However, unlike parametric forms they offer little
local shape control and manipulating them can be unintuitive. The implicit
formulation of a unit sphere is given below:
( ) (6.2)
In this instance the implicit form is not only more compact, but potentially
more useful as the sign of the function can be used to designate points as either
inside or outside the surface. For this purpose the following convention is
adopted:
Table 6.1 - Implicit surface in/out convention
Condition Interpretation
( ) 0 On surface
( ) Inside
( ) Outside
The implicit functions of interest to this work are the set of infinitely periodic
surfaces. The most notable of which are those discovered by Schoen (Gyroid)

100
and Schwarz (Diamond). In addition to being infinitely periodic these surfaces
are also approximations of minimal surfaces, tha3t is, the surfaces have a mean
curvature of zero. Using a combination of trigonometric functions in the form
given in Eq. (6.3) a number of periodic surfaces can be generated,
∑ ∏ ( )
(6.3)
The simplest triply periodic (or dual periodic in 2D) function in this form is the
Schwarz Primitive; cos(x) + cos(y) + cos(z) + 1 = 0 (6.4)
6.4.2 Mesh Generation
Accurate and robust mesh generation is an important step towards the
fabrication of cellular structures. The work presented in this section looks at
methods for generating image volumes representing the implicit functions so
that both volume and surface meshes can be constructed. An entirely image-
based approach is taken to exploit the advantages of image-based meshing.
Methods previously used in relied upon the generation of a floating-point
volume which was then iso-surfaced. While this method is straight-forward,
simply requiring that the function be sampled at regular intervals, it becomes
difficult to generate a volume mesh and integrate with other image data.
To overcome these difficulties we require that the generated volumes’ data-
type matches that used by +ScanFE from Simpleware Ltd. In the C
programming language this is unsigned char, an 8 bit integer. By using this
data-type the generated volumes can easily be combined with data from other
sources, such as medical imaging devices and meshed with +ScanFE. The
most straight-forward translation to image-space that can be made from an
implicit function is the generation of a binary volume. By evaluating the function,
f, over a range of values voxels can be determined to be either inside or outside
and their value set accordingly.

101
Figure 6.3 Binary slice representing the Schwarz Primitive using 20 × 20 px
Despite being efficient to generate, the binary representation yields a poor
reconstruction, as can be seen in Fig. 6.3. The reconstructed surface can be
improved by introducing greyscale values into the volume. This can be achieved
using a smoothing algorithm such as Gaussian smoothing, however these
algorithms can have adverse effects such as shrinking the volume and
removing small features. A more appropriate solution is to generate the volume
with greyscale values such that they result in the reconstructed surface being
placed as close as possible to the ‘ideal’ surface. The marching cubes algorithm
will be used to generate a triangulated surface, as such, the volume can be
generated so as to best utilise the greyscale values. As the position of the re-
constructed surface is only dependent on the two voxels either side of it, a small
region of greyscale values should be placed either side of the ideal surface.
These greyscale values should reflect their distance to the surface, mimicking
the partial volume effect. Voxels further from the surface may simply be marked
as inside or outside. However, unlike many implicit functions used in computer
graphics, the functions of interest are not distance functions. That is, their value
does not reflect a linear measure of distance from the surface. To overcome this
a point is chosen, from the discretising volume, that is close to the ideal surface
(i.e. such that f(x,y,z) ≈ 0). The gradient at this point is then computed, allowing
the greyscale values to be set such that their values reflect their distance from
the surface. Values inside of the surface may be calculated as follows:
( )
(6.5)
where Gp is the gradient near the surface.

102
Figure 6.4 (a) shows an example from a volume generated using this
method. The reconstructed surface is shown in Fig. 6.4 (b).
Figure 6.4 (a) Greyscale slice representing the Schoen gyroid (b) Reconstructed
surface of the Schoen Gyroid
6.5 Simpleware software
6.5.1 Overview
Simpleware is a spin-off company from the University of Exeter.
Simpleware provides the world-leading software solution for the
conversion of 3D images into CAD, STL (for AM processes) and Finite
Element models. Simpleware offers three software options for processing
and meshing 3D image data. The software is based on a core image
processing platform, ScanIP, with optional bolt-on modules for mesh
generation and CAD integration. The relationship between these products
is shown in Fig. 6.5.
Figure 6.5 Simpleware software products (Simpleware Ltd.)
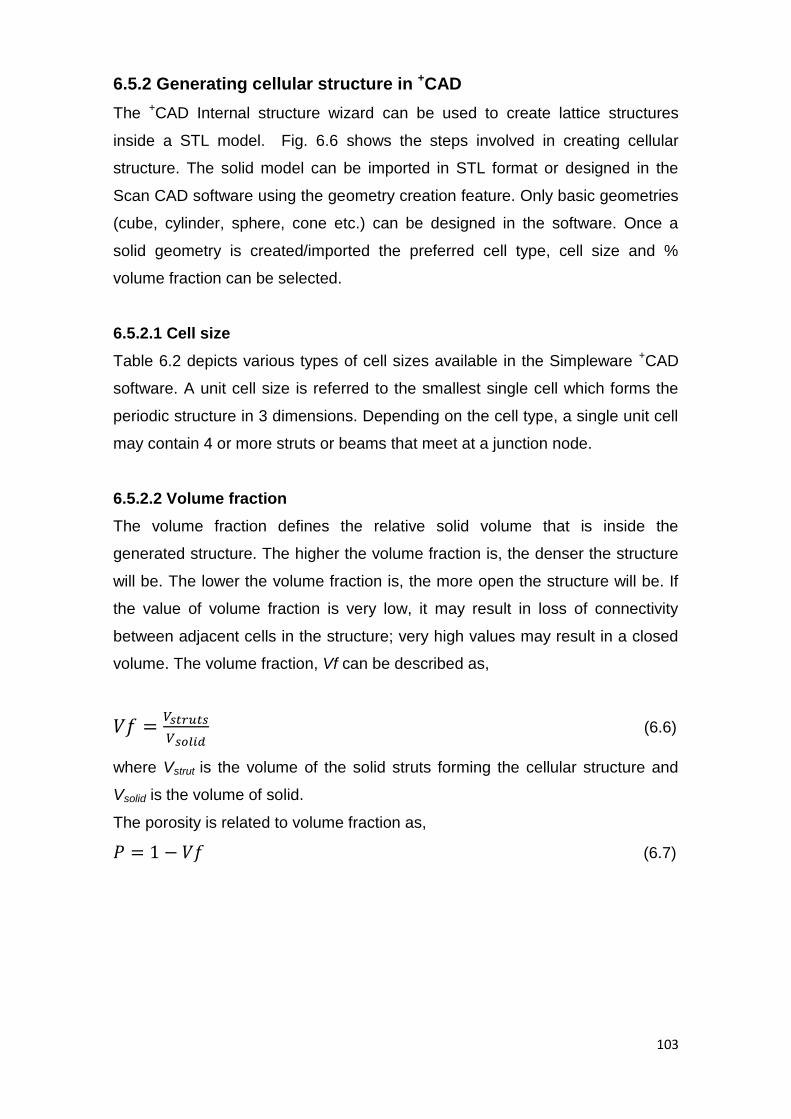
103
6.5.2 Generating cellular structure in +CAD
The +CAD Internal structure wizard can be used to create lattice structures
inside a STL model. Fig. 6.6 shows the steps involved in creating cellular
structure. The solid model can be imported in STL format or designed in the
Scan CAD software using the geometry creation feature. Only basic geometries
(cube, cylinder, sphere, cone etc.) can be designed in the software. Once a
solid geometry is created/imported the preferred cell type, cell size and %
volume fraction can be selected.
6.5.2.1 Cell size
Table 6.2 depicts various types of cell sizes available in the Simpleware +CAD
software. A unit cell size is referred to the smallest single cell which forms the
periodic structure in 3 dimensions. Depending on the cell type, a single unit cell
may contain 4 or more struts or beams that meet at a junction node.
6.5.2.2 Volume fraction
The volume fraction defines the relative solid volume that is inside the
generated structure. The higher the volume fraction is, the denser the structure
will be. The lower the volume fraction is, the more open the structure will be. If
the value of volume fraction is very low, it may result in loss of connectivity
between adjacent cells in the structure; very high values may result in a closed
volume. The volume fraction, Vf can be described as,
(6.6)
where Vstrut is the volume of the solid struts forming the cellular structure and
Vsolid is the volume of solid.
The porosity is related to volume fraction as,
(6.7)

104
Figure 6.6 Steps involved in generating cellular structure in +CAD
Cellular structure
enclosed in shell boundary
105
Table 6.2 - Different cell types in Simpleware +CAD software
A single cell 3x3x3 cells Name of the cell type
Schwarz Primitive
Schwarz Diamond
Schoen Gyroid
Neovius’ Surface
Schwarz ‘W’
6.6 Conclusion
This chapter has presented the design and generation tool for advanced cellular
structures which will be used in the remaining chapters of this thesis.
Introduction was given on the topological design of triply periodic minimal
surfaces (TPMS) including Schwarz P, Schwarz Diamond, Neovius’, and
Schoen Gyroid surfaces. The major difference between TPMS cellular structure
and traditional designed cellular structures for metal AM was highlighted. The
suitability of TPMS for SLM/DMLS manufacture and their potential for
lightweight and support structure applications was highlighted. The need for an

106
efficient method of generating cellular structures and the implementation of
these methods in Simpleware software was explained.
It was illustrated how these design tools can provide effective approach to
modify or optimise the cellular structures for the uses in the SLM/DMLS
process. The steps involved in creating cellular structures from solid STL model
using Simpleware +CAD software was described.
The TPMS cellular structure presented here and used throughout this
research are primarily selected for their good manufacturability in SLM process
and not necessarily are optimized for mechanical properties.
The following chapters of the thesis will present a comprehensive evaluation
on the manufacturing and mechanical properties of these advanced TPMS
cellular structures as well as their use in support structure applications in
SLM/DMLS processes using a range of metal powders.

107
CHAPTER 7
Manufacturability Study of TPMS Cellular Structures in
SLM and DMLS Processes
7.1 Introduction
In the introduction and also in chapter 6, it was stressed that one of the
potential area in which the largest gain in metal AM can be attained is through
the use of lightweight cellular structures which require less build time, material
and energy during processing while also offering enhanced functional
performance. The development of advanced TPMS cellular structures suitable
for metal AM from high performance light alloys is expected to widen the use of
these processes for many new applications.
The aim of this chapter is to experimentally investigate and characterise
these cellular structures using different metal powders. The purpose of the
experiments is to evaluate the manufacturability of various cell types, sizes,
orientations, and volume fractions of TPMS cellular structures. The
manufacturability is an important factor for the selection of the cell structure.
Here the manufacturability refers the easy to manufacture; as some cells are
complex with certain areas that might need to be supported. Such supports are
always difficult to remove after manufacturing the part. Although metallic AM
parts have been produced and used, internal geometries with very fine
structures below 1 mm still are a technical challenge. Comprehensive
experimental works were conducted in SLM and DMLS (two powder bed fusion
processes) on four different cell types using 316L stainless steel, Titanium alloy
(Ti-6Al-4V), and Aluminium alloy (AlSi10Mg). Different material and machines
were used to know whether these cellular structures can be manufactured
reliably at different metal AM machines in a wide range of cell sizes, orientation
angles, and volume fractions. The manufactured cellular structures were
examined using visual inspections, µ-CT 2D and 3D model reconstruction, SEM
morphology analysis, and Optical Microscopy measurements. The mechanical
properties of these cellular structures are presented in chapter 8.
108
7.2 Experimental Procedures
7.2.1 Rationale
Table 7.1 illustrates the experimental framework used for studying the
manufacturability of cellular structure. The cellular structure were produced from
three metallic powders (316L Stainless Steel, Ti-6Al-4V, and AlSi10Mg) using
SLM MCP Realizer and DMLS EOSINT M270/280 machines.
The framework includes experimental studies on four different cell types
(Schoen Gyroid, Schwarz Diamond, Schwarz W, Neovius’ surface); cell sizes of
2-9mm, cell orientation angles of 00 - 1800 , and volume fractions of 5-20%. The
rationale behind the selection of these parameters and ranges in the
experimental studies are discussed below,
7.2.1.1 Cell type
The shape of the cell is important parameter for the manufacturability of
cellular structures. Fig. 7.1 shows four different cell types used in experiments
(details of these cellular structures can be found in chapter 6). Among the other
cell type that can be generated in Simpleware software is the Schwarz P which
was omitted due to the lower curviness and flat horizontal strut compared to
more organic Gyroid, Diamond, Neovius’, and was replaced by Schwarz ‘W’.
The selected four candidate cell types have differences in their cell topology,
which result differences in, strut thickness, strut curviness, and strut connectivity
(i.e. the number of struts which share a common node). As a result, the
amounts of overhang which result from each particular cell design affect the
manufacturability in SLM and DMLS processes. Furthermore, different cell
types will have different strength and load bearing capabilities.

109
Figure 7.1 CAD models of four TPMS cell types used in the experiments
7.2.1.2 Cell size
The size is another very important parameter which influences the
manufacturability. The cell size determines the number of pores per inch, for a
given volume fraction, the larger the cell size is, the larger the pore size and
vice versa. Depending on cell type, there is a limit on the largest cell size that
can be manufactured in SLM and DMLS without using support structure.
Because when the size is large, the spherical pore increases and result an
upper overhang strut. It is crucial to understand these limitations for different
cell types to have a successful and reliable build conditions. The size of the
pore and the powder particle size, determines the easy of removing the loose
powder which is trapped inside the structure during the build process.
Removing loose powder from very small cell size could pose further difficulties
and increase post-processing time. In fact, if you efficiently cannot remove the
trapped loose powder, then you neither save material nor reduce weight. It is
also expected that variation of laser energy densities and cooling rates will exist
between cell sizes which could affect the cell strut density. As a consequence,
the mechanical properties of the cellular structure will also vary between cell
sizes.
7.2.1.3 Cell orientation
The cell orientation angle (i.e. cell rotation) could vary depending on the build
orientation of the component in which it is integrated. Example of this is the
110
situation in which the cellular structures are used as a sandwich for lightweight
applications. In SLM/DMLS, one of the ways to avoid or minimize support
structure is by changing the orientation of the part. Orientation could also be
used to reduce the build time by avoiding orientation which result a long vertical
Z-height.
Additionally, a cellular structure which is manufacturable in one orientation
could fail in another orientation because of the changes in strut overhanging.
Each rotation structures a different cell overhang area and strut angle with
respect to the horizontal plane causing a distinctive scanning area of laser
beam and manufacturing demands. Different materials also present distinctive
support structure requirements. For these reason, it is therefore important to
determine the relationship between cell orientations to manufacturability in
SLM/DMLS processes. This will enable the use of cellular structure in without
worrying about their use in various possible build orientations. The effect of cell
orientation on mechanical properties is equally vital and will be addressed in the
next chapter.
7.2.1.4 Volume fraction
The volume fraction is the solid fraction in the generated volume and
determines the thickness of the cell strut. The higher the volume fraction is, the
thicker and stronger the strut is which form the cell and vice versa. For a fixed
cell size, when the volume fraction is increased, the pore size (i.e. the space
between struts) is decreased as the struts are inflated and fill the pore until the
volume fraction approaches unity (solid). If the pore is too narrow and small, it
may not be possible removed/drained loose powder after the build. For a fixed
volume fraction, the thickness of the strut varies for different cell types and sizes
due to the difference in cell morphology. Understanding the effect of volume
fraction on manufacturability is important for our understanding on the
limitations of SLM/DMLS for various cell types, sizes, and materials. Similarly, it
is essential to create a relationship between volume fraction and mechanical
properties of the manufacturable cellular structures.

111
Table 7.1 – Experimental framework of manufacturing cellular structures
Experiment No. Cell type Cell size
(mm)
Volume fraction (%) Cell orientation
(Degrees)
Material Machine
1 Gyroid
Diamond
Schwartz W
Neovius
2-9
2-9
4-6
5-6
15
15
15
15
Normal
Normal
Normal
Normal
316L Stainless steel
316L Stainless steel
316L Stainless steel
316L Stainless steel
SLM MCP-Realizer
SLM MCP-Realizer
SLM MCP-Realizer
SLM MCP-Realizer
2
Gyroid 5 6-15 Normal 316L Stainless steel
SLM MCP-Realizer
3 Gyroid
Diamond
Schwartz W
Neovius
5
5
5
5
15
15
15
15
20-180 rotation
20-180 rotation
Worst orientation
Worst orientation
316L Stainless steel
316L Stainless steel
316L Stainless steel
316L Stainless steel
SLM MCP-Realizer
SLM MCP-Realizer
SLM MCP-Realizer
SLM MCP-Realizer
4 Gyroid
Diamond
3-7
3-7
5-20
5-20
Normal
Normal
Ti-6Al-4V, AlSi10Mg
Ti-6Al-4V, AlSi10Mg
DMLS M270/M280
DMLS M270/M280
5 Gyroid
5 15 20-180 rotation
Ti-6Al-4V
DMLS M270
316L Stainless steel – Austenitic stainless steel powder supplied by Sandvik Osprey Ltd., UK
Ti-6Al-4V - Titanium alloy Grade 5 powder supplied by LPW Technology Ltd., UK
AlSi10Mg - Aluminium alloy powder supplied by EOS GmbH., Germany
Normal – is the non-orientated cell as normaly generated by simpleware software.
Worst orientation - is the cell orientation angle which result the largest possible overhanging region of the cell strut.
112
7.2.2 Experiments
The following experiments were conducted to achieve substantial
results for various parameters investigated. The numbers of experiments
were adequately controlled while maximizing the outcome to achieve the
objectives. This is mainly due to AM metal powders being quite expensive
and the relatively slow build rate of SLM/DMLS process.
7.2.2.1 Exp.1: The Effect of Cell Type and Size on Manufacturability
This experiment was conducted to investigate the effect of cell type and size
on manufacturability. The four cell types shown in Fig.7.1 were used in the
experiment. The cell types and sizes were generated for a fixed volume fraction
of 15%. The cell size of Gyroid and Diamond cell types was varied from 2 mm
to 9 mm, but it was not possible to generate similar cell size range for Schwartz
‘W’ and Neovius’ surface. Because of their cell shape and connectivity which
form a fragile cell struts and weakly connected cells at 15% volume fractions
additionally, generating cell sizes smaller than 2mm could consume large
computational time and computer memory which is difficult to handle by
SLM/DMLS machine software.
A solid cubic model with dimensions of 25mm×25mm×15mm was used to
represent the test specimen. The steps involved in generating cellular structure
using Simpleware software is explained in chapter 6. The selected dimensions
provide a sufficient number of adjacent cells suitable for manufacturability and
mechanical study. 0The vertical Z-height parallel to the build direction is
shortened to reduce the build-time and material consumption.
The experiment was carried out on a SLM MCP-Realizer machine using
316L stainless steel metal powder. The parts were built on thick steel base
plate, and then after the part building is completed, it was cut off from the base
plate using Wire Electric Discharge Machining (Wire-EDM). The experimental
samples then went through a characterization by visual observation, µ-CT,
SEM, and optical microscopy.
7.2.2.2 Exp.2: The Effect of Volume-Fraction on Manufacturability
This aim of this experiment was to investigate the effect of volume fraction on
manufacturability. The Gyroid cell type with fixed cell size of 5mm and variable
113
volume fractions of 6%, 8%, 10%, 12% and 15% were tested in SLM MCP-
Realizer using 316L stainless steel metal powder. The gyroid strut is the most
fascinating TPMS shape among the cell types for its continuous curvature. All
other experimental conditions are as explained in Exp.1 (refer to section
7.2.2.1).
7.2.2.3 Exp.3: The Effect of Cell-Orientation on Manufacturability
This experiment was performed to investigate the manufacturability of
different cell orientations. The as-generated Gyroid and Diamond cell types with
fixed volume fraction and cell size of 15% and 5mm, respectively, were rotated
in Y-axis from 00 reference normal plane to 200, 400, 600, 800, 1000, 1200, 1400,
1600, and 1800 rotation. The Simpleware software does not permit the
automatic cell rotation, and so the cell rotation was created manually. This was
done by first generating a cellular structure using a cylindrical part with diameter
= 20 mm and height = 15 mm, and then rotating in a fixed axis (Y-axis). After
the part was rotated to a specific angle, it was cut into two sections forming a
two semi cylinders. One semi cylinder is used for the experimental purpose as
depicted in Fig. 7.2 (a). In addition to the 9 cell orientation ranging from 0-1800
with a step change of 200, it was found that there exists a worst orientation for
all cell types. Similar procedure was followed for the worst orientation except
that instead of semi-cylinder, a cuboid with dimensions of 25mm×25mm×15mm
was cut from the cylinder. Fig 7.2 (b) shows the worst orientation of the four cell
types. The worst possible orientation is the one with largest overhang area and
40o–500 strut angle with respect to the horizontal base plane. In practice, this
orientation should be the most difficult to build in metal AM technologies
especially for large cell sizes. The volume fraction and cell size of the Schwartz
W and Neovius’ surface was also fixed to 15% and 5mm respectively. All other
experimental conditions are as explained in Exp.1 (refer to section 7.2.2.1).

114
Figure 7.2 (a) Cell orientations of Gyroid structure (Front view) (b) Worst cell
orientations of four cell types (Isometric view)
7.2.2.4 Exp.4: Further Tests on the Effect of Cell and Volume Fraction on
Manufacturability
Further manufacturing tests on cell size and volume fraction were conducted
in DMLS process. The purpose was to test the manufacturability of TPMS
cellular structures in different materials and metal AM machine. The
manufacturability of cellular structure could be affected by the material being
processed, with some materials generating a larger thermal stresses and
temperature gradients during the build process. The Ti-6Al-4V and AlSi10Mg
are two potential lightweight materials but are considered as one the most
difficult materials to process in metal AM due to the high reactivity with oxygen
Worst orientation
(a)
(b)
Bu
ild
Dir
ec
tio
n
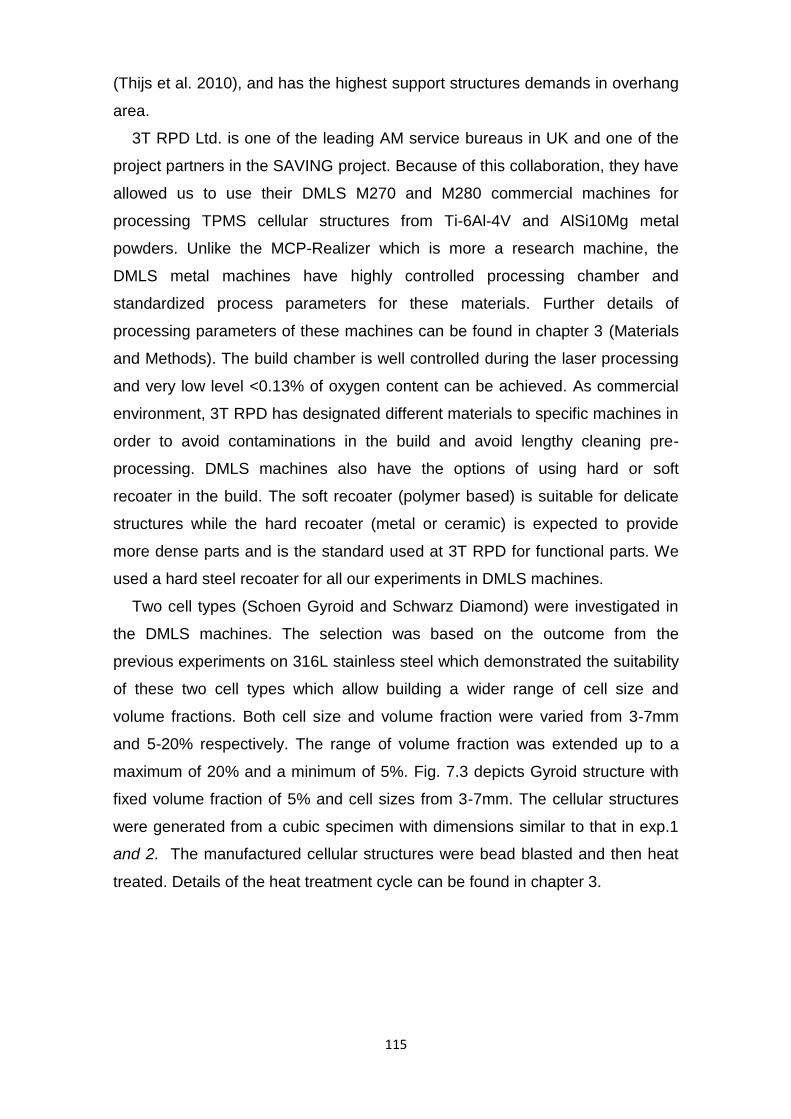
115
(Thijs et al. 2010), and has the highest support structures demands in overhang
area.
3T RPD Ltd. is one of the leading AM service bureaus in UK and one of the
project partners in the SAVING project. Because of this collaboration, they have
allowed us to use their DMLS M270 and M280 commercial machines for
processing TPMS cellular structures from Ti-6Al-4V and AlSi10Mg metal
powders. Unlike the MCP-Realizer which is more a research machine, the
DMLS metal machines have highly controlled processing chamber and
standardized process parameters for these materials. Further details of
processing parameters of these machines can be found in chapter 3 (Materials
and Methods). The build chamber is well controlled during the laser processing
and very low level <0.13% of oxygen content can be achieved. As commercial
environment, 3T RPD has designated different materials to specific machines in
order to avoid contaminations in the build and avoid lengthy cleaning pre-
processing. DMLS machines also have the options of using hard or soft
recoater in the build. The soft recoater (polymer based) is suitable for delicate
structures while the hard recoater (metal or ceramic) is expected to provide
more dense parts and is the standard used at 3T RPD for functional parts. We
used a hard steel recoater for all our experiments in DMLS machines.
Two cell types (Schoen Gyroid and Schwarz Diamond) were investigated in
the DMLS machines. The selection was based on the outcome from the
previous experiments on 316L stainless steel which demonstrated the suitability
of these two cell types which allow building a wider range of cell size and
volume fractions. Both cell size and volume fraction were varied from 3-7mm
and 5-20% respectively. The range of volume fraction was extended up to a
maximum of 20% and a minimum of 5%. Fig. 7.3 depicts Gyroid structure with
fixed volume fraction of 5% and cell sizes from 3-7mm. The cellular structures
were generated from a cubic specimen with dimensions similar to that in exp.1
and 2. The manufactured cellular structures were bead blasted and then heat
treated. Details of the heat treatment cycle can be found in chapter 3.
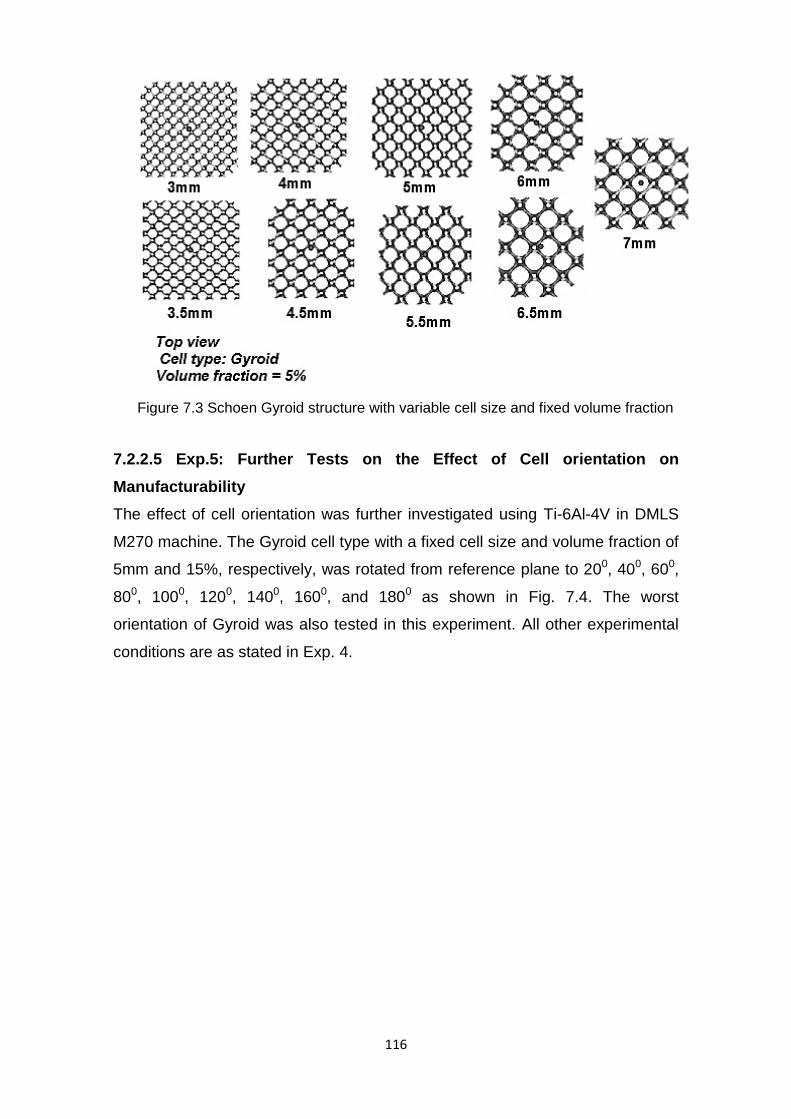
116
Figure 7.3 Schoen Gyroid structure with variable cell size and fixed volume fraction
7.2.2.5 Exp.5: Further Tests on the Effect of Cell orientation on
Manufacturability
The effect of cell orientation was further investigated using Ti-6Al-4V in DMLS
M270 machine. The Gyroid cell type with a fixed cell size and volume fraction of
5mm and 15%, respectively, was rotated from reference plane to 200, 400, 600,
800, 1000, 1200, 1400, 1600, and 1800 as shown in Fig. 7.4. The worst
orientation of Gyroid was also tested in this experiment. All other experimental
conditions are as stated in Exp. 4.

117
Figure 7.4 Schoen Gyroid with variable cell orientation (Front view)
7.3 Results and discussion
7.3.1 316L stainless steel cellular structures
7.3.1.1 Manufacturability Analysis
Fig. 7.5 shows the four types of TPMS cellular structures manufactured in
SLM MCP-Realizer using 316L stainless steel powder. The experiment result
reveals that Gyroid and Diamond cell types with cell sizes ranging from 2–8 mm
and 15% volume fraction can be successfully manufactured in SLM with no
obvious deformations in the cell strut. But for 9 mm cell size, some
deformation/sagging were observed specially in Gyroid structure. When sagging
occurs during building a large cell, it disrupts the levelness of powder
distribution of the next layer. The layer thickness becomes higher in the sagged
region and the newly melted layer may not bond well to the previous layer. This
however depends on the amount of sagging and the resultant layer thickness.
The sagging/deformation in 9mm cell size were lower in the diamond cell
type; however, there was difficulty of removing loose powder for diamond cell
sizes smaller than 3mm. The reason is that diamond cell shape and strut
interconnectivity is different to that of Gyroid and thus result a higher number of
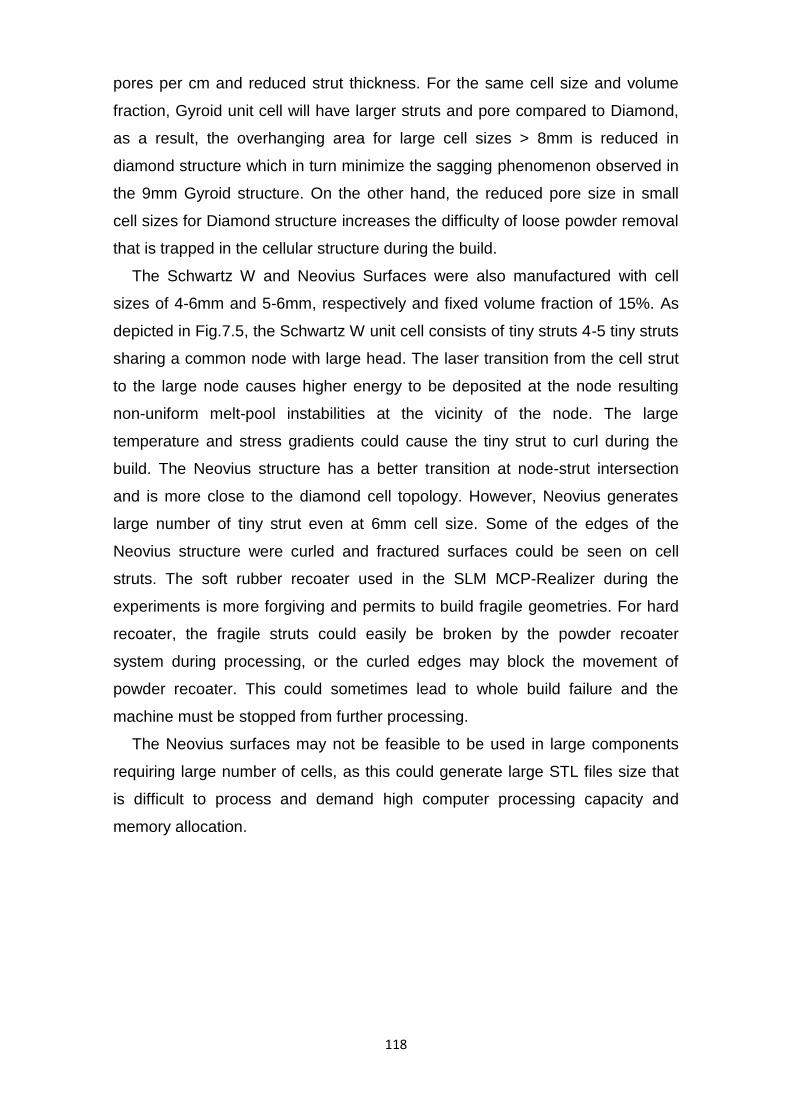
118
pores per cm and reduced strut thickness. For the same cell size and volume
fraction, Gyroid unit cell will have larger struts and pore compared to Diamond,
as a result, the overhanging area for large cell sizes > 8mm is reduced in
diamond structure which in turn minimize the sagging phenomenon observed in
the 9mm Gyroid structure. On the other hand, the reduced pore size in small
cell sizes for Diamond structure increases the difficulty of loose powder removal
that is trapped in the cellular structure during the build.
The Schwartz W and Neovius Surfaces were also manufactured with cell
sizes of 4-6mm and 5-6mm, respectively and fixed volume fraction of 15%. As
depicted in Fig.7.5, the Schwartz W unit cell consists of tiny struts 4-5 tiny struts
sharing a common node with large head. The laser transition from the cell strut
to the large node causes higher energy to be deposited at the node resulting
non-uniform melt-pool instabilities at the vicinity of the node. The large
temperature and stress gradients could cause the tiny strut to curl during the
build. The Neovius structure has a better transition at node-strut intersection
and is more close to the diamond cell topology. However, Neovius generates
large number of tiny strut even at 6mm cell size. Some of the edges of the
Neovius structure were curled and fractured surfaces could be seen on cell
struts. The soft rubber recoater used in the SLM MCP-Realizer during the
experiments is more forgiving and permits to build fragile geometries. For hard
recoater, the fragile struts could easily be broken by the powder recoater
system during processing, or the curled edges may block the movement of
powder recoater. This could sometimes lead to whole build failure and the
machine must be stopped from further processing.
The Neovius surfaces may not be feasible to be used in large components
requiring large number of cells, as this could generate large STL files size that
is difficult to process and demand high computer processing capacity and
memory allocation.
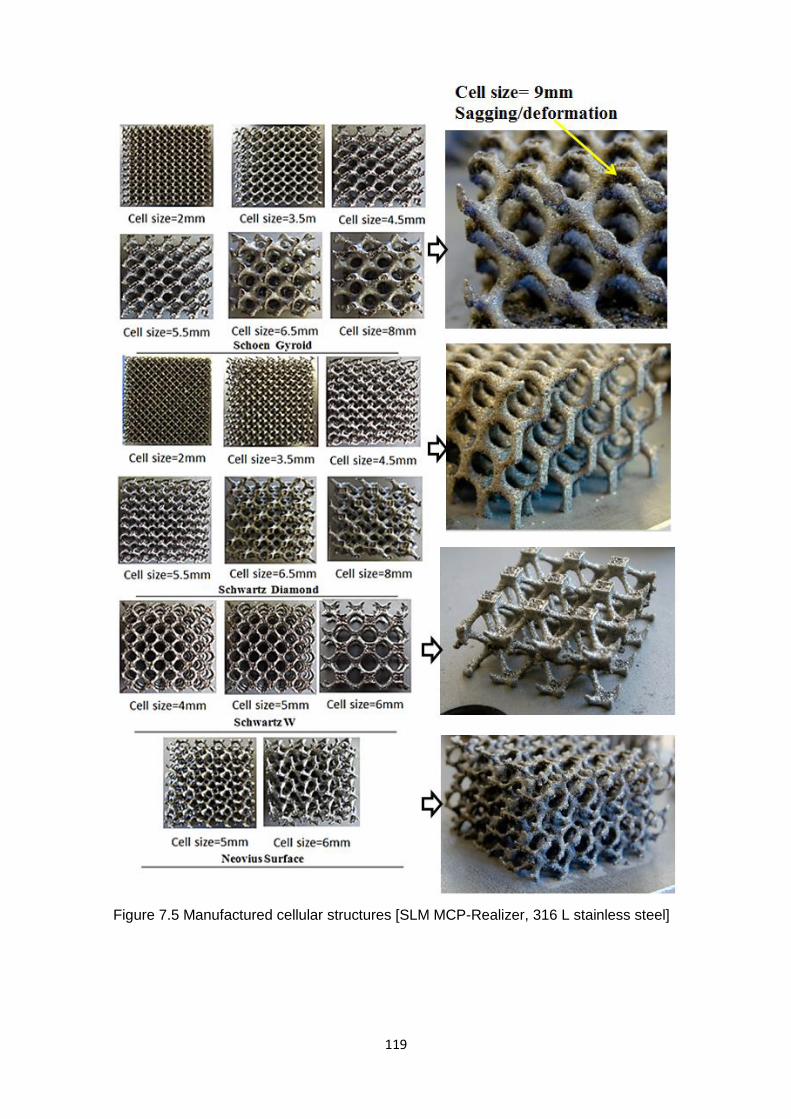
119
Figure 7.5 Manufactured cellular structures [SLM MCP-Realizer, 316 L stainless steel]
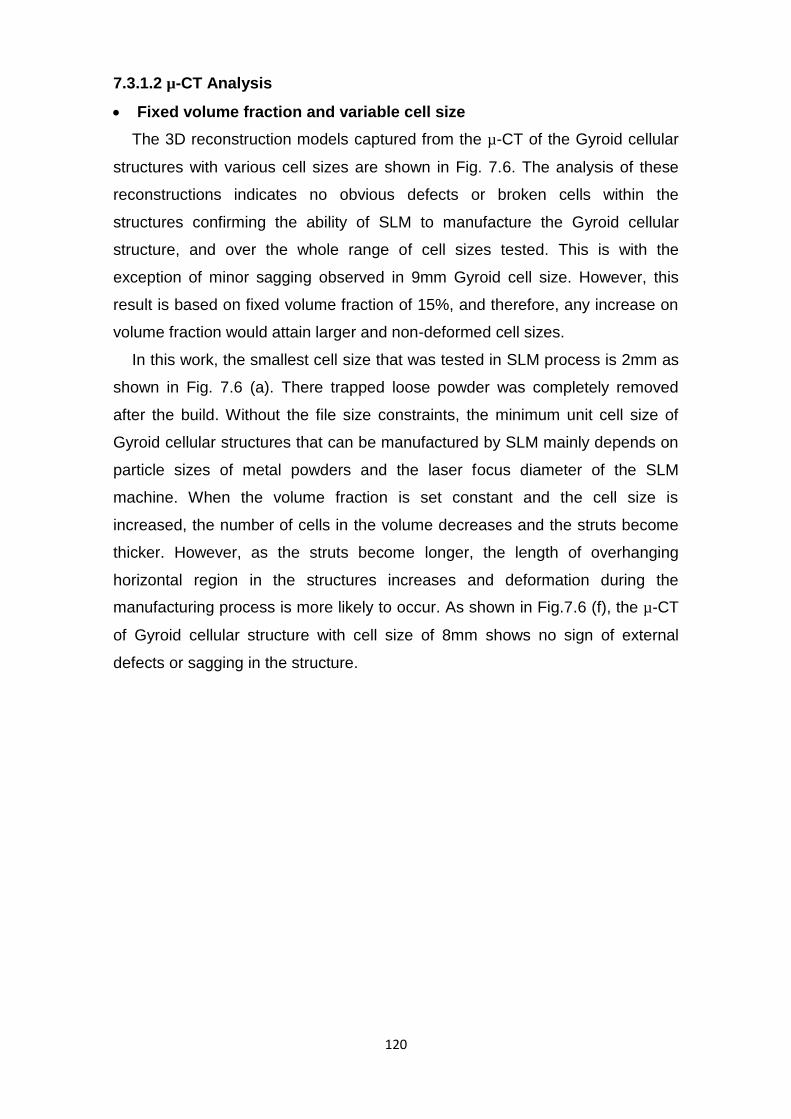
120
7.3.1.2 µ-CT Analysis
Fixed volume fraction and variable cell size
The 3D reconstruction models captured from the µ-CT of the Gyroid cellular
structures with various cell sizes are shown in Fig. 7.6. The analysis of these
reconstructions indicates no obvious defects or broken cells within the
structures confirming the ability of SLM to manufacture the Gyroid cellular
structure, and over the whole range of cell sizes tested. This is with the
exception of minor sagging observed in 9mm Gyroid cell size. However, this
result is based on fixed volume fraction of 15%, and therefore, any increase on
volume fraction would attain larger and non-deformed cell sizes.
In this work, the smallest cell size that was tested in SLM process is 2mm as
shown in Fig. 7.6 (a). There trapped loose powder was completely removed
after the build. Without the file size constraints, the minimum unit cell size of
Gyroid cellular structures that can be manufactured by SLM mainly depends on
particle sizes of metal powders and the laser focus diameter of the SLM
machine. When the volume fraction is set constant and the cell size is
increased, the number of cells in the volume decreases and the struts become
thicker. However, as the struts become longer, the length of overhanging
horizontal region in the structures increases and deformation during the
manufacturing process is more likely to occur. As shown in Fig.7.6 (f), the µ-CT
of Gyroid cellular structure with cell size of 8mm shows no sign of external
defects or sagging in the structure.

121
Figure 7.6 µ-CT 3D reconstruction models of the Schoen Gyroid cellular structure with
fixed volume fraction of 15% and varying unit cell sizes [SLM MCP-Realizer, 316 L
stainless steel].
To examine if there are pores present in the solid struts of the cellular
structure, µ-CT 2D cross-sectional images was taken from the manufactured
Gyroid cellular structure as shown in Fig. 7.7. The cross-sectional images in
Fig. 7.7(a) reveal the presence of micro-pores inside the strut of the
manufactured Gyroid structure with cell size of 2mm. The micro-pores appear
as small black dots in the white strut image. The number of micro-pores
increase as the cell size is increased (see Fig. 7.7 (b-f). The maximum amount
of pores was found in largest cell size scanned which is 8mm as shown in Fig.
7.7(f). The increasing density for smaller cell sizes may be attributed to their
shorter scan vector length during the laser processing. The cross-sectional area
of the strut to be scanned by the laser is smaller in small cell sizes enabling
higher energy concentration compared to large cell sizes. In short scan vectors,
the adjacent laser tracks are scanned more rapidly one after the other, leaving
little cool down time in between them, and thus resulting in higher temperatures
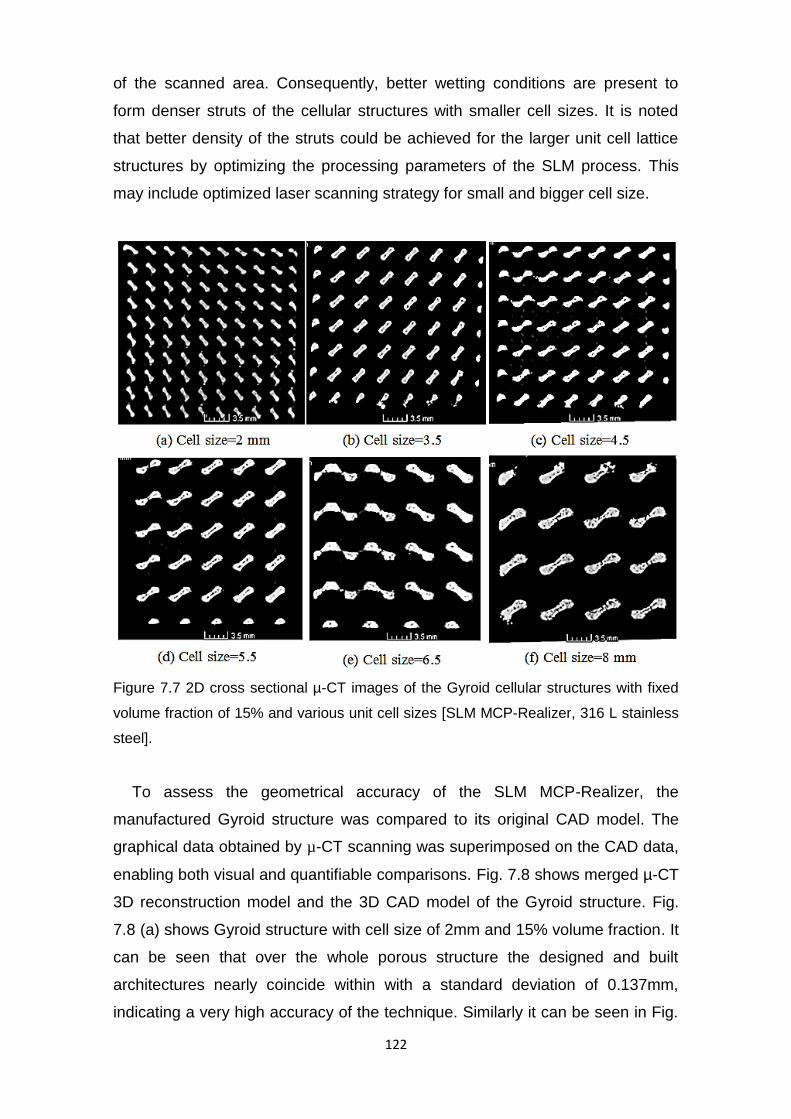
122
of the scanned area. Consequently, better wetting conditions are present to
form denser struts of the cellular structures with smaller cell sizes. It is noted
that better density of the struts could be achieved for the larger unit cell lattice
structures by optimizing the processing parameters of the SLM process. This
may include optimized laser scanning strategy for small and bigger cell size.
Figure 7.7 2D cross sectional µ-CT images of the Gyroid cellular structures with fixed
volume fraction of 15% and various unit cell sizes [SLM MCP-Realizer, 316 L stainless
steel].
To assess the geometrical accuracy of the SLM MCP-Realizer, the
manufactured Gyroid structure was compared to its original CAD model. The
graphical data obtained by µ-CT scanning was superimposed on the CAD data,
enabling both visual and quantifiable comparisons. Fig. 7.8 shows merged µ-CT
3D reconstruction model and the 3D CAD model of the Gyroid structure. Fig.
7.8 (a) shows Gyroid structure with cell size of 2mm and 15% volume fraction. It
can be seen that over the whole porous structure the designed and built
architectures nearly coincide within with a standard deviation of 0.137mm,
indicating a very high accuracy of the technique. Similarly it can be seen in Fig.
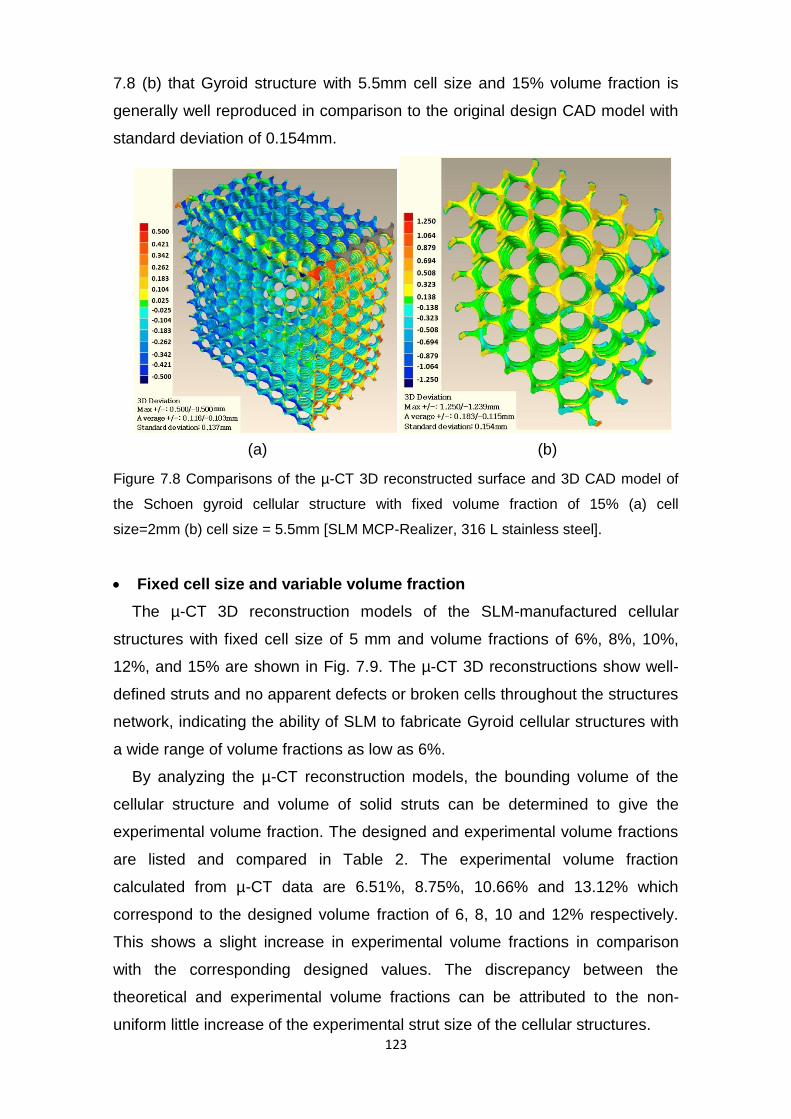
123
7.8 (b) that Gyroid structure with 5.5mm cell size and 15% volume fraction is
generally well reproduced in comparison to the original design CAD model with
standard deviation of 0.154mm.
Figure 7.8 Comparisons of the µ-CT 3D reconstructed surface and 3D CAD model of
the Schoen gyroid cellular structure with fixed volume fraction of 15% (a) cell
size=2mm (b) cell size = 5.5mm [SLM MCP-Realizer, 316 L stainless steel].
Fixed cell size and variable volume fraction
The µ-CT 3D reconstruction models of the SLM-manufactured cellular
structures with fixed cell size of 5 mm and volume fractions of 6%, 8%, 10%,
12%, and 15% are shown in Fig. 7.9. The µ-CT 3D reconstructions show well-
defined struts and no apparent defects or broken cells throughout the structures
network, indicating the ability of SLM to fabricate Gyroid cellular structures with
a wide range of volume fractions as low as 6%.
By analyzing the µ-CT reconstruction models, the bounding volume of the
cellular structure and volume of solid struts can be determined to give the
experimental volume fraction. The designed and experimental volume fractions
are listed and compared in Table 2. The experimental volume fraction
calculated from µ-CT data are 6.51%, 8.75%, 10.66% and 13.12% which
correspond to the designed volume fraction of 6, 8, 10 and 12% respectively.
This shows a slight increase in experimental volume fractions in comparison
with the corresponding designed values. The discrepancy between the
theoretical and experimental volume fractions can be attributed to the non-
uniform little increase of the experimental strut size of the cellular structures.
(a) (b)
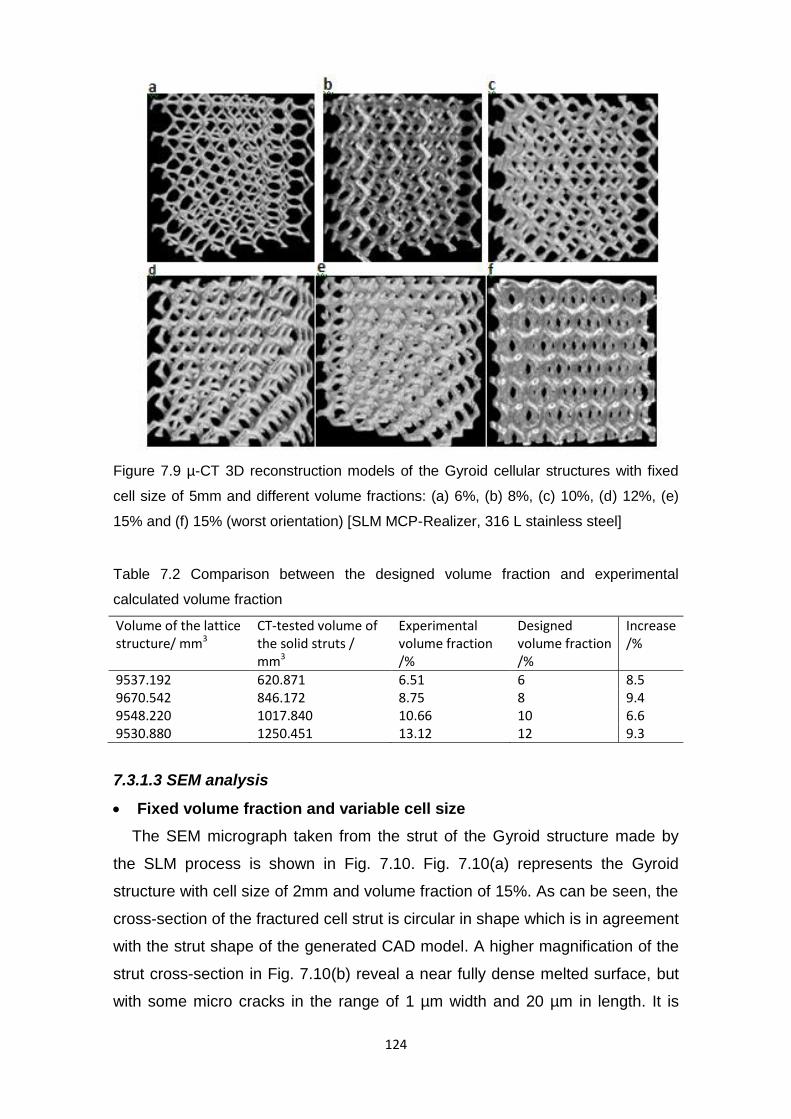
124
Figure 7.9 µ-CT 3D reconstruction models of the Gyroid cellular structures with fixed
cell size of 5mm and different volume fractions: (a) 6%, (b) 8%, (c) 10%, (d) 12%, (e)
15% and (f) 15% (worst orientation) [SLM MCP-Realizer, 316 L stainless steel]
Table 7.2 Comparison between the designed volume fraction and experimental
calculated volume fraction
Volume of the lattice structure/ mm3
CT-tested volume of the solid struts / mm3
Experimental volume fraction /%
Designed volume fraction /%
Increase /%
9537.192 620.871 6.51 6 8.5 9670.542 846.172 8.75 8 9.4 9548.220 1017.840 10.66 10 6.6 9530.880 1250.451 13.12 12 9.3
7.3.1.3 SEM analysis
Fixed volume fraction and variable cell size
The SEM micrograph taken from the strut of the Gyroid structure made by
the SLM process is shown in Fig. 7.10. Fig. 7.10(a) represents the Gyroid
structure with cell size of 2mm and volume fraction of 15%. As can be seen, the
cross-section of the fractured cell strut is circular in shape which is in agreement
with the strut shape of the generated CAD model. A higher magnification of the
strut cross-section in Fig. 7.10(b) reveal a near fully dense melted surface, but
with some micro cracks in the range of 1 µm width and 20 µm in length. It is

125
supposed that this type of cracks could exist in the part due to the high residual
stresses formed during SLM process. Furthermore, Fig. 7.10(c) shows partially
bonded tiny powder particles on the surfaces of the struts of the cellular
structure.
Figure 7.10 SEM micrographs of (a) the struts of the Gyroid cellular structure with cell
size of 2 mm and the volume fraction of 15%, (b) A magnified cross section of a strut
(c) Tiny particles bonded to the surfaces of the struts and (d) Magnified single tiny
particle on the surface of the strut [SLM MCP-Realizer, 316 L stainless steel].
Similar phenomenon has been observed in previous literature works of
Santorinaios et al. (2006) and McKown et al. (2008) on 316L stainless steel
structures manufactured in SLM. It was also reported in the work of Pattanayak
et al. (2011) of titanium porous structures. However, the reason for this
phenomenon has not been explained comprehensively. The author believes
that bonded particles are formed as a result of large melt pool instabilities and
heat affected zone created during laser scan of the strut. The high laser energy
introduced in the alternating scanning strategy is repeatedly concentrated in
small region of the strut to create the larger melt pool. The large melt-pool
instabilities lead to large heat affected zone and partial melting of surrounding

126
powder. Additionally, the surface tension and balling phenomenon of the melt
pool which is the result of short laser exposure time allows the absorption of
some surrounding loose powders. As a result, the partially melted particles
remain attached to the strut after solidification. The ‘balling’ which gives rise to
beads being formed mainly on laser melted surfaces perpendicular to the
building direction.
A higher magnification of the bonded particle is further illustrated in Fig.
7.10(d). The bonded particle has a nearly spherical shape with an approximate
size of 35µm and rough in surface. This particle morphology is similar to the one
found in raw 316L steel metal powders. The size of the bonded particle varies in
the strut and is a function of the powder particle sizes and distribution. This
further supports the argument that these bonded particles are caused by
partially melting of the surrounding raw stainless steel particles. These bonded
particles increase the surface roughness of struts of the cellular structure. To
improve the surface quality of the manufactured struts of the cellular structure,
the metal powders with smaller particle size should be used, and the post
processing operation of sand or bead blasting can be carefully carried out to
systematically remove the bonded particles while avoiding the destruction of the
thin struts. Pattanayak et al. (2011) used heat treatment at 1300 oC in an argon
gas atmosphere to make partially melted titanium particles fully fuse and bond
in the strut core, thus smoothing the surface. This is particularly necessary in
Titanium structures used for medical applications.
Fixed cell size and variable volume fraction
Fig. 7.11 shows the SEM images of the SLM-manufactured Gyroid cellular
structures with volume fractions of 6%, 8%, 10% and 12%. All these structures
have the same unit cell size of 5mm. It can be seen from the SEM images that
the SLM-manufactured cellular structures show circular struts and spherical
pores, which is in agreement with the CAD model, and no interlayer
delamination indicating metallurgical bonding between the layers during the
manufacturing process. It is also observed that the cellular structures exhibit
very rough surfaces with curvatures and corrugations. The roughness of strut is
further contributed by stepping-effect resulting from the curviness of the struts of
TPMS cellular structures. A higher SEM micrograph magnification of the strut in
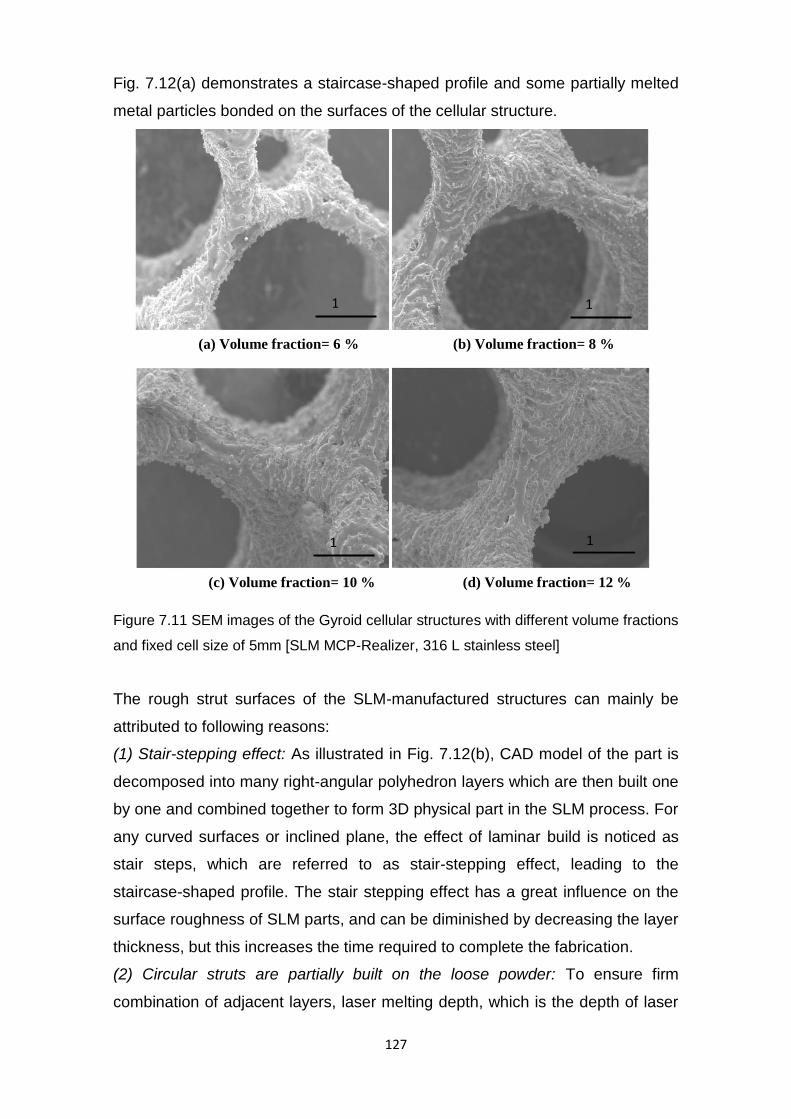
127
Fig. 7.12(a) demonstrates a staircase-shaped profile and some partially melted
metal particles bonded on the surfaces of the cellular structure.
Figure 7.11 SEM images of the Gyroid cellular structures with different volume fractions
and fixed cell size of 5mm [SLM MCP-Realizer, 316 L stainless steel]
The rough strut surfaces of the SLM-manufactured structures can mainly be
attributed to following reasons:
(1) Stair-stepping effect: As illustrated in Fig. 7.12(b), CAD model of the part is
decomposed into many right-angular polyhedron layers which are then built one
by one and combined together to form 3D physical part in the SLM process. For
any curved surfaces or inclined plane, the effect of laminar build is noticed as
stair steps, which are referred to as stair-stepping effect, leading to the
staircase-shaped profile. The stair stepping effect has a great influence on the
surface roughness of SLM parts, and can be diminished by decreasing the layer
thickness, but this increases the time required to complete the fabrication.
(2) Circular struts are partially built on the loose powder: To ensure firm
combination of adjacent layers, laser melting depth, which is the depth of laser
(a) Volume fraction= 6 %
1 1
(b) Volume fraction= 8 %
1
(c) Volume fraction= 10 %
1
(d) Volume fraction= 12 %
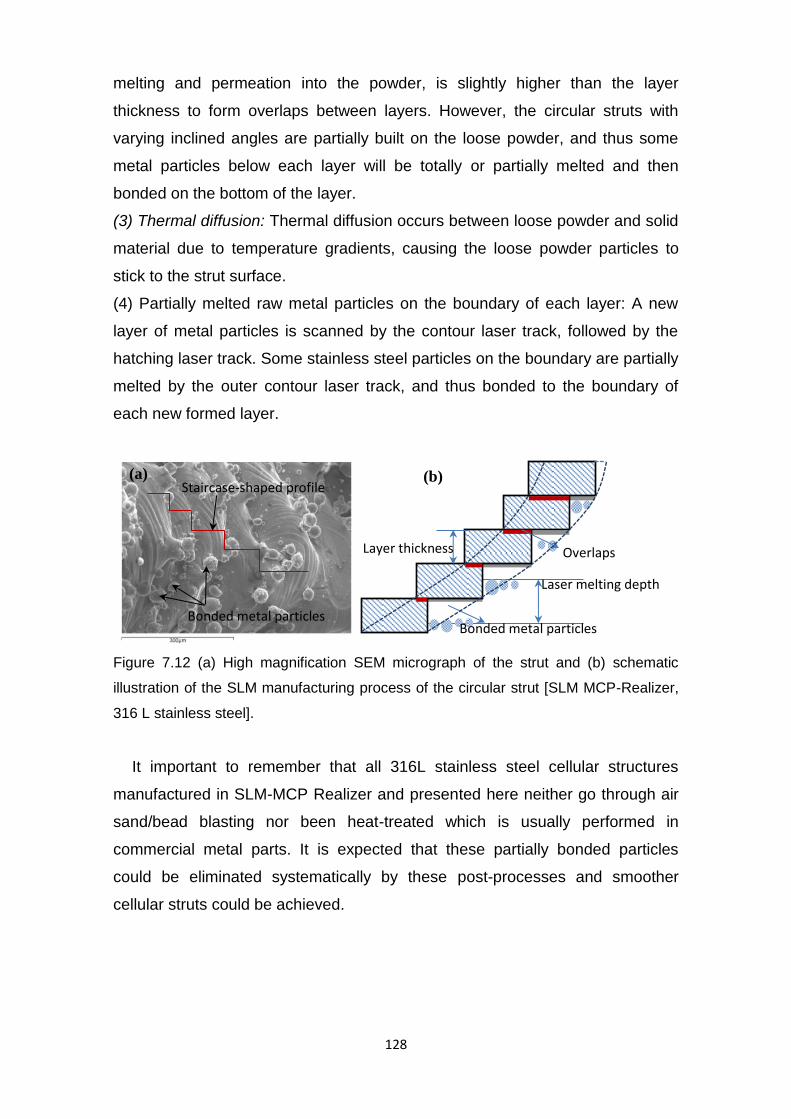
128
melting and permeation into the powder, is slightly higher than the layer
thickness to form overlaps between layers. However, the circular struts with
varying inclined angles are partially built on the loose powder, and thus some
metal particles below each layer will be totally or partially melted and then
bonded on the bottom of the layer.
(3) Thermal diffusion: Thermal diffusion occurs between loose powder and solid
material due to temperature gradients, causing the loose powder particles to
stick to the strut surface.
(4) Partially melted raw metal particles on the boundary of each layer: A new
layer of metal particles is scanned by the contour laser track, followed by the
hatching laser track. Some stainless steel particles on the boundary are partially
melted by the outer contour laser track, and thus bonded to the boundary of
each new formed layer.
Figure 7.12 (a) High magnification SEM micrograph of the strut and (b) schematic
illustration of the SLM manufacturing process of the circular strut [SLM MCP-Realizer,
316 L stainless steel].
It important to remember that all 316L stainless steel cellular structures
manufactured in SLM-MCP Realizer and presented here neither go through air
sand/bead blasting nor been heat-treated which is usually performed in
commercial metal parts. It is expected that these partially bonded particles
could be eliminated systematically by these post-processes and smoother
cellular struts could be achieved.
Staircase-shaped profile
Bonded metal particles
(a)
Layer thickness Overlaps
Laser melting depth
Bonded metal particles
(b)
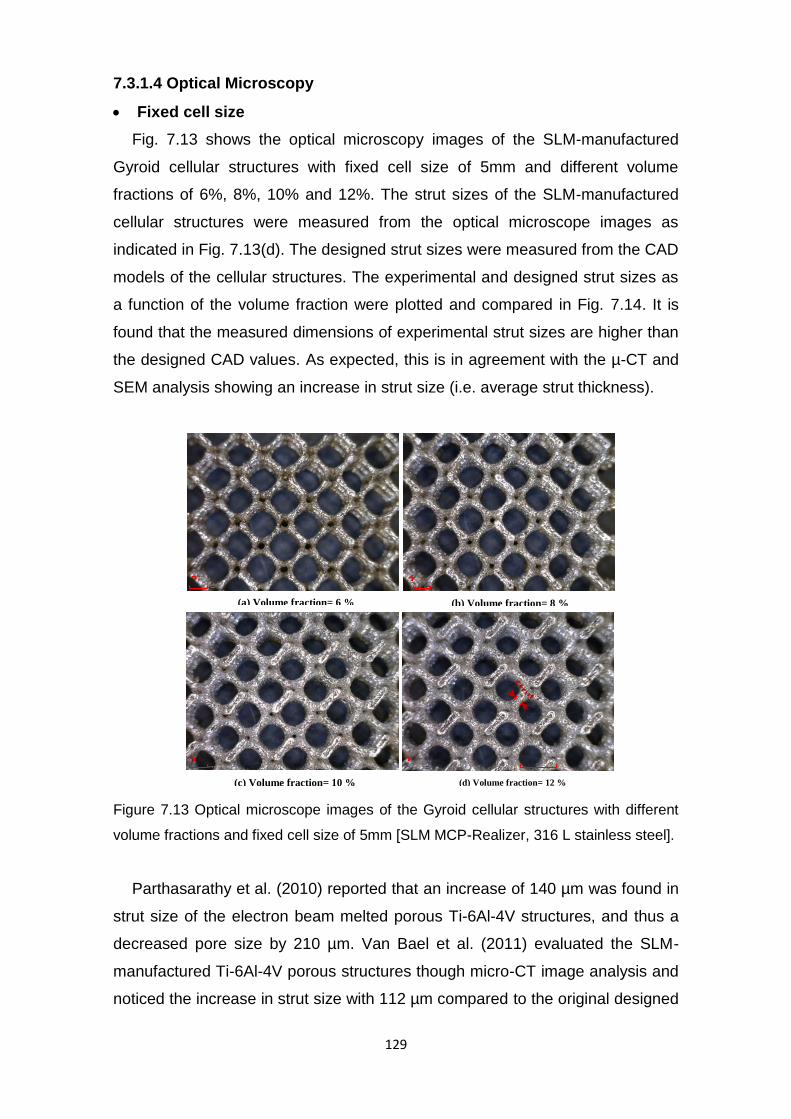
129
7.3.1.4 Optical Microscopy
Fixed cell size
Fig. 7.13 shows the optical microscopy images of the SLM-manufactured
Gyroid cellular structures with fixed cell size of 5mm and different volume
fractions of 6%, 8%, 10% and 12%. The strut sizes of the SLM-manufactured
cellular structures were measured from the optical microscope images as
indicated in Fig. 7.13(d). The designed strut sizes were measured from the CAD
models of the cellular structures. The experimental and designed strut sizes as
a function of the volume fraction were plotted and compared in Fig. 7.14. It is
found that the measured dimensions of experimental strut sizes are higher than
the designed CAD values. As expected, this is in agreement with the µ-CT and
SEM analysis showing an increase in strut size (i.e. average strut thickness).
Figure 7.13 Optical microscope images of the Gyroid cellular structures with different
volume fractions and fixed cell size of 5mm [SLM MCP-Realizer, 316 L stainless steel].
Parthasarathy et al. (2010) reported that an increase of 140 µm was found in
strut size of the electron beam melted porous Ti-6Al-4V structures, and thus a
decreased pore size by 210 µm. Van Bael et al. (2011) evaluated the SLM-
manufactured Ti-6Al-4V porous structures though micro-CT image analysis and
noticed the increase in strut size with 112 µm compared to the original designed
2
(a) Volume fraction= 6 %
2
(b) Volume fraction= 8 %
2
(c) Volume fraction= 10 %
2
(d) Volume fraction= 12 %
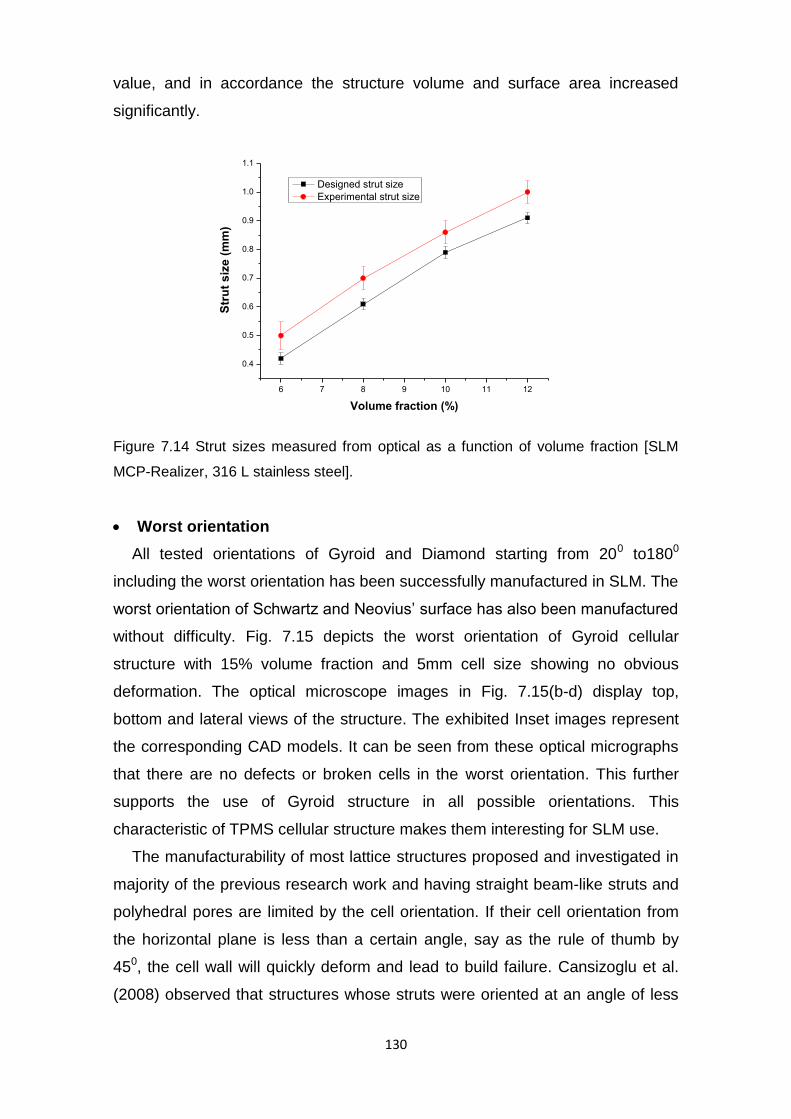
130
value, and in accordance the structure volume and surface area increased
significantly.
Figure 7.14 Strut sizes measured from optical as a function of volume fraction [SLM
MCP-Realizer, 316 L stainless steel].
Worst orientation
All tested orientations of Gyroid and Diamond starting from 200 to1800
including the worst orientation has been successfully manufactured in SLM. The
worst orientation of Schwartz and Neovius’ surface has also been manufactured
without difficulty. Fig. 7.15 depicts the worst orientation of Gyroid cellular
structure with 15% volume fraction and 5mm cell size showing no obvious
deformation. The optical microscope images in Fig. 7.15(b-d) display top,
bottom and lateral views of the structure. The exhibited Inset images represent
the corresponding CAD models. It can be seen from these optical micrographs
that there are no defects or broken cells in the worst orientation. This further
supports the use of Gyroid structure in all possible orientations. This
characteristic of TPMS cellular structure makes them interesting for SLM use.
The manufacturability of most lattice structures proposed and investigated in
majority of the previous research work and having straight beam-like struts and
polyhedral pores are limited by the cell orientation. If their cell orientation from
the horizontal plane is less than a certain angle, say as the rule of thumb by
450, the cell wall will quickly deform and lead to build failure. Cansizoglu et al.
(2008) observed that structures whose struts were oriented at an angle of less
6 7 8 9 10 11 12
0.4
0.5
0.6
0.7
0.8
0.9
1.0
1.1
Str
ut
siz
e (
mm
)
Volume fraction (%)
Designed strut size
Experimental strut size

131
than 20o with respect to the build plane had little or no overlap between the
successive melted layers resulting very week structures.
Figure 7.15 (a) optical microscope images of gyroid cellular structure worst orientation
(volume fraction=15% and cell size=5mm) (b) top (c) bottom and (d) side view. Insets
in (b- d) exhibit the corresponding CAD model of the worst orientation respectively
[SLM MCP-Realizer, 316 L stainless steel].
7.3.2 AlSi10Mg cellular structures
7.3.2.1 µ-CT Analysis
The Gyroid and Diamond cellular structures with the volume fractions of 5%,
7.5%, 10%, 12.5% and 15%, and unit cell sizes of 3mm, 3.5mm, 4mm, 4.5mm,
5mm, 5.5mm, 6mm, 6.5mm and 7mm were produced in DMLS M280 machine
using AlSi10Mg metal powder. Fig. 7.16 shows the manufactured Diamond
structures with different cell sizes. The µ-CT cross-sectional images and 3D
reconstruction models established from the Diamond cellular structure are
shown in Figs. (7.17 - 7.18). In general, the analysis of these reconstructions
indicate no defects or broken cells within the cellular structures, demonstrating
the ability of DMLS machine to manufacture lightweight AlSi10Mg cellular
structures with a wide range of the volume fraction and cell size. This is with the
exception of cells of the Diamond structure with low volume fraction of 5%
(a)
(d
)
2mm
(c)
2mm
(b
)
2mm
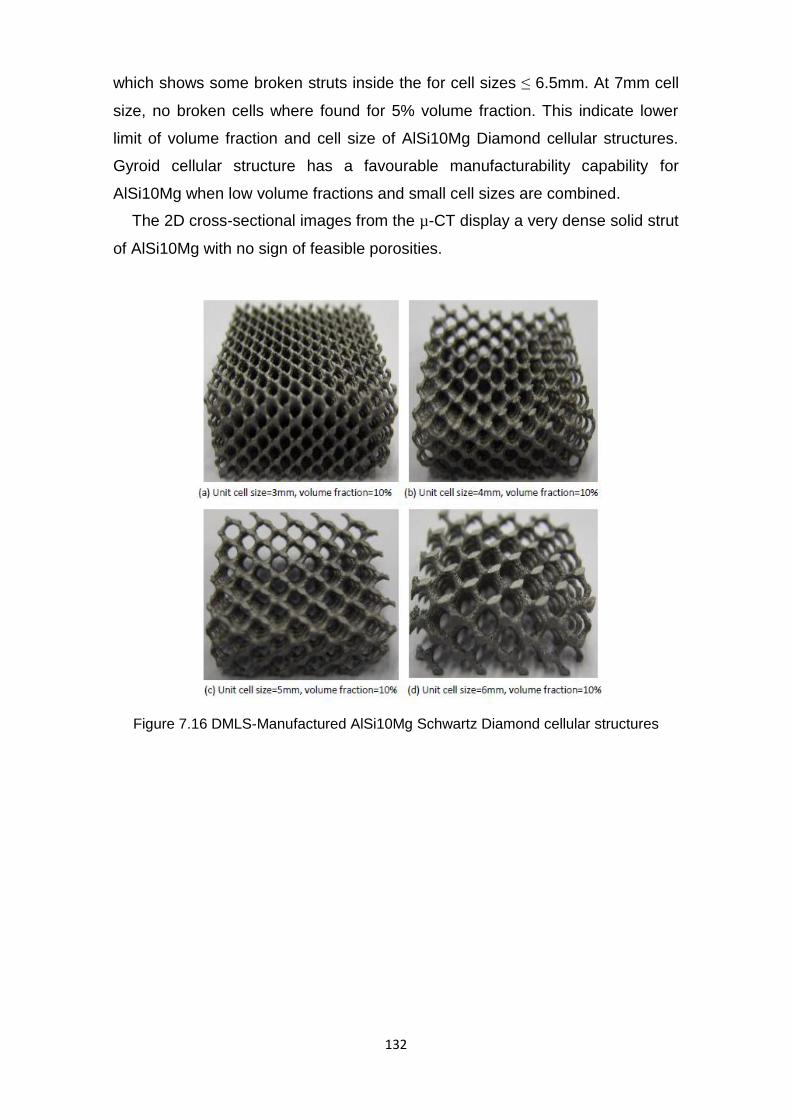
132
which shows some broken struts inside the for cell sizes ≤ 6.5mm. At 7mm cell
size, no broken cells where found for 5% volume fraction. This indicate lower
limit of volume fraction and cell size of AlSi10Mg Diamond cellular structures.
Gyroid cellular structure has a favourable manufacturability capability for
AlSi10Mg when low volume fractions and small cell sizes are combined.
The 2D cross-sectional images from the µ-CT display a very dense solid strut
of AlSi10Mg with no sign of feasible porosities.
Figure 7.16 DMLS-Manufactured AlSi10Mg Schwartz Diamond cellular structures

133
Figure 7.17 µ-CT reconstruction models and cross section images of diamond cellular
structures at different unit cell sizes [DMLS M280, AlSi10Mg]
Figure 7.18 µ-CT reconstruction models and cross section images of diamond cellular
structures at different volume fractions [DMLS M280, AlSi10Mg].
7.3.2.2 SEM analysis
The SEM images taken from DMLS-manufactured Diamond struts are shown
in Fig. 7.19. This image is based on cellular structure specimen that was not
heat treated or bead blasted. This was done deliberately to compare with other
bead-blasted and heat-treated parts. Bonded particles can be seen on the
Volume fraction=15%; Cell size=6mm
Volume fraction=15%; Cell size=6.5mm Volume fraction=15%; Cell size=7mm
Volume fraction=15%; Cell size=5.5mm
Volume fraction=15%; Cell size=5mm
Volume fraction=5%; Cell size=5mm Volume fraction=10%; Cell size=5mm
Volume fraction=12.5%; Cell size=5mm
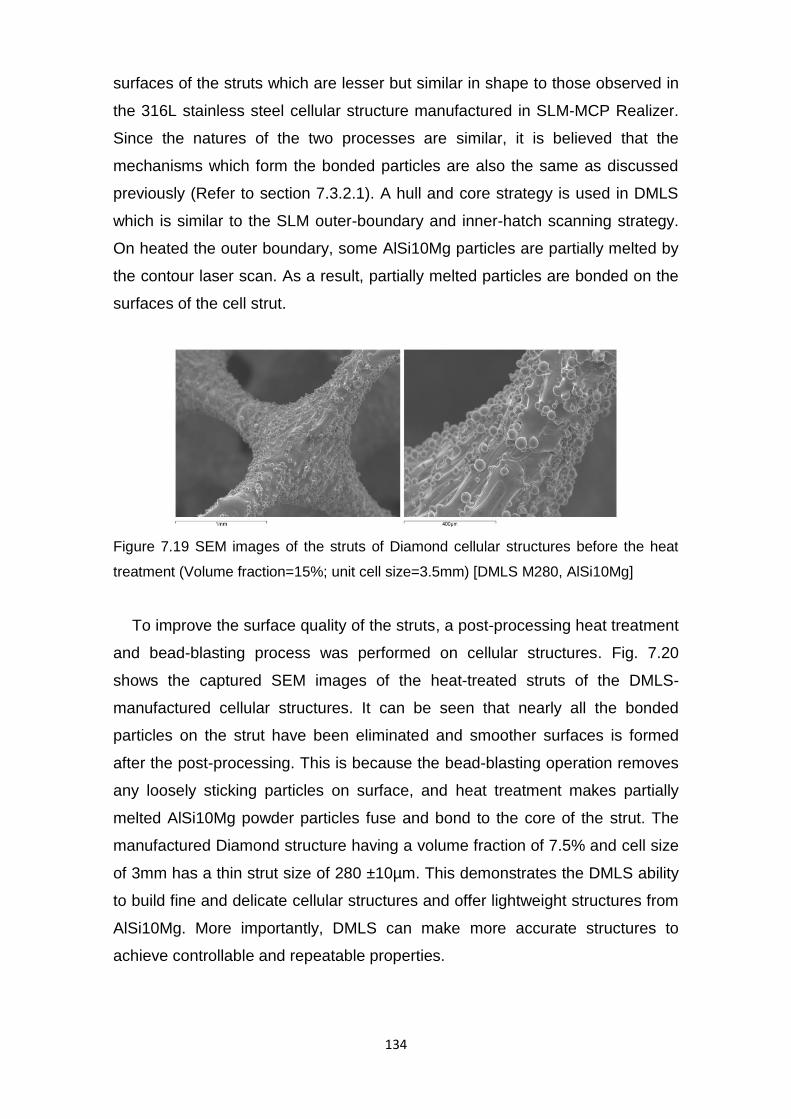
134
surfaces of the struts which are lesser but similar in shape to those observed in
the 316L stainless steel cellular structure manufactured in SLM-MCP Realizer.
Since the natures of the two processes are similar, it is believed that the
mechanisms which form the bonded particles are also the same as discussed
previously (Refer to section 7.3.2.1). A hull and core strategy is used in DMLS
which is similar to the SLM outer-boundary and inner-hatch scanning strategy.
On heated the outer boundary, some AlSi10Mg particles are partially melted by
the contour laser scan. As a result, partially melted particles are bonded on the
surfaces of the cell strut.
Figure 7.19 SEM images of the struts of Diamond cellular structures before the heat
treatment (Volume fraction=15%; unit cell size=3.5mm) [DMLS M280, AlSi10Mg]
To improve the surface quality of the struts, a post-processing heat treatment
and bead-blasting process was performed on cellular structures. Fig. 7.20
shows the captured SEM images of the heat-treated struts of the DMLS-
manufactured cellular structures. It can be seen that nearly all the bonded
particles on the strut have been eliminated and smoother surfaces is formed
after the post-processing. This is because the bead-blasting operation removes
any loosely sticking particles on surface, and heat treatment makes partially
melted AlSi10Mg powder particles fuse and bond to the core of the strut. The
manufactured Diamond structure having a volume fraction of 7.5% and cell size
of 3mm has a thin strut size of 280 ±10µm. This demonstrates the DMLS ability
to build fine and delicate cellular structures and offer lightweight structures from
AlSi10Mg. More importantly, DMLS can make more accurate structures to
achieve controllable and repeatable properties.

135
Figure 7.20 SEM images of the struts of Diamond cellular structures after it has been
bead-blasted and heat treated (Volume fraction=7.5%; unit cell size=3mm) [DMLS
M280, AlSi10Mg]
7.3.2.3 Optical Microscopy
Fig. 7.21 shows the optical microscope images captured from the DMLS-
manufactured AlSi10Mg Diamond structures having a fixed volume fraction of
10% and cell sizes ranging from 3.5-6.5mm. The measured dimensions of the
cellular structures are compared with the nominal CAD dimension as depicted
in Figs.( 7.22 and 7.23)
Figure 7.21 Optical microscope images of the DMLS-manufactured cellular structures
with volume fraction = 10% and different cell sizes [DMLS M280, AlSi10Mg]
1.0m
(c) Cell size=5.5mm; volume fraction=10%
1.0mm
(d) Cell size=6.5mm; volume fraction=10%
(b) Cell size=4.5mm; volume fraction=10%
1.0m
(a) Cell size=3.5mm; volume fraction=10%
1.0m
Pore size

136
Fig. 7.22 reveals that the experimental strut sizes are higher than the CAD
values while experimental pore sizes are lower compared with the CAD pore
sizes. The increase in the strut size and decrease in the pore size compared
with the CAD values can be attributed to the bonded and partially melted metal
particles on the strut surfaces. The bead blasting helps remove the particles
which are not strongly bonded to the strut surface, while the heat treatment
makes the remains of the bonded particles to fuse and bond to the strut,
leading to an increase of strut sizes and decrease in the pore size. The strut
and pore sizes both increase with increasing the cell size for a fixed volume
fraction. The opposite is true when the cell size is decreased. As shown in Fig.
7.23, the strut size increases and the pore size decreases when increasing the
volume fraction at a fixed cell size
Figure 7.22 Strut and pore sizes measured from optical microscope image
(experimental) and CAD models (designed) in function of the unit cell size. The volume
fraction is set as a constant of 10% [DMLS M280, AlSi10Mg].
3.5 4.0 4.5 5.0 5.5 6.0 6.5
0.2
0.4
0.6
0.8
1.0
1.2
1.4
1.6
Str
ut
/ P
ore
siz
e (
mm
)
Cell size (mm)
Experimental strut size
Designed strut size
Experimental pore size
Designed pore size
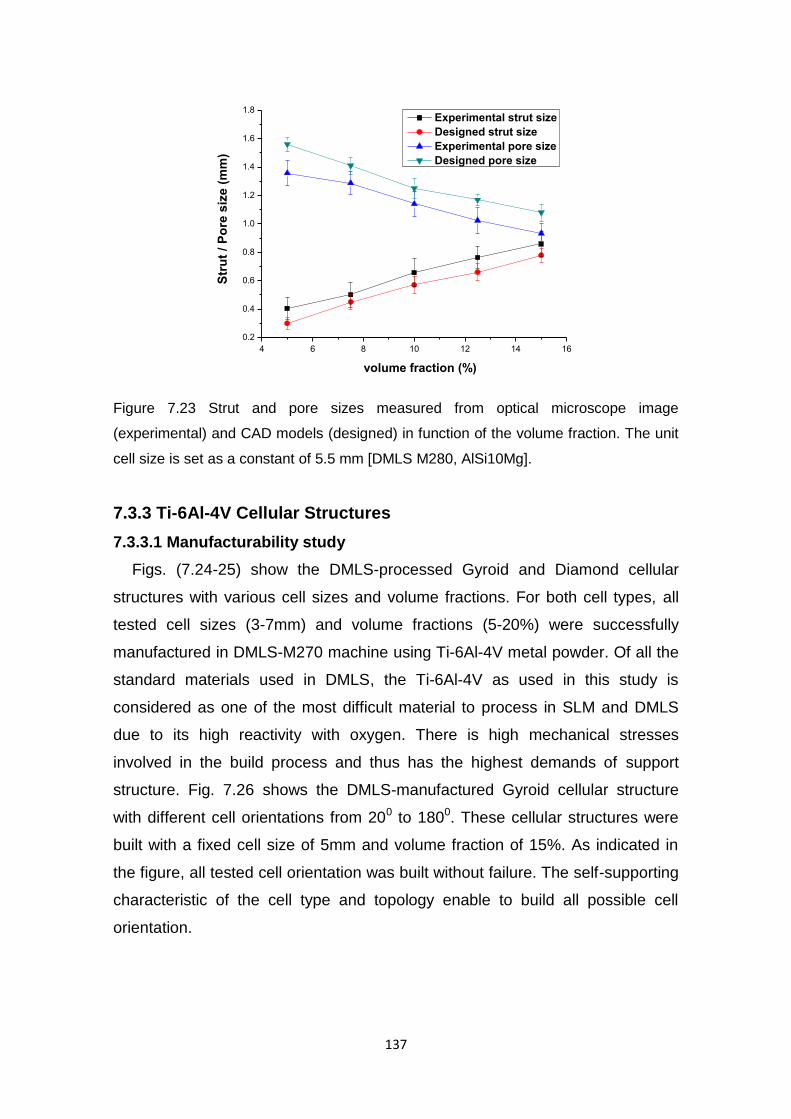
137
Figure 7.23 Strut and pore sizes measured from optical microscope image
(experimental) and CAD models (designed) in function of the volume fraction. The unit
cell size is set as a constant of 5.5 mm [DMLS M280, AlSi10Mg].
7.3.3 Ti-6Al-4V Cellular Structures
7.3.3.1 Manufacturability study
Figs. (7.24-25) show the DMLS-processed Gyroid and Diamond cellular
structures with various cell sizes and volume fractions. For both cell types, all
tested cell sizes (3-7mm) and volume fractions (5-20%) were successfully
manufactured in DMLS-M270 machine using Ti-6Al-4V metal powder. Of all the
standard materials used in DMLS, the Ti-6Al-4V as used in this study is
considered as one of the most difficult material to process in SLM and DMLS
due to its high reactivity with oxygen. There is high mechanical stresses
involved in the build process and thus has the highest demands of support
structure. Fig. 7.26 shows the DMLS-manufactured Gyroid cellular structure
with different cell orientations from 200 to 1800. These cellular structures were
built with a fixed cell size of 5mm and volume fraction of 15%. As indicated in
the figure, all tested cell orientation was built without failure. The self-supporting
characteristic of the cell type and topology enable to build all possible cell
orientation.
4 6 8 10 12 14 16
0.2
0.4
0.6
0.8
1.0
1.2
1.4
1.6
1.8
Str
ut
/ P
ore
siz
e (
mm
)
volume fraction (%)
Experimental strut size
Designed strut size
Experimental pore size
Designed pore size

138
Figure 7.24 Manufactured Gyroid cellular structures with various cell sizes and volume
fractions [DMLS M270, Ti-6Al-4V]
Figure 7.25 Manufactured Diamond cellular structures with various cell sizes and
volume fractions [DMLS M270, Ti-6Al-4V]
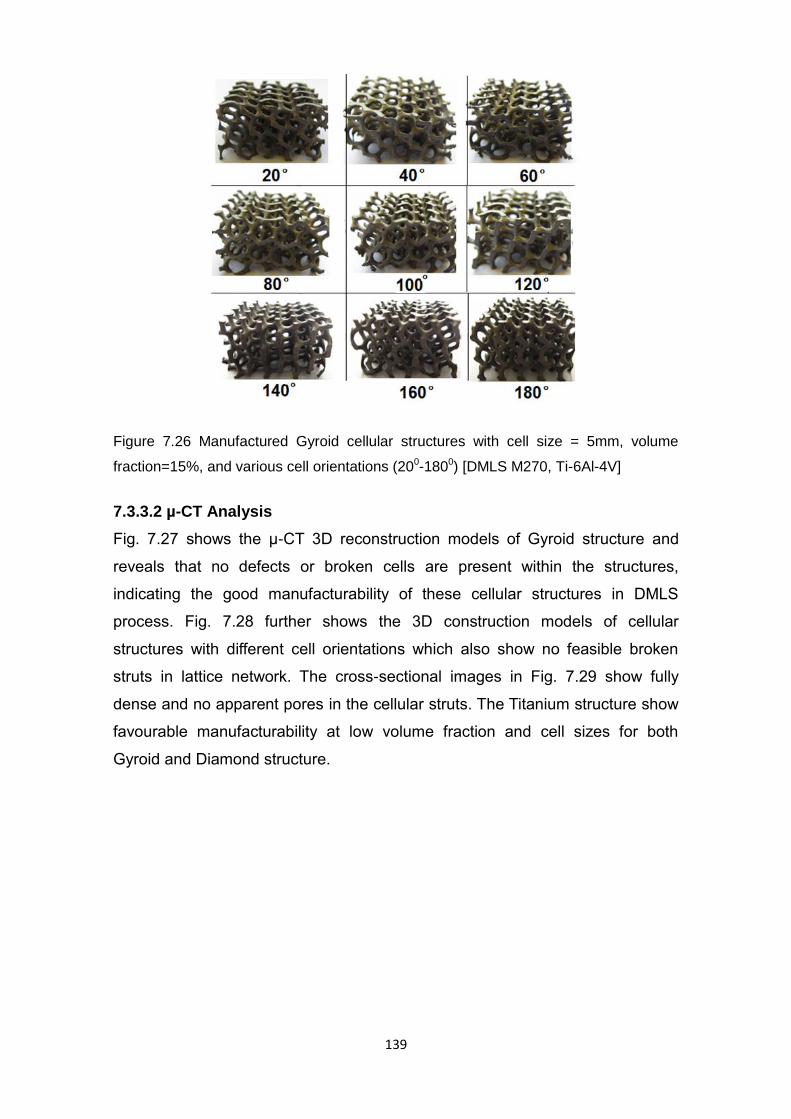
139
Figure 7.26 Manufactured Gyroid cellular structures with cell size = 5mm, volume
fraction=15%, and various cell orientations (200-1800) [DMLS M270, Ti-6Al-4V]
7.3.3.2 µ-CT Analysis
Fig. 7.27 shows the µ-CT 3D reconstruction models of Gyroid structure and
reveals that no defects or broken cells are present within the structures,
indicating the good manufacturability of these cellular structures in DMLS
process. Fig. 7.28 further shows the 3D construction models of cellular
structures with different cell orientations which also show no feasible broken
struts in lattice network. The cross-sectional images in Fig. 7.29 show fully
dense and no apparent pores in the cellular struts. The Titanium structure show
favourable manufacturability at low volume fraction and cell sizes for both
Gyroid and Diamond structure.
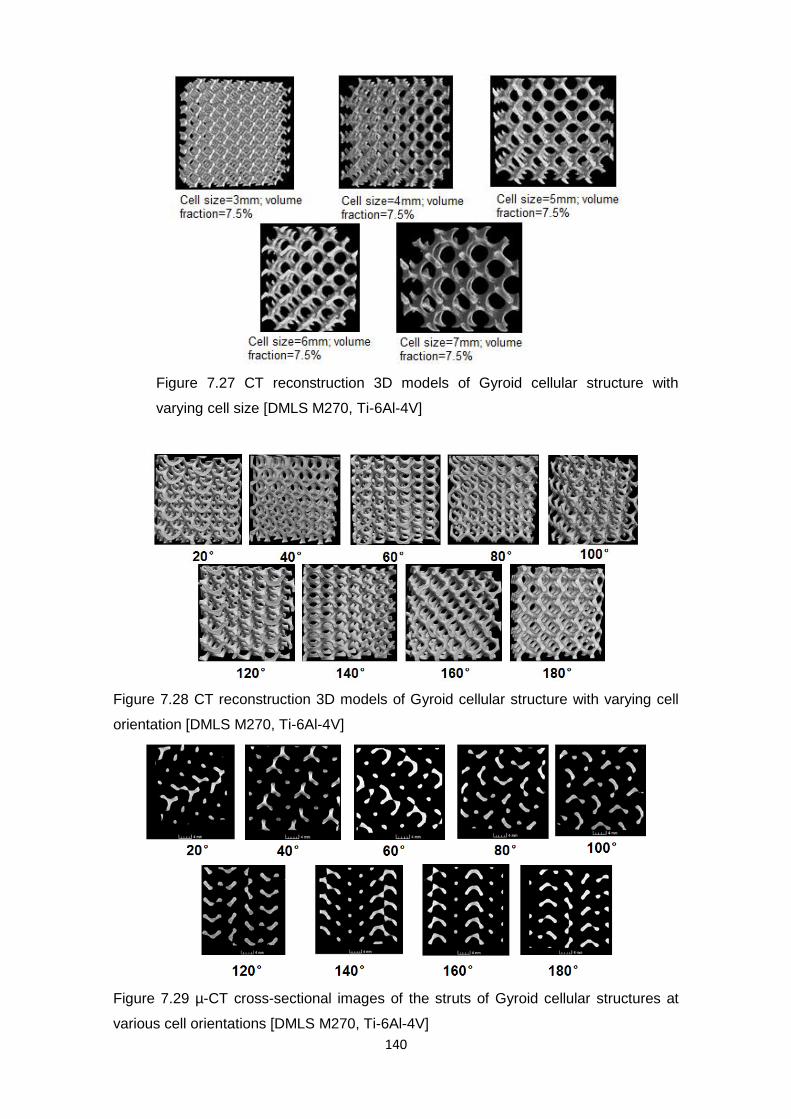
140
Figure 7.27 CT reconstruction 3D models of Gyroid cellular structure with
varying cell size [DMLS M270, Ti-6Al-4V]
Figure 7.28 CT reconstruction 3D models of Gyroid cellular structure with varying cell
orientation [DMLS M270, Ti-6Al-4V]
Figure 7.29 µ-CT cross-sectional images of the struts of Gyroid cellular structures at
various cell orientations [DMLS M270, Ti-6Al-4V]
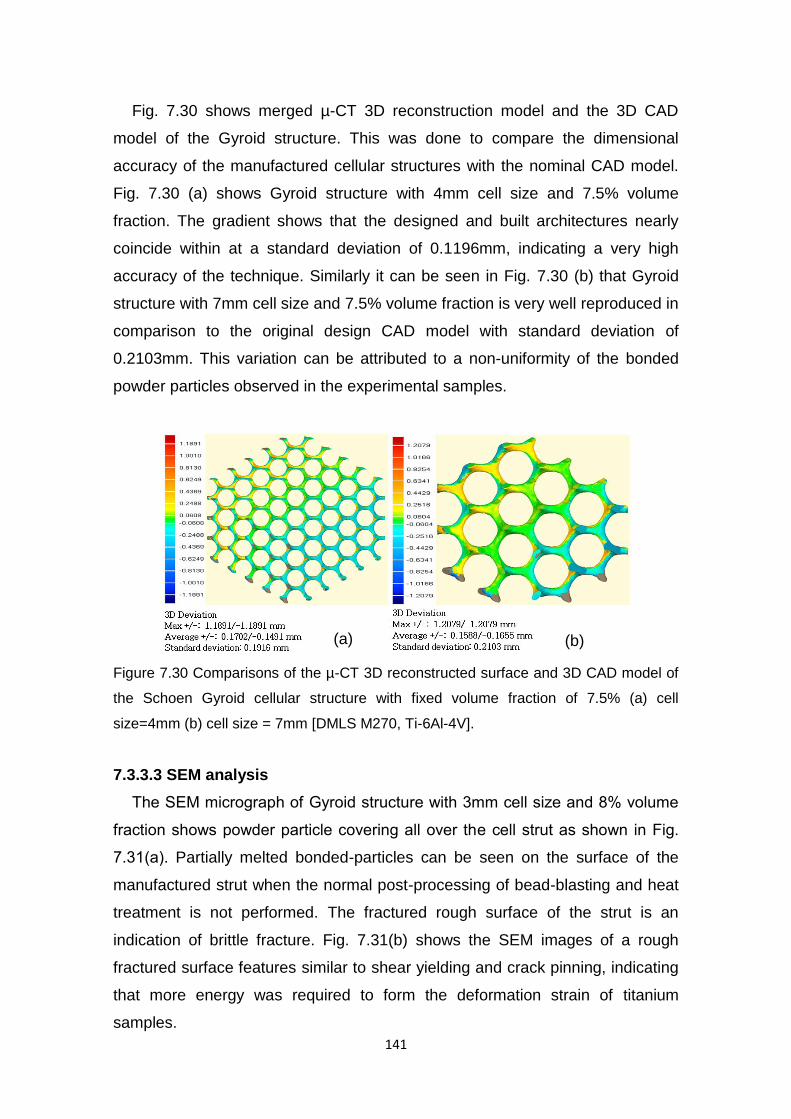
141
Fig. 7.30 shows merged µ-CT 3D reconstruction model and the 3D CAD
model of the Gyroid structure. This was done to compare the dimensional
accuracy of the manufactured cellular structures with the nominal CAD model.
Fig. 7.30 (a) shows Gyroid structure with 4mm cell size and 7.5% volume
fraction. The gradient shows that the designed and built architectures nearly
coincide within at a standard deviation of 0.1196mm, indicating a very high
accuracy of the technique. Similarly it can be seen in Fig. 7.30 (b) that Gyroid
structure with 7mm cell size and 7.5% volume fraction is very well reproduced in
comparison to the original design CAD model with standard deviation of
0.2103mm. This variation can be attributed to a non-uniformity of the bonded
powder particles observed in the experimental samples.
Figure 7.30 Comparisons of the µ-CT 3D reconstructed surface and 3D CAD model of
the Schoen Gyroid cellular structure with fixed volume fraction of 7.5% (a) cell
size=4mm (b) cell size = 7mm [DMLS M270, Ti-6Al-4V].
7.3.3.3 SEM analysis
The SEM micrograph of Gyroid structure with 3mm cell size and 8% volume
fraction shows powder particle covering all over the cell strut as shown in Fig.
7.31(a). Partially melted bonded-particles can be seen on the surface of the
manufactured strut when the normal post-processing of bead-blasting and heat
treatment is not performed. The fractured rough surface of the strut is an
indication of brittle fracture. Fig. 7.31(b) shows the SEM images of a rough
fractured surface features similar to shear yielding and crack pinning, indicating
that more energy was required to form the deformation strain of titanium
samples.
(a) (b)

142
Figure 7.31(a) SEM micrographs of cellular strut without post-processing, (b) Strut and
fractured surfaces of Gyroid with post-processing [cell size =3mm, volume fraction =8%
- DMLS M270, Ti-6Al-4V].
7.4 Conclusion
This chapter has presented a comprehensive manufacturability study of
advanced TPMS cellular structures using SLM and DMLS processes. The
cellular structures were produced from three most commonly used metal AM
powders being 316L stainless steel, Titanium alloy (Ti-6Al-4V), and Aluminium
alloy (AlSi10Mg). Cell sizes ranging from 2-9mm, orientation angles from 200
to1800, and volume fractions from 5-20% were investigated. The manufactured
cellular structures were characterized by visual observations, µ-CT (porosity
and defects, by 2D and 3D reconstruction models), SEM (size, morphology),
and Optical Microscopy (size). The following conclusions can be made from
these investigations,
Gyroid and Diamond cellular structures made from 316L stainless steel with
cell sizes ranging from 2–9 mm and volume fractions from 6-15% were
manufactured in SLM. Samples show good manufacturability except for 9
mm cell size which exhibit some deformed horizontal struts perpendicular to
the build direction. The deformation in the form of sagging was observed
specially in Gyroid cell structure. However, by increase on volume fraction
above 15% would attain un-sagged larger cell sizes >9mm. There was no
problem of removing the loose powder from the 2mm cell sizes which is
trapped inside the cellular structures.
The AlSi10Mg Diamond structures manufactured in DMLS with low volume
fraction of 5% and with cell sizes ≤ 6.5mm reveal some broken struts inside
(a) (b)

143
the cellular structure. However, as the cell size was increased to 7mm, no
broken cells were found in the structure. This indicates the lower limit of
volume fraction and cell size for AlSi10Mg Diamond cellular structures.
Gyroid cellular structure has better manufacturability compared to Diamond
for AlSi10Mg when low volume fractions less than 6% are combined with
small cell sizes less than 7mm.
The Ti-6Al-4V Gyroid and Diamond cellular structures were produced in
DMLS. Cell size as small as 3mm and volume fraction as low as 5% have
shown good manufacturability characteristics.
All tested cell orientation including the worst orientation (i.e. cell orientation
that forms the maximum unsupported overhanging of the strut) was
manufactured in both SLM and DMLS processes.
The Schwartz W and Neovius surface also prove to be manufacturable at
large cell sizes and volume fractions. The large node of Schwartz W is
associated with more material to be melted by the laser beam which could
cause unstable melt pool and temperature-stress gradients. Some of the
edges of the Neovius structure were curled and fractured surfaces could be
seen on manufactured cell struts.
The 2D cross-sectional images of the µ-CT for AlSi10Mg and Ti-6Al-4V
display very dense solid struts in all cell sizes and volume fractions with no
sign of feasible porosity. However, tiny micro-porosities were obtained in
316L stainless steel structures in particular for large cell sizes. Better wetting
conditions and proper bonding between layers exist in small cell sizes that
permit denser struts of the cellular structures. Unlike DMLS M270, which use
optimized parameters for different materials, the parameter for SLM MCP
Realizer were not optimal and it was difficult to control the oxygen content in
build chamber. The layer thickness used in stainless steel structures was
also higher. These factors are believed to contribute to the low densities
found in stainless steel parts.
The 3D reconstruction models captured from the µ-CT indicates no obvious
defects or missing/broken cells within the structure, confirming the ability of
SLM to manufacture the Gyroid and Diamond cellular structures, and over
the whole range of cell sizes tested. The µ-CT was particularly helpful in
providing more details on small cell sizes where defects of the interior cells
could not be detected by visual observation only. The comparison of the 3D
144
reconstructed data and original CAD models generally shows good
dimensional accuracy of SLM/DMLS manufactured cellular structures.
The SEM micrograph of the manufactured cellular structure of cell struts
shows bonded powder particles caused by partially melted surrounding
loose powders. The attached loose powders are the result of stair-stepping
effect and outer contour scanning of the laser beam. This increases the
surface roughness of the cell struts forming the structure. Much
improvement of the strut surface roughness was obtained for cellular
structures processed in DMLS that were bead-blasted and heat treated.
Optical microcopy measurements shows small increase in strut sizes in all
experimental parts, irrespective of, the cell type, size, volume fraction,
material, and the process involved. Increases thickness of strut and
shrinking pore size is the result of the bonded powder particles. This is also
from increased melt-pool due to the high laser energy concentrated in small
cell strut cross-sections.
These organic cellular structures with controlled cell sizes and densities
which are very difficult or impossible to be manufactured by means from light
metallic alloys such Ti-6Al-4V and AlSi10Mg are now proved to be
manufacturable in SLM and DMLS processes. The good manufacturability of
Gyroid and Diamond cell types in SLM/DMLS can be attributed to the curved
struts and spherical pore forming the unit cell. The inclination angle of the
circular strut continuously varies along the spherical pore, which makes
layers grow up gradually with slight changes in area and position between
two subsequent layers during the SLM/DMLS process. In this way, the next
layer is well supported by previously solidified layer. That means that these
TPMS cellular structures have a self-supported unique characteristic in a
wider range of cell sizes, volume fractions, and cell orientation which makes
them suitable for SLM and DMLS processes.
Possible improvements on the manufacturability, density, and dimensional
accuracy of the cellular structures could be achieved by using specialized
processing parameters and scanning strategy suitable for these structures.
The current methods used in the experiments were designed for large cross-
sectional geometries and generates large melt-pool in tiny cross-sectional of
cell struts. By optimization of the laser power, speed, and scanning pattern,
the energy input in these structures could be reduced. This will result more
145
accurate and denser structures. Well controlled powder particle distribution
is also needed, and a proper post-processing steps such as sand/air/bead
blasting and heat treatment of structures to improve the surface quality.
This verification should allow the use of advanced TPMS cellular structures
in wider applications. For example, Titanium alloy which is currently
processed in metal AM for aerospace components for its high strength to
weight ratio can be made from these functional lightweight structures while
also reducing the processing cost and energy consumption. Cellular
structure made from Ti-6Al-4V is also getting a considerable interest in for
implants in medical industry for its biocompatibility. T. Traini et al (2008)
reported that the direct metal laser sintering technique can efficiently build
porous titanium dental implants. He highlighted that DMLS proved to be an
efficient means of construction of dental implants with functionally graded
material. This is particularly important as Titanium alloy is one of the most
difficult materials to process in conventional manufacturing techniques.
Besides its lightweight, AlSi10Mg has a good thermal property suitable in
heat transfer applications such heat exchangers, while stainless steel can be
used in applications where moderate strength is needed such as structural
sandwiches. Matthew Wong et al (2007) fabricated the heat sink devices
from Aluminium 6061 via SLM which evidently proved to be more feasible
and efficient. Cellular structures made from these materials can also play
important role in promoting the use of metal AM in much larger sale.

146
Chapter 8 Evaluation of the Mechanical Behaviour
of TPMS Cellular Structures
8.1 Introduction
Metallic cellular structures are used in many structural applications due to
their lightweight and high energy absorption capability. If such materials are to
be used efficiently, a detailed understanding of their mechanical behaviour is
very important. In the design development, it is of highest importance to choose
the proper shape, size, orientation, and volume fraction of cellular structures to
fulfil specific functional requirements. This is based on studying the stress-strain
behaviour of different cell shapes, sizes, and volume fractions that can be
extracted from experimental test curves or predicted by means of mathematical
models. The compressive properties, such as the elastic modulus and plastic
collapse stress of the cellular materials are important parameters for the
mechanical design of components.
It could be very onerous to experimentally characterise and identify the
mechanical behaviour of different shapes of cellular structures with wide range
of cell sizes, volume fractions, and cell orientations. A unified mathematical
model which can predict the properties of a large set of cell sizes and volume
fractions for a given material and identified with less experimental testing could
be very helpful to direct the selection of cellular structures for specific
application. A number of micromechanical models have been developed over
the years to describe the mechanical behaviour of cellular solids; however, the
model developed by Gibson and Ashby (1997) is the most commonly used and
appears to predict their behaviour with reasonable accuracy.
This chapter investigates the compressive properties of TPMS cellular
structures (Schoen Gyroid and Schwartz Diamond) manufactured in SLM MCP-
Realizer and DMLS M270/280 machines. Chapter 7 provides detailed
explanations on the manufacturability of these cellular structures. These
structures were manufactured from 316L stainless steel, AlSi10Mg, and Ti-6Al-
4V metallic powders. Rigorous mechanical testing was performed to enhance
the understanding of the behaviour of these cellular structures under uniaxial
compression testing. The effect of cell size, volume fraction, and cell orientation
on compressive elastic modulus and yield strength were examined. The

147
experimental results were compared with the analytical model developed by
Gibson and Ashby. This was done to determine and improve the accuracy of
the model for future predictions using experimental data.
8.2 Gibson-Ashby (GA) Model
For design purposes, a unified prediction model of a larger set of cellular
structures and materials with less experimental testing could be very beneficial.
A unique model for cellular solids made of the same constitutive material and
for a wide range of cell size and volume fractions could be used to direct the
choice of the optimal cellular structure density for defined impact energy
absorption. The approach in these various analyses is usually to identify a unit
cell and assume a deformation mode leading to failure. The Gibson and Ashby
model is based on a cubic unit cell (see Fig. 8.1) where the deformation is
controlled by the bending of the individual struts within the unit cell. This feature
of the GA model is useful when few experimental data on the density effect are
available which can be used to improve the model accuracy. The cell shapes in
Gyroid and Diamond cellular structure are, of course, more complex than that
shown in Fig. 8.1. But if they deform and fail by the same mechanisms, their
properties can be understood using dimensional arguments which omit all
constants arising from the specific cell geometry.
Figure 8.1 A cubic model for an open-cell foam showing the edge length, l, and edge
thickness, t (Gibson and Ashby, 1997).
GA model uses a simple dimensional approach to describe the mechanical
behaviour in terms of the strut dimensions which are also related to the relative

148
density. Because many applications of cellular structures result in compressive
loading, Gibson and Ashby formulate expressions for the mechanical properties
of cellular foams or honeycomb structures based on the compressive
behaviour. The relative density (This is equivalent to the volume fraction) of the
cell, ⁄ , and the second moment of area of cell strut, I, can be related to
the dimensions t and l by,
⁄ ( ⁄ )
(8.1)
(8.2)
where t is the thickness of a strut of square cross section and l is the length.
The strut length is directly proportional to the cell size and therefore l is
sometimes used to represent the cell size. and are densities of the
cellular structure and bulk material respectively.
The elastic modulus is calculated from the linear elastic deflection of a strut
of length, l, loaded at its midpoint by a load F. Standard beam theory
(Timoshenko and Goodier, 1970), gives the deflection as,
⁄ (8.3)
where Es is the elastic modulus for the material of the cell strut. The force F, is
related to compressive stress by,
(8.4)
while the global strain is proportional to the displacement as,
⁄ (8.5)
These relationships are then combined using Hooke’s law of elasticity to
determine expression for the elastic modulus,
(8.6)
or,
(8.7)
In general form,
⁄ (
⁄ ) (8.8)
149
The plastic-collapse strength of the cellular structure can be determined as,
⁄ (
⁄ ) (8.9)
where are the elastic modulus of a bulk solid material and cellular
structure respectively; are the yield strength of a bulk solid
material and plastic yield strength of cellular structure respectively, and C,1,2 are
constants of proportionality which is characteristic of the cell geometry. Data by
Gibson and Ashby show that showed that . The density
exponents give reasonable agreement for many types of cellular foams.
Equations (8.8) and (8.9) suggest that compressive properties mainly depend
on relative density of the structure.
8.3 Uniaxial compression test
Static uniaxial compression tests have been performed on two types of
TPMS cellular structure with different cell sizes, volume fractions (relative
density), and cell orientations. The Schoen Gyroid and Schwartz Diamond
cellular structures were selected for the uniaxial compression test. These
cellular structures have a relative density ranging from 5 to 15%, cell size from 2
to 8mm, and an orientation from 20 to 180 degree. The experimental
procedures used to manufacture these cellular structures have been presented
in chapter 7. These TPMS cellular structures were made from 316L stainless,
AlSi10Mg, and Ti-6Al-4V metal powders. The test pieces were provided in a
cubic shape (dimensions: 25mm x 25mm x 15mm) as shown in Fig. 8.2. A cube
is selected for the geometric shape of specimens to prevent buckling during the
compression process. The cube dimensions were kept the same for all samples
tested. Both the top and bottom of these compression samples are sandwiched
between 15mm thick facing smooth plates made from hardened steel. This
allows proper alignment between a test sample and the upper/lower platforms
of testing frame. The facing plates are treated as rigid bodies.
Compression tests were performed directly from the as-received specimens
at ambient temperature. The load vs. displacement was monitored by a
computer with a data acquisition system that controlled test under either

150
constant loading speed or constant strain rate conditions. Further details on the
testing procedure and equipment are described in chapter 3.
Figure 8.2 Gyroid and Diamond compression test samples
8.4 Results and Discussion
8.4.1 316L Stainless steel cellular structures
8.4.1.1 Effect of cell size on compressive behaviour
The compressive stress-strain curves obtained from Gyroid cellular structure
with cell size ranging from 2 to 8mm are shown in Fig. 8.3(a). At the very
beginning of loading, the curves have an initial portion which is non-linear and
concave upwards. This is attributed to small amount of distortion of the struts
when they are cut off from the base plate, or unevenness of the upper surface
of the cellular structure. After that, the stress-strain curves exhibit a linear
elastic region, followed by stress plateau, caused by plastic yielding and
bending of cell struts. Further straining cause the collapse of the cell struts and
densification (i.e. a sharp rise in stress) of the overall structure.
When the cells have almost completely collapsed opposing cell walls touch
and further strain compresses the solid itself, giving the final region of rapidly
increasing stress. The densification strain slightly varies for different cell size
and occurs above 0.4 of compressive strain. At about 0.6 of compressive strain,
the collapse of struts in the cellular structure is complete and the voids that
were initially present in the material no longer exist. With densification complete,
the stress drastically increases as the cellular structures take on the properties
of the bulk solid material.

151
Figure 8.3 (a) Stress-strain curve of various cell sizes (b) Displacement steps of the
test sample during compression test [cell size=5.5mm, volume fraction = 15% ,
stainless steel, SLM – MCP Realizer]
The images in Fig. 8.3(b) shows an increasing displacements compression
crush behaviour of Gyroid cellular structures with constant volume fraction of
15% (i.e. relative density =0.15) and cell size of 5.5mm. Both the stress-strain
curves in Fig. 8.3(a) and the snapshots in Fig. 8.2(b) show no signs of visible
local brittle failure, and the cellular lattice structures show a steady, smooth
progression of deformation throughout the testing process. Table 8.1
summarises the results of the yield strength and Elastic modulus of the Gyroid
cellular structures. The data reveal that cell size influences both the elastic
modulus and yield strength for a fixed relative density and that the influence is
more significant for the plastic-yield strength. The yield strength varies from
12.98 MPa for cell size of 2mm to 12.41 MPa for cell size of 8mm. This
Linear elasticity
(bending)
Plateau (Plastic yielding)
Densification
(a)
(b)
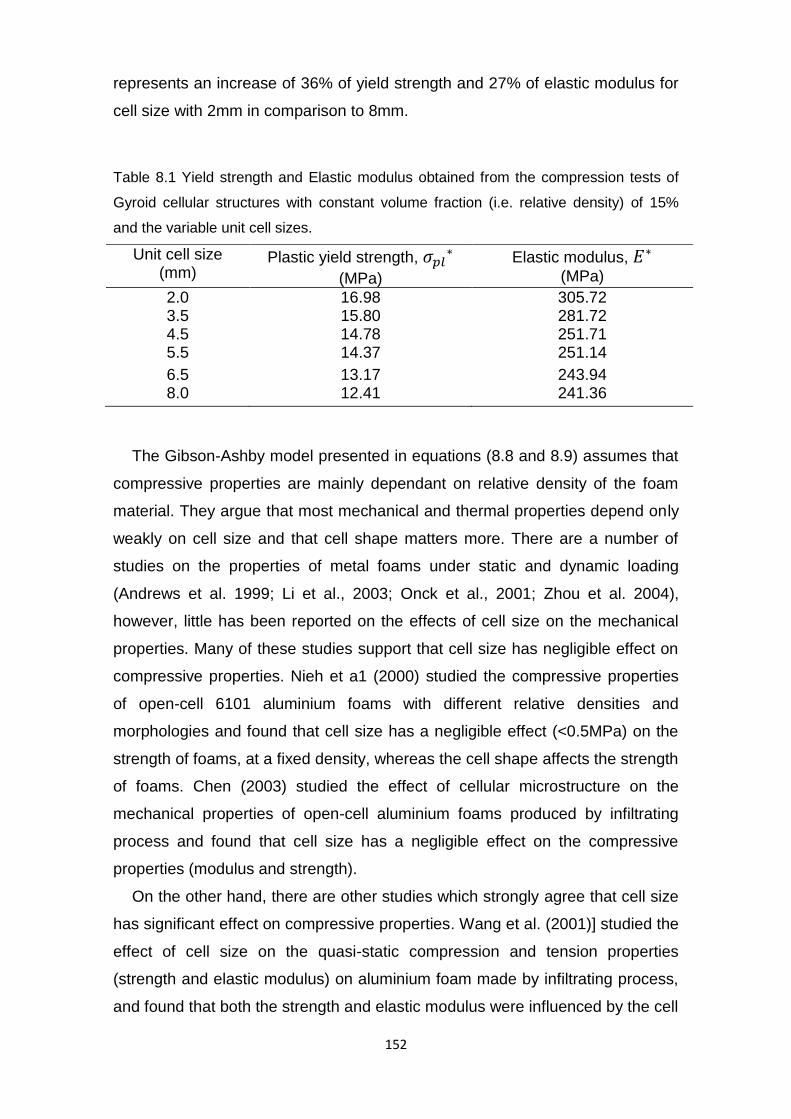
152
represents an increase of 36% of yield strength and 27% of elastic modulus for
cell size with 2mm in comparison to 8mm.
Table 8.1 Yield strength and Elastic modulus obtained from the compression tests of
Gyroid cellular structures with constant volume fraction (i.e. relative density) of 15%
and the variable unit cell sizes.
Unit cell size (mm)
Plastic yield strength,
(MPa)
Elastic modulus, (MPa)
2.0 16.98 305.72 3.5 15.80 281.72 4.5 14.78 251.71 5.5 14.37 251.14
6.5 13.17 243.94 8.0 12.41 241.36
The Gibson-Ashby model presented in equations (8.8 and 8.9) assumes that
compressive properties are mainly dependant on relative density of the foam
material. They argue that most mechanical and thermal properties depend only
weakly on cell size and that cell shape matters more. There are a number of
studies on the properties of metal foams under static and dynamic loading
(Andrews et al. 1999; Li et al., 2003; Onck et al., 2001; Zhou et al. 2004),
however, little has been reported on the effects of cell size on the mechanical
properties. Many of these studies support that cell size has negligible effect on
compressive properties. Nieh et a1 (2000) studied the compressive properties
of open-cell 6101 aluminium foams with different relative densities and
morphologies and found that cell size has a negligible effect (<0.5MPa) on the
strength of foams, at a fixed density, whereas the cell shape affects the strength
of foams. Chen (2003) studied the effect of cellular microstructure on the
mechanical properties of open-cell aluminium foams produced by infiltrating
process and found that cell size has a negligible effect on the compressive
properties (modulus and strength).
On the other hand, there are other studies which strongly agree that cell size
has significant effect on compressive properties. Wang et al. (2001)] studied the
effect of cell size on the quasi-static compression and tension properties
(strength and elastic modulus) on aluminium foam made by infiltrating process,
and found that both the strength and elastic modulus were influenced by the cell
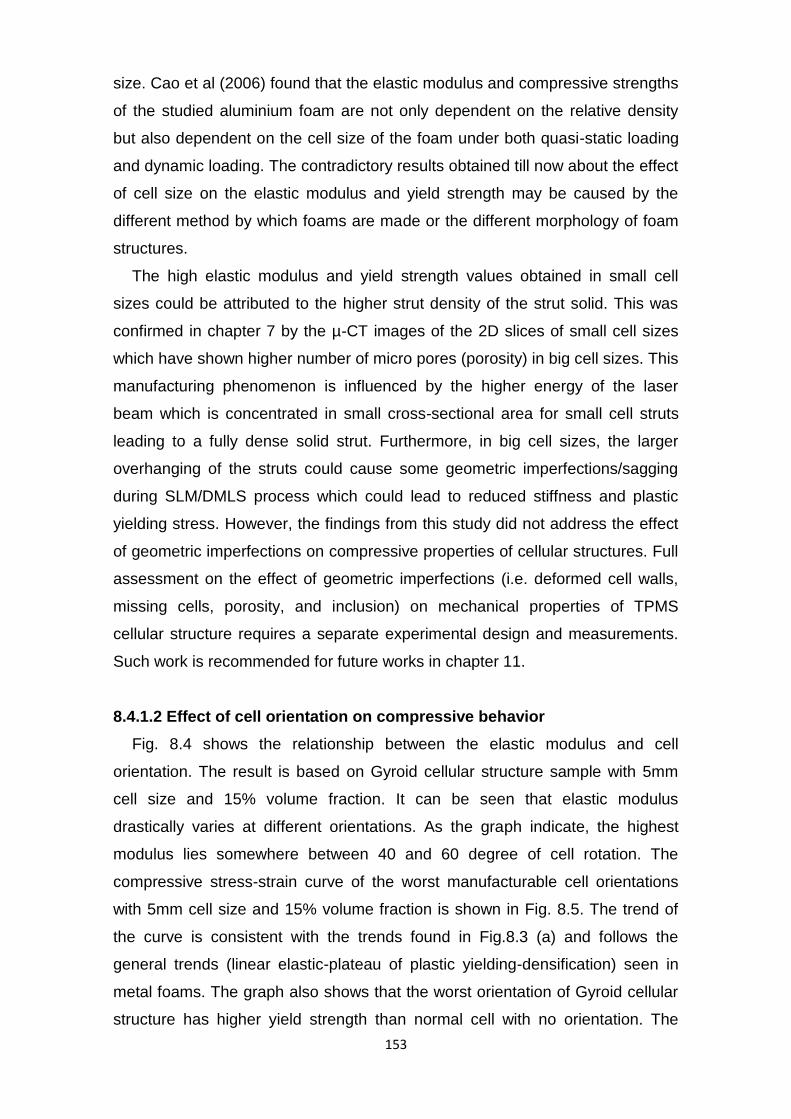
153
size. Cao et al (2006) found that the elastic modulus and compressive strengths
of the studied aluminium foam are not only dependent on the relative density
but also dependent on the cell size of the foam under both quasi-static loading
and dynamic loading. The contradictory results obtained till now about the effect
of cell size on the elastic modulus and yield strength may be caused by the
different method by which foams are made or the different morphology of foam
structures.
The high elastic modulus and yield strength values obtained in small cell
sizes could be attributed to the higher strut density of the strut solid. This was
confirmed in chapter 7 by the µ-CT images of the 2D slices of small cell sizes
which have shown higher number of micro pores (porosity) in big cell sizes. This
manufacturing phenomenon is influenced by the higher energy of the laser
beam which is concentrated in small cross-sectional area for small cell struts
leading to a fully dense solid strut. Furthermore, in big cell sizes, the larger
overhanging of the struts could cause some geometric imperfections/sagging
during SLM/DMLS process which could lead to reduced stiffness and plastic
yielding stress. However, the findings from this study did not address the effect
of geometric imperfections on compressive properties of cellular structures. Full
assessment on the effect of geometric imperfections (i.e. deformed cell walls,
missing cells, porosity, and inclusion) on mechanical properties of TPMS
cellular structure requires a separate experimental design and measurements.
Such work is recommended for future works in chapter 11.
8.4.1.2 Effect of cell orientation on compressive behavior
Fig. 8.4 shows the relationship between the elastic modulus and cell
orientation. The result is based on Gyroid cellular structure sample with 5mm
cell size and 15% volume fraction. It can be seen that elastic modulus
drastically varies at different orientations. As the graph indicate, the highest
modulus lies somewhere between 40 and 60 degree of cell rotation. The
compressive stress-strain curve of the worst manufacturable cell orientations
with 5mm cell size and 15% volume fraction is shown in Fig. 8.5. The trend of
the curve is consistent with the trends found in Fig.8.3 (a) and follows the
general trends (linear elastic-plateau of plastic yielding-densification) seen in
metal foams. The graph also shows that the worst orientation of Gyroid cellular
structure has higher yield strength than normal cell with no orientation. The

154
Elastic modulus of the worst orientation is found to be 302.57 MPa, which is
20.37% higher than that of the normal orientation of similar cell size and volume
fraction. Similarly, the yield strength of the worst orientation is 14.41 MPa and is
7.78% higher than that of the normal orientation. This indicates that the
modulus difference is more significant than strength.
Figure 8.4 Effect of cell orientation on elastic modulus [stainless steel, SLM – MCP
Realizer]
The increased stiffness and strength for the worst orientation can be
attributed to the presence of the vertical struts in the cellular structure that are
parallel to the loading direction. Similar conclusions were made for other cell
shapes made from stainless steel in SLM (McKown et al., 2008), which found
that the lattices with vertical struts greater than 45o angle offer a significantly
higher modulus despite the having the same porosity and possessing
conditions. Cansizoglu et al. (2008) reported that lattices whose struts were
oriented at an angle of less than 20o had little or no overlap between the
successive melted layers resulting in weak structures. In this sense, a good
overlap between subsequent layers provides a better bonding between
subsequent layers and improved density of the cellular strut.
The cell orientation is mainly determined by the build orientation of the
component in which the cellular structure is integrated. Since cell orientation
influences the compressive properties, they can be deliberately rotated to match
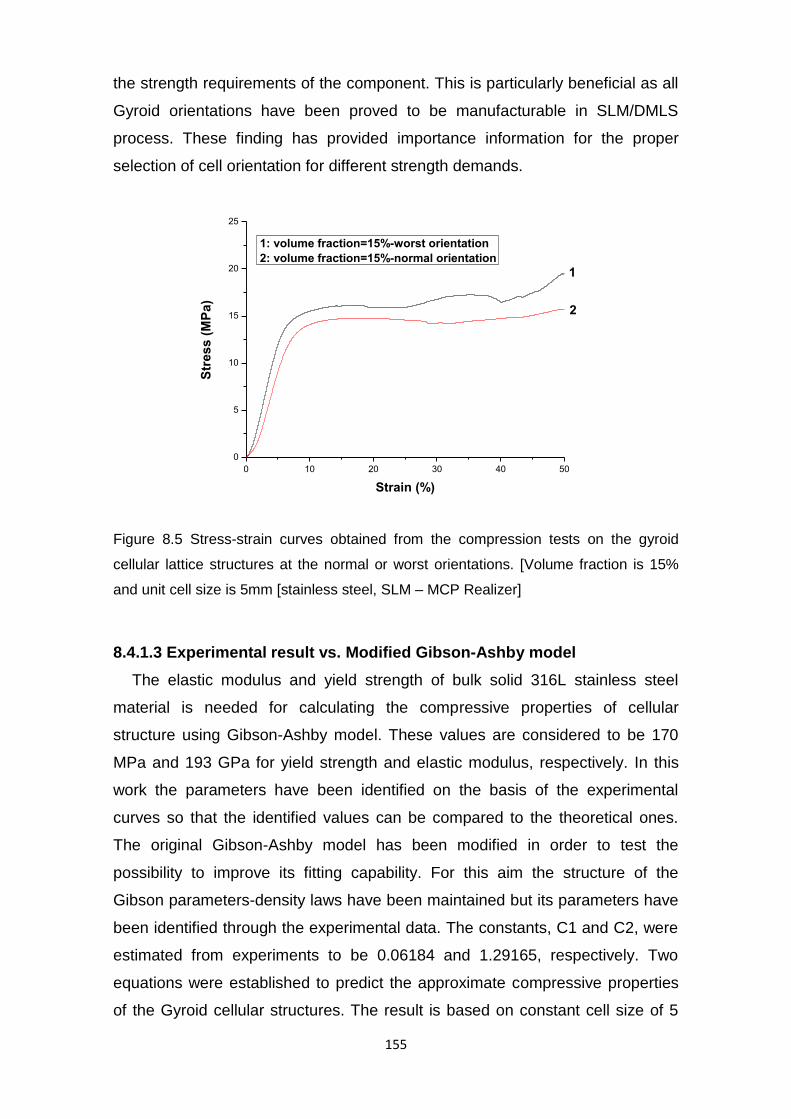
155
the strength requirements of the component. This is particularly beneficial as all
Gyroid orientations have been proved to be manufacturable in SLM/DMLS
process. These finding has provided importance information for the proper
selection of cell orientation for different strength demands.
0 10 20 30 40 50
0
5
10
15
20
25
2
Str
es
s (
MP
a)
Strain (%)
1: volume fraction=15%-worst orientation
2: volume fraction=15%-normal orientation
1
Figure 8.5 Stress-strain curves obtained from the compression tests on the gyroid
cellular lattice structures at the normal or worst orientations. [Volume fraction is 15%
and unit cell size is 5mm [stainless steel, SLM – MCP Realizer]
8.4.1.3 Experimental result vs. Modified Gibson-Ashby model
The elastic modulus and yield strength of bulk solid 316L stainless steel
material is needed for calculating the compressive properties of cellular
structure using Gibson-Ashby model. These values are considered to be 170
MPa and 193 GPa for yield strength and elastic modulus, respectively. In this
work the parameters have been identified on the basis of the experimental
curves so that the identified values can be compared to the theoretical ones.
The original Gibson-Ashby model has been modified in order to test the
possibility to improve its fitting capability. For this aim the structure of the
Gibson parameters-density laws have been maintained but its parameters have
been identified through the experimental data. The constants, C1 and C2, were
estimated from experiments to be 0.06184 and 1.29165, respectively. Two
equations were established to predict the approximate compressive properties
of the Gyroid cellular structures. The result is based on constant cell size of 5

156
mm and relative densities ranging from 0.06 to 0.15. These relative densities
are equivalent to solid volume fraction % from 6% to 15%. The calculated and
experimental elastic modulus and yield strength are plotted against relative
density (see Fig. 8.6 (a and b).
0.06 0.08 0.10 0.12 0.14 0.16
0
50
100
150
200
250
300
Experiment tested
Gibson-Ashby model estimated
Co
mp
res
sio
n m
od
olu
s (
MP
a)
Relative density
0.06 0.08 0.10 0.12 0.14 0.16
0
2
4
6
8
10
12
14
16
Experiment tested
Gibson-Ashby model estimated
Yie
ld s
tre
ng
th (
MP
a)
Relative density
Figure 8.6 Experimental results of the Gyroid cellular structure compared to the
modified Gibson-Ashby model with the identified parameters (a) compressive modulus
and (b) compressive strength as a function of relative density [stainless steel, SLM –
MCP Realizer]
(a)
(a)

157
The results reveal that both modulus and yield strength increase with relative
density, which is consistent with expectations for porous materials in Gibson-
Ashby model. The two curve trends show that model slightly over-predict the
elastic modulus and under-predict the yield strength in most part of the graph.
The differences are more pronounced in the yield strength compared to elastic
modulus. However, both variations are reasonably within or little offset from the
experimental error range. The maximum error between the modified Gibson-
Ashby model and experimental result is 16 MPa for elastic modulus and 1.6
MPa for yield strength. To further modify and improve the accuracy of Gibson-
Ashby model, it is essential to identify the model parameters from best fit curve
using experimental data of tested samples.
8.4.2 AlSi10Mg cellular structures
8.4.2.1 Effect of cell size and volume fraction on compressive behaviour
Fig 8.7 shows typical stress-strain curves obtained from compression tests of
AlSi10Mg Gyroid cellular structures with constant cell size of 4 mm and volume
fractions ranging from 5 to 15%. The stress-strain behaviour of AlSi10Mg is
different to the one we have seen with stainless steel cellular structures in Fig.
8.3. The stainless steel curves have shown elastic-plastic behaviour followed by
cellular densification when cells collapse and touch each other. In contrast, the
AlSi10Mg follow elastic-brittle behaviour, suggesting the brittle collapse mode,
i.e. brittle fracture of the cell walls.
The cell edges collapse as soon the yield stress is reached without or little
plastic straining and consequently the stress drops. The stress rises again when
new face of fresh cells is loaded. The oscillations of the stress-strain curves of
the AlSi10Mg cellular structures possess can be interpreted as repeating of
collapse and squeezing of the cell walls. This process continuous until the point
in which further straining compresses the solid itself, giving the final region of
rapidly increasing stress.

158
Figure 8.7 Stress-strain curves of Gyroid cellular structures with constant cell size of 4
mm and volume fractions ranging from 5 to 15% [AlSi10Mg, DMLS M280]
The elastic-brittle failure mode is common in brittle foams where a crack
nucleates at a weak cell or pre-existing flaw and propagates catastrophically,
giving fast brittle fracture. A cell wall will fail when the moment acting on it
exceeds (Gibson and Ashby, 1997).
(810)
where, is the modulus of rupture of the cell-wall material.
Force acting with a component normal to the cell wall length l, exerts a
moment which is proportional to Fl. The stress on the cellular structure is
proportional to . Combining these results give the brittle collapse stress
as,
(8.11)
From which using
( )
(
)
(8.12)
0 10 20 30 40 50
0
5
10
15
20
5
4
3
2
1
Str
ess /
MP
a
Strain / %
1: Volume Fraction=5.0%
2: Volume Fraction=7.5%
3: Volume Fraction=10.0%
4: Volume Fraction=12.5%
5: Volume Fraction=15.0%
Brittle crushing
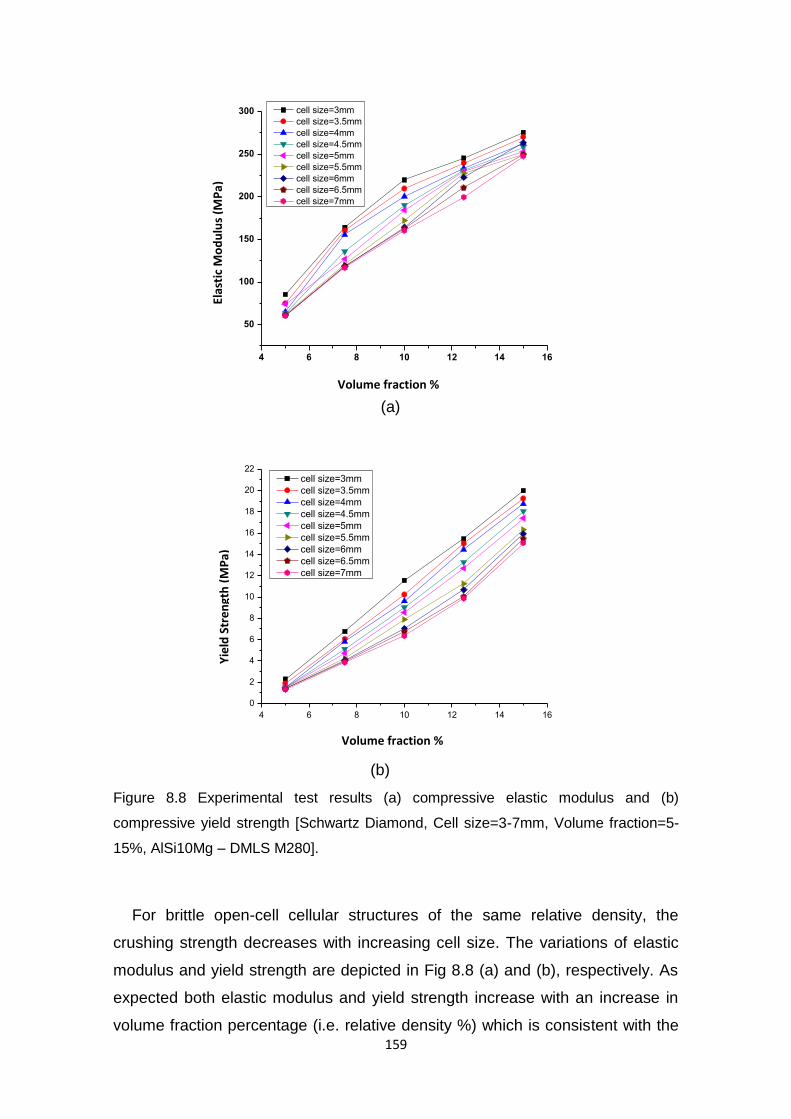
159
Figure 8.8 Experimental test results (a) compressive elastic modulus and (b)
compressive yield strength [Schwartz Diamond, Cell size=3-7mm, Volume fraction=5-
15%, AlSi10Mg – DMLS M280].
For brittle open-cell cellular structures of the same relative density, the
crushing strength decreases with increasing cell size. The variations of elastic
modulus and yield strength are depicted in Fig 8.8 (a) and (b), respectively. As
expected both elastic modulus and yield strength increase with an increase in
volume fraction percentage (i.e. relative density %) which is consistent with the
4 6 8 10 12 14 16
50
100
150
200
250
300 cell size=3mm
cell size=3.5mm
cell size=4mm
cell size=4.5mm
cell size=5mm
cell size=5.5mm
cell size=6mm
cell size=6.5mm
cell size=7mm
Mo
du
lus
(MP
a)
Volume fraction (%)
4 6 8 10 12 14 16
0
2
4
6
8
10
12
14
16
18
20
22
Co
mp
res
siv
e S
tre
ng
th /
MP
a
Volume fraction (%)
cell size=3mm
cell size=3.5mm
cell size=4mm
cell size=4.5mm
cell size=5mm
cell size=5.5mm
cell size=6mm
cell size=6.5mm
cell size=7mm
(a)
(b)
Elas
tic
Mo
du
lus
(MP
a)
Yie
ld S
tre
ngt
h (
MP
a)
Volume fraction %
Volume fraction %
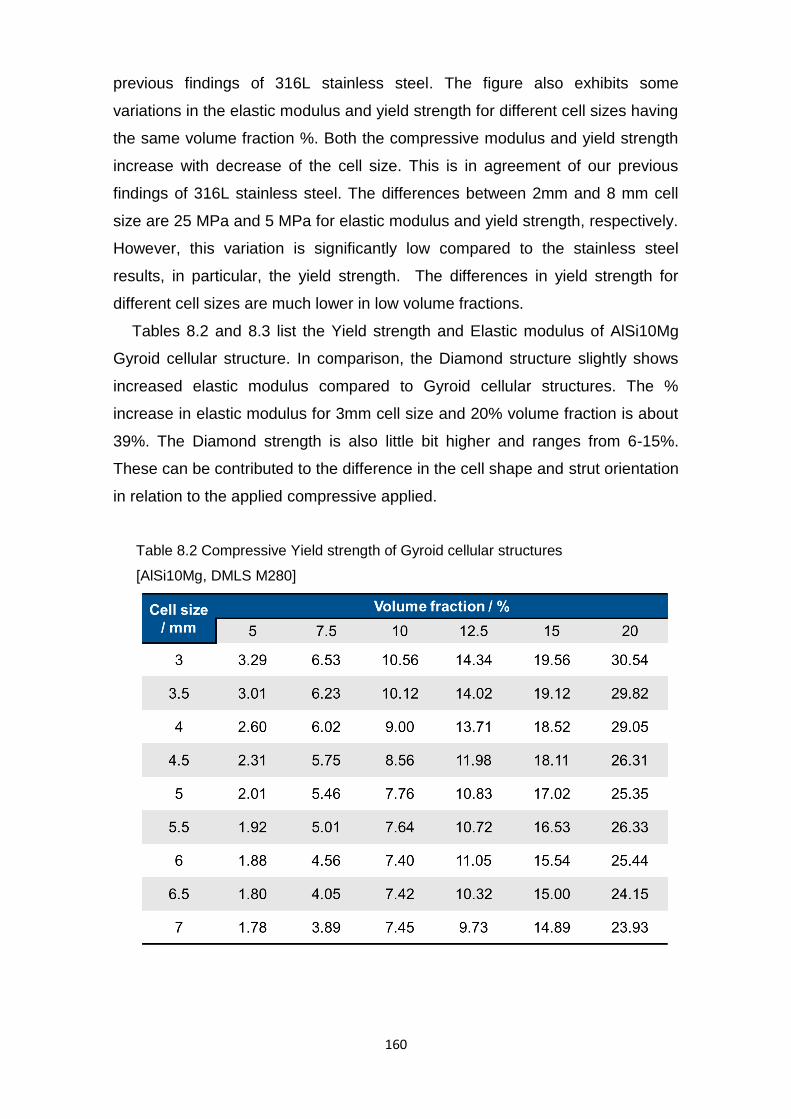
160
previous findings of 316L stainless steel. The figure also exhibits some
variations in the elastic modulus and yield strength for different cell sizes having
the same volume fraction %. Both the compressive modulus and yield strength
increase with decrease of the cell size. This is in agreement of our previous
findings of 316L stainless steel. The differences between 2mm and 8 mm cell
size are 25 MPa and 5 MPa for elastic modulus and yield strength, respectively.
However, this variation is significantly low compared to the stainless steel
results, in particular, the yield strength. The differences in yield strength for
different cell sizes are much lower in low volume fractions.
Tables 8.2 and 8.3 list the Yield strength and Elastic modulus of AlSi10Mg
Gyroid cellular structure. In comparison, the Diamond structure slightly shows
increased elastic modulus compared to Gyroid cellular structures. The %
increase in elastic modulus for 3mm cell size and 20% volume fraction is about
39%. The Diamond strength is also little bit higher and ranges from 6-15%.
These can be contributed to the difference in the cell shape and strut orientation
in relation to the applied compressive applied.
Table 8.2 Compressive Yield strength of Gyroid cellular structures
[AlSi10Mg, DMLS M280]

161
Table 8.3 Compressive Elastic modulus of Gyroid cellular structures
[AlSi10Mg, DMLS M280]
8.4.2.2 Experimental result vs. Modified Gibson-Ashby model
To compare experimental results with Gibson-Ashby model, the bulk material
yield strength and elastic modulus of AlSi10Mg alloy was taken to be 240 MPa
and 72 GPa, respectively. The constants C1 and C2 were found to be 0.189
and 1.183, respectively. Comparisons of the modified Gibson-Ashby model and
experimental compressive modulus and strength are shown in Fig 8.9(a and b).
The yield strength curves are well aligned, indicating good agreement with
experimental values with a maximum error of ±3 MPa; however, the error in
elastic modulus is more pronounced and reaches between 40±5 MPa for low
relative densities.
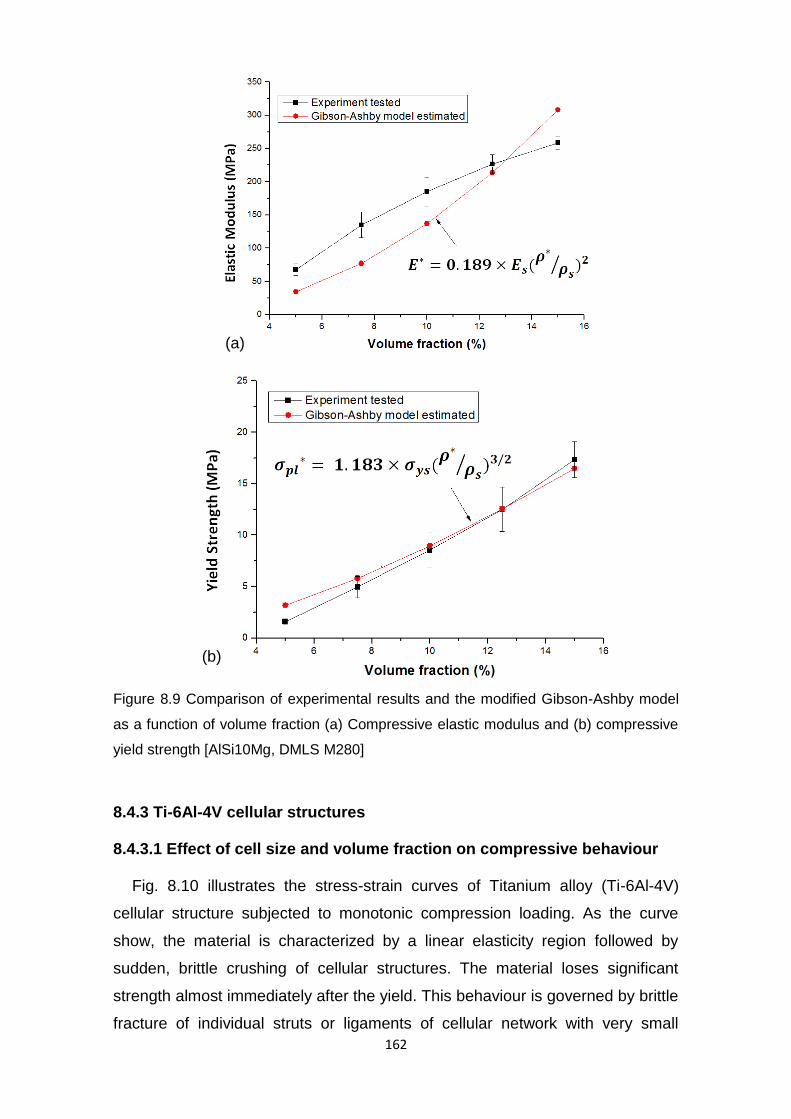
162
Figure 8.9 Comparison of experimental results and the modified Gibson-Ashby model
as a function of volume fraction (a) Compressive elastic modulus and (b) compressive
yield strength [AlSi10Mg, DMLS M280]
8.4.3 Ti-6Al-4V cellular structures
8.4.3.1 Effect of cell size and volume fraction on compressive behaviour
Fig. 8.10 illustrates the stress-strain curves of Titanium alloy (Ti-6Al-4V)
cellular structure subjected to monotonic compression loading. As the curve
show, the material is characterized by a linear elasticity region followed by
sudden, brittle crushing of cellular structures. The material loses significant
strength almost immediately after the yield. This behaviour is governed by brittle
fracture of individual struts or ligaments of cellular network with very small
(a)
(b)
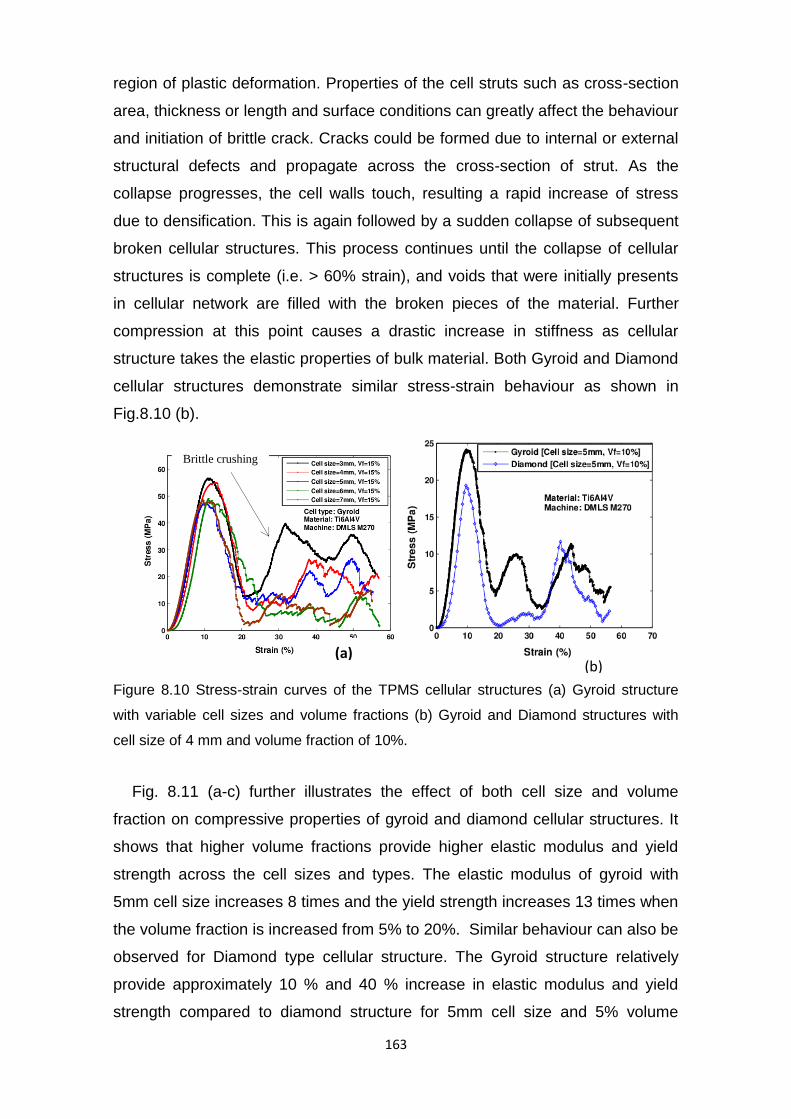
163
region of plastic deformation. Properties of the cell struts such as cross-section
area, thickness or length and surface conditions can greatly affect the behaviour
and initiation of brittle crack. Cracks could be formed due to internal or external
structural defects and propagate across the cross-section of strut. As the
collapse progresses, the cell walls touch, resulting a rapid increase of stress
due to densification. This is again followed by a sudden collapse of subsequent
broken cellular structures. This process continues until the collapse of cellular
structures is complete (i.e. > 60% strain), and voids that were initially presents
in cellular network are filled with the broken pieces of the material. Further
compression at this point causes a drastic increase in stiffness as cellular
structure takes the elastic properties of bulk material. Both Gyroid and Diamond
cellular structures demonstrate similar stress-strain behaviour as shown in
Fig.8.10 (b).
Figure 8.10 Stress-strain curves of the TPMS cellular structures (a) Gyroid structure
with variable cell sizes and volume fractions (b) Gyroid and Diamond structures with
cell size of 4 mm and volume fraction of 10%.
Fig. 8.11 (a-c) further illustrates the effect of both cell size and volume
fraction on compressive properties of gyroid and diamond cellular structures. It
shows that higher volume fractions provide higher elastic modulus and yield
strength across the cell sizes and types. The elastic modulus of gyroid with
5mm cell size increases 8 times and the yield strength increases 13 times when
the volume fraction is increased from 5% to 20%. Similar behaviour can also be
observed for Diamond type cellular structure. The Gyroid structure relatively
provide approximately 10 % and 40 % increase in elastic modulus and yield
strength compared to diamond structure for 5mm cell size and 5% volume
Brittle crushing
(a) (b)
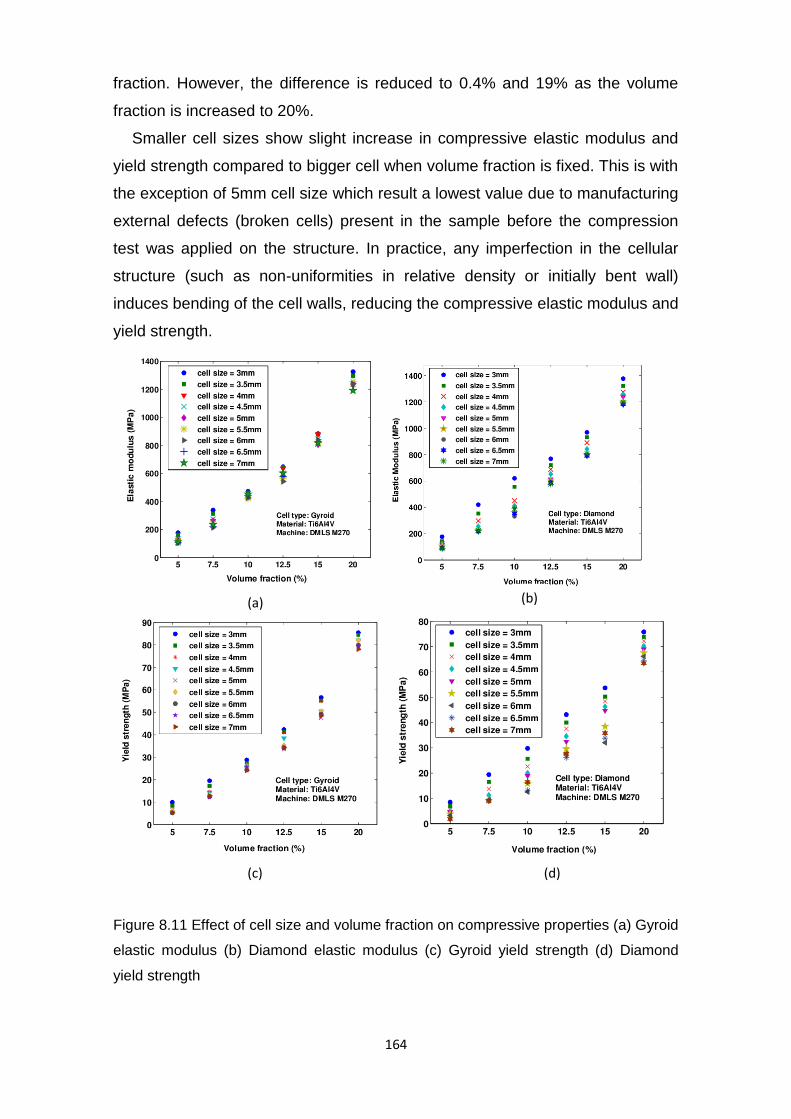
164
fraction. However, the difference is reduced to 0.4% and 19% as the volume
fraction is increased to 20%.
Smaller cell sizes show slight increase in compressive elastic modulus and
yield strength compared to bigger cell when volume fraction is fixed. This is with
the exception of 5mm cell size which result a lowest value due to manufacturing
external defects (broken cells) present in the sample before the compression
test was applied on the structure. In practice, any imperfection in the cellular
structure (such as non-uniformities in relative density or initially bent wall)
induces bending of the cell walls, reducing the compressive elastic modulus and
yield strength.
Figure 8.11 Effect of cell size and volume fraction on compressive properties (a) Gyroid
elastic modulus (b) Diamond elastic modulus (c) Gyroid yield strength (d) Diamond
yield strength
(a) (b)
(d) (c)
165
The microstructure of the Ti alloy processed by SLM will be different from
those obtained with conventional manufacturing methods. This will also affect
the mechanical properties of the components. Chang et al. (2011) also found
that the fracture surfaces of Ti-6Al-4V tensile samples manufactured in SLM
demonstrate a mixture of ductile and brittle fracture. Luca Fachini (2009), Ola.
LA Harryson et al (2008) investigated the mechanical properties and
microstructure of a Ti6Al4V alloy and pure titanium produced by electron beam
melting.
8.4.3.2 Experimental result Vs. Modified Gibson-Ashby model
Fig. 8.12 shows the comparison of the experimental and GA model prediction
of elastic modulus and compressive yield strength of Ti64 manufactured in
DMLS process. Two type of cell structure (Gyroid and diamond) with varying
cell size and volume fractions are compared relatively. Figs .8.10 (a-d) displays
the data fitting graphs used from the experimental test data to obtain the
constants C1 and C2 to develop and correct the GA prediction model for Ti64.
The Figs. 8.12(e-h) indicate the experimental and GA curves and shows
compressive elastic modulus and yield strength as a function of relative density
(i.e. volume fraction) of the gyroid and diamond cellular structures. Good
agreement between the GA prediction and experimental models can be seen in
the figures indicating the high dependence of these properties on relative
density.

166
Figure 8.12 (a-c) Fitting graphs used from the experimental test data to obtain the constants C1
and C2 (e-h) indicate the experimental and GA curves and shows compressive elastic modulus
and yield strength as a function of relative density (i.e. volume fraction) of the gyroid and
diamond cellular structures.
(a) (b)
(e) (f)
(g) (h)
(c) (d)
3
3
3 3

167
8.5 Conclusion
In this chapter, rigorous mechanical testing was performed to enhance the
understanding of the mechanical behaviour of TPMS cellular structures (Gyroid
and Diamond) under uniaxial compression testing. Since mechanical properties
of cellular structure depend on those of the solid cell-wall material of which the
structure is made, as well as, the manufacturing method, specimens were
manufactured from three commonly used metallic materials in metal AM
machines. These are, 316L stainless steel processed in SLM-MCP Realizer,
Aluminium alloy AlSi10Mg manufactured in DMLS M280, and Titanium alloy Ti-
6Al-4V processed in DMLS M270). The objective was also to expand the scope
of material data on both manufacturability and mechanical properties of these
cellular structures. The effect of cell size, volume fraction, and cell orientation
on compressive elastic modulus and yield strength were examined. The
analytical model of Gibson-Ashby used for predicting the properties of cellular
solids was modified by tuning the characteristic constants identified from
experimental curves and compared with real experimental results. The main
findings from this study can be summarized as follows,
The compressive stress-strain curves of 316L stainless steel cellular structures
exhibit elastic- plastic behaviour followed by a region of densification. The
cellular structure has a plastic yield point, the cells connecting the structure
collapse plastically when loaded beyond the linear-elastic regime. Plastic
collapse of 316L stainless steel, gives a long horizontal plateau to the stress-
strain curve, though the strain is no longer recoverable. Both lattices (Gyroid
and Diamond) exhibited similar characteristics under compression loading.
Linear elasticity is limited to small strains, typically 5% or less. The large plastic
strains found in 316L stainless steel cellular structures cause the cell walls to
crush together, and make the stress-strain curves rise steeply to a limiting strain
which is mainly a function of relative density of the cellular structure as
described by Gibson and Ashby (1997),
(
)
The densification strain slightly varies for different cell sizes of stainless steel
cellular structure and occurs between 0.4 and 0.6 of compressive strain.
The compressive stress-strain curves found in AlSi10Mg and Ti-6Al-4V cellular
structures were different to that stainless steel cellular structures and follow

168
elastic-brittle behaviour followed by a region of densification. There is no
plateau region resulting from plastic yielding indicating a brittle collapse mode,
i.e. brittle fracture of the cell walls. This densification begins at the point in which
further straining compresses the solid itself, giving the final region of rapidly
increasing stress.
For all the three tested materials, both compressive elastic modulus and yield
strength increase with the increase of solid volume fraction of the strut (i.e.
relative density). For example, the elastic modulus and yield strength of Gyroid
structure both drop by approximately 69.3 and 77.7% for 316L stainless steel,
47.9 and 69.75% for AlSi10Mg, 68.75 and 72% for Ti-6Al-4V, respectively,
when volume fraction is reduced from 15 to 7.5%, at constant cell size of
5.5mm. The large % increase of compressive properties for all material is also
close to each other with the exception of elastic modulus of AlSi10Mg,
indicating the high dependence of compressive properties on solid volume
fraction of the cellular structure.
In material comparison, the compressive elastic modulus and yield strength of
Gyroid cellular structure with 5.5 mm cell size and 15% solid volume fraction
(equivalent to 0.15 relative density) is about, 251 MPa and 14 MPa for 316L
stainless steel, 231 MPa and 16 MPa for AlSi10Mg, and 810 MPa and 50 MPa
for Ti-6Al-4V, respectively. Cellular structures made from Ti-6Al-4V are 3-4
superior to that of 36L stainless steel and AlSi10Mg of similar cell size and
volume fraction, making them attractive material for lightweight and load bearing
applications.
The experimental results reveal that cell size has relatively a minor influence
compared to volume fraction for both elastic modulus and yield strength of
cellular structure, when the volume fraction is kept constant. The % increase in
modulus and yield strength when the cell size is decreased from 5.5mm to
3.5mm with a fixed volume fraction of 15% is about, 12 and 10% for 316L
stainless steel, 6 and 15.6% for AlSi10Mg, 8.6 and 12% for Ti-6Al-4V,
respectively. The microstructure of the metal powders processed by SLM/DMLS
will be different from those obtained with conventional manufacturing methods.
As was observed in µ-CT images in chapter 7, SLM/DMLS produces denser
small cells compared to large cell size due to the differences in their energy
density input and melt-pool characteristics.

169
The pores formed are mainly due to the lack of bonding between layers. This
could be the reason for the higher compressive properties found in small cell
sizes. For brittle open-cell cellular structures of the same relative density, the
crushing strength decreases with increasing cell size due to the presence of
micro-porosities in large cell sizes which could initiate fast fracture.
The cell orientation has a significant effect on the compressive properties of
cellular structures. It was found that the highest modulus 316L stainless steel
Gyroid structure lies between 40 and 60 degree of cell rotation. The Elastic
modulus of the worst cell orientation in manufacturing (i.e. nearly vertical cell
struts which are parallel to the loading direction) is found to be 20.37% higher
than that of the normal un-rotated cell orientation of similar cell size and volume
fraction. Similarly, the yield strength was found to increase only by 7.78%. Due
to anisotropy of SLM/DMLS, there are always two sets of data points for the
same structure depending on the loading direction (i.e. horizontal X-Y or vertical
Z).
The curves generated by comparing the modified Gibson-Ashby model and
experimental results show that the model slightly over-predicts the elastic
modulus and under-predict the yield strength for 316L stainless steel Gyroid
structures. Generally, the model results found in other materials are also within
or little offset from the experimental error range indicating it is potential as a
predictive model. The model could be used in the initial design for screening the
compressive properties of different cell sizes, orientations, and volume
fractions.
In comparison, the Diamond structure slightly shows increased elastic modulus
compared to Gyroid for both Ti-6Al-4V and AlSi10Mg cellular structures. The %
increase in elastic modulus for 3mm cell size and 20% volume fraction is about
4% for Ti-6Al-4V and 39% for AlSi10Mg. The Gyroid give slightly better yield
strength between 5-20% for Ti-6Al-4V compared to Diamond structure, while in
AlSi10Mg, the Diamond strength is little bit higher and ranges from 6-15%.
These can be contributed to the difference in the cell shape and connectivity
between Gyroid and Diamond.
In practice, any imperfections in the cellular structure (such as non-uniformities
in relative density or initially bent cell walls) induce bending of the cell walls,
reducing the compressive properties. However, this was out of the scope of this
study and will be recommended as future work.

170
This study has contributed to our understanding of the compressive properties
of TPMS cellular structures manufactured in SLM/DMLS. It helps the designer
who is using these cellular structures to confidently select the cell size,
orientation, and volume fraction knowing their compressive properties. Data
presented include cellular structure with remarkably very low solid volume
fractions of up to 5%. This is particularly attractive for low load bearing and
ultra-lightweight components. The data covers three commonly used metallic
materials in metal AM.
The Titanium alloy porous structure is difficult to machine, or produce from the
liquid state due to high melting point, high reactive activity at high temperature
above 1000 ºC and contamination susceptibility. The production of Titanium
alloys via SLM/DMLS route is attractive due to the ability to produce lightweight
cellular structures. Since Titanium is denser and more expensive than
aluminium, the use of cellular structure is expected to reduce material costs and
improve fuel efficiency (by reducing weight). Using Ti cellular structure will also
increase the impact resistance of airplanes. The bio-compatibility, lightweight,
and load bearing capable of Ti-6Al-4V cellular structures makes them attractive
in medical implants for human bone substitute. The organic TPMS cellular
structures resemble those found inside of a bone in terms of its structural
configuration. Not only does this make it less stiff than conventional massive
implants. It also promotes ingrowth into surrounding bones.
The aluminium cellular structures are potential in heat exchanger application
due to their superior thermal properties and lightweight. Cellular structure could
be used for heat transfer enhancement and fluid mixing to maximum the
thermodynamic efficiency of heat exchanger systems.

171
Part Four:
Developing Low Volume Cellular Support
Structures for Metal Additive Manufacturing
172
CHAPTER 9
Advanced Cellular Support Structures for Metal
Additive Manufacturing
9.1 Introduction
Additive manufacturing (AM) of complex metallic parts typically require the
building of sacrificial support structures to hold the overhanging regions during
part building. These structures which are built simultaneously with the part,
anchors the overhanging geometry to the base plate and prevent
distortion/curling resulting from thermal stresses. It was found in chapter 5
(Finite element simulations of single overhang layers) that these thermal
gradients and stresses are the result of cyclic rapid melting and solidification of
the powder material. Support structures are necessary, but add constraints to
the geometries that the processes can make. The design and selection of
support structure can influence the manufacturability of complex metal parts,
material and energy utilization, manufacturing time and cost.
This study takes a new step on the design and manufacturing more efficient
support method through the novel application of cellular lattice structures with
very low volume fraction. The chapter presents the development of an
advanced support structure method using periodic cellular structures.
Lightweight TPMS cellular structures are used as support in order to minimize
the material and build time of sacrificial support structures. Experimental studies
on two types of cellular structures (Gyroid and Diamond) were conducted in
DMLS M270 machine using Ti-6Al-4V metal powder. The following sections will
address the development of the cellular support structures foe metal AM.
9.2 Support Structures in Metal AM Processes
The SLM/DMLS processes use high energy laser beam to melt the powder
material layer upon layer for making fully dense and high precision metallic
parts. The geometric complexity, which they offer, coupled with freedom of tool-
less manufacturing is compelling; however in practice, complete geometrical
freedom is desired but not possible in complex overhanging geometries.
Mumtaz et al. (2011), described one of the limitation of SLM is the use of
173
sacrificial structures which are removed after the build must be used to support
and hold overhanging features during laser processing. This severely restricts
the geometries that the processes can make, adds significant time and cost to
production.
Mercelis and Kruth (2006) reported that rapid heating of materials is followed
by a rapid solidification inducing high thermal variations resulting residual
stresses that can introduce part warpage, cracks or undesired effects to the
part. According to Pohl et al. (2001), this could even sometimes lead to whole
build failure due to de-lamination of the part from base plate. Re-melting the first
layer is a practice used to prevent delamination of the first layer from base
plate. Yasa (2011) obtained that post-scanning (i.e. re-melting the layer) the
layer with the same laser beam spot size have little effect on reducing thermal
stresses. Shiomi et al. (2004) proposed that post heat treatment through
temperature cycles in a furnace is an effective way of relieving residual stresses
trapped inside the part. However, stresses can induce cracks during the
processing before the part is complete. Kruth et al. (2012) established that by
using short scanning vectors and increasing the process temperature by
preheating the base plate up to 180 ◦C reduces the curling effect.
In SLM, since the first layer forms the foundation for the subsequent layers, it
is important to make it without deformation to avoid part dimensional loss or
process failure. For overhanging features where there is no underlying solid
layer to support, major deformation is usually expected. Thomas and Bibb
(2008) investigated the SLM process and found that it is limited in its ability to
build overhanging structures with angles less than 40–45◦ from horizontal
without building fixed support structures. The removal of support structure from
the part/base plate is a tedious job; in particular, large amount of supports for
delicate parts would increase the difficulties and time of support removal,
causing small pieces of the part to break off. Furthermore, the commonly used
conventional support method which consists of straight rectangular solid walls
or blocks as in Fig. 9.1 is unsuitable for recovering the raw loose powder which
are trapped inside the support structures during the build. Especially when the
support is removed by EDM-wire cutting, the part along with the support is
submerged in water that washes away all trapped raw powders. Since SLM is a
layer wise process with relatively low build rate, it is important that this non-
productive time is reduced.
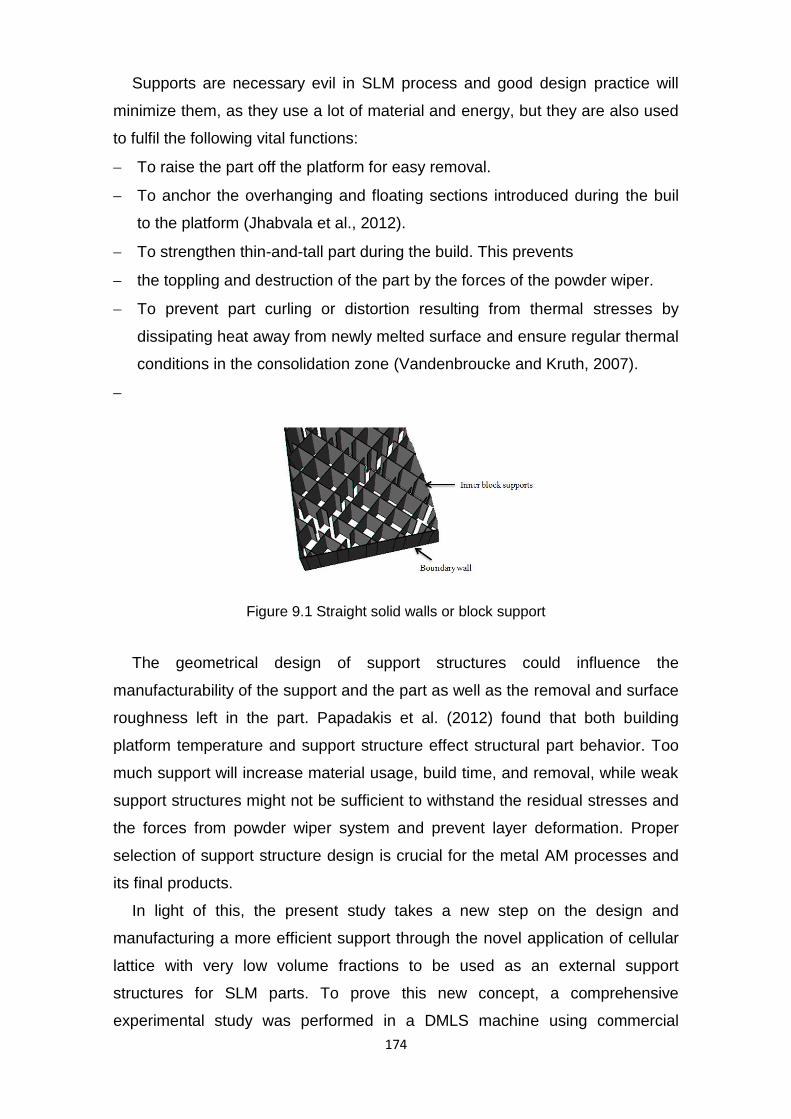
174
Supports are necessary evil in SLM process and good design practice will
minimize them, as they use a lot of material and energy, but they are also used
to fulfil the following vital functions:
To raise the part off the platform for easy removal.
To anchor the overhanging and floating sections introduced during the buil
to the platform (Jhabvala et al., 2012).
To strengthen thin-and-tall part during the build. This prevents
the toppling and destruction of the part by the forces of the powder wiper.
To prevent part curling or distortion resulting from thermal stresses by
dissipating heat away from newly melted surface and ensure regular thermal
conditions in the consolidation zone (Vandenbroucke and Kruth, 2007).
Figure 9.1 Straight solid walls or block support
The geometrical design of support structures could influence the
manufacturability of the support and the part as well as the removal and surface
roughness left in the part. Papadakis et al. (2012) found that both building
platform temperature and support structure effect structural part behavior. Too
much support will increase material usage, build time, and removal, while weak
support structures might not be sufficient to withstand the residual stresses and
the forces from powder wiper system and prevent layer deformation. Proper
selection of support structure design is crucial for the metal AM processes and
its final products.
In light of this, the present study takes a new step on the design and
manufacturing a more efficient support through the novel application of cellular
lattice with very low volume fractions to be used as an external support
structures for SLM parts. To prove this new concept, a comprehensive
experimental study was performed in a DMLS machine using commercial
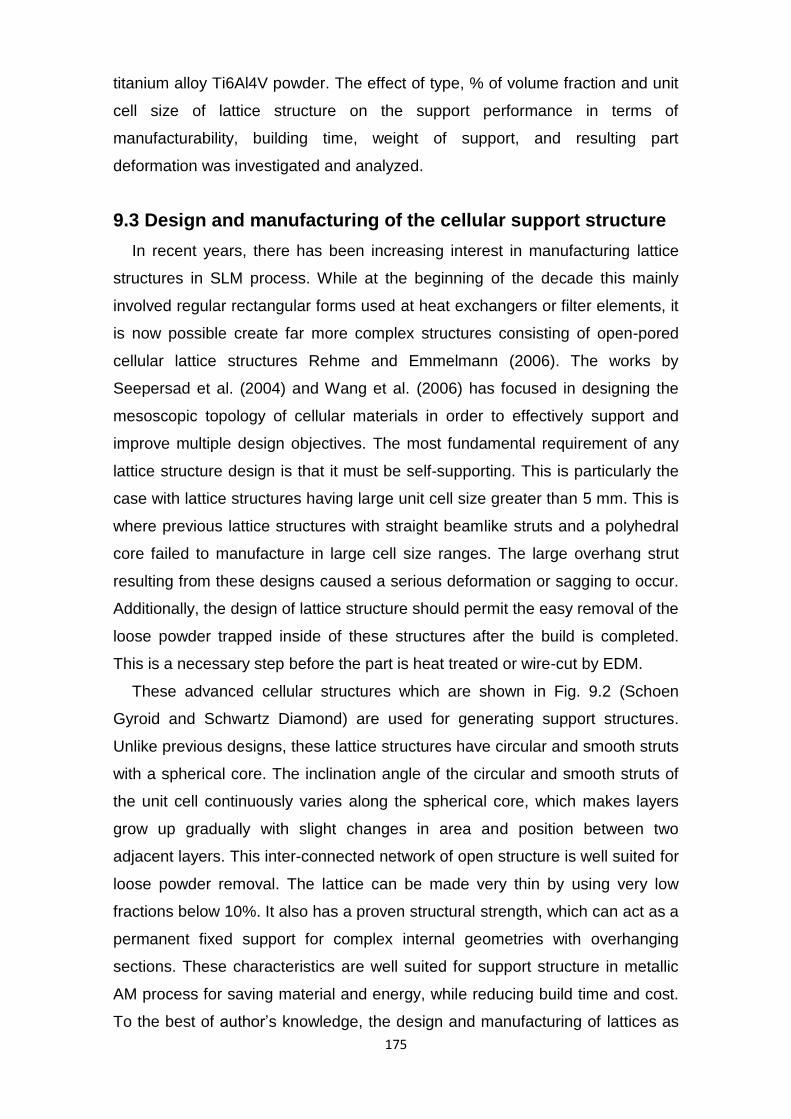
175
titanium alloy Ti6Al4V powder. The effect of type, % of volume fraction and unit
cell size of lattice structure on the support performance in terms of
manufacturability, building time, weight of support, and resulting part
deformation was investigated and analyzed.
9.3 Design and manufacturing of the cellular support structure
In recent years, there has been increasing interest in manufacturing lattice
structures in SLM process. While at the beginning of the decade this mainly
involved regular rectangular forms used at heat exchangers or filter elements, it
is now possible create far more complex structures consisting of open-pored
cellular lattice structures Rehme and Emmelmann (2006). The works by
Seepersad et al. (2004) and Wang et al. (2006) has focused in designing the
mesoscopic topology of cellular materials in order to effectively support and
improve multiple design objectives. The most fundamental requirement of any
lattice structure design is that it must be self-supporting. This is particularly the
case with lattice structures having large unit cell size greater than 5 mm. This is
where previous lattice structures with straight beamlike struts and a polyhedral
core failed to manufacture in large cell size ranges. The large overhang strut
resulting from these designs caused a serious deformation or sagging to occur.
Additionally, the design of lattice structure should permit the easy removal of the
loose powder trapped inside of these structures after the build is completed.
This is a necessary step before the part is heat treated or wire-cut by EDM.
These advanced cellular structures which are shown in Fig. 9.2 (Schoen
Gyroid and Schwartz Diamond) are used for generating support structures.
Unlike previous designs, these lattice structures have circular and smooth struts
with a spherical core. The inclination angle of the circular and smooth struts of
the unit cell continuously varies along the spherical core, which makes layers
grow up gradually with slight changes in area and position between two
adjacent layers. This inter-connected network of open structure is well suited for
loose powder removal. The lattice can be made very thin by using very low
fractions below 10%. It also has a proven structural strength, which can act as a
permanent fixed support for complex internal geometries with overhanging
sections. These characteristics are well suited for support structure in metallic
AM process for saving material and energy, while reducing build time and cost.
To the best of author’s knowledge, the design and manufacturing of lattices as
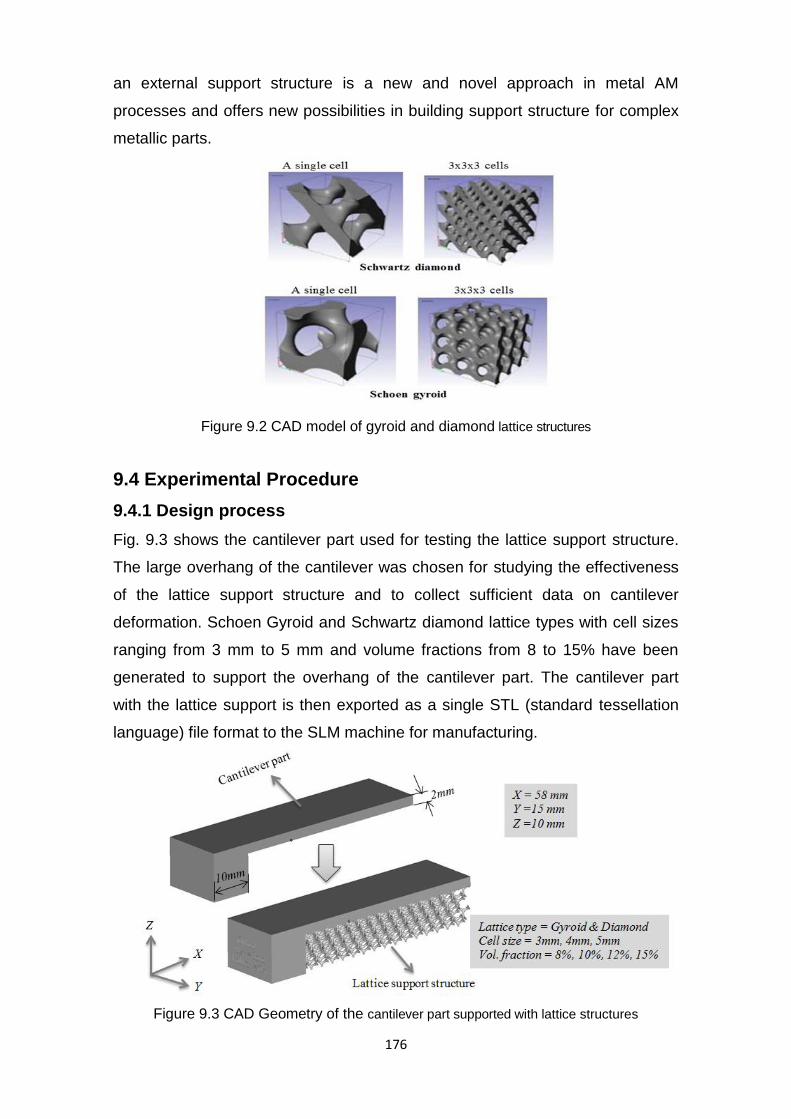
176
an external support structure is a new and novel approach in metal AM
processes and offers new possibilities in building support structure for complex
metallic parts.
Figure 9.2 CAD model of gyroid and diamond lattice structures
9.4 Experimental Procedure
9.4.1 Design process
Fig. 9.3 shows the cantilever part used for testing the lattice support structure.
The large overhang of the cantilever was chosen for studying the effectiveness
of the lattice support structure and to collect sufficient data on cantilever
deformation. Schoen Gyroid and Schwartz diamond lattice types with cell sizes
ranging from 3 mm to 5 mm and volume fractions from 8 to 15% have been
generated to support the overhang of the cantilever part. The cantilever part
with the lattice support is then exported as a single STL (standard tessellation
language) file format to the SLM machine for manufacturing.
Figure 9.3 CAD Geometry of the cantilever part supported with lattice structures
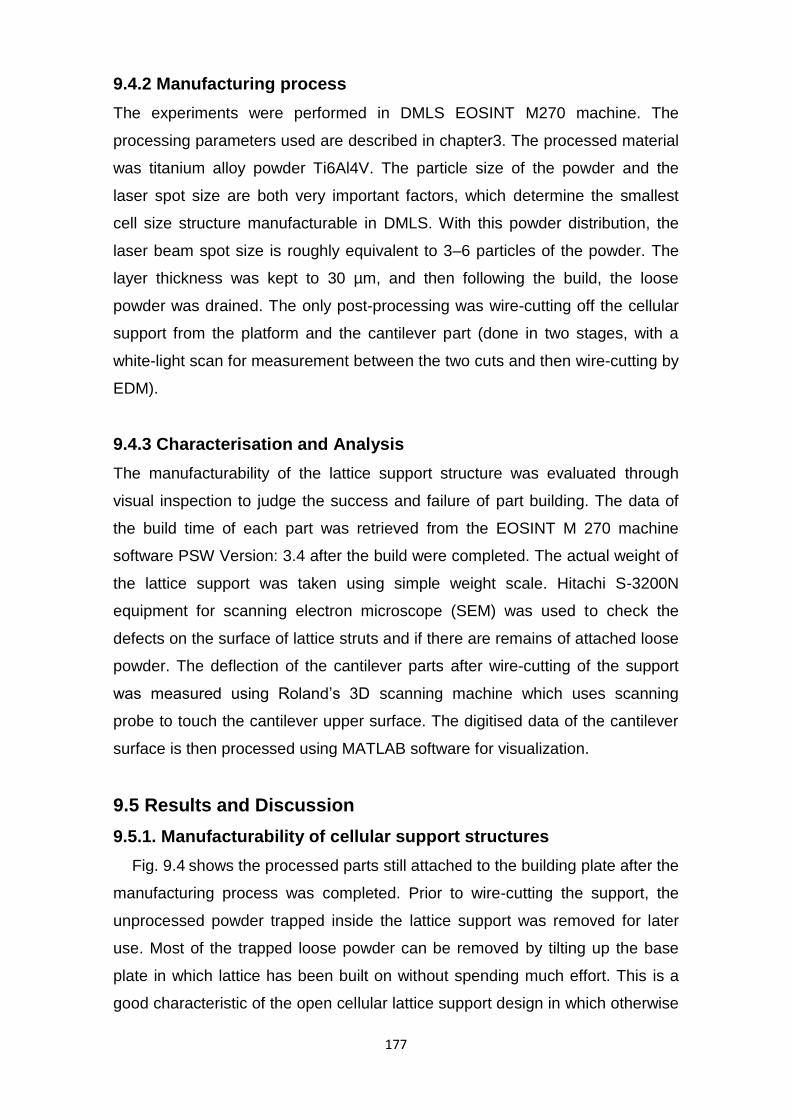
177
9.4.2 Manufacturing process
The experiments were performed in DMLS EOSINT M270 machine. The
processing parameters used are described in chapter3. The processed material
was titanium alloy powder Ti6Al4V. The particle size of the powder and the
laser spot size are both very important factors, which determine the smallest
cell size structure manufacturable in DMLS. With this powder distribution, the
laser beam spot size is roughly equivalent to 3–6 particles of the powder. The
layer thickness was kept to 30 µm, and then following the build, the loose
powder was drained. The only post-processing was wire-cutting off the cellular
support from the platform and the cantilever part (done in two stages, with a
white-light scan for measurement between the two cuts and then wire-cutting by
EDM).
9.4.3 Characterisation and Analysis
The manufacturability of the lattice support structure was evaluated through
visual inspection to judge the success and failure of part building. The data of
the build time of each part was retrieved from the EOSINT M 270 machine
software PSW Version: 3.4 after the build were completed. The actual weight of
the lattice support was taken using simple weight scale. Hitachi S-3200N
equipment for scanning electron microscope (SEM) was used to check the
defects on the surface of lattice struts and if there are remains of attached loose
powder. The deflection of the cantilever parts after wire-cutting of the support
was measured using Roland’s 3D scanning machine which uses scanning
probe to touch the cantilever upper surface. The digitised data of the cantilever
surface is then processed using MATLAB software for visualization.
9.5 Results and Discussion
9.5.1. Manufacturability of cellular support structures
Fig. 9.4 shows the processed parts still attached to the building plate after the
manufacturing process was completed. Prior to wire-cutting the support, the
unprocessed powder trapped inside the lattice support was removed for later
use. Most of the trapped loose powder can be removed by tilting up the base
plate in which lattice has been built on without spending much effort. This is a
good characteristic of the open cellular lattice support design in which otherwise

178
more material could have been wasted if a thin wall block support method is
used. For the support using 8% volume fraction, this could mean 92% of loose
powders embedded within lattice support could be recycled and reused.
However, it is worth noting that it is difficult to ensure that all powder particles
are removed in the process unless specialized cleaning process are employed
for medical applications.
Majority of the tested cellular support structures were manufactured
successfully; however, there were a number of parts, which also failed during
the build. Table 9.1 depicts the manufacturability at different cell size and
volume fractions of the tested cellular support structures. The manufacturing
failure can be contributed to the geometrical constrains of SLM process. The
manufacturability of the lowest % of volume fraction depends on the type of
lattice structure and the unit cell size involved.
Figure 9.4. Manufactured cantilever parts still attached on the base plate (DMLS -
EOSINT M270)
The manufacturing failure can result from the large distance between the
adjacent point contacts to the supported surface so that there is too much
overhang cantilever area that is unsupported. The gap of the contacting points
for gyroid with 5 mm cell size and 8% volume fraction is 3.8 mm as shown in
Fig. 6(b). This represents a large overhang area, which could not be
manufactured without support structure. Majority of the failures occurred due to
this second type while building the first overhang layer of the cantilever part.
The underneath lattice support structures did not prevent the newly melted
layers from distortion in the form of curling and the process must be stopped
from further building of that part. Very low volume fractions are desired in lattice
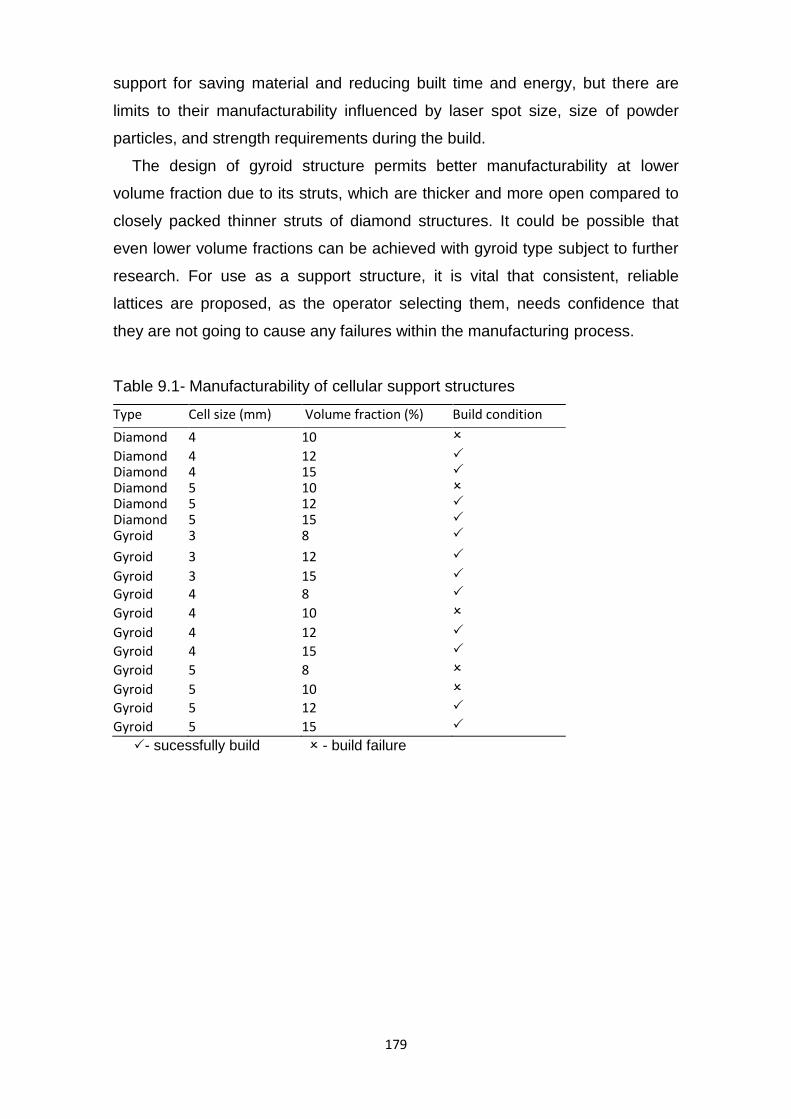
179
support for saving material and reducing built time and energy, but there are
limits to their manufacturability influenced by laser spot size, size of powder
particles, and strength requirements during the build.
The design of gyroid structure permits better manufacturability at lower
volume fraction due to its struts, which are thicker and more open compared to
closely packed thinner struts of diamond structures. It could be possible that
even lower volume fractions can be achieved with gyroid type subject to further
research. For use as a support structure, it is vital that consistent, reliable
lattices are proposed, as the operator selecting them, needs confidence that
they are not going to cause any failures within the manufacturing process.
Table 9.1- Manufacturability of cellular support structures
Type Cell size (mm) Volume fraction (%) Build condition
Diamond 4 10
Diamond 4 12 Diamond 4 15 Diamond 5 10 Diamond 5 12 Diamond 5 15 Gyroid
3 8
Gyroid 3 12
Gyroid 3 15
Gyroid 4 8
Gyroid 4 10
Gyroid 4 12
Gyroid 4 15
Gyroid 5 8
Gyroid 5 10
Gyroid 5 12
Gyroid 5 15
- sucessfully build - build failure
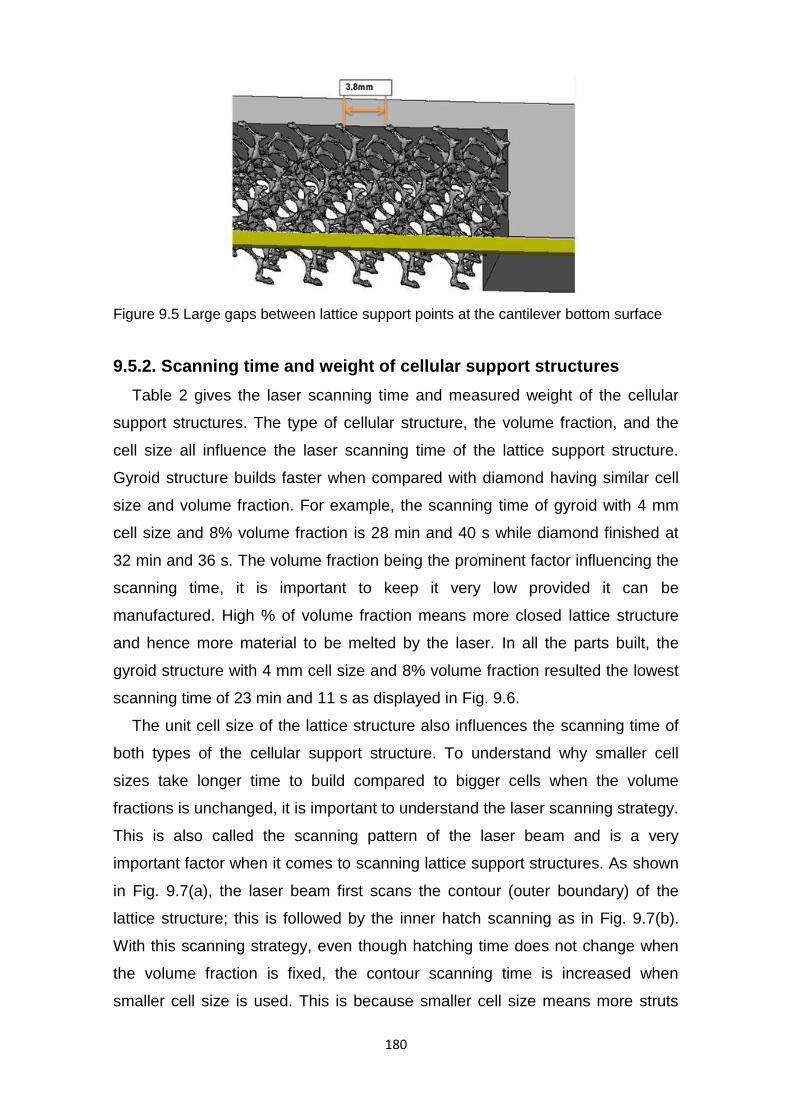
180
Figure 9.5 Large gaps between lattice support points at the cantilever bottom surface
9.5.2. Scanning time and weight of cellular support structures
Table 2 gives the laser scanning time and measured weight of the cellular
support structures. The type of cellular structure, the volume fraction, and the
cell size all influence the laser scanning time of the lattice support structure.
Gyroid structure builds faster when compared with diamond having similar cell
size and volume fraction. For example, the scanning time of gyroid with 4 mm
cell size and 8% volume fraction is 28 min and 40 s while diamond finished at
32 min and 36 s. The volume fraction being the prominent factor influencing the
scanning time, it is important to keep it very low provided it can be
manufactured. High % of volume fraction means more closed lattice structure
and hence more material to be melted by the laser. In all the parts built, the
gyroid structure with 4 mm cell size and 8% volume fraction resulted the lowest
scanning time of 23 min and 11 s as displayed in Fig. 9.6.
The unit cell size of the lattice structure also influences the scanning time of
both types of the cellular support structure. To understand why smaller cell
sizes take longer time to build compared to bigger cells when the volume
fractions is unchanged, it is important to understand the laser scanning strategy.
This is also called the scanning pattern of the laser beam and is a very
important factor when it comes to scanning lattice support structures. As shown
in Fig. 9.7(a), the laser beam first scans the contour (outer boundary) of the
lattice structure; this is followed by the inner hatch scanning as in Fig. 9.7(b).
With this scanning strategy, even though hatching time does not change when
the volume fraction is fixed, the contour scanning time is increased when
smaller cell size is used. This is because smaller cell size means more struts

181
per unit volume, which results in many contours to be scanned by the laser as
shown in Fig. 9.7(c–d).
The ideal lattice structure that is fast to build is to have a combination of very
low volume fraction and big cell size of Gyroid structure. However, in terms of
manufacturability, bigger cell sizes increase the gap between support points
and may cause a part failure due to thermal deformations of the unsupported
regions. Hence, the ideal choice for lattice support will be to use the cell size
that give allowable minimum gap having the minimum volume fraction that can
be consistently manufactured. At this time, optimal scanning strategies for these
lattices have not been investigated. When used for support purposes the
lattices are only sacrificial parts built to enable the final component to be
produced. As such, it is likely that much quicker strategies for their manufacture
could be developed in a possible future project.
The weight of lattice support structure is mainly proportional to the % of
volume fraction used, the higher the percentage the more material used for the
support. For example, there is 1.44 g of support material used in gyroid lattice
structure with cell size of 4 mm and volume fraction of 8% compared to 2.6
grams of material for 15% volume fraction. This difference could be significant
for big parts requiring large amount of support. For the two types of lattice
support structure, Gyroid weight less compared to diamond for similar volume
fraction and cell size. The apparent difference in weight between the Gyroid and
diamond structures can be explained by the difference in their unit cell design.
Diamond structure forms more crowded and thinner struts of lattice network
compared to Gyroid structure.
In addition, the size of the cell also influences the weight of lattice support
structure. This is apparent in Fig. 9.8, where smaller cell sizes weighted more
than the bigger cell sizes when the volume fraction is unchanged. This is
because smaller cell sizes have thinner struts, and thus high laser energy is
concentrated in a smaller region, which leads to large melt pool increasing both
the density of the structure and chance of partial melting of the surrounding
loose powder. SEM analysis undertaken in chapter 7, has confirmed that
wetting occurs to the surrounding loose powder particles which are then
attached to the struts of the lattice structures after re-solidification.
The loosely attached powder particles do not contribute to mechanical
properties, increase component weight, and, being only lightly attached, can be
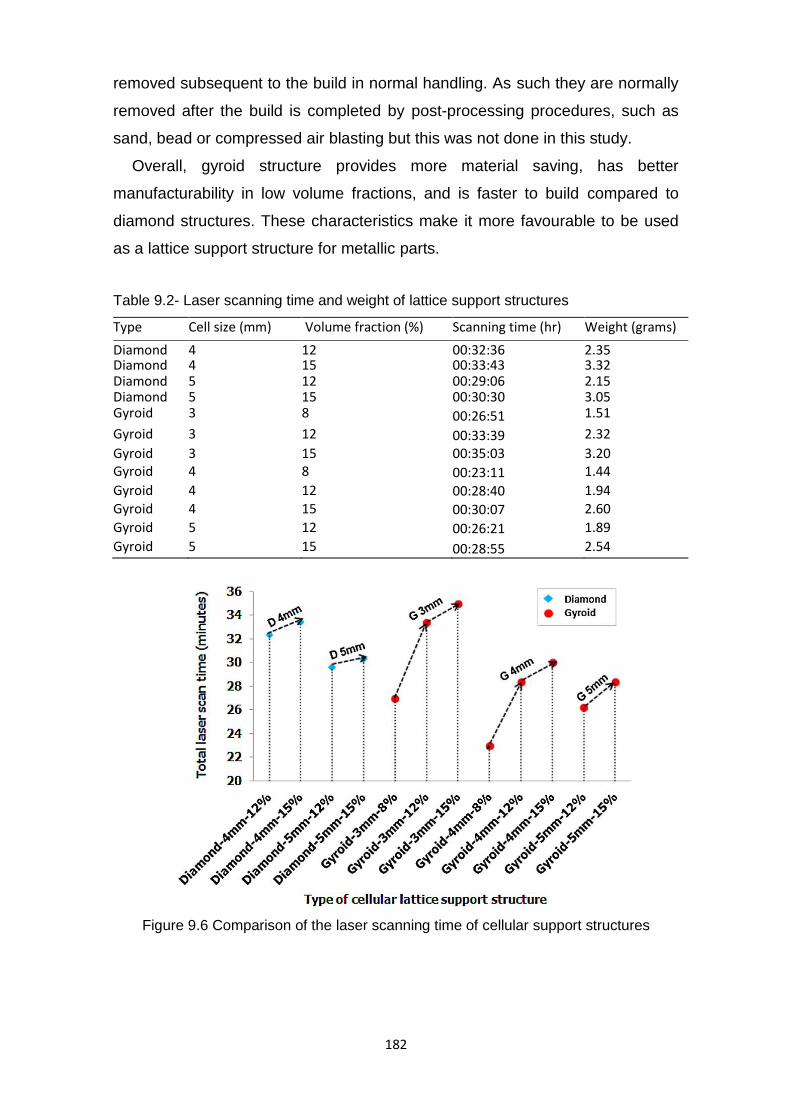
182
removed subsequent to the build in normal handling. As such they are normally
removed after the build is completed by post-processing procedures, such as
sand, bead or compressed air blasting but this was not done in this study.
Overall, gyroid structure provides more material saving, has better
manufacturability in low volume fractions, and is faster to build compared to
diamond structures. These characteristics make it more favourable to be used
as a lattice support structure for metallic parts.
Table 9.2- Laser scanning time and weight of lattice support structures
Type Cell size (mm) Volume fraction (%) Scanning time (hr) Weight (grams)
Diamond 4 12 00:32:36 2.35 Diamond 4 15 00:33:43 3.32 Diamond 5 12 00:29:06 2.15 Diamond 5 15 00:30:30 3.05 Gyroid 3 8 00:26:51 1.51
Gyroid 3 12 00:33:39 2.32
Gyroid 3 15 00:35:03 3.20 Gyroid 4 8 00:23:11 1.44
Gyroid 4 12 00:28:40 1.94 Gyroid 4 15 00:30:07 2.60
Gyroid 5 12 00:26:21 1.89
Gyroid 5 15 00:28:55 2.54
Figure 9.6 Comparison of the laser scanning time of cellular support structures

183
Figure 9.7 2D slice view of single layer of lattice support structure
Figure 9.8 Comparison of the measured weights of lattice support structures
In addition, the unit cell size of the lattice support structure as though not
direct but influences the weight of lattice support structure. This is apparent in
Fig. 9.8, where smaller cell sizes weighted more than the bigger cell sizes when
the volume fraction is unchanged. This is because smaller cell sizes have
thinner struts, and thus high laser energy is concentrated in a smaller region
which leads to large melt pool increasing both the density of the structure and
chance of partial melting of the surrounding loose powder. SEM study also
confirms that wetting occurs to the surrounding loose powder particles which

184
are then attached to the struts of the lattice structures after re-solidification. The
attached powder particles remain on the structure after the build is completed,
especially if the structure has not gone through post-processing procedures
such as, sand or bead blasting which was the case in this study.
In this respect, Gyroid structure is the best cell type that provides more
material saving, has better manufacturability in low volume fractions, and is
faster to build compared to diamond structures. These characteristics make it
more favorable to be used as a cellular support structure for metallic parts.
9.5.3 Deformation analysis
In normal practice, all parts go through stress-relieving heat treatment
process prior to support structure removal, whereby all residual stresses are
released from the part. As shown in Fig. 9.9(a and b), the trapped stresses are
released through longitudinal deflection as expected and have similar shape
and little variation in amount (2.5–4 mm) over all the gyroid and diamond lattice
support structures. This uplifting or deflection is an indication of the amount of
residual stresses, which was present in the part. This is in good agreement with
other research findings by Shiomi et al. (2004) that residual stresses if not
properly released through heat treatment processes causes the part to deflect
after it is removed from base plat/platform and the supporting structure. In this
study, a component design (the cantilever) was deliberately chosen with a
geometry which would induce a significant stress due to its geometry, with a
right-angle corner and flat layer of solid part manufactured.
Since one of the primary functions of the support structure is to dissipate heat
away from the newly melted layers of the part, less heat is dissipated through
the support when less solid material is available underneath the newly melted
layer. Smaller cell sizes with higher volume fraction are the best candidates for
this purpose, because they have higher contacting surfaces with the part
enabling more heat transfer through conduction. Zaeh and Branner (2010)
stated that the number of support and location depend on the geometry of the
part and the building orientation. Other simulation work by Papadakis et al.
(2012) also demonstrated that wide meshed supports (i.e., support having
bigger gap) involve greater deformation of cantilever wings because of powder
inclusion and reduced heat conductivity. Additionally, the other process
parameters such as laser scanning energy, layer thickness and scanning
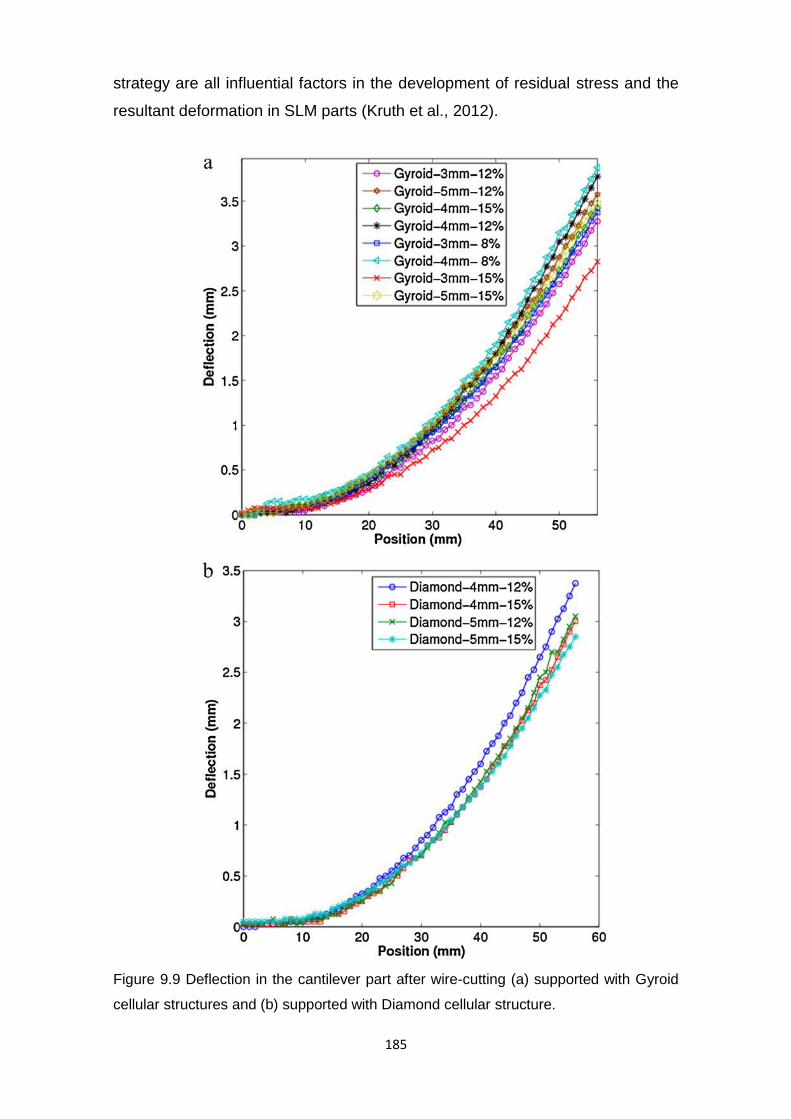
185
strategy are all influential factors in the development of residual stress and the
resultant deformation in SLM parts (Kruth et al., 2012).
Figure 9.9 Deflection in the cantilever part after wire-cutting (a) supported with Gyroid
cellular structures and (b) supported with Diamond cellular structure.

186
9.6 Conclusion
This chapter proposes a new and advanced cellular lattice support structures
for SLM/DMLS processes. Two types of lattice structure (Diamond and Gyroid)
have been investigated for their suitability as support structures in reducing
material and built-time while fulfilling the structural demands required from a
metallic support structure. The experimental results have revealed that a
potential material saving can be achieved when lattice support structure with
lower volume fractions is used. For example, it was possible to manufacture
Gyroid lattice structures with 8% of relative volume, which means more than
90% of loose powders, can be removed and reused. The unprocessed material
retrieval is a major benefit beyond the material saving achieved in low volume
support structure. Low volume fraction also allows minimum build time and
required energy for SLM parts.
The lattice support structures show good manufacturability characteristics;
however, some of the parts failed during the build. For big cell sizes, the
distance between the adjacent contact points to the supported surface is too
large; therefore, there is too much material that is unsupported and the part is
distorted by the thermal stresses. The volume fraction is the prominent factor
influencing the scanning time, it is therefore important to keep it very low
provided it can be manufactured. Small cell sizes take longer time to build
compared to bigger cells when the volume fractions is unchanged, because of
the more time needed in scanning the outer contours of increased cell struts.
It should be noted that many factors have to be considered during the design
and manufacturing of more efficient lattice support structures. A compromise
has to be reached between the best combination of cell size and volume
fraction that is manufacturable, fast to build, easy to remove and has good
thermal and mechanical properties to constrain deformation while ensuring
reliable build for the part. In addition, different parts and their geometries might
set up different requirements and preferences for the design of lattice support
structures.
The gyroid cell type has better manufacturability in low volume fractions, and
is faster to build compared to diamond type. These characteristics make it more
favorable to be used as a cellular support structure for metallic parts. Therefore,
it is recommended to use gyroid cell type with low volume fraction of up to 8%
and cell sizes equal or less than 3mm. The data and findings presented in this

187
study could provide valuable information and guidance for the selection and
design of lattice support structures. In addition, it has built a foundation for
future research and development to design graded lattice support structures to
meet different requirements simultaneously.

188
CHAPTER 10
Developing Functionally Graded Cellular Support
Structures for Metal Additive Manufacturing
10.1 Introduction
This chapter aims to further develop the work in chapter 9 on uniform cellular
support structures by designing a novel and low-density functionally graded
cellular support structure for metal AM parts. The results of chapter 9 have
shown that some of the cantilever parts supported with large cell sizes did not
build, because of the large gap between adjacent support points. It was also
found that small cell sizes are the suitable for dissipating heat, because they
have higher contacting surfaces with the part enabling more heat transfer
through conduction. In this work, graded cellular support was developed to meet
the functional and support requirements of both internal and external
overhanging geometries.
10.2 Graded Cellular Support Structures
Functionally graded cellular structures are those where a property is
deliberately varied within the structure (Ajdari et al. 2011). These cellular
structures can be engineered to meet specific requirements such as a superior
mechanical, thermal, and acoustic behaviour. Fig 10.1 shows the CAD models
of graded Schoen gyroid cellular structure used for the generation of the
support structures. Gyroid structure was selected as it provides more material
saving, has better manufacturability in low volume fractions, and is faster to
build compared to diamond structures. In this work, a form of functionally
graded structures was studied. This involves varying the local volume fraction
and cell size of the cellular structure with position. This has been done in two
different ways, both in a smoothly varied way, and also in the form of step-
graded structures, with abrupt transitions between different regions.
The gyroid cellular structure was graded to meet functional requirements of
both internal and external support structure in metal AM. Fig 10.1(a) shows the
generated gyroid structure with a uniform volume fraction of 8 % throughout the
part while Fig 10.1(b and c) shows smoothly graded structures with volume

189
fraction exponentially increased from 8% at the bottom to 50% or 100 %
towards the vertical top surface of the part. Fig 10.1(d) shows step-graded
cellular structure with a thin solid layer separating the big and small cell sizes.
Fig 10.1(e) shows internal graded cellular structure with increasing density
towards the surface of the cube. To generate graded cellular structure the
volume fraction % and the distance to vary the volume fraction over should be
selected as depicted in the exponential variation curve in Fig. 10.1 (f). The
transition function was implemented in the ScanIP tool of Simpleware software.
Figure 10.1 CAD models of the Schoen gyroid cellular structure (a) ungraded uniform
structure (b) Graded structure 8% - 50% (c) Graded structure 8% -100% (d) Step
graded with solid layer separating the two cell sizes (e) Internal graded cellular
structure with increasing density towards the surface (f) Exponential transition function
for the smoothly graded cellular structures
10.3 Experimental Procedure
10.3.1 Design process
Fig. 10.2 (a-d) shows cantilever parts with dimensions 58mm x 15mm x
10mm and overhang thickness of 2mm, supported by the graded Schoen gyroid
cellular structure shown in Fig. 10.1. The large overhanging of the cantilever
(a) (b) (c)
(e) (d)
(f)

190
cannot be manufactured in the DMLS process without support and so was
chosen for studying the effectiveness of the cellular support in this role and to
collect data on cantilever deformation. In Fig. 10.2 (a) a vertical step grading of
gyroid cellular support structure was used that has a big cell sizes (3-5mm)with
lower volume fractions (6-7%) at the bottom section and a small cell sizes (0.8-
1mm)with higher volume fractions(10-15%) in contact with the cantilever part.
The transition from big cell size to small cell size is achieved by placing a thin
solid layer between the two cell sizes. The small cell size at the interface
enables many contact points on the cantilever overhang bottom surface and
smaller gaps between the supporting points of lattice struts, thus improving both
the manufacturability of the cantilever and the subsequent removal of cellular
support structure after the build is complete. A bigger cell size is used in the
lower 80% of the support to speed up the building process and enable easy
removal of loose (unmelted) powder trapped in the structure during the build.
In Fig. 10.2 (b), a horizontal side-graded cellular support structure was used
that has a small cell size (2mm) with higher volume fraction (8-12%) around the
edges and a big cell size (4-5mm) with lower volume fraction (6-7%) in the
middle portion of the support. The cell structures are strengthened around the
edges due to an expected higher stress from the manufacturing process, which
can result a curling effect on cantilever edges. In Fig. 10.2 (c), a vertical
smoothly graded cellular support was generated using an exponential
densification function which takes into account the volume fraction % and the
distance to vary the volume fraction over. The volume fraction of the lower part
of the support is varied gradually from 6% to full density of 100%. Small cell-
size structures (0.5-1.5mm) with 15% volume fraction are then placed at the
interface in contact with supported cantilever surface. Fig 10.2 (d) shows a
perforated thin boundary wall or shell (thickness=0.5mm) used along with
cellular support structure to improve the support stiffness, dimensional accuracy
on cantilever edges, and withstand thermal distortions. Fig 10.2 (e) shows
curved convex geometry supported by cellular support structure with 0.5-
1mmcell size and 15% volume fraction. Fig 10.2 (f) shows permanent internal
cellular structures (cell size 3-4mm, volume fractions 8-60%) with boundary
shell thickness of 2 mm for lightweight applications.
The test geometries with the internal and external cellular support structure
were exported as a single STL (standard tessellation language) file into the
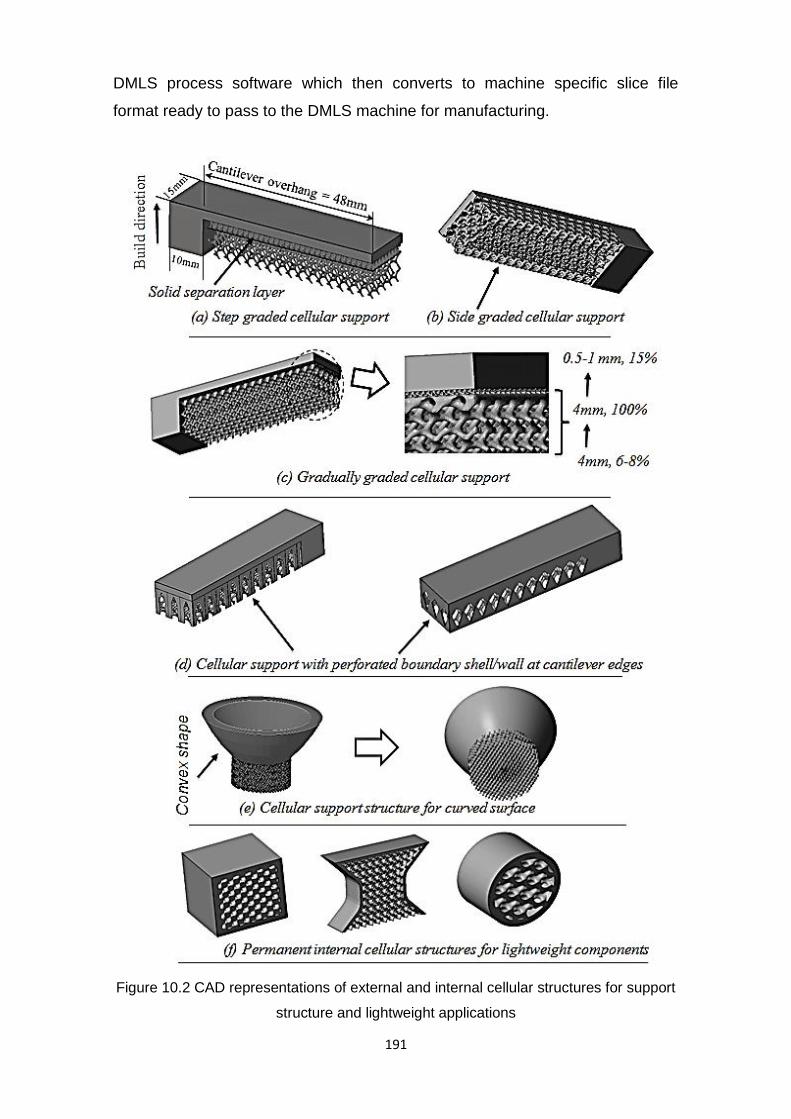
191
DMLS process software which then converts to machine specific slice file
format ready to pass to the DMLS machine for manufacturing.
Figure 10.2 CAD representations of external and internal cellular structures for support
structure and lightweight applications

192
10.3.2 Manufacturing Process
The experiments were conducted at 3T RPD Ltd. UK using DMLS EOSINT
M270 machine manufactured by EOS GmbH, Munich, Germany. The oxygen
content in the chamber was kept below <0.13% and a fixed layer thickness of
30 µm is used for both the part and the cellular support structure. The material
used was titanium alloy powder (Ti6Al4V) supplied by LPW Technology Ltd.,
UK. For further details on process parameters, refer to chapter 3 (materials and
methods).
10.3.3 Characterisation and Analysis
The manufacturability of the graded cellular support was evaluated through
visual inspection to judge the success and failure of part building. A sample of
the powder was studied in scanning electron microscope (SEM - Hitachi S-
3200N) to investigate the shape and morphology of the particles. No stress
relieving heat treatment (part of the standard full manufacturing sequence for
this process) was performed to allow investigation of the residual stresses in the
manufactured cantilever parts.
Wire-Electric Discharge Machine (EDM) was used to separate the cellular
support from the cantilever part. The resulting deflection in the cantilever
overhang was measured using a Roland MDX-20. This is a 3D scanner for
scanning 3D objects and creating 3D cloud data by using a moving needle
probe to touch the surface of the object and record data points. “Dr. PICZA”
scanning software installed on this machine was used for dynamic graphic
display, curve smoothing, and adjusting the height of the scanned surface. The
scanned data was exported as a point cloud data (ASCII) and processed in
MATLAB software for visualization. Digital optical scan (Dino-Lite) was used for
measuring the strut size of the cellular structure and for measuring the
dimensional accuracy of the manufactured cantilever part.
10.4 Results and Discussion
10.4.1 Manufacturability analysis
As depicted in Fig. 10.3(a and b), different geometries with external and
internal cellular structures and varying cell size and volume fractions were
manufactured in the DMLS machine. This includes cell sizes varying from 0.5
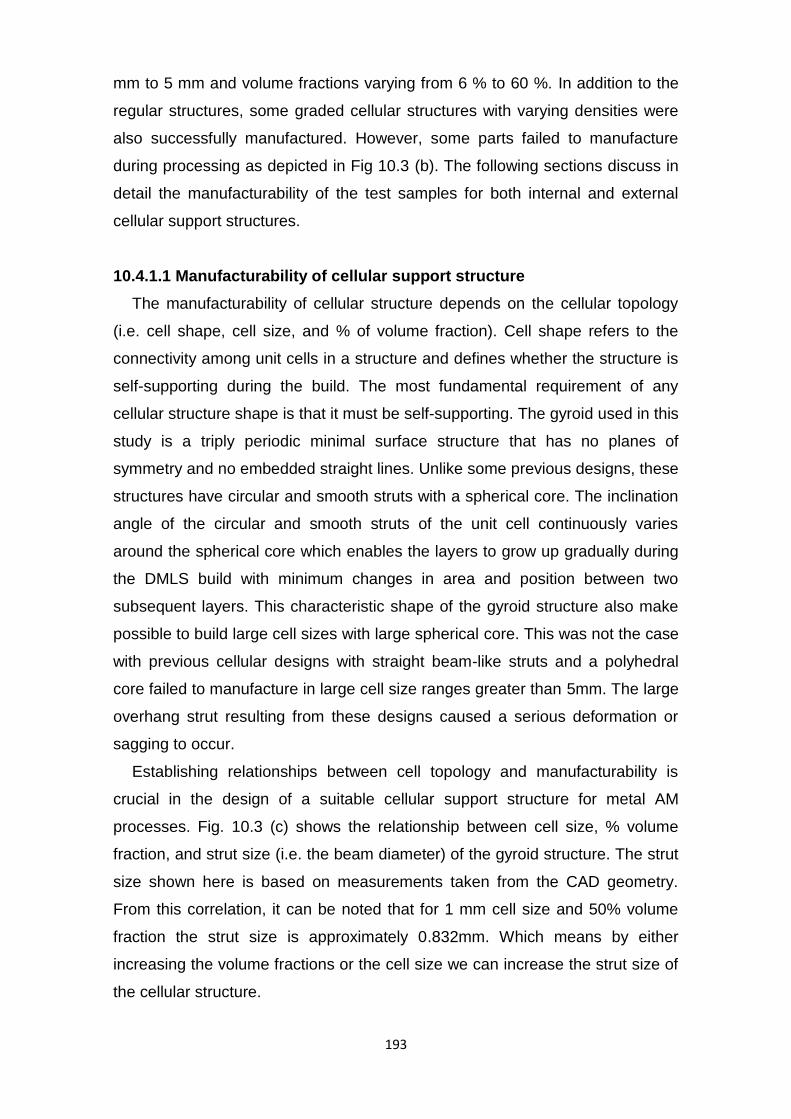
193
mm to 5 mm and volume fractions varying from 6 % to 60 %. In addition to the
regular structures, some graded cellular structures with varying densities were
also successfully manufactured. However, some parts failed to manufacture
during processing as depicted in Fig 10.3 (b). The following sections discuss in
detail the manufacturability of the test samples for both internal and external
cellular support structures.
10.4.1.1 Manufacturability of cellular support structure
The manufacturability of cellular structure depends on the cellular topology
(i.e. cell shape, cell size, and % of volume fraction). Cell shape refers to the
connectivity among unit cells in a structure and defines whether the structure is
self-supporting during the build. The most fundamental requirement of any
cellular structure shape is that it must be self-supporting. The gyroid used in this
study is a triply periodic minimal surface structure that has no planes of
symmetry and no embedded straight lines. Unlike some previous designs, these
structures have circular and smooth struts with a spherical core. The inclination
angle of the circular and smooth struts of the unit cell continuously varies
around the spherical core which enables the layers to grow up gradually during
the DMLS build with minimum changes in area and position between two
subsequent layers. This characteristic shape of the gyroid structure also make
possible to build large cell sizes with large spherical core. This was not the case
with previous cellular designs with straight beam-like struts and a polyhedral
core failed to manufacture in large cell size ranges greater than 5mm. The large
overhang strut resulting from these designs caused a serious deformation or
sagging to occur.
Establishing relationships between cell topology and manufacturability is
crucial in the design of a suitable cellular support structure for metal AM
processes. Fig. 10.3 (c) shows the relationship between cell size, % volume
fraction, and strut size (i.e. the beam diameter) of the gyroid structure. The strut
size shown here is based on measurements taken from the CAD geometry.
From this correlation, it can be noted that for 1 mm cell size and 50% volume
fraction the strut size is approximately 0.832mm. Which means by either
increasing the volume fractions or the cell size we can increase the strut size of
the cellular structure.

194
Figure 10.3 (a) and (b) External and internal cellular support structures manufactured in
DMLS machine (c) relationship between cell size, % volume fraction, and strut size
[DMLS M270, Ti-6Al-4V]
Low volume fractions are desirable for external support structure in
minimizing build time and material, while higher volume fractions are suitable for
permanent internal structures where a combination of light-weight and high
strength is needed. In our experimental study, external cellular support with
3mm cell sizes and 6% volume fraction was built without failure. This
combination yields a strut size of approximately 0.3mm which is the safe
manufacturing region for this cell size. The 6% volume fraction was intentionally
used in the lower section of the cellular support to speed up the scanning time
and maximise material saving. This has resulted a significant saving in both
material and energy consumption. For the smaller cell sizes used at the support
and part interface, it was possible to build a minimum strut size of 0.127mm for
0.5mm cell size and 15% volume fraction. This strut size could not be achieved
in bigger cell sizes due to a lack of cell connectivity and will probably cause
(a) (b)
(c)

195
manufacturing failure. The height and overhang resulting from 0.5mm-1mm cell
sizes is very small and unlikely to cause a manufacturing failure during the
build.
The DMLS process allows a choice of powder recoater blade including steel,
ceramic and a soft brush; however one recoater must be used for the full build,
including both support structures and the supported part. The soft brush coater
is used for building delicate and fragile structures but cannot achieve full
powder density due to the lower compaction applied to powder layer , and so is
of little use for building functional parts. Although all our tests were performed
on hard steel recoater, it could be possible to build cellular structures with
smaller strut sizes by using the brush recoater. As the build height increases,
the density of surrounding powder also offers some structural stability to
withstand recoater forces during the build. Recoating is one area where
different brands of machine differ. The broadly similar SLM process uses a
silicone elastomer recoater as the default choice.
10.4.1.2 Manufacturability of supported surface
The geometric shape, size, and orientation of the part alter the amount and
type of support needed, as downward facing regions of part need to be fixed to
the platform under the build area. This is also affected by the material being
manufactured, with some materials requiring a higher amount of support than
others, due to larger mechanical stresses building up during the build process.
Of the standard materials used in DMLS, the Ti64 as used in this study is
considered the most difficult material to build due to the high reactivity (Thijs et
al. 2010), and has the highest demands on its support structures. The first
overhanging layer which is supported is crucial for a successful build as it lays
the foundation for subsequent upper layers of the part. Thermal distortions in
particular are a problem to the manufacturing technique, as if they obstruct the
blade spreading powder for the next layer can cause a machine crash, stopping
the machine and leaving all partially-built items incomplete.

196
Figure 10.4 (a) Stages of building the cantilever part and graded cellular support
simultaneously layer-upon-layer (b) Distorted cantilever edges during the build (c) Gap
between adjacent supports points of graded cellular structure (d) Support pins used to
facilitate the removal of the support.
The effectiveness of the support is determined by the structural strength of
the cellular structures and the gap between adjacent support points in contact
with the part. The smaller the gap the more effective the support is in controlling
the thermal distortions in overhang regions. As shown in Fig 10.3 (b) some
cantilever parts with step graded cellular support have failed to build. There was
a large unsupported region measuring > 2mm horizontally in the transition
between lower bigger cells (cell size=3-4mm, volume fraction=6%) and upper
smaller cells (cell size=0.5-1mm volume fraction=15%). The gap here refers to
the size of the pore between the struts of the cellular structure as shown in Fig.
(a)
(b)
(d)
(c)
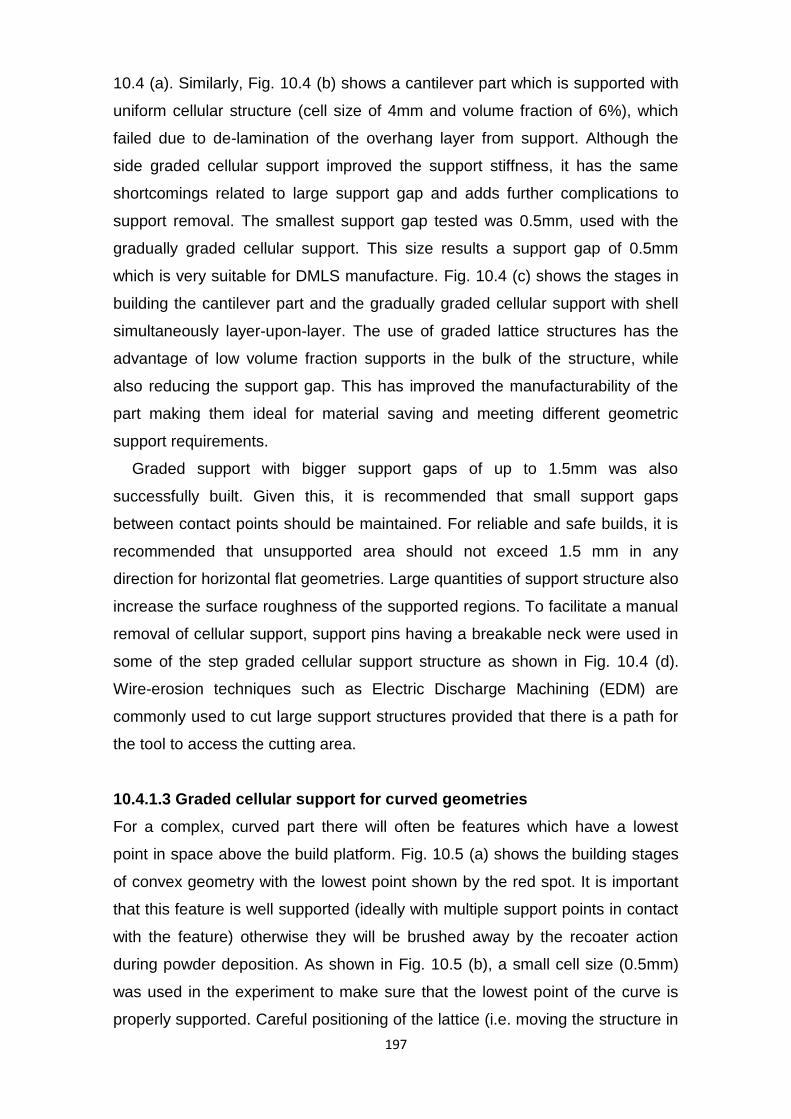
197
10.4 (a). Similarly, Fig. 10.4 (b) shows a cantilever part which is supported with
uniform cellular structure (cell size of 4mm and volume fraction of 6%), which
failed due to de-lamination of the overhang layer from support. Although the
side graded cellular support improved the support stiffness, it has the same
shortcomings related to large support gap and adds further complications to
support removal. The smallest support gap tested was 0.5mm, used with the
gradually graded cellular support. This size results a support gap of 0.5mm
which is very suitable for DMLS manufacture. Fig. 10.4 (c) shows the stages in
building the cantilever part and the gradually graded cellular support with shell
simultaneously layer-upon-layer. The use of graded lattice structures has the
advantage of low volume fraction supports in the bulk of the structure, while
also reducing the support gap. This has improved the manufacturability of the
part making them ideal for material saving and meeting different geometric
support requirements.
Graded support with bigger support gaps of up to 1.5mm was also
successfully built. Given this, it is recommended that small support gaps
between contact points should be maintained. For reliable and safe builds, it is
recommended that unsupported area should not exceed 1.5 mm in any
direction for horizontal flat geometries. Large quantities of support structure also
increase the surface roughness of the supported regions. To facilitate a manual
removal of cellular support, support pins having a breakable neck were used in
some of the step graded cellular support structure as shown in Fig. 10.4 (d).
Wire-erosion techniques such as Electric Discharge Machining (EDM) are
commonly used to cut large support structures provided that there is a path for
the tool to access the cutting area.
10.4.1.3 Graded cellular support for curved geometries
For a complex, curved part there will often be features which have a lowest
point in space above the build platform. Fig. 10.5 (a) shows the building stages
of convex geometry with the lowest point shown by the red spot. It is important
that this feature is well supported (ideally with multiple support points in contact
with the feature) otherwise they will be brushed away by the recoater action
during powder deposition. As shown in Fig. 10.5 (b), a small cell size (0.5mm)
was used in the experiment to make sure that the lowest point of the curve is
properly supported. Careful positioning of the lattice (i.e. moving the structure in

198
X,Y or Z by fractions of a unit cell) in relation to this location can also be
considered to ensure good connectivity at this critical point in the manufacture.
Adaptive graded cellular support can be effectively used for curved geometries
which require higher support height and as part complexity increases to meet
the different support requirement for different regions.
Figure 10.5 (a) CAD model showing the cellular support stages for curved geometry (b)
DMLS manufactured part using small cell sizes.
10.4.1.4 Permanent internal lattice structures for lightweight applications
As was shown in Fig. 10.3 (a), cylindrical and cubic parts with internal cellular
structures surrounded by a boundary shell of 2mm were manufactured in
DMLS. The structural requirement of internal lattice structure is different to
external cellular support structures. Internal lattice structures remain in the final
component and are used as lightweight permanent structures and must provide
sufficient strength and structural rigidity to meet part loading conditions.
Compare this to the external lattice support structures previously discussed,
which are temporary and just used to enable the manufacturing of complex
overhang geometries during the build. Similar to external support, the internal
structures must be manufacturable in the process and similarly they also act as
support on the downward facing surfaces within cavities. Internal cellular
structures with high volume fractions or graded ones allow small distances
between support points and thus improve manufacturability of the most difficult
case, the horizontal flat surface. Cylinder and concave geometries if self-
supporting may not require support unless the internal radius is large causing
an overhang upper section.
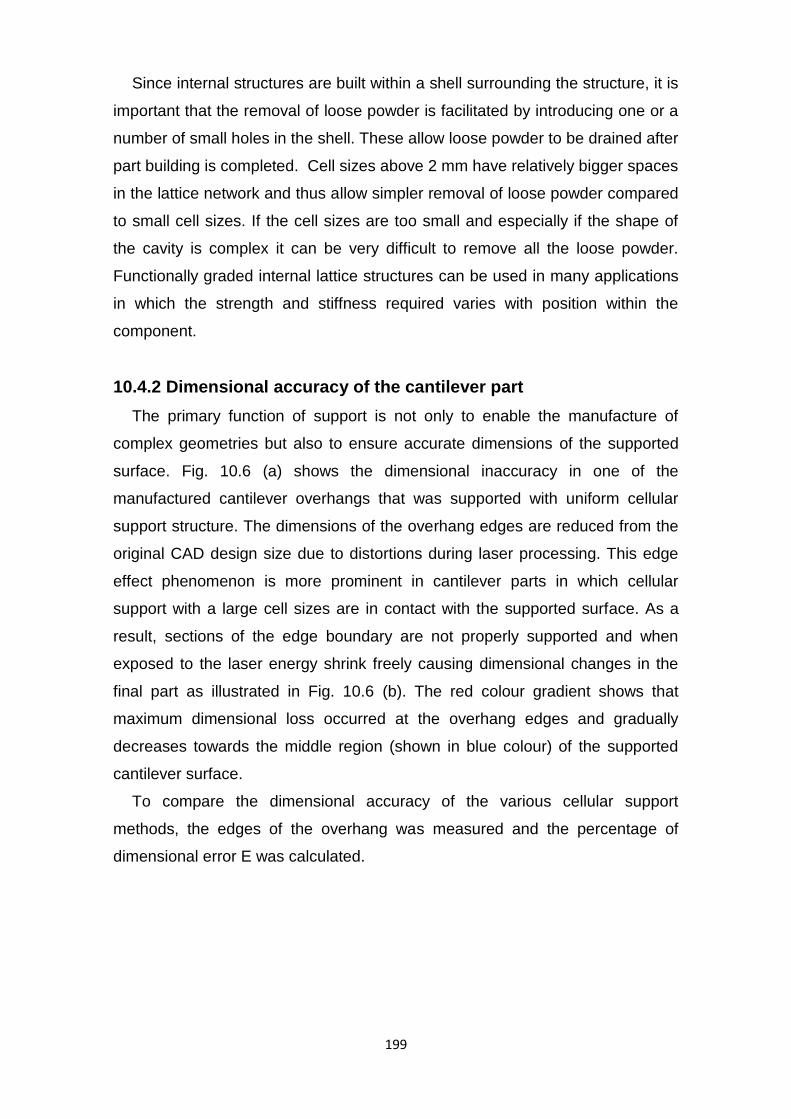
199
Since internal structures are built within a shell surrounding the structure, it is
important that the removal of loose powder is facilitated by introducing one or a
number of small holes in the shell. These allow loose powder to be drained after
part building is completed. Cell sizes above 2 mm have relatively bigger spaces
in the lattice network and thus allow simpler removal of loose powder compared
to small cell sizes. If the cell sizes are too small and especially if the shape of
the cavity is complex it can be very difficult to remove all the loose powder.
Functionally graded internal lattice structures can be used in many applications
in which the strength and stiffness required varies with position within the
component.
10.4.2 Dimensional accuracy of the cantilever part
The primary function of support is not only to enable the manufacture of
complex geometries but also to ensure accurate dimensions of the supported
surface. Fig. 10.6 (a) shows the dimensional inaccuracy in one of the
manufactured cantilever overhangs that was supported with uniform cellular
support structure. The dimensions of the overhang edges are reduced from the
original CAD design size due to distortions during laser processing. This edge
effect phenomenon is more prominent in cantilever parts in which cellular
support with a large cell sizes are in contact with the supported surface. As a
result, sections of the edge boundary are not properly supported and when
exposed to the laser energy shrink freely causing dimensional changes in the
final part as illustrated in Fig. 10.6 (b). The red colour gradient shows that
maximum dimensional loss occurred at the overhang edges and gradually
decreases towards the middle region (shown in blue colour) of the supported
cantilever surface.
To compare the dimensional accuracy of the various cellular support
methods, the edges of the overhang was measured and the percentage of
dimensional error E was calculated.
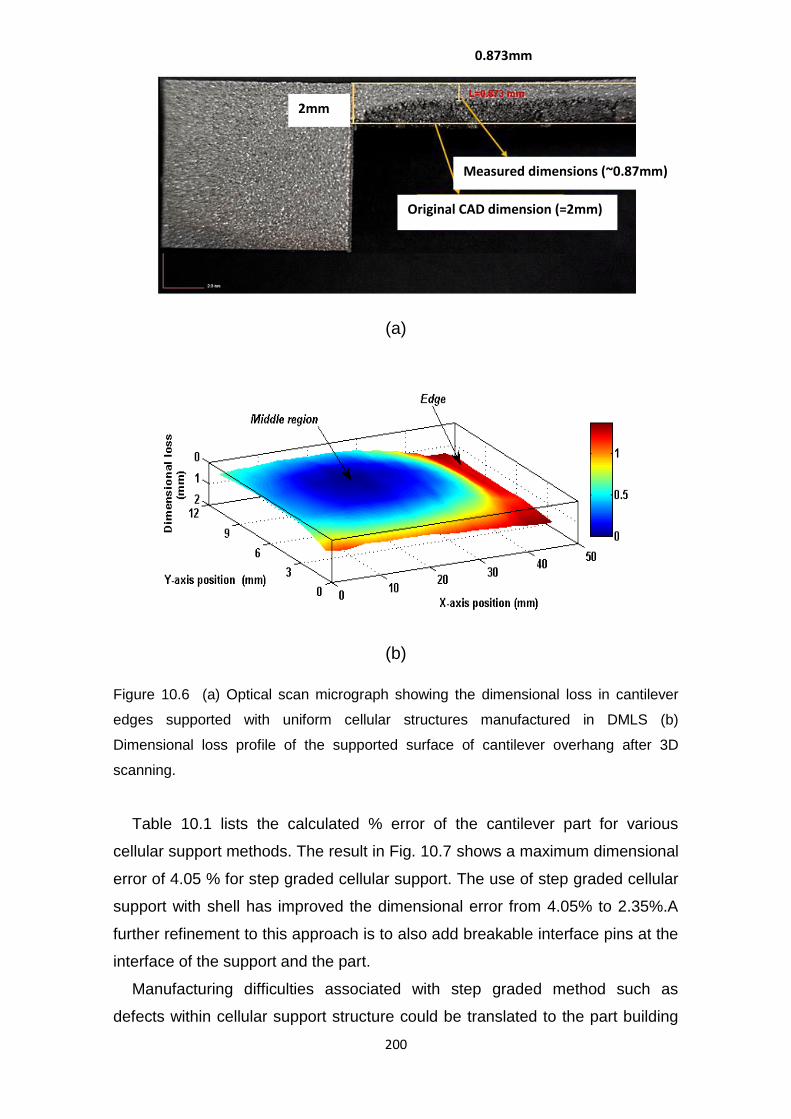
200
(a)
(b)
Figure 10.6 (a) Optical scan micrograph showing the dimensional loss in cantilever
edges supported with uniform cellular structures manufactured in DMLS (b)
Dimensional loss profile of the supported surface of cantilever overhang after 3D
scanning.
Table 10.1 lists the calculated % error of the cantilever part for various
cellular support methods. The result in Fig. 10.7 shows a maximum dimensional
error of 4.05 % for step graded cellular support. The use of step graded cellular
support with shell has improved the dimensional error from 4.05% to 2.35%.A
further refinement to this approach is to also add breakable interface pins at the
interface of the support and the part.
Manufacturing difficulties associated with step graded method such as
defects within cellular support structure could be translated to the part building
2mm
0.873mm
mm
Measured dimensions (~0.87mm)
Original CAD dimension (=2mm)
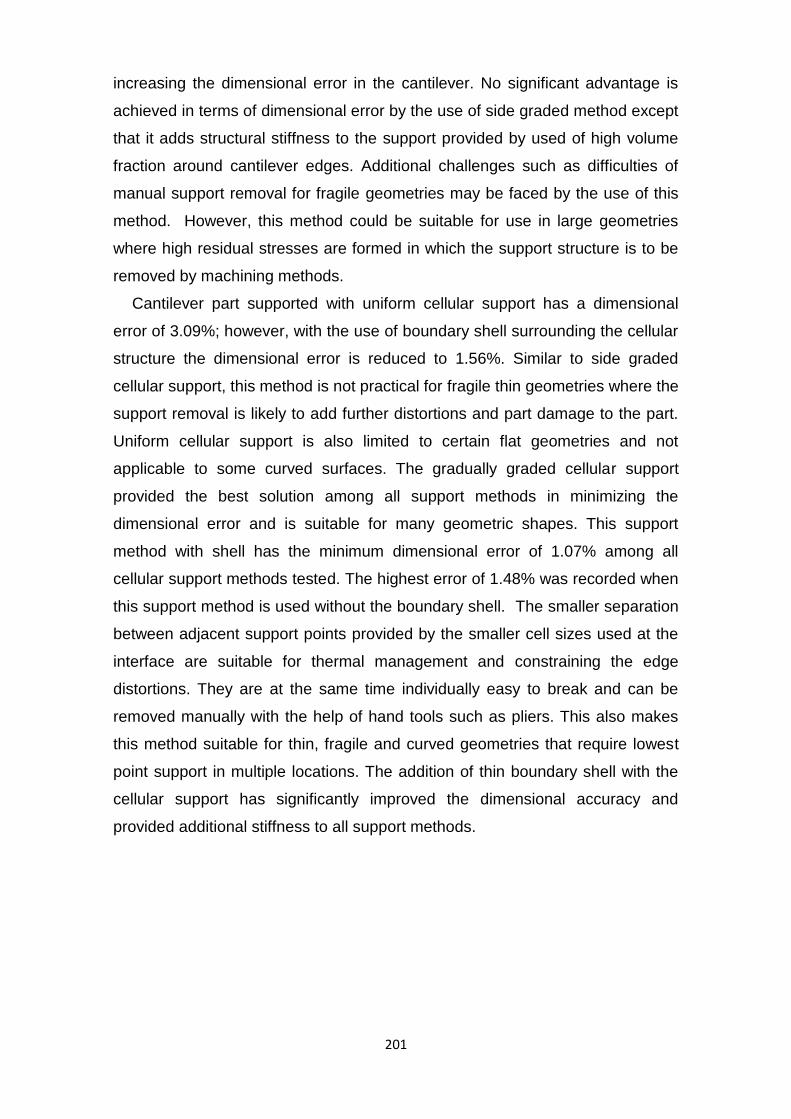
201
increasing the dimensional error in the cantilever. No significant advantage is
achieved in terms of dimensional error by the use of side graded method except
that it adds structural stiffness to the support provided by used of high volume
fraction around cantilever edges. Additional challenges such as difficulties of
manual support removal for fragile geometries may be faced by the use of this
method. However, this method could be suitable for use in large geometries
where high residual stresses are formed in which the support structure is to be
removed by machining methods.
Cantilever part supported with uniform cellular support has a dimensional
error of 3.09%; however, with the use of boundary shell surrounding the cellular
structure the dimensional error is reduced to 1.56%. Similar to side graded
cellular support, this method is not practical for fragile thin geometries where the
support removal is likely to add further distortions and part damage to the part.
Uniform cellular support is also limited to certain flat geometries and not
applicable to some curved surfaces. The gradually graded cellular support
provided the best solution among all support methods in minimizing the
dimensional error and is suitable for many geometric shapes. This support
method with shell has the minimum dimensional error of 1.07% among all
cellular support methods tested. The highest error of 1.48% was recorded when
this support method is used without the boundary shell. The smaller separation
between adjacent support points provided by the smaller cell sizes used at the
interface are suitable for thermal management and constraining the edge
distortions. They are at the same time individually easy to break and can be
removed manually with the help of hand tools such as pliers. This also makes
this method suitable for thin, fragile and curved geometries that require lowest
point support in multiple locations. The addition of thin boundary shell with the
cellular support has significantly improved the dimensional accuracy and
provided additional stiffness to all support methods.

202
Table 10.1-Dimensional error of the cantilever overhang edges
Measured location
AO Dimensional error, E (%)
(mm) (mm) 1 2 3 4 5 6 7 8
Thickness:
X = 12 , Y = 0 2 1.00 0.50 3.94 4.27 6.36 4.37 1.02 1.51
X = 29 , Y = 0 2 5.50 3.70 5.61 10.81 12.20 0.56 10.50 4.50
X = 58 , Y = 0 2 2.50 6.15 6.56 1.03 4.66 9.41 0.00 4.37
X = 12 , Y = 15 2 1.50 0.49 1.47 10.14 4.30 7.73 16.20 12.50
X = 29 , Y = 15 2 1.00 1.01 1.00 6.93 0.53 3.74 9.44 9.64
X = 58 , Y = 15 2 6.00 3.72 1.54 4.04 2.63 4.86 4.64 3.24
X = 58 , Y = 7.5 2 10.50 10.06 0.76 6.30 1.61 8.20 4.17 1.14
Width, w 15 1.67 0.52 0.07 0.07 0.20 0.26 0.26 0.59
Length, l 58 0.16 0.02 0.10 0.02 0.16 0.07 0.02 0.05
Average, E (%) 2.35 1.42 1.07 1.48 1.56 3.09 4.05 3.79
Figure 10.7 Average dimensional error of the measured cantilever part
Cellular support method:
1. Step graded cellular support with shell (3mm-pins, 6%) 2. Gradually graded cellular support (4-0.6mm, 8-100-15%) 3. Gradually graded cellular support with shell (4-0.5mm, 8-100-15%) 4. Gradually graded cellular support (4-0.7mm, 8-60-15%) 5. Uniform cellular support with shell (3mm, 6%) 6. Uniform cellular support with shell (3.5mm, 6%) 7. Step graded cellular support (3mm-pins, 6%) 8. Side graded cellular support (4-2mm, 6-10%)

203
10.4.3 Deflection method for estimating the residual stress
AM processes accumulate residual stresses during material build-up.
Residual stresses can be defined as the stresses that remain within a material
or body after manufacture and material processing in the absence of external
forces or thermal gradients (Rossini et al. 2012). The expansion or contraction
associated with a newly melted layer in metal AM processes is constrained by
the preceding layers of part and/or support structure which generates significant
residual stress in most metallic materials. The engineering properties of
materials, notably fatigue life, distortion, dimensional stability, layer
delamination, corrosion resistance, and brittle fracture can be considerably
influenced by residual stresses (Totten et al. 2002). To avoid this, usual
manufacturing of metal parts by AM processes would always include a stress-
relieving heat treatment cycle before removal of all supports from the
component.
Over the years, different methods have been developed to measure residual
stress for different types of components in order to obtain reliable assessment
(Lu, 1996). In this study, we used a splitting method (Walton 2002; Baldwin
1949), to estimate residual stress present in the part by removing some of the
constraints and observing the distortion obtained as stresses relax. This is a
destructive method that relies on the measurement of deflection due to the
release of residual stress upon removal of support from the cantilever part.
To develop a mathematical model for interpreting deflection measurements
after slitting or separating the cantilever part from the lattice support, a simple
beam theory is used (Gordon, 1968):
(10.1)
Where M is the bending moment to which the beam is subjected. Bending
moment M is equal to load multiplied by distance (N. m). I is the moment of
inertia of the section of the beam, usually in (m4). R is the radius of curvature of
the beam when it bends under load in (m). E is the Young’s modulus (Pa). C is
the distance from neutral mid-point axis (m). is the stress in the material in
(Pa).
For a rectangular beam at the surface where the stress is greatest:
(10.2)

204
Where b and t are the width and thickness of the part cross section,
respectively.
The distribution of residual stress in the deflected cantilever in Fig. 10.8 is
unlikely to be exactly linear due to cyclic variation corresponding to differences
in heating and cooling rates in different parts of the component. However, to
enable analysis, this approximation is made and the beam stress is assumed to
vary linearly through the section. The bending moment created by the residual
stress may be expressed as:
(10.3)
Given that:
Therefore,
(10.4)
R may be expressed in terms of the deflection, d, and the length of the curved
surface, L, by:
(10.5)
Therefore,
(10.6)
Figure 10.8 Determination of residual stresses by deflection method
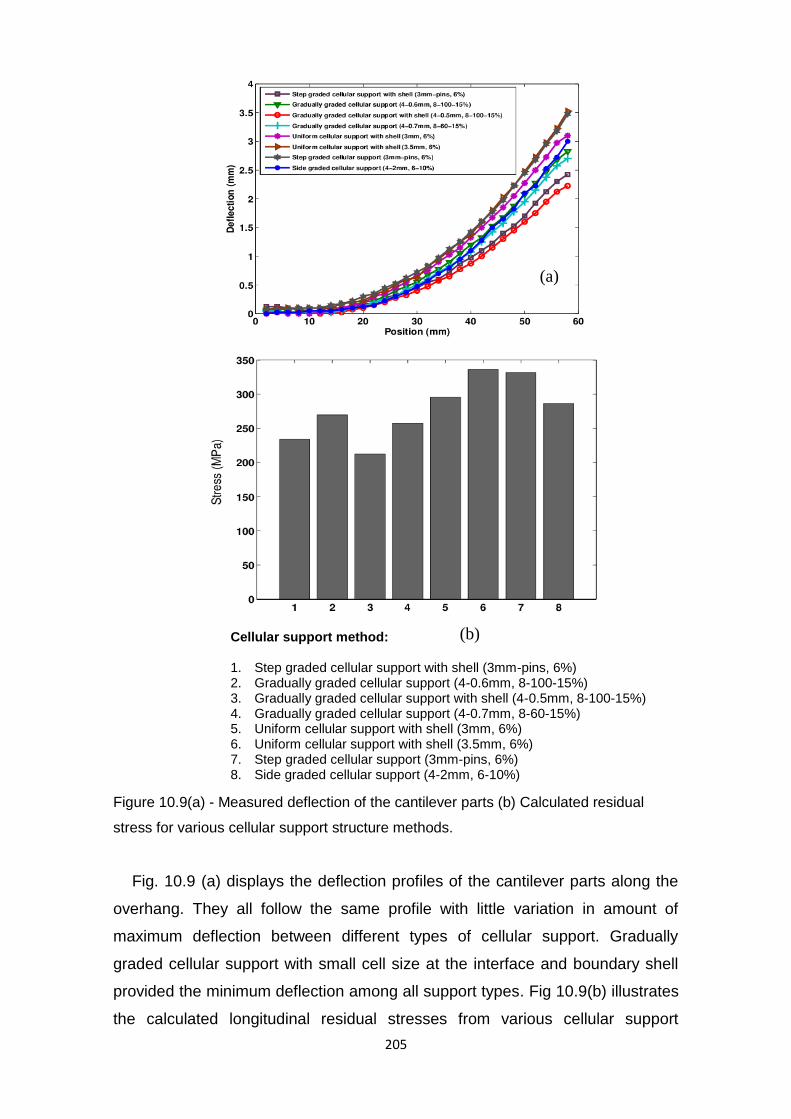
205
Figure 10.9(a) - Measured deflection of the cantilever parts (b) Calculated residual
stress for various cellular support structure methods.
Fig. 10.9 (a) displays the deflection profiles of the cantilever parts along the
overhang. They all follow the same profile with little variation in amount of
maximum deflection between different types of cellular support. Gradually
graded cellular support with small cell size at the interface and boundary shell
provided the minimum deflection among all support types. Fig 10.9(b) illustrates
the calculated longitudinal residual stresses from various cellular support
(a)
Cellular support method: 1. Step graded cellular support with shell (3mm-pins, 6%) 2. Gradually graded cellular support (4-0.6mm, 8-100-15%) 3. Gradually graded cellular support with shell (4-0.5mm, 8-100-15%) 4. Gradually graded cellular support (4-0.7mm, 8-60-15%) 5. Uniform cellular support with shell (3mm, 6%) 6. Uniform cellular support with shell (3.5mm, 6%) 7. Step graded cellular support (3mm-pins, 6%) 8. Side graded cellular support (4-2mm, 6-10%)
(b)
206
structure methods used for the cantilever overhang. The depth and intensity of
the residual stresses is proportional to the lift height. The maximum calculated
longitudinal stress is (336.59 MPa) for cellular structure with shell and the
lowest is (212.46 MPa) for exponentially graded lattice support structures with
small cell sizes in contact with the part. The more rigid the design of lattice
structure, the higher the resulting residual stress. Lattice structures having
higher volume fractions are more rigid compared to lower volume fractions.
Rigidity of the structure is also influenced by the interface structures which are
in contact with the cantilever.
The levels of residual tensile stress may become high for large geometries
which are built horizontally requiring large areas of support material.
Catastrophic fracture can occur due to cracking when the tensile stress level
exceeds the cohesive strength of the material, and may sometimes lead to
stopping the manufacturing process and preventing the part being completed.
As such, premature failure due to residual surface tensile stress in the
manufactured product is to be avoided at all costs. Stress-induced deformations
can be avoided by passing the component through stress-relieving heat
treatment process prior to support structure removal, whereby most residual
stresses (depending on exact cycle chosen) are released from the part,
although to get to this stage the manufacturing process needs to complete the
component first.
10.5 Conclusion
In this study, a novel graded cellular support structure was developed for
metal additive manufacturing. Experimental tests were conducted using a
DMLS machine on different geometries, manufactured using commercially
available Titanium alloy (Ti-6Al-4V). The manufacturability, dimensional
accuracy, and resultant residual stresses of manufactured parts were
investigated to compare the effectiveness of various graded cellular support
structure methods. It was found that the manufacturability of cellular structure
is influenced by the cellular topology (i.e. cell shape, cell size, and % of
volume fraction). External cellular support with 3mm cell sizes and 6% volume
fraction was built without failure. The 6% volume fraction was intentionally
used in the lower section of the cellular support to speed up the scanning time
and provide 94 % material saving. The minimum strut size that was built is

207
0.127mm for 0.5mm cell size and 15% volume fraction.
Some cantilever parts supported with step graded cellular support have
failed to build. There was large unsupported region > 2mm in the transition
between lower bigger cells and upper smaller cells separated by thin solid
layer. The smallest support gap tested was 0.5mm, used in the gradually
graded cellular support. This size results a support gap of 0.5mm which is
very suitable for DMLS manufacture. Given this, it is recommended that small
support gaps between contact points should be maintained. The gradually
graded cellular support provided a minimum dimensional error of 1.07 % for
the cantilever part among all support methods tested. A maximum error of
4.05 % was calculated for step graded support. The maximum calculated
longitudinal stress is (336.59 MPa) for uniform cellular support with shell and
the lowest is (212.46 MPa) for gradually graded cellular support.
Overall, the use of gradually graded cellular support structures has
improved the manufacturability of both the cellular structure and the supported
part. The potential material saving combined with multi-functionalities they
offer, makes them suitable for internal lightweight and external support
structure applications of metal additive manufacturing. These graded cellular
structures are applicable to various metallic materials and machines used in
AM industry, in particular, the powder bed fusion processes. The enhanced
manufacturability due to the gradient density combined with the lightweight
functionalities will promote the design of more advanced and complex
components that were difficult before.

208
CHAPTER 11
Conclusions and Future Recommendations
This study has investigated the manufacturability and mechanical behaviour
of advanced lightweight cellular structures in metal AM processes. The cellular
structures used in the research are based on Triply Periodic Minimal Surface
(TPMS) cell topologies. Comprehensive experimental tests were conducted at
different cell topologies using commercially available 316L stainless steel,
Titanium alloy (Ti-6Al-4V), and Aluminium alloy (AlSi10Mg) metal powders. The
experiments were performed in SLM MCP Realizer and the DMLS EOSINT
M270/M280, two of the most commonly used metal AM systems. The finite
element method was used to simulate the temperature and stress fields of
unsupported overhang layers built in SLM process.
It was found that the manufacturability of cellular structure is influenced by
the cellular topology (i.e. cell shape, cell size, and % of volume fraction). Gyroid
and Diamond structure prove to be suitable for SLM/MDLS processes. The
minimum strut size that was built was 0.127mm for Gyroid with 0.5mm cell size
and 15% volume fraction. These organic cellular structures with controlled cell
sizes and densities which are very difficult or impossible to be manufactured by
means from light metallic alloys such Ti-6Al-4V and AlSi10Mg are now proved
to be manufacturable in SLM and DMLS processes. The good manufacturability
of Gyroid and Diamond cell types in SLM/DMLS can be attributed to the curved
struts and spherical pore forming the unit cell. The inclination angle of the
circular strut continuously varies along the spherical pore, which makes layers
grow up gradually with slight changes in area and position between two
subsequent layers during the SLM/DMLS process. In this way, the next layer is
well supported by previously solidified layer. That means that these TPMS
cellular structures have a self-supported unique characteristic in a wider range
of cell sizes, volume fractions, and cell orientation which makes them suitable
for SLM and DMLS processes
For all the three tested materials, both compressive elastic modulus and yield
strength increase with the increase of solid volume fraction of the strut (i.e.

209
relative density). The experimental results reveal that cell size has relatively a
minor influence compared to volume fraction for both elastic modulus and yield
strength of cellular structure, when the volume fraction is kept constant. The cell
orientation has a significant effect on the compressive properties of cellular
structures. It was found that the highest modulus 316L stainless steel Gyroid
structure lies between 40 and 60 degree of cell rotation. The Elastic modulus of
the worst cell orientation in manufacturing (i.e. nearly vertical cell struts which
are parallel to the loading direction) is found to be 20.37% higher than that of
the normal un-rotated cell orientation of similar cell size and volume fraction. the
compressive elastic modulus and yield strength of Gyroid cellular structure with
5.5 mm cell size and 15% solid volume fraction (equivalent to 0.15 relative
density) is about, 251 MPa and 14 MPa for 316L stainless steel, 231 MPa and
16 MPa for AlSi10Mg, and 810 MPa and 50 MPa for Ti-6Al-4V, respectively.
Cellular structures made from Ti-6Al-4V are 3-4 superior to that of 36L stainless
steel and AlSi10Mg of similar cell size and volume fraction, making them
attractive material for lightweight and load bearing applications.
The uniform cellular support structures show good manufacturability
characteristics; however, some of the parts failed during the build. For big cell
sizes, the distance between the adjacent support points to the supported
surface is too large; therefore, there is too much material that is unsupported
and the part was distorted by the thermal stresses. The use of graded cellular
support structures has improved the manufacturability of the supported part.
The potential material saving combined with multi-functionalities they offer,
makes them suitable for internal lightweight and external support structure
applications of metal AM. The experimental results have revealed that a
potential material saving can be achieved when lattice support structure with
lower volume fractions is used. For example, it was possible to manufacture
gyroid lattice structures with 8% of relative volume, which means 92% of loose
powders can be easily removed and recycled. Low volume fraction also allows
minimum build time and required energy for SLM parts. The theoretical energy
consumptions model in Appendix A indicate that build time is the most
significant factor to consider when reducing the energy consumption of AM
parts.
The results of single layer simulation show that the highest temperature
gradient is found at the start of first track scan of the layer and drops
210
subsequently for all scanning speeds. The predicted length of the melt pool
increases at higher scan speeds while both width and depth of the melt pool
decreases. High von mises stresses was predicted in the scanned layer caused
by the stepwise increase and decrease in the temperature with each successive
overlapping laser tracks which leads to alternating compressive and tensile
residual stresses within the layer. High cooling rates were predicted when the
layer is scanned over a solid substrate compared to when layer is scanned on
loose powder bed.
From these results, the following potential areas will be considered potential
for further future research,
In practice, any imperfections in the cellular structure (such as non-
uniformities in relative density or initially bent cell walls) induce bending of
the cell walls, reducing the compressive properties. However, this was out of
the scope of this study and will is recommended future work.
The effect of powder particle size and distribution on the manufacturability of
cellular structures will be investigated in the future works.
Optimal scanning strategies for these cellular structures have not been
investigated. When used for support purposes the lattices are only sacrificial
parts built to enable the final component to be produced. As such, it is likely
that much quicker strategies for their manufacture could be developed in a
possible future project.
The cellular support structure studies presented here did not consider the
effect of cellular support on the surface roughness of the supported regions
as well as the manual removal of the external cellular support. These are
important for the design of more efficient support structure method for
delicate geometries.
The heat transfer characteristics and extended mechanical properties of
these cellular structures will be analysed in the future using finite element
simulation method.
Further improvement and validation is needed for the analytical energy
consumption model presented in Appendix A, so that energy consumption of
different competing options can be compared during the design process.

211
The research has contributed to new knowledge in,
The understanding of the temperature and stress fields in overhang
geometries during SLM processing.
The manufacturability of low-density TPMS cellular structures with varying
cell size, orientation and volume fractions from various metallic powders
using SLM and DMLS processes. The manufacturability study has
presented the limitations of SLM/DMLS in building cellular structures in
terms of cell shape, volume fraction, cell size, orientation, and powder
material.
The mechanical behaviour of TPMS cellular structures. The evaluation of the
mechanical properties of these cellular structures on different materials aims
to illustrate the effect of different cell types, sizes, and volume fractions, and
orientation on compressive properties. The data on the mechanical
properties will aid the designer on the selection and use of the right cell type,
size, and volume fraction to suit the functional demands of particular
application.
The design and manufacturing of support structures through the novel
applications of low-density uniform and graded cellular support structures for
metal AM parts. The new support structure method addresses the saving of
energy (via reduced built-time), and material saving of the internal or
external cellular support structures which could waste very expensive raw
metal materials and built-time in complex parts that require large support.
The aim of the cellular support is to tackle the process limitation in building
complex and hollow internal geometries that will otherwise require non-
removable support structures by replacing them with multifunctional
permanent cellular support.
Design recommendations of cellular lattice structures:
Any lattice structure used for support structure applications should be
designed in such a way that, the volume fraction generated is as minimum
as possible, and provided that both support structure an loose powder
material can be removed after the build. Grading the cellular structure is the
best option in achieving multiple goals such as reduced build-time, reduced
support volume, maximum heat dissipation, easy removal of powder and

212
support. However, proper grading tools should be used for generating the
graded support, in particular, the transition from low volume fraction to
higher volume fractions and vice versa.
The main determining factors for manufacturability are the cell shape,
volume fraction and cell siz. The material itself has a particular influence in
small cell sizes with low volume fractions. Cell sizes smaller than 1mm
should be avoided as it will be difficult to remove the loose powder trapped
in the cell structures. Similarly, depending on the cell type, very low volume
fractions below 6% (e.g. for Gyroid) should be avoided as it will result a very
fragile cell ligaments/struts that will fail during the build. The cell type should
be self-supporting, and as such, the cell horizontal overhang that is
perpendicular to the build direction should be minimized to below 1mm.
It is recommended to use proper cleaning and air/bead blasting post-
processing to remove any loose powders attached to the cell
legaments/struts. This will significantly improve the dimensional accuracy of
the cellular structures. However, proper care should be practiced when
cleaning very low volume fractions that are too fragile as some of the struts
may break during post-processing. It is equally important to perform proper
cleaning operation before any stress-relievign heat treatment is conducted
on the cellular lattice structure. This minimizes the risk of bonding loose
powders to the cell struts.
Cell struts that are parallel to the loading direction provide highest
compressive properties but are difficult to be manufactured in large cell sizes
due to the resulting overhang in the horizontal strut forming the cell. An
optimisation could be achieved between manufacturability and best
orientation to achieve certain mechanical properties.

213
References
Abe, F., Santos, E. C., Kitamura, Y., Osakada, K., & Shiomi, M. (2003). Influence of
forming conditions on the titanium model in rapid prototyping with the selective laser
melting process. Proceedings of the Institution of Mechanical Engineers, Part C:
Journal of Mechanical Engineering Science,217(1), 119-126.
Agarwala M, Bourell D, Beaman J, Marcus H, Barlow J. (1995). Direct selective laser
sintering of metals. Rapid Prototyp J;1:26–36.
Ajdari, A., Nayeb-Hashemi, H., & Vaziri, A. (2011). Dynamic crushing and energy
absorption of regular, irregular and functionally graded cellular structures. International
Journal of Solids and Structures, 48(3), 506-516.
Allen S. and Dutta D. (1994) "On the computation of part orientation using support
structures in layered manufacturing", Report No. UM-MEAN-94-15, July, 1994.
Amato, K. N., Gaytan, S. M., Murr, L. E., Martinez, E., Shindo, P. W., Hernandez, J.,. &
Medina, F. (2012). Microstructures and mechanical behavior of Inconel 718 fabricated
by selective laser melting. Acta Materialia,60(5), 2229-2239.
Anderson, R.L., and Fahlman, E.G. (1924). A Method for Measuring Internal Stress in
Brass Tubes, J. Inst. Met., Vol 32, p 367–383.
Andrews, E., Sanders, W., & Gibson, L. J. (1999). Compressive and tensile behaviour
of aluminum foams. Materials Science and Engineering: A, 270(2), 113-124.
Asberg B., Blanco G., Bose P., Garcia-Lopez J., Overmars M., Toussaint G., Wilfong
G. and Zhu B. (1997) “Feasibility of design in stereolithography”, Algorithmica, Vol. 19,
pp. 61–83.
Ashby, M. F. (2000). Metal foams: a design guide. Butterworth-Heinemann.
sintering of metals. Rapid Prototyp J 1995;1:26–36.
Baldwin WM. (1949). Residual stresses in metals. Philadelphia: Proc. American
Society for Testing and Materials;. p. 49.
214
Beaman, K.L. Wood, H. Marcus (eds.) (2005). Solid Freeform Fabrication Proceedings,
The University of Texas, Austin Texas, , pp.231-241
Bertol, L.S., Júnior, W. K., da Silva, F.P., Aumund-Kopp, C.. (2010). Medical design:
Direct metal laser sintering of Ti–6Al–4V. Materials & Design, , 31(8): 3982-3988.
Boccalini M, Goldenstein H. (2001). Solidification of high speed steels. Int Mater
Rev;46:92–115.
Boresi AP, Schmidt RJ, Sidebottom OM. (1993). Advanced mechanics of materials. 5th
ed. New York: John Wiley;
Brandl E, Heckenberger U, Holzinger V, Buchbinder D. (2012) Additive manufactured
AlSi10Mg samples using Selective Laser Melting (SLM): microstructure, high cycle
fatigue, and fracture behavior. Mater Des;34:159–69.
Brandl, E., Heckenberger, U., Holzinger, V., & Buchbinder, D. (2012). Additive
manufactured AlSi10Mg samples using Selective Laser Melting (SLM): Microstructure,
high cycle fatigue, and fracture behavior. Materials & Design,34, 159-169.
Brooks, W., Sutcliffe, C., Cantwell, W., Fox, P., Todd, J., & Mines, R. (2005). Rapid
design and manufacture of ultralight cellular materials. In Proceedings of the Solid
Freeform Fabrication Symposium. Austin, TX.
Cansizoglu, O., Harrysson, O., Cormier, D., West, H., & Mahale, T. (2008). Properties
of Ti–6Al–4V non-stochastic lattice structures fabricated via electron beam melting.
Materials Science and Engineering: A, 492(1), 468-474.
Cao, X. Q., Wang, Z. H., Ma, H. W., Zhao, L. M., & Yang, G. T. (2006). Effects of cell
size on compressive properties of aluminum foam. Transactions of Nonferrous Metals
Society of China, 16(2), 351-356.
Carslaw H, Jaeger J. (1959).Conduction of heat in solids, 2nd ed. vol. 1.
Chen Chu, Greg Graf, and David W. Rosen, (2008) “Design for additive manufacturing
of cellular structures”, computer-aided design and applications, 5(5), 686-696.

215
Chen He-fa. (2003) Effect of cellular microstructure on the mechanical properties of
open-cell aluminum foams[J]. Hot Working Technology, (3): I-2.
Childs, T. H. C., Hauser, C., & Badrossamay, M. (2005). Selective laser sintering
(melting) of stainless and tool steel powders: experiments and modelling. Proceedings
of the Institution of Mechanical Engineers, Part B: Journal of Engineering
Manufacture, 219(4), 339-357.
Chiras, S., Mumm, D.R., Evans, A.G., Wicks, N., Hutchinson, J.W., Dharmasena, K.P.,
Wadley, H.N.G., and Fichter, S., (2002), The structural performance of nearoptimized
truss core panels, Int’l J. Solids and Structures, 39, p.4093.
Dai K, Shaw L. (2002). Distortion minimization of laser-processed components through
control of laser scanning patterns. Rapid Prototyp J;8(5):270–6.
Deng D, Kiyoshima S. (2010). Numerical simulation of residual stresses induced by
laser beam welding in a SUS316 stainless steel pipe with considering initial residual
stress influences. Nucl Eng Des;240:688–96.
Deshpande V.S., Fleck N.A., (2001). Collapse of truss core sandwich beams in 3-point
bending, Int. J. Solids & Structures, , 38, p.6275.
Deshpande V.S., Fleck N.A., Ashby M.F., (2001). Effective properties of the octet-truss
lattice material, J. Mechanics & Physics of Solids, , 49, p.1747.
Dong L, Makradi A, Ahzi S, Remond Y. (2009). Three-dimensional transient finite
element analysis of the selective laser sintering process. J Mater Process
Technol.;29:700–6.
Earl, J.M., Manners C. R., Kerekes, T. A., Marygold, P. H., Thayer, J. S. (1999). “Rapid
prototyping system and method with support region data processing” US Patent
5,943,235 Assignee: 3D Systems, Inc., Calif.
Evans A.G., Multifunctionality of cellular metal systems, Prog. Materials Sci., 1999, 43,
p.171.

216
Facchini, L., Magalini, E., Robotti, P., & Molinari, A. (2009). Microstructure and
mechanical properties of Ti-6Al-4V produced by electron beam melting of pre-alloyed
powders. Rapid Prototyping Journal, 15(3), 171-178.
Gibson, L.J., Ashby, M.F., (1997).Cellular Solids, Structure and Properties, 2nd Edition,
Cambridge, Cambridge University Press
Gordon, J.E. (1968). The New Science of Strong Materials, Penguin Books, , p 258–
261
Gu D, Shen Y. (2009) Balling phenomena in direct laser sintering of stainless steel
powder: metallurgical mechanisms and control methods. Mater Des.;30(8):2903–10.
Gu DD, Shen YF, Xiao J. (2008). Influence of processing parameters on particulate
dispersion in direct laser sintered WC–Cop/Cu MMCs. Int J Refract Met Hard
Mater;26:411–22.
Gu, D., & Shen, Y. (2009). Balling phenomena in direct laser sintering of stainless steel
powder: metallurgical mechanisms and control methods.Materials & Design, 30(8),
2903-2910.
Guan K, Wang Z, Gao M, Li X, Zeng X. (2013). Effects of processing parameters on
tensile properties of selective laser melted 304 stainless steel. Mater Des ;50:581–6.
Hague, R., Mansour, S., & Saleh, N. (2003). Design opportunities with rapid
manufacturing. Assembly automation, 23(4), 346-356.
Harrysson, O. L., Cansizoglu, O., Marcellin-Little, D. J., Cormier, D. R., & West II, H. A.
(2008). Direct metal fabrication of titanium implants with tailored materials and
mechanical properties using electron beam melting technology. Materials Science and
Engineering: C, 28(3), 366-373.
Heinl, P., Müller, L., Körner, C., Singer, R. F., & Müller, F. A. (2008). Cellular Ti–6Al 4V
structures with interconnected macro porosity for bone implants fabricated by selective
electron beam melting. Acta biomaterialia, 4(5), 1536-1544.
Hopkinson, N., Hague, R., & Dickens, P. (Eds.). (2006). Rapid manufacturing: an
industrial revolution for the digital age. John Wiley & Sons.
217
Huang, X. M., Ye, C. S., Wu, S. Y., Guo, K. B. and Mo, J. H. (2009) “Sloping wall
structure support generation for fused deposition modeling”, Int. J. Adv. Manuf.
Technol. Vol: 42, pp:1074–1081.
Hur, J. and Lee K. (1998) “The development of a CAD environment to determine the
preferred build-up direction for layered manufacturing”, The International Journal of
Advanced Manufacturing Technology, Volume 14, Number 4, pp. 247- 254.
Hyun S., Karlsson, A.M., Torquato, S., Evans, A.G., Simulated properties of Kagomé
and tetragonal truss core panels, Int. J. Solids & Structures, 2003, 40, 25, p.6989.
Ibraheem Ameer K, Derby Brian, et al. (2003). Thermal and residual stress modelling
of the selective laser sintering process. Mater Res Soc;758:47–52.
Jhabvala, J., Boillat, E., Glardon, R., (2012). An innovative method to build support
structures with a pulsed laser in the selective laser melting process. International
Journal of Advanced Manufacturing Technology 59, 137–142.
Kim B., Christensen R.M., (2000). Basic two-dimensional core types for sandwich
structures, Int’l J. Mechanical Sciences, , 42, p. 657.
Kirschman, C. F., Jara–Almonte, C.C., Bagchi, A., Dooley. R.L. and Ogale, A.A.
(1991). “Computer Aided Design of Support Structures for Stereolithographic
Components” Proceedings of the 1991 ASME Computers In Engineering Conference,
Santa Clara, pp 443–448,
Kruth, J. P., Froyen, L., Van Vaerenbergh, J., Mercelis, P., Rombouts, M., & Lauwers,
B. (2004). Selective laser melting of iron-based powder. Journal of Materials
Processing Technology, 149(1), 616-622.
Kumar C, Larry J, Larry R (1995) Support generation for fused deposition modeling,
Solid Freeform Fabrication Symposium, University of Texas, Austin, pp: 229–241 (3D
Systems, Inc., 1989).
Laura Castillo. (2005). Study about the rapid manufacturing of complex parts of
stainless steel and titanium. TNO l report with the collaboration of (AIMME) Instituto
Technologico Metalmacanico

218
LI J R, CHEN H F, YU J L, HAN F S. (2003). Effect of dual-size cell mix on the stiffness
and strength of open-cell aluminum foams J. Mater Sci & Eng, , A362: 240-248.
Li, R., Shi, Y., Liu, J., Xie, Z., & Wang, Z. (2010). Selective laser melting W–10 wt.%
Cu composite powders. The International Journal of Advanced Manufacturing
Technology, 48(5-8), 597-605.
Lu J. Handbook of Measurement of Residual stresses, vol. 1. SEM, Bethel (1996).
ISBN: 978-0132557382. p. 319–22.
Ma, L., & Bin, H. (2007). Temperature and stress analysis and simulation in fractal
scanning-based laser sintering. The International Journal of Advanced Manufacturing
Technology, 34(9-10), 898-903.
Majhi, J., Janardan R., Smid, M. and Gupta, P. (1999), “On some geometric
optimization problems in layered manufacturing”, Computational Geometry, Vol. 12, pp.
219–239.
Mansour, S., & Hague, R. (2003). Impact of rapid manufacturing on design for
manufacture for injection moulding. Proceedings of the Institution of Mechanical
Engineers, Part B: Journal of Engineering Manufacture, 217(4), 453-461.
Markaki, A. E., & Clyne, T. W. (2001). The effect of cell wall microstructure on the
deformation and fracture of aluminium-based foams. Acta Materialia, 49(9), 1677-1686.
Matsumoto, M., Shiomi, M., Osakada, K., & Abe, F. (2002). Finite element analysis of
single layer forming on metallic powder bed in rapid prototyping by selective laser
processing. International Journal of Machine Tools and Manufacture, 42(1), 61-67.
McKown, S., Shen, Y., Brookes, W. K., Sutcliffe, C. J., Cantwell, W. J., Langdon, G. S.,
& Theobald, M. D. (2008). The quasi-static and blast loading response of lattice
structures. International Journal of Impact Engineering, 35(8), 795-810.
Mercelis, P., & Kruth, J. P. (2006). Residual stresses in selective laser sintering and
selective laser melting. Rapid Prototyping Journal, 12(5), 254-265.
219
Mercelis, P., & Kruth, J. P. (2006). Residual stresses in selective laser sintering and
selective laser melting. Rapid Prototyping Journal, 12(5), 254-265.
Mills, K. C. (Ed.). (2002). Recommended values of thermophysical properties for
selected commercial alloys. Woodhead Publishing.
Mognol, P., Lepicart, D., & Perry, N. (2006). Rapid prototyping: energy and
environment in the spotlight. Rapid Prototyping Journal, 12(1), 26-34.
Morgan, R., Sutcliffe, C. J., & O’Neill, W. (2001). Experimental investigation of
nanosecond pulsed Nd: YAG laser re-melted pre-placed powder beds. Rapid
Prototyping Journal, 7(3), 159-172.
Mullen, L., Stamp, R. C., Brooks, W. K., Jones, E., & Sutcliffe, C. J. (2009). Selective
Laser Melting: A regular unit cell approach for the manufacture of porous, titanium,
bone in‐growth constructs, suitable for orthopedic applications. Journal of Biomedical
Materials Research Part B: Applied Biomaterials, 89(2), 325-334.
Mumtaz, K., Vora, P., Hopkinson, N., 2011. A method to eliminate anchors/supports
from directly laser melted metal powder bed processes. In: Proceedings of the 22nd
International Solid Freeform Fabrication Symposium, Austin, USA.
Nickel A, Barnett D, Prinz F. (2001). Thermal stresses and deposition patterns in
layered manufacturing. Mater Sci Eng;A317(1):59–64.
Nieh, T. G., Higashi, K., & Wadsworth, J. (2000). Effect of cell morphology on the
compressive properties of open-cell aluminum foams. Materials Science and
Engineering: A, 283(1), 105-110.
Onck P R, Andrews E W, Gibson L J. (2001). Size effects in ductile cellular solids(Part
I): modeling[J]. International Journal of Mechanical Sciences, ,43: 681-699.
Oud-Heverlee, G. E. and Herenthout, K. R. (2010). “Method and apparatus for
automatic support generation for an object made by means of a rapid prototype
production method” US Patent 2010/0228369 A1. Assignee: Materialise NV, Belgium.
Patil RB, Yadava V. Finite element analysis of temperature distribution in single
metallic powder layer during metal laser sintering. Int J Mach Tools Manuf 2007;47(7–
8):1069–80.
220
Pattanayak, D. K., Fukuda, A., Matsushita, T., Takemoto, M., Fujibayashi, S.,Sasaki,
K., & Kokubo, T. (2011). Bioactive Ti metal analogous to human cancellous bone:
fabrication by selective laser melting and chemical treatments. Acta biomaterialia, 7(3),
1398-1406.
Pohl, H., Simchi, A., Issa, M., & Dias, H. C. (2001). Thermal stresses in direct metal
laser sintering. In Proceedings of the Solid Freeform Fabrication Symposium (pp. 366-
372).
Pullin, J., & Offen, A. (2008). ‘Back to the Drawing Board - Addressing the design
issues of RM’. Time Compression Technologies Rapid Manufacturing Conference
2008, Rapid News Publications Plc, Coventry, West Midlands.
Putte, B. S., Bornem, J. P., Huldenberg, W. V. (1997) “Method for supporting an object
made by means of stereolithography or another rapid prototype production method” US
Patent 5,595,703. Assignee: Materialise, Belgium.
Ramirez D.A., Murr, L.E. et al. (2011). "Open-cellular copper structures fabricated by
additive manufacturing using electron beam melting." Materials Science and
Engineering: A 528(16-17): 5379-5386.
Rännar, L. E., Glad, A., & Gustafson, C. G. (2007). Efficient cooling with tool inserts
manufactured by electron beam melting. Rapid Prototyping Journal,13(3), 128-135.
Roberts, I. A., Wang, C. J., Esterlein, R., Stanford, M., & Mynors, D. J. (2009). A three-
dimensional finite element analysis of the temperature field during laser melting of
metal powders in additive layer manufacturing. International Journal of Machine Tools
and Manufacture, 49(12), 916-923.
Rombouts, M., Kruth, J. P., Froyen, L., & Mercelis, P. (2006). Fundamentals of
selective laser melting of alloyed steel powders. CIRP Annals-Manufacturing
Technology, 55(1), 187-192.
Rosen, D. W. (2007). Computer-aided design for additive manufacturing of cellular
structures. Computer-Aided Design & Applications, 4(5), 585-594.

221
Rossini, N. S., Dassisti, M., Benyounis, K. Y., & Olabi, A. G. (2012). Methods of
measuring residual stresses in components. Materials & Design, 35, 572-588.
Santorinaios M., Brooks W.,. Sutcliffe C.J, Mines, R.A. (2006) Crush behaviour of
open cellular lattice structures manufactured using selective laser melting, High
Performance Structures and Materials Iii 85481-490.
Schoen, A.H., (1970). Infinite Periodic Minimal Surfaces Without Self-Intersection.
National Aeronautics and Space Administration (NASA) Tech, Washington, DC (Note
no. D-5541).
Schwarz, H.A., (1890). Gesammelte Mathematische Abhandlungen. Springer, Berlin
(Reprinted by Chelsea Publishing Company, 1972).
Shen X-F et al. (2005) ;Finite element simulation of thermal distribution in direct metal
laser multi-track sintering. J Sichuan Univ (Eng Sci Ed) 37(1):47–51.
Shuai C, Feng P, et al. (2012). Simulation of dynamic temperature field during selective
laser sintering of ceramic powder. Mathe Computer Modell Dynam Syst. 1(11).
Simchi A, Asgharzadeh H. (2004). Densification and microstructural evaluation during
laser sintering of M2 high speed steel powder. Mater Sci Technol ;20:1462–8.
Simchi A, Pohl H (2004). Direct laser sintering of iron–graphite powder mixture. Mater
Sci Eng A;383:191–200.
Simchi, A. (2006). Direct laser sintering of metal powders: mechanism, kinetics and
microstructural features. Materials Science and Engineering: A, 428(1), 148-158.
Spierings, A. B., Levy, G., Labhart, L., & Wegener, K. (2011). Production of functional
parts using SLM–Opportunities and limitations. Virtual and Rapid Manufacturing:
Advanced Research in Virtual and Rapid Prototyping, 785-790.
Spierings, A.B. & Levy, G. (2009). Comparison of density of stainless steel 316L parts
produced with selective laser melting using different powder grades. In Proceedings of
the Annual International Solid Freeform Fabrication Symposium, ed. D. L. Bourell, 342-
353. Austin, Texas.
222
Thijs, L., Verhaeghe, F., Craeghs, T., Humbeeck, J. V., & Kruth, J. P. (2010). A study
of the microstructural evolution during selective laser melting of Ti–6Al–4V. Acta
Materialia, 58(9), 3303-3312.
Thomas, D. (2010). The development of design rules for selective laser melting
(Doctoral dissertation, University of Wales).
Thummler F, Oberacker R. An introduction to powder metallurgy. Cambridge (London):
The University Press; 1993.
Timoshenko, S. P., & Goodier, J. N. (2011). Theory of elasticity. International Journal of
Bulk Solids Storage in Silos, 1(4), 567-567.
Totten, G. E., Howes, M. A., & Inoue, T. (2002). Handbook of residual stress and
deformation of steel. vol. 1. SEM, Bethel 2005, ISBN: 978- 0871707291; p. 417.
Traini, T., Mangano, C., Sammons, R. L., Mangano, F., Macchi, A., & Piattelli, A.
(2008). Direct laser metal sintering as a new approach to fabrication of an isoelastic
functionally graded material for manufacture of porous titanium dental implants. Dental
materials, 24(11), 1525-1533.
Walton HW. Deflection methods to estimate residual stress (2002). Handbook of
residual stress and deformation of steel. ASM International; ISBN: 0-87170-729-2; p.
89–98.
Wang J., Evans A.G., Dharmasena, K.H., Wadley, N.G., (2003). On the performance
of truss panels with Kagomé cores, Int. J. Solids & Structures, 40, 25, p.6981.
Wicks, N., Hutchinson, J.W. (2001). Optimal truss plates, Int. J. Solids & Structures, ,
38, p.5165.
Wohlers, T. (2013). Wohlers Report.
Wong, M., Tsopanos, S., Sutcliffe, C. J., & Owen, I. (2007). Selective laser melting of
heat transfer devices. Rapid Prototyping Journal, 13(5), 291-297.
Wu, W., Yang, Y., & Huang, Y. (2007). Direct manufacturing of Cu-based alloy parts by
selective laser melting. Chinese Optics Letters, 5(1), 37-40.
223
Yang, C. C., & Nakae, H. (2000). Foaming characteristics control during production of
aluminum alloy foam. Journal of Alloys and Compounds, 313(1), 188-191.
Yasa, E., Deckers, J., Kruth, J. P., Rombouts, M., & Luyten, J. (2010). Charpy impact
testing of metallic selective laser melting parts. Virtual and physical prototyping, 5(2),
89-98.
Yilbas BS, Arif AFM. (2001) Material response to thermal loading due to short pulse
laser heating. Int J Heat Mass Transfer;44:3787–98.
Yin J, Zhu H, et al. (2012). Simulation of temperature distribution in single metallic
powder layer for laser micro-sintering. Comput Mater Sci;53(1):333–9.
Zaeh M, Branner G. (2010) Investigations on residual stresses and deformations in
selective laser melting. Prod Eng;4(1):35–45.
Zhang DQ, Cai QZ, et al. (2010) Select laser melting of W–Ni–Fe powders: simulation
and experimental study. Int J Adv Manuf Technol;51(5–8):649–58.
Zhang, L. C., Klemm, D., Eckert, J., Hao, Y. L., & Sercombe, T. B. (2011). Manufacture
by selective laser melting and mechanical behavior of a biomedical Ti 24Nb–4Zr–8Sn
alloy. Scripta Materialia, 65(1), 21-24.
Zhou J, Shrotfuya P, Soboyelo W 0. (2004). Mechanism and mechanics of
compressive deformation in open-cell A1 foams [J1. Mechanics of Materials, ,36: 78 1-
797.
Website links:
http://www.xpress3d.com]
http://www.additive3d.com/bpm.html
http://www.jharper.demon.co.uk/rptc01.htm
http://www.eos.com
http://www.3trpd.co.uk
http://www.astm.org/COMMITTEE/F42.htm
http://www.susqu.edu/brakke/aux/evolver/examples/periodic/periodic.html
http://www.hieta.co.uk
http://www.ilt.fraunhofer.de

224
http://www.sandvik.com/en/search/?q=additive+manufacturing
http://www.lpwtechnology.com/
http://www.exeter.ac.uk/
http://www.economist.com/node/21552892
225
APPENDIX A
Analytical Model for Estimating the Energy
Consumption in SLM/DMLS Process
A.1 Energy equation
The energy absorbed by the part is calculated from the laser power laser
scanning velocity (v), layer thickness (t), and hatch spacing (h) between two
adjacent scan vectors.
(A.1)
Energy required for melting or energy required for phase change is,
[ ( ) ] (A.2)
Where Cp– average specific heat [J/g.K] from ambient bed temperature T0 to
metal melting temperature Tm , and [J/g] is latent heat of fusion, – density of
the material [g/mm3].
Total energy consumption can be estimated as power consumed and time
taken during the building of the part.
(A.3)
Where Ps – Setup Power required by the motor for powder deposition [W], Ts -
Setup time for powder deposition [s], and its constant for all layers, Pl– Laser
power [W], Ti – Laser interaction time [s].
Setup time Ts can be estimated as,
(A.4)
Where, time for powder deposition, time for work bed to move down in z
direction so that new layer of powder can be deposited
∑
(A.5)
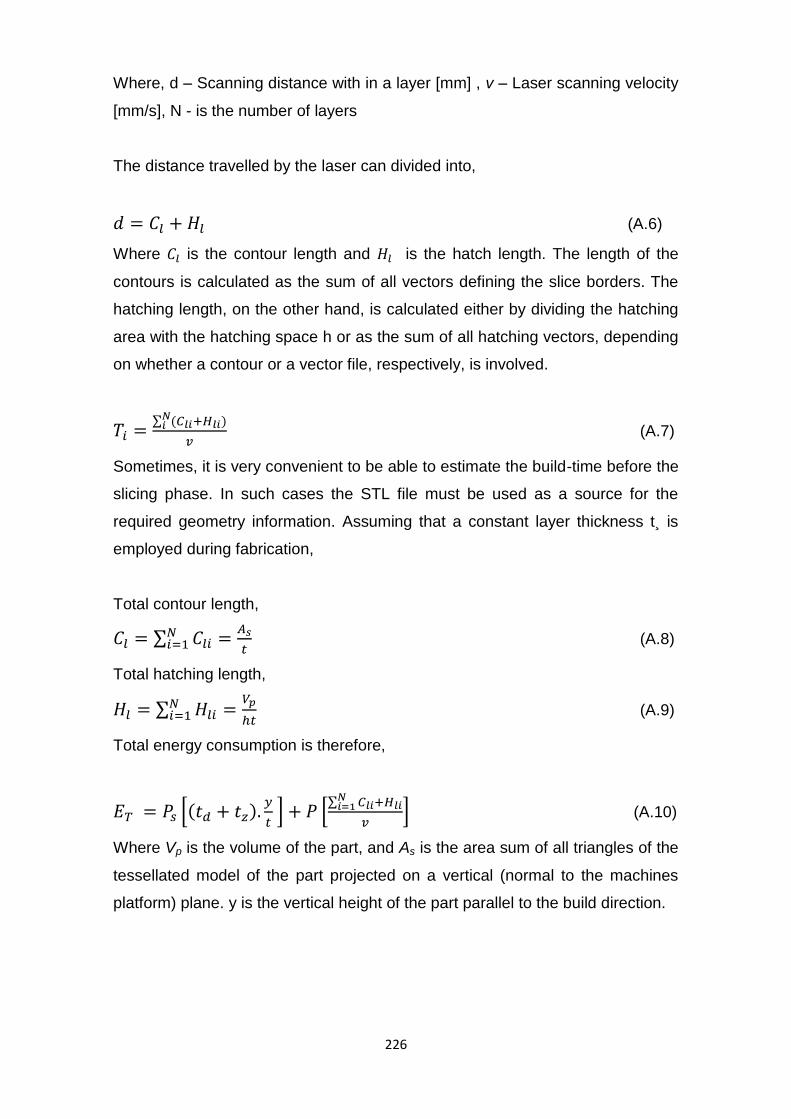
226
Where, d – Scanning distance with in a layer [mm] , v – Laser scanning velocity
[mm/s], N - is the number of layers
The distance travelled by the laser can divided into,
(A.6)
Where is the contour length and is the hatch length. The length of the
contours is calculated as the sum of all vectors defining the slice borders. The
hatching length, on the other hand, is calculated either by dividing the hatching
area with the hatching space h or as the sum of all hatching vectors, depending
on whether a contour or a vector file, respectively, is involved.
∑ ( )
(A.7)
Sometimes, it is very convenient to be able to estimate the build-time before the
slicing phase. In such cases the STL file must be used as a source for the
required geometry information. Assuming that a constant layer thickness t¸ is
employed during fabrication,
Total contour length,
∑
(A.8)
Total hatching length,
∑
(A.9)
Total energy consumption is therefore,
[( )
] [
∑
] (A.10)
Where Vp is the volume of the part, and As is the area sum of all triangles of the
tessellated model of the part projected on a vertical (normal to the machines
platform) plane. y is the vertical height of the part parallel to the build direction.

227
A.2 Comparison of the Energy Consumption of Different Parts
By using the equation (A.10), the total energy consumptions of cylindrical
parts of the same geometrical dimensions, but with different densities (solid,
hollow, and cellular structure) were calculated. The model predicts that the
energy consumption of the cylindrical part filled with internal cellular structures
is 65 % less than the solid part. The minimum energy is achieved when the
cylinder is made hollow and this is most logical and first step in reducing both
material and energy consumption. However, in most case there are
manufacturing constraints for internal hollow parts and the use of support
structure becomes necessary. Furthermore, hollow parts may not be able to
sustain loads applied on them and thus weaken the performance of the part. In
light of this, cellular structure are thought to be the best candidate for making
lightweight parts and their superiority in enabling the manufacturability of
complex parts while fulfilling functional needs.
Table A.1 Comparison of energy consumption of different parts
Fig. A.1 shows the energy consumption of large X-Y cross-sectional Disc
shaped part and vertically tall cylindrical part. The objective was to weight the
percentage contribution of Em (energy for melting) and Es (energy for powder
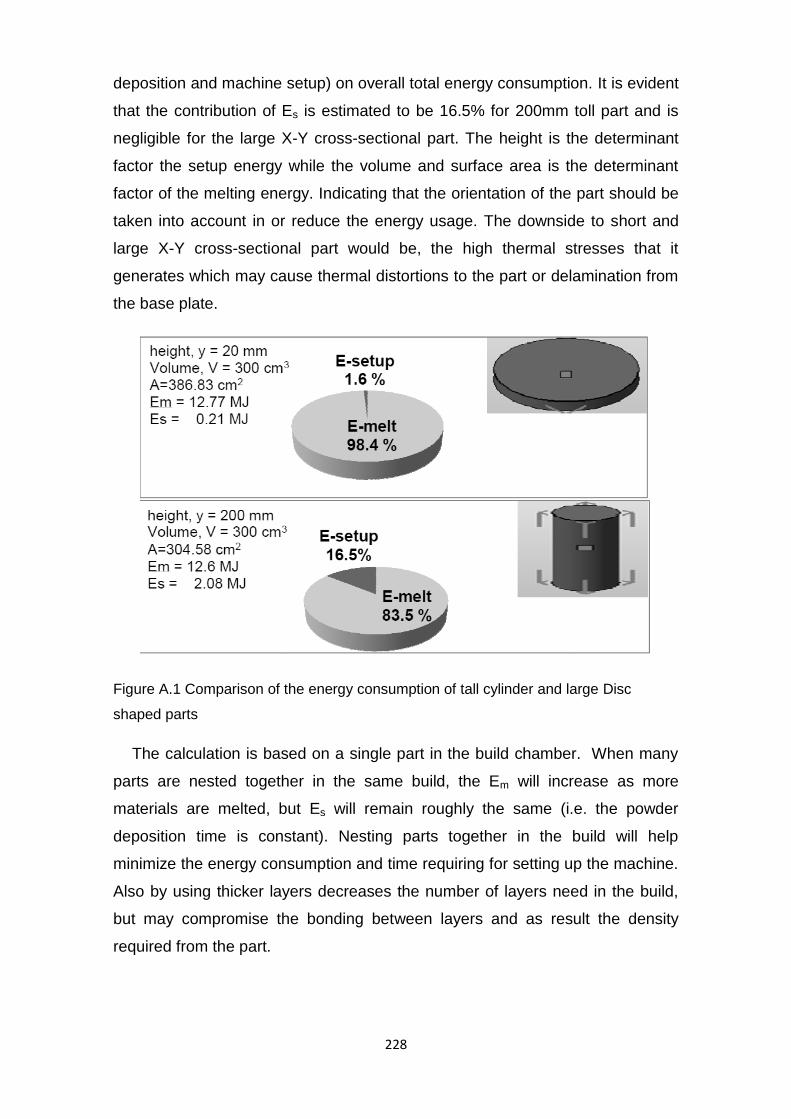
228
deposition and machine setup) on overall total energy consumption. It is evident
that the contribution of Es is estimated to be 16.5% for 200mm toll part and is
negligible for the large X-Y cross-sectional part. The height is the determinant
factor the setup energy while the volume and surface area is the determinant
factor of the melting energy. Indicating that the orientation of the part should be
taken into account in or reduce the energy usage. The downside to short and
large X-Y cross-sectional part would be, the high thermal stresses that it
generates which may cause thermal distortions to the part or delamination from
the base plate.
Figure A.1 Comparison of the energy consumption of tall cylinder and large Disc
shaped parts
The calculation is based on a single part in the build chamber. When many
parts are nested together in the same build, the Em will increase as more
materials are melted, but Es will remain roughly the same (i.e. the powder
deposition time is constant). Nesting parts together in the build will help
minimize the energy consumption and time requiring for setting up the machine.
Also by using thicker layers decreases the number of layers need in the build,
but may compromise the bonding between layers and as result the density
required from the part.