the development of an improved human capital index …
TRANSCRIPT

THE DEVELOPMENT OF AN IMPROVED HUMAN CAPITAL INDEX FOR
ASSESSING AND FORECASTING NATIONAL CAPACITY AND
DEVELOPMENT
A Dissertation
by
OLHA VERKHOHLYAD
Submitted to the Office of Graduate Studies of Texas A&M University
in partial fulfillment of the requirements for the degree of
DOCTOR OF PHILOSOPHY
December 2008
Major Subject: Educational Administration

THE DEVELOPMENT OF AN IMPROVED HUMAN CAPITAL INDEX FOR
ASSESSING AND FORECASTING NATIONAL CAPACITY AND
DEVELOPMENT
A Dissertation
by
OLHA VERKHOHLYAD
Submitted to the Office of Graduate Studies of Texas A&M University
in partial fulfillment of the requirements for the degree of
DOCTOR OF PHILOSOPHY
Approved by:
Co-Chairs of Committee, Toby Marshall Egan R. Anthony Rolle Committee Members, Angela L. Bies Larry Dooley Head of Department, Jim Scheurich
December 2008
Major Subject: Educational Administration

iii
ABSTRACT
The Development of an Improved Human Capital Index for Assessing and
Forecasting National Capacity and Development. (December 2008)
Olha Verkhohlyad, B.A., Mykolaiv State Pedagogical University;
M.A., Dallas Theological Seminary
Co-Chairs of Advisory Committee: Dr. Toby M. Egan Dr. R. Anthony Rolle
Human capital theory is accepted as one of the foundational theories of socio-
economic development. Although, according to founding scholars, any acquired qualities
and abilities that help individuals and groups be economically productive can be
considered as individual or group human capital, the classical human capital model
focuses on schooling and training as the major factors comprising human capital on
individual, group, and national levels. Consequently, current human capital measurement
tools generally assess only educational attainment on these levels.
Because of this overly simplified approach, the present manner in which human
capital is commonly measured by national and international entities creates difficulty in
accurately assessing the strengths and weaknesses of human capital within and between
countries. A major challenge to improvement of human capital variables is identification
and availability of data. The factors suggested to have significant impact on human
capital are mostly intangible. Collecting such data is cost prohibitive for many
developing countries. Consequently, national policy-makers, multinational corporations
and international aid organizations use simplified estimates of human capital.

iv
The purpose of this dissertation is to construct and validate a more comprehensive
human capital index. Study research questions include: 1) What are the significant factors
that affect national human capital as revealed in the literature? 2) Can an expanded
measure of national human capital be developed to reflect adequate content of HC
identified in the literature? 3) What is the preliminary evidence supporting the validity of
the newly developed human capital index? This analysis resulted in the formation of a
new human capital index, which is expanded due to the incorporation of new variables
together with the routinely used education measures.
The sample panel data is from 163 countries for the years 2000-2005. Literature
content analysis, factor analysis and regression analyses are used to support the
exploration of the research questions. The results of the analyses suggest that a human
capital model, which includes additional variables together with currently used education
variables, predicts the level of national economic development significantly better than
the model which includes only education measures. These results have implications for
human resource development, corporate human capital management, national education,
and international aid policies.

v
DEDICATION
In Honor of My Parents Nina Nikolaevna and Aleksandr Vasilievich

vi
ACKNOWLEDGEMENTS
The successful completion of my dissertation was possible thanks to the support
of many people, including my committee members, professors, friends and family. First
of all, I would like to thank my primary advisors, Dr. Toby Egan and Dr. Anthony Rolle.
Their support and guidance was crucial in me navigating the ocean of research. They
generously shared with me their wisdom, expertise, and time. Their attentiveness to
students, their honesty and open communication style helped me tremendously. I would
like to convey my gratitude to my other committee members, Dr. Angela Bies and Dr.
Larry Dooley. Dr. Bies played very active role throughout my degree. Her knowledge
and expertise added great value to my dissertation. I am also grateful to Dr. Larry Dooley
for giving me very valuable feedback in the short time he was given. I would like to
extent my gratitude to Dr. Bryan Cole, whose energetic approach to life has been an
example to me throughout my years at Texas A&M. I had a committee that every student
would dream of, and I am tremendously thankful for this.
I would also like to thank my professors who greatly contributed to the idea and
development of my dissertation. Dr. Lorraine Eden’s profound knowledge of
international business ignited and shaped my interest for international development. She
was always there for me, willing to share her experience and knowledge. Drs. Lori Taylor
and Jim Griffin were instrumental in developing my interest in economics and its
practical application in real life. Their feedback to my ideas was invaluable. Dr. Homer
Tolson’s appreciation for statistics helped me keep going when statistical calculations
seem endless.

vii
I would also like to thank my family and friends who have been of great support
and encouragement for me during the whole process: my parents Aleksandr Vasilievich
and Nina Nikolaevna; my sister Oksana; Gary and Eleanor Simons, Todd and Tasha
Simons and the whole Simons family; Paul and Becky Kimbrough; Charlie, Kathy, Kim
and Bethany Green; my whole church family in Ocala, FL; John, Kathy, Susan, and Carol
Kahil and the whole Kahil family; Joe and Tara Sanchez; Ralph and Betty Thomas; Olga
and Pavel Orlovi. Their inspiration has been immeasurable. Their belief in me helped me
keep going.
This dissertation has been written thanks to all of you.
Thank you!

viii
TABLE OF CONTENTS
Page
ABSTRACT......................................................................................................... iii DEDICATION..................................................................................................... v ACKNOWLEDGEMENTS................................................................................. vi TABLE OF CONTENTS..................................................................................... viii LIST OF TABLES............................................................................................... xi CHAPTER
I INTRODUCTION............................................................................... 1
Problem Statement ....................................................................... 1 Background of the Problem ......................................................... 5 Currently Used Measure of Human Capital................................. 10 Research Methodology ................................................................ 14 Analytical Techniques ................................................................. 18 Collection and Description of Data.............................................. 20 Summary and Discussion............................................................. 20 Implications for Education, HRD, and Development Research and Practice .................................................................. 23 Limitations of the Study............................................................... 25 Definition of Key Terms.............................................................. 27
II REVIEW OF THE LITERATURE..................................................... 29
Introduction.................................................................................. 29 Views on the Role of Human Capital in National Economics.................................................................................... 33 Different Methods of Measuring of Human Capital.................... 41 The Need for a More Precise Measure of Human Capital........... 53 Variables Suggested for Inclusion in Human Capital Measure ... 61 Summary of the Reviewed Literature on Human Capital............ 68 National Identity Awareness Factor............................................. 69 Family Background Factor .......................................................... 91 Character Factor........................................................................... 107 Conclusion ................................................................................... 120

ix
CHAPTER Page
III METHODOLOGY.............................................................................. 121
Introduction.................................................................................. 121 Methodology of Composite Index Creation ................................ 121 Application of Methodology of Composite Index Creation to the Expanded Human Capital Index ......................... 134 Validation of the Expanded Human Capital Index ...................... 172 Summary ...................................................................................... 177
IV DATA ANALYSIS ............................................................................. 178
Introduction.................................................................................. 178 Comparison of the Effect of UNHCI and Individual Variables (ID, Family, and Character,) on the Economic Development Variables................................................................ 180 Comparison of the Effect of UNHCI and EHCI-1 on the Economic Development Variables (Simple Case)............ 199 Comparison of the Effect of UNHCI and EHCI-II on the Economic Development Variables (General Case) .......... 217 Summary ...................................................................................... 229
V DISCUSSION, CONCLUSIONS, AND RECOMMENDATIONS ... 231
Introduction.................................................................................. 231 General Summary ........................................................................ 232 Analytical Summary .................................................................... 239 Implications for Research ............................................................ 242 Implications for Practice .............................................................. 250 Implications for Future Research................................................. 255 Strengths and Limitations of the Study........................................ 256 Summary ...................................................................................... 258
REFERENCES .................................................................................................... 260 APPENDIX A...................................................................................................... 291 APPENDIX B ...................................................................................................... 292

x
Page APPENDIX C ...................................................................................................... 299 APPENDIX D...................................................................................................... 306 APPENDIX E ...................................................................................................... 311 VITA.................................................................................................................... 341

xi
LIST OF TABLES
TABLE Page 1 Comparison of Basic Socio-Economic Variables for Selected Countries ..................................................................................................... 3 2 Ethnic/Linguistic/Religious Cohesion in a Country ................................... 138 3 Level of Total Central Government Consumption Minus Military Expenditure as Percent of GDP .................................................................. 140 4 Corruption Perception Index....................................................................... 141 5 Gini Coefficient .......................................................................................... 142 6 Length of Countries’ Independence (in years)............................................ 143 7 Government Effectiveness Indicators ......................................................... 143 8 Voice and Accountability Measure............................................................. 144 9 Nobel Prize Laureates in a Country (1901-2005) as a Percent of the Total Number of Nobel Prize Laureates in the World................................ 144 10 Number of Olympic Medals Won by a Country (1998-2005) as a Percent of the Total Number of Olympic Medals Won by All Countries (1998-2005).......................................................................... 145 11 School Life Expectancy in Years................................................................ 146 12 Number of National Holidays That a Country Celebrates.......................... 146 13 Reported Police Offenses Rate ................................................................... 147 14 Elections Participation Rate........................................................................ 147 15 Independence of Judicial System ............................................................... 149 16 Percent of People in a Country Who Are Not in Prison (Reverse of Prison Population Rate)........................................................... 149 17 Percent of Deaths in a Country as Calculated Without Suicide Mortality (Reverse of Suicide Rate Measure) ............................................ 150

xii
TABLE Page 18 Expenditure on Leisure as Percent of the Total Family Consumption ....... 151 19 Population Above Income Poverty Line..................................................... 152 20 Parliamentary Seats Held by Women ......................................................... 152 21 Political Rights and Civil Liberties Measure .............................................. 153 22 Attitude Toward Women in a Society ........................................................ 153 23 Average Number of Children in a Household ........................................... 154 24 Family Size ................................................................................................. 154 25 Urban Population Distribution.................................................................... 154 26 Divorce Rate ............................................................................................... 155 27 Existence of at Least One Social Security Program Oriented Toward Families ......................................................................................... 156 28 International NGOs Membership Density .................................................. 156 29 Comparison Between Effects of National Identity Awareness Factor and UNHCI on the Outcome Variables: 2000-2005................................... 181 30 Comparison Between Effects of Family Factor and UNHCI on the Outcome Variables: 2000-2005 ...................................................... 186 31 Comparison Between Effects of Character Factor and UNHCI on the Outcome Variables: 2000-2005 ...................................................... 191 32 Regression Results for Export of Services by Countries and Their HC Index: 2002-2004 and 2003-2005 Averages ........................................ 201 33 Regression Results for Countries’ High-Value-Added Export and Their HC Indices: 2000-2005............................................................... 204 34 Regression Results for Countries’ FDI Performance Indices and Their HC Indices: 2000-2005 ..................................................................... 207 35 Regression Results for Export of Services and Composite Variables of the Expanded HC Index-1: 2002-2004 and 2003-2005 Averages ......... 210

xiii
TABLE Page
36 Regression Results for High-Value-Added Export and Composite Variables of the Expanded HC Index-1: 2000-2005................................... 213 37 Comparison of Factor Loadings for ID + UNHCI, Family + UNHCI, and Character + UNHCI: 2000-2005 ......................................................... 219 38 Comparison of Correlation Coefficients Between National Identity Awareness Factor with UNHCI, Family Factor with UNHCI, and Character Factor with UNHCI: 2000-2005................................................. 219 39 Comparison Between Effects of UNHCI, EHCI-1 (Simple Case), and EHCI-II (General Case) on the Outcome Variables: 2000-2005................ 222 40 Comparison between Average Effects of UNHCI, EHCI-1, and EHCI-II on the Outcome Variables: Average of 2000-2005 Period ...................... 224

1
CHAPTER I
INTRODUCTION
Problem Statement
Consistent with classical human capital (HC) theory (Becker, 1964; Mincer, 1958;
Schultz, 1971), national HC is a combination of education and job experience in a
country’s population which is positively and strongly correlated with national economic
development. Therefore, it can be used to predict national economic performance. If this
theory holds, countries with similar educational attainment and years of employment in
their population have similar levels of HC, and consequently, should display similar
economic development (holding other variables constant). This paradigm (i.e., the more
education people have, the higher is the level of HC in a country, and the better its
economic prospects) is the one that governs financial and humanitarian aid to developing
countries and emerging economies. It is also used to make cross-country performance
comparisons, and assessments of economic prospects for individual countries. At the
same time, there is often discrepancy between the predicted and actual socio-economic
performance of countries. For example, the United Nations Conference on Trade and
Development (UNCTAD) (2004, 2005, 2006) generally makes predictions of the level of
foreign direct investments (FDI) in a country based on several variables, one of which is
national human capital (as measured by tertiary education enrollment in
________________________ This dissertation follows the style of Human Resource Development Quarterly.
2
the country). There is often a gap between the FDI’s predicted and actual performance.
Dean (2000) illustrated such a discrepancy in terms of an individual country: “the
average Ukrainian is as poor as the average Bolivian, but better educated than the average
American” (p. 95).
Currently used HC measures mainly assess educational attainment by relying
heavily on unified education-attainment measures. Such measures assess neither quality
of education, nor real skills that are empirically known to bring economic success.
Literacy rate and school enrollment rate (the variables routinely used to measure national
HC) may be similar for several countries, although the level of the countries’ socio-
economic development may be very different. For example, 2000-2005 average of the
United Nations Human Capital Index (UNHCI) was 0.94 for Greece, Hungary, Italy,
Japan, and Ukraine. At the same time, measures of socio-economic development were
much higher for Greece, Hungary, Italy and Japan than for Ukraine (see Table 1).
Although many factors other than HC (availability of business infrastructure,
openness of the market, accessibility of political/legal institutions, rule of law) are known
to affect national socio-economic development, these factors are based on human factors
(because they are created by human beings). Human capital is the intellectual power
behind other factors.

3
Table 1. Comparison of Basic Socio-Economic Variables for Selected Countries 2000-2005 Average Greece Hungary Italy Japan Ukraine GDP per capita (PPP) $19,060 $13,060 $25,180 $27,500 $4,830 Life Expectancy at Birth 78.85 72.07 79.4 80.97 66.5 Infant Mortality Rate 5.98 8.71 5.96 3.51 20.92 UNHCI 0.94 0.94 0.94 0.94 0.94 Where GDP per capita is measured in purchasing power parity
Life Expectancy at Birth is measured in years
Infant Mortality Rate is measured as deaths/1, 0000 births UNHCI is United Nations Human Capital Index
The method by which HC is currently measured is not fully capable of predicting
national economic performance, and there is a need to develop improved measures.
Numerous factors other than education and experience have been suggested as additional
key factors that affect HC (see Carneiro & Heckman, 2003; Fitz-Enz, 2000, Heckman,
2000; Psacharopoulos & Woodhall, 1985); however, by default, the HC of a country
continues to be measured as a function of educational variables. Design and utilization of
other measurement instruments involves other challenges which have resulted in the
international community using education-based tools. The difficulties that present
themselves when measuring HC by other than educational variables can be summarized
as follows:
• the problem of identifying other significant factors that affect HC
• the problem of adequately measuring these factors

4
• the problem of accessibility and availability of the measures for most of the
world countries
• the problem of assembling the suggested factors in one measurement tool
• the problem of validating this tool
As suggested, the need to address the aforementioned areas is evident in
drastically different economic performance indicators across nations with similar HC, as
assessed by unified measures of educational attainment of their populations (holding
other variables constant, which is the common practice). Furthermore, this need is
obvious in the failure of many attempts of international aid assistance to effect lasting
positive economic improvement in poor and developing countries. The currently used HC
measures are imprecise assessments of national economic performance. As such, there is
a need to develop and validate a more comprehensive measure of national HC, which
would more precisely estimate HC by including the multiple facets of this complex
phenomenon. Such a measure would better represent and advance understanding of HC
while contributing to effective national HC policies for individual countries.
The purpose of this dissertation is to construct and validate a more comprehensive
HC index, which captures numerous aspects of the construct of human capital and better
predicts the level of economic development of a country. Three research questions were
identified to guide the study:
1. What are the significant factors that affect national HC as revealed in the
literature?
2. Can an expanded measure of national HC be developed to adequately
reflect the content of HC identified in the literature?

5
3. What is the preliminary validity evidence for a newly developed HC
index?
The remainder of this chapter contains the background of the problem, research
methodology utilized, data used in the study, and limitations of the study.
Background of the Problem
Human capital theory originated approximately half a century ago under the
leadership of Jacob Mincer, Theodore Schultz, and Gary Becker. Generally, the term
human capital (HC) refers to productive skills and knowledge embodied in labor stock,
which have the economic property of future services of some value. Specifically, HC is a
measure of the economic value of people’s skill sets, consisting of their knowledge,
skills, abilities, attitudes and experiences (Becker, 1964; Heckman, 2000; Jaw, Yu
PingWang & Chen, 2006; Mincer, 1958; Schultz, 1961, 1971; Smith, 1776/1937). Later,
Schultz (1981) defined HC as “attributes of acquired population quality, which are
valuable and can be augmented by appropriate investments” (Schultz, p. 21). The
distinctive feature of human capital (compared to other forms of capital, for example,
physical and financial capital)—is that it is a part of human beings. “It is human because
it is embodied in man, and it is capital because it is a source of future satisfaction, or of
future earnings, or of both” (Schultz, 1971, p. 48). Becker suggested that human capital
includes qualities that raise future monetary and psychic income by increasing the
resources in people, and activities that influence income are investments in human capital
(Becker, 1964). In other words, any acquired qualities and abilities that help individuals

6
and groups be economically productive can be considered as individual/group human
capital.
The economic importance of HC lies in its contribution to creation of national
competitive advantage, and consequently, to national economic growth (Drucker, 1999;
Nehru, Swanson, & Dubey, 1995; Porter, 1998). HC is the intelligence and knowledge
behind other determinants of a country’s economic development (for example,
infrastructure, political/legal institutions, rule of law, business climate, etc.).
Consequently, the quest for better understandings of the determinants of economic
growth has stimulated strong interest in reliable estimates of HC (Baier, Dwyer &
Tamura, 2006; Barro & Lee, 2000; Globerman & Shapiro, 2002; Haveman, Bershadker
& Schwabish, 2003; Mankiw, Romer & Weil, 1992; Nehru, Swanson & Dubey, 1995;
Schneider & Frey, 1985; Warner, 2002). Human capital theory has become accepted as
one of the foundational theories of socio-economic development. It has gained increasing
attention with the unfolding of the era of knowledge economy, with knowledge-intensive
new technologies’ design and utilization becoming an everyday reality.
Although the classical human capital model is well established (Becker, 1964;
Mincer, 1958, Schultz, 1961, 1971), new discoveries are being made, and many questions
still need to be answered. One issue under discussion for a considerable length of time
has been the issue of factors that constitute HC. The classical HC model focused on
schooling and training as the major investments responsible for producting the skills and
abilities required for economic success. Mincer (1958, 1974) measured human capital as
a function of average years of schooling using a macro-equation of the form:
H = e p(s)

7
where s is average years of schooling, p is the rate of return on education, and e is an
efficiency index. He estimated the rates of return on education by equating the present
value of two earnings streams—with and without education. His model proposes that for
every year in school, earnings are multiplicatively augmented by the discount rate (the
discount rate on the resources invested during the period of education, generally equal to
the average rate on business capital).
Similarly, Becker (1962, 1964) measured HC in terms of the rates of return on
investments which were utilized to obtain it. He estimated the effects of investment in
HC by estimating the value of activities that influenced future real income through “the
imbedding of resources in people” (Becker, 1962, p. 9). He viewed education, on-the-job
training, medical care, and acquiring information about the market (which he called
“other knowledge”) as activities that influence future real income. His classical formula
for measuring return on on-the-job training is as follows:
MP+G=W+C
where MP is marginal product of labor, G is present value of return from training
collected by the firm, W is wages and C is the cost of training for the firm.
His basic formula for measuring returns on education measures the difference
between actual earnings and direct school costs, and is as follows:
W=MP-K
where W stands for net earnings, MP is marginal product of labor, and K is the direct
costs of acquiring education. This formula can be expanded further to include potential
earnings and indirect costs:
W=MPo-G

8
where MPo is the marginal product that could have been received, and G is the sum of
direct and indirect costs. Resources spent on acquiring information about the job market
and the market as a whole, as well as relocation can significantly raise income by the
function of increased opportunities and a better match between the individual’s HC and
the environment. These expenditures yield a return in the form of higher earnings than
would otherwise have been received. Resources invested in improvement of the
emotional and physical health of people are also a part of HC investment, from Becker’s
perspective (1964, 1993).
Schultz (1961, 1971, 1981) sought to clarify the investment process and the
incentives to invest in HC by calculating return on educational investment for different
social groups. He also calculated the share of national income as attributable to increases
in the stock of HC. Originally, his studies evolved around formal education. As his
research progressed, he pushed the theory by expanding HC to include a combination of
schooling, learning on the job, advances in health, migration, family factors and the stock
of information about the economy. His hypothesis was that the structure of wages was
primarily determined by investment in education, health, on-the-job training, gaining
information about the job market, and migration. He started with the proposition that
people improved their capabilities as producers by investing in themselves:
It implies that not all of the economic capabilities of a people are given at birth, or at age fourteen when some of them enter upon work, or at some later age when some complete their schooling; but that many of these capabilities are developed through activities that have the attributes of an investment. These investments in people turn out not to be trivial; on the contrary, they are of a magnitude to alter radically the usual measures of the amount of savings and capital formation. They also alter the structure of wages and salaries and the amount of earnings relative to income from property. (Schultz, 1971, p. 62)

9
Therefore, according to Schultz, economic abilities of people are predominantly a
produced means of production and most of the differences in earnings originate in the
differences in investments in people:
…to the extent that the more equal distribution of investments in man equalizes earnings among human agents, the hypothesis here proposed is that these changes in the investment in human capital are the major factor reducing the inequality in the distribution of personal income (p. 63).
His approach was to calculate return on education by calculating the net income
that different levels of education generated. By aggregating this on a national level, he
calculated return on education for different levels of education, as differentiated by
different social groups (e.g., a high school graduate female can earn an annual value of
$X. There are Y number of high school female graduates in a country. Therefore, XY is a
contribution of this social group with this kind of education toward GDP of this country).
Taking this number as relative to net national product, he calculated the value of HC
associated with different levels of education as relative to net domestic product.
Comparing the total cost of education (with earnings forgone as the major investment) to
the income obtained based on this level of education, he calculated return on investment
in education.
Although all three original theorists acknowledged that other factors, not only
education and training, influenced HC development, most of their work concentrated on
education and training as the measures of HC. As such, although the HC theory that they
created is strong, it would definitely benefit from strengthening the measurement
instruments for HC (Hartog, 2001; Heckman, 1995, 2000; Heckman & Cunha, 2007).

10
Therefore, the purpose of this dissertation is developing and validating a new method of
measuring HC.
Currently Used Measure of Human Capital
Current scholars build on classical HC theory, while suggesting different
combinations and/or forms of education-training measures. More specifically, Baier,
Dwyer, and Tamura (2006) computed HC as a sum of average education (measured in
school years) and average experience (measured as average age minus average years of
schooling) with assigned weights measured in increased earnings coefficients. Gemmell
(1996) constructed an alternative measure of HC by distinguishing between stocks and
flows of school enrollment rates. Cohen and Soto (2001) sought an improved measure of
HC by employing direct country census data on school enrollment in a country. Mulligan
and Sala-i-Martin (1997) measured HC for an economy as the sum of all workers
weighted by the ratios of their wages to the wage of the zero-human-capital-worker.
Noorbakhsh, Paloni, and Youssef (2001) calculated HC as proxied by three
measures: secondary school enrollment ratio, number of accumulated years of secondary
education present in the working-age population, and number of accumulated years of
tertiary education present in the working-age population. For them, the first measure
reflects a flow of investment in HC. The other two measures reflect the education stock
of a country. The authors did not attempt a combination of those three variables in any
form but used all of them individually as “HC group.” Warner (2002) suggested
calculating an HC index as a simple average of standardized indices of the educational

11
attainment of population (i.e. primary, secondary, and tertiary) and a subjective measure
of schooling quality.
Many international aid and development organizations calculate and utilize HC
indices that do not measure the actual economic outcomes of HC in terms of return on
investment, but instead, measure the intensity of factors contributing to it (e.g., Human
Development Reports of United Nations Development Program (UNDP), United Nations
(UN) E-Government Readiness Assessments, United Nations World Public Sector
Reports). HC indices created this way are based on the degree of presence of specific
factors. When national HC indices are compared, what is compared is not the actual
amount of wealth that HC produces, but the degree of presence of variables that
contribute to the HC measure. School enrollment and literacy rates are used by default as
the contributing measures of HC. Generally, the combination formula is straightforward.
For example, according to the UNDP, the HC index is based on UNDP Education Index
and is a composite of the adult literacy rate and combined primary/secondary/tertiary
gross enrollment ratio with two thirds of the weight given to adult literacy and one third
to gross enrollment ratio (UN, 2008). For example, for country X, with an adult literacy
rate of 96.3 per cent and a combined gross enrollment of 81.2 percent in 2002, the
HC/Education Index would be (United Nations, 2008):
2/3 (0.963) + 1/3 (0.812) = 0.913
Overall, the following variables, in different combinations, have been included in
HC measures by different researchers: a) enrollment in tertiary education; b) combined
primary/secondary/tertiary gross enrollment ratio; c) adult literacy rate; d) job experience;
e) expenditure on health; f) expenditure on education; g) mortality rate; h) GDP per

12
capita; i) growth rate of the labor force. Many of these indicators are education-related, a
consequence of availability of data and well-established meaning of education-related
measures. As Schultz (1981, p. 8) put it, “Meanwhile, … there have been important
advances in economic thinking with respect to investment in human capital…most of the
work thus far has concentrated on the first of the set (education).” Becker (1964)
concurred:
the investment period of education can be measured by years of schooling, but the periods of on-the-job training, of the search for information, and of other investments are not readily available…Unfortunately, few empirical studies of rates of return on other (than education) human capital have been made (p. 44, 90).
Weisbrod (1961) explained the reason even more directly:
We view the value of a person in terms of his worth as a productive asset, having some marginal productivity per period. A person’s value as a companion to, and the leader of, his family is neglected—not because it is deemed insignificant or irrelevant, but because it seemed too difficult to measure, at least for the present (p. 426).
However, with the increase in the number of studies which failed to find strong support
for the basic HC theory hypothesis that the level of human capital as measured by the
level of educational attainment, was a strong predictor of economic success on individual
and national levels (Baier, Dwyer, & Tamura, 2006; Bowles, Gintis, & Osborne, 2001;
Graaf & Huinink, 1992; Hartog, 2001; Hauser & Sewell, 1986; Romer, 1989; Werner &
Smith, 1992), a need for more comprehensive measures of HC has become prominent.
Numerous authors (Ben-Porath, 1980; Griliches, 1997; Heckman, 1995, 2000; Heckman
& Cunha, 2007; Psacharopoulos & Woodhall, 1985) have suggested that in order to
increase accuracy in HC assessment, more comprehensive measures need to encompass
more characteristics than the basic school enrollments and literacy rates, and need to be

13
based on broader meanings of the phenomenon of HC. Specifically, Nehru et al. (1995)
stated that though
the measurement of HC should cover the range of investments that human beings make in themselves and in others, including formal and informal education, on-the-job training, health, nutrition, and social services….So far, no researchers have put together such a composite measure (p. 380).
Moreover, according to Heckman (2000):
Current policies regarding education and job training around the world are based on fundamental misconceptions about the way …skills embodied in persons are produced…The preoccupation with cognition and academic “smarts” as measured by test scores to the exclusion of social adaptability and motivation causes a serious bias in the evaluation of human capital interventions (p. 4). Numerous variables have been suggested as the ones that help shape HC. For
example, Porter (1998) and Harrison (1992) stated that the human resources of a nation
include not only skills, but work ethic as well. Schultz (1971) suggested that HC could be
displayed in different forms: “If it were possible to aggregate all of the different forms of
human capital, it would exceed by a wide margin all nonhuman capital” (p. vii). Other
researchers (Prizel, 1998; Sadie, 1960; Sapford & Abbott, 2006; Shulman, 2005) spoke
about the role of national identity awareness as a contributing factor toward the HC of a
nation. Ben-Porath (1980) stressed importance of families in development of HC in a
nation. Becker emphasized the role of emotional health and character qualities as
contributing factors of HC. As a result of the ongoing discussion, additional variables that
have the potential to affect HC have been suggested, such as:
• Character qualities of population
• Cultural values
• Ethical values
• Family factor

14
• Measure of trust in a country
• Morale of the population
• Emotional health
• National identity awareness in the population
• National unity
• Religion
• Social skills
• Variety of non-cognitive skills/Social Adaptability
However, existing literature provides little evidence that these variables have been
structurally developed, validated or used to create a new HC index. Furthermore, there is
no consensus regarding specific variables that may bring significant improvement to the
HC index. Consequently, there is still a lack of agreement regarding the most robust
measure of national HC; therefore, no consensus exists regarding the most appropriate
HC measure for international comparison. Overall, human resource development (HRD)
professionals, economists, and educators have made little progress in solving the tricky
problem of how to measure HC within a single country over time, let alone for
comparison between countries.
Research Methodology
The purpose of this dissertation is to construct and validate a more comprehensive
human capital index, which captures more aspects of HC than conventional indices.
Composite index creation methodology is used as an overall framework for achieving this
purpose. A sizeable literature exists on the topic of composite index creation (Adelman &

15
Taft-Morris, 1972; Babbie, 2004; Baster, N, 1972; Booysen, 2002; Healy & Cote, 2001;
Johnson & Reynolds, 2005; Kallman, 1997; Stapleton & Garrod, 2007). Overall,
composite indices can be defined as “a synthesis of numerous factors into one given
factor” (Booysen, 2002, p. 118, quoting Sainz, 1989). These are the measures arrived at
via some empirical aggregation of a number of diverse variables, and are evaluated
according to their content, method of creation, application, focus, clarity, availability and
flexibility. In other words, good composite indices need to be sufficiently sensitive to
differences in measurement constructs, reliable in terms of repeated measures yielding
stable results, and accurate in being free from systematic error (Adelman & Morris,
1972).
Index creation involves four general flexible steps: selection of variables,
weighting/scaling, aggregation, and validation (Babbie, 2004; Johnson & Reynolds,
2005; McGranahan, 1972). In terms of creating the new HC index, these steps are
followed through the following process:
• Determining what factors other than basic educational variables may affect
development of HC in a nation. Different researchers have suggested different
additional factors as the ones that may affect HC in a country. The study’s
purpose is to collect and evaluate the suggested ideas by way of content
analysis of the related literature.
• Creating models of these factors. After identifying additional factors, the
study’s purpose iss to explore and analyze their structure in order to suggest a
potential set of measurable indicators of performance for each of these
multidimensional factors. Broad meanings and definition of the factors serve

16
as the foundation of the analysis, which is carried out by way of a separate
content analysis of the related literature for each separate factor. A hypothesis
of the structure of each factor is formulated.
• Determining what existing empirical measures may serve as proxies for
construction of these factors. Empirically observable and measurable proxies
for every variable comprising each of the suggested latent factor constructs
are searched for among the existing publicly available measures. The search is
based on the hypothesized structure and the definition of the factor. The
researcher seeks to include the aspects that are conceptually relevant to a
particular factor, as well as available for all (or most of) the world’s countries.
• Testing each model of the factor against the data. Factor analysis technique is
used in this step as suggested by Pedhazur and Schmelkin (1991) and Field
(2005). Factor analysis is generally used to uncover the latent structure of a set
of variables. Confirmatory factor analysis (CFA) seeks to determine if the
number of factors and the loadings of measured variables on them conform to
what is expected on the basis of a pre-established theory or hypothesis. The
hypotheses of the structure of factors are formulated in Step 2. The current
step tests the hypotheses to see whether the collected data correspond to the
hypothesized structures, and to create the final models of factors.
• Creating a new HC Index including the newly developed factors together with
the conventionally used factor. Aggregation of the chosen variables into the
index is the final step in the process of actual construction of the index. The
factors can be aggregated at their face value or weights may be assigned to

17
them. In the area of composite index construction, aggregation and weights of
components are always potential areas of methodological controversy. A
group of researchers (Babbie, 2004; Johnson & Reynolds, 2005; Stapleton &
Garrod, 2007) have suggested that equal weighting should be the norm.
Another option is assigning weights based on an expert’s opinion or policy
aims (Harbison & Myers, 1964). Because weighting potentially hinders the
meaning of the employed indicators, and because variables are automatically
standardized during the process of factor analysis, no additional
scaling/weights assignment is used in the study. Only factor scores created by
the factor analyses are used. All further analysis is carried out on the extracted
factor scores rather than the original data, as suggested by Field (2005). In
order to obtain one score for every construct, additive aggregation technique is
chosen as suggested by Field (2005). In other words, extracted factor scores
for every construct are added together in order to arrive at one score for every
construct. Finally, scores of every multidimensional construct are added
together with the currently used United Nations Human Capital Index
(UNHCI) in order to obtain a new expanded HC index (EHCI-1). This
methodology is consistent with the way many indices, for example, Human
Development Index (HDI) and UNHC, are created. As an extension of the
process, EHCI-2 is created. Its difference with EHCI-1 is in the fact that
UNHCI is treated as a part of one of the newly created constructs (Family
Background construct) instead of being treated separately, as in EHCI-1. This

18
allows for reduction of uncertainty in the new index and improves its
predictive power toward economic measures.
• Validating the newly created Index. It has been suggested (Diamantopoulos &
Winklhofer, 2001; Hauser & Goldberger, 1971; Jarvis, Mackenzie, &
Podsakoff, 2003; Jöreskog & Goldberger, 1975) that estimation of the
relationship between output indicators (the ones that represent effects of the
construct) and the construct (as the input indicator) can serve as a means of
validity testing. In addition, it is possible to assess the contribution and
significance of the individual indicators by focusing on their particular
relationship with the output indicator. Regression analysis is used in this step
as a way of conducting the suggested examination. Regression analysis
measures the degree of linear relationship between the predictor variable and
the criterion variable (Wooldridge, 2006), and as such is deemed to be an
appropriate tool here.
Analytical Techniques
HC can be understood as demonstrating itself twofold: through factors that
contribute to it (the input factors), and through factors which are indicative of its level
(the output factors). Representative consequential factors, through which HC is
theoretically known to be displayed (the output factors), include the export of high-value-
added goods (Dyker, Nagy, & Spilek, 2003; Krugman, 1991; Smith, 2005; Wolfmayr-
Schnitzer, 1998), export of services (Kalotay, 2008; United Nations Conference on Trade
and Development, 2004), amount of foreign investments in a country (Dunning &

19
Narula, 2004; Hanson, 1996; Noorbakhsh, Paloni & Youssef, 2001) the number of
scientific discoveries, number of patents, etc. The degree of relationship between the
input and output factors can be tested to determine how much of variation in the output
factors can be explained by the new measure of HC. If the new Human Capital index
(HCI) is a good measure of the real state of HC in a country, it must be highest in the
countries that demonstrate the highest HC—intensive output (Veenhoven, 1993).
Univariate and multivariate statistical analyses are conducted to examine each
variable as well as each hypothesized HC/economic variable relationship. Univariate
statistics—means, medians, modes, standard deviations, ranges, range ratios,
percentiles—are generated utilizing the Statistical Processing for Social Sciences (SPSS-
16.0) software package, and used to provide general description of individual variables.
Multivariate statistics—correlations, factor analyses, different types of ordinary least
squares (OLS) regression analyses—are utilized to describe relationship between the
variables, and make inferences regarding explanatory power of the newly developed
EHCI as compared to UNHCI.
External validity of EHCI is determined based on its ability to predict another
phenomenon better than UNHCI. Generally, in order to conduct this kind of validation,
another variable, which is known to be correlated with the tested measure, must be
examined in relation to this measure. The researcher suggests using three measures:
export of high-value-added products, export of services, and foreign direct investments—
as the outcome measures. Several steps of analyses are conducted. Initially, UNHCI is
examined as the primary determinant of the outcome economic measures. Next, three
newly suggested variables (separately) are examined as the primary determinants of these

20
measures. The difference between these analyses’ results is formulated. Ultimately, the
relationships between UNHCI and the outcome economic variables are compared with
the relationships between both types of newly created HCIs (EHCI-1 and EHCI-2) and
the outcome economic variables. EHCI-2 is chosen as the one that has the highest
predictive power in terms of economic outcome. Therefore, it is concluded that
expanding the currently used UNHCI via additional variables is beneficial. This index
has demonstrated a certain level of validity, and may be used for future research in the
field.
Collection and Description of Data
The data obtained and examined in this study spans six calendar years, 2000
through 2005. The data is cross-sectional time series data publicly available on websites
of United States Agency for International Development (USAID), United Nations (UN),
World Bank, Organization for Economic Cooperation and Development (OECD),
International Labor Organization (ILO), World Health Organization (WHO),
Encyclopedia Britannica, as well as statistical offices of individual countries. This study
assesses the whole population of independent world countries with 100,000+ citizens.
According to the US Department of State, the number of such countries is 163.
Summary and Discussion
The goal underlying this dissertation is to design and validate an expanded
measure of national HC. Based on the review of the relevant literature and the evidence
provided in this dissertation, a statement can be made that national HC is a

21
multidimensional construct, which includes diverse factors. Furthermore, a valid
measurement instrument can be developed to assess the level of national HC
development. The index developed in this study demonstrates a certain level of validity,
and may be used for future research in the field.
Although a country’s political situation, potential economic risk, rule of law, and
available legal/business infrastructure have been named as the primary factors of
economic development, it has also been argued that a country’s HC is probably even
more important. HC is a measure of the economic value of people’s knowledge, skills,
abilities, attitudes and experiences. HC is the “brain” behind all other determinants. The
level of development and quality of HC are two of the most important factors that
differentiate between countries with similar geographic and natural resources, but vary
differently in terms of their socio-economic development. HC is a crucial input element
in national politico-socio-economic development equations. Therefore, it is very
important to correctly assess HC in a country. Accurately measuring HC will reduce
“surprises” in national socio-economic development. Such unexpected results often lead
to creation of a “potential/performance” dichotomy. More precise measures of HC can be
instrumental in bridging the gap between national socio-economic potential and
performance indicators.
A system of social reporting has two main functions: policy analysis and public
information. As for the former, indicators are an instrument for policy analysis and serve
as a foundation of policy creation by the central and local governments. As for the latter,
they serve as a source of information to the general public and are supposed to inform
citizens and give them perspective on national development by comparing their country

22
with other countries (Kallmann, 1997; Vogel, 1989). Overall, socio-economic indicators
can serve as a tool to discover problems and develop alternative solutions. A newly
created HCI could serve such a purpose as it helps to see national HC from a broader
perspective. The new index can help direct national finances to the areas they are needed
most of all and are most responsible, from a cost-benefit perspective. HRD professionals
and educators may be particularly interested in this index.
As suggested by several HRD scholars and professionals (McLean, 2001, 2004;
McLean, Bartlett, & Cho, 2003), national HRD should go beyond employment issues and
include a host of other considerations that have not typically been considered as human
capital investment, such as culture, community, health and many others. A view of labor
force only in terms of unified “faceless” manpower greatly diminishes the diversity of
ways training and development can be conducted. This dissertation provides evidence
that human capital on a national level is formed by many factors. Specifically, this study
assesses National Identity Awareness, Character Strength, and Family Background as
factors contributing to HC development, and provides some evidence toward the
significance of these factors. Therefore, these and other intangible factors need to be
taken into consideration by HRD professionals and scholars in their pursuit of improving
employee quality and increasing organizational effectiveness.
Furthermore, this dissertation provides support for the view expressed by a large
group of educational scholars and economists (e.g., Hanushek, 1997; Heckman, 2000;
Heckman & Cunha, 2007) about the importance of non-cognitive qualities in the
economic success of individuals. It argues that other factors, for example, character
qualities and social skills, play important roles in achieving personal welfare. Therefore,

23
educational institutions need to pay as close attention to providing opportunities for
students to develop these traits as they do in providing opportunities to develop academic
skills. National Educational ministries need to create policies which will raise this issue
to the national level. This way, it will not depend on the initiative and willingness of
individual schools, but will be required for all schools. The importance of the Family
factor in increasing the level of national HC indicates the need to stream resources toward
strengthening the institution of family in a given country.
The proposed dissertation is organized in the following format. Chapter II
contains a review and critique of related research literature on HC conceptions and
measurement. Chapter III focuses on research methodology, and development of the
models of additional variables suggested to be added to the current HC measure. Chapter
IV describes processes and results of the validation of the newly created index. Chapter V
contains conclusions, policy recommendations, and implications for further study.
Implications for Education, HRD, and Development Research and Practice
This study contributes to Education, HRD, and Development research in several
ways. First, it provides a new, valid instrument for broad cross-country assessment of the
intangible factors of National Identity Awareness, Character, and Family Background
developed by using quantitative measures. This offers opportunities for use by
researchers and practitioners in future study and practice. Second, it provides evidence
that a broad and diverse measure of national HC can be developed. The most effective
measures of latent variables are those that contain as much information as possible about
their essential attributes (Babbie, 2004; Globerman & Shapiro, 2002; Johnson &

24
Reynolds, 2005). Consequently, the newly created and expanded measure of HC can
provide the academic community with a more reliable estimator of HC. This expanded
index has the potential to better reflect the actual HC level in a country, and be more
reliable in predicting a country’s economic development. The approach used herein
advances the work by HRD scholars including Harbison and Myers (1964) who have
been identified as the earliest founders of the term human resource development (Wang
& McLean, 2007). A major contribution of these scholars was the identification of
economic indicators associated with national HRD. Use of this instrument can help
Education/HRD professionals to assist in determination and development of a high level
of HC in a country.
This study also has some implications for Education, HRD, and Development
practice. With further validation evidence, the new index can serve as a useful tool for
education and labor policy creators at central and local government levels. The new index
can be used as a diagnostic tool in identifying HC development needs of individual
countries. This index can help create policies, which will bring positive changes to
development by addressing areas that are important to specific countries. A newly formed
index may support directing resources to the areas that are most responsive from a cost-
benefit and capacity development perspective. Based on preliminary validity evidence,
the three suggested new variables in the index would likely attract attention of
policymakers in order to achieve the desired level of HC development. Such a measure
may be beneficial in the formation of individual policies for countries, which will bring
positive changes to their socio-economic development by addressing the areas that are
important for specific countries.

25
The proposed model of HC improves our understanding of how national HC can
be developed. It suggests a holistic approach to HC as it is influenced by many national
factors and it addresses the issue of access to valuable new data for use in HC assessment
through the use of established indices. The evidence of positive correlation between the
three newly suggested variables and economic development variables implies a need to
maintain balance among these key factors and educational factors in order to achieve the
desired level of national HC development. The model proposed in this study informs
educational/HRD leaders and the general public that they need to balance the relationship
among these key factors. Additionally, this new measure may have an impact on the way
international help is organized and provided and G8 ministries are conducted.
Limitations of the Study
As with all research, there are several limitations in this study. One of the major
purposes of this study is validation of the index construct. According to several
researchers (Diamantopoulos & Winklhofer, 2001; Pedhazur & Schmelkin, 1991),
construct validation is fraught with difficulties and inherent ambiguities. A given
observed variable may reflect different constructs (e.g., the same behavior may reflect
different motives), and the same construct may be manifested by different observed
variables (e.g., the same motive may be reflected by different behaviors). Another
problem is the fact that indicators may have different meanings in different places,
cultures, subcultures, and the like. Moreover, even within a given place, the meanings of
indicators may change over the course of time because of historical events and changes in
norms, to name a few.

26
An important limitation is caused by availability and quality of data. Although
some sources have data available for all the world’s countries list-wise (for example, the
World Bank, United Nations Development Program (UNDP), other sources (for example,
International Labor Organization [ILO], World Health Organization [WHO]) have a
limited number of countries. The researcher spent considerable time looking for
comparable data across sources and making sure that only the data created by the same
methodology was used in the study. Sometimes, the researcher had to estimate the data
by herself, utilizing methodologies to calculate the available measures. Missing data in
the data sources has been another major difficulty. A source may have all the world’s
countries list-wise, but have missing data for some. This necessitated the use of missing
data substitutes such as regional averages and interpolation. Furthermore, data reporting
is often inconsistent even as conducted and reported by the same agency.
Finally, another limitation comes from the chosen methodology itself. Factor
Analysis (FA) was extensively employed in the study. The literature on Factor Analysis
generally presents a wide variety of contrasting and contradictory views on almost every
aspect of FA and often lacks uniformity in terminology and notation (Pedhazur &
Schmelkin, 1991). Limitations such as the aforementioned are common for this type of
undertaking and many of the limitations identified are consistent with limitations of
currently utilized measures of HC. In spite of these limitations, the results of this study
improve upon previous efforts and relevance for improved application of HC
measurement in national and international contexts.

27
Definition of Key Terms
Composite index: a synthesis of several factors into one index, arrived at by way of
empirical aggregation (Booysen, 2002).
Expanded Human Capital Index -1 (EHCI-1): a new HC index developed in this
dissertation. It is a combination of United Nations Human Capital Index (UNHCI) and
three additional factors: National Identity Awareness, Character, and Family Background.
Expanded Human Capital Index -2 (EHCI-2): a new HC index developed in this
dissertation. It is a combination of United Nations Human Capital Index (UNHCI) and
three additional factors: National Identity Awareness, Character, and Family Background.
Its difference with EHCI-1 is in the fact that UNHCI is incorporated as a part of Family
Background factor instead of being treated separately, as in EHCI-1.
Foreign Direct Investment (FDI): investment made by a foreign individual or a foreign
company in the productive capacity of another country (Dunning, 1998).
Human capital: a measure of the economic value of people’s skill sets, which consist of
knowledge, skills, abilities, attitudes and experiences (Shultz, 1981).
Index: a method of accumulating scores on individual items to form a composite measure
of a complex phenomenon (Babbie, 2004).
Human Resource Development: the process of increasing the knowledge, skills, and
capacities of all people in a society with the goal of national economic development and
development of politically and socially responsible citizens (Harbison & Myers, 1964).
International Human Resource Development: a field of study that focuses on cross-
border cooperation between government, non-government, and business entities. The

28
purpose of this cooperation is systematic development of human potential (Wang and
McLean, 2007).
International Labor Organization (ILO): one of the oldest components of the UN system
of specialized agencies, which advances the cause of social justice and aims to improve
conditions of the labor force throughout the world (it is based in Geneva).
Labor force: the group of people in a nation that have potential of being employed (Finz-
Enz, 2000).
Latent variable: intangible variable that can be proxied by empirical measures (Jöreskog
& Goldberger, 1975).
United Nations Human Capital Index (UNHCI): a measure of human capital calculated in
an index form, which is used by the United Nations.
United Nations Development Program (UNDP): a body of the United Nations which
promotes human development in developing countries.
United States Agency for International Development (USAID): an agency of the US
government whose primary objective is to assist developing countries in their
development while furthering US objectives.
The International Bank of Reconstruction and Development (IBRD): international
financial institution cooperatively owned by 171 member countries providing financial
and technical assistance to least developed countries.
United Nations Conference on Trade and Development (UNCTAD): permanent
intergovernmental body, principal organ of the United Nations General Assembly dealing
with trade, investments and development issues.

29
CHAPTER II
REVIEW OF THE LITERATURE
Introduction
The Origin of Human Capital Theory
Human capital (HC) theory originated in the mid-twentieth century under the
leadership of Jacob Mincer, Theodore Schultz, and Gary Becker. They formulated the
theory based on their own research, as well as on ideas of several prominent economists
before them—Adam Smith (1937/1776), Irving Fisher (1906), and Frank Knight
(1944)—who broadly viewed acquired and useful human abilities as fixed capital, similar
to machines, buildings, and land. For example, Adam Smith wrote:
The acquisition of such talents, by the maintenance of the acquirer during his education, study, or apprenticeship, always costs a real expense, which is a capital fixed and realized, as it were, in his person. These talents, as they made a part of his fortune, so do they likewise of that of the society to which he belongs. The improved dexterity of a workman may be considered in the same light as a machine or instrument of trade which facilitates and abridges labor, and which, though it costs a certain expense, repays that expense with a profit. (Smith, 1776/1937, p. 265-266)
Since it was a new concept, HC theory encountered much criticism from the majority of
economists who considered physical equipment as the only non-financial capital. As
Becker (1993) acknowledged, “human capital is so uncontroversial nowadays that it may
be difficult to appreciate the hostility in the 1950s and 1960s toward the approach that
went with the term” (p. 392). Gradually, economists and other professionals accepted the
concept of human capital as an invaluable tool in the analysis of different socio-economic
issues. Since that time, HC theory has become one of the foundational theories of socio-
economic development and has been gaining attention in the unfolding era of the

30
knowledge economy with knowledge-intensive technologies’ design and utilization
becoming an everyday reality.
Schultz (1971), illustrating the crucial importance of HC, described the “mystery”
of quick economic recovery after the WWII:
The toll from bombing was all too visible in the factories that laid flat, the railroad yards, bridges, and harbors wrecked and the cities devastated. Structures, equipment, and inventories were all heaps of rubble. Economists were called upon to assess the implication of these wartime losses for recovery…It is clear that they overestimated the prospective retarding effects of these losses…The judgment that we formed soon after the war proved to be so far from the mark. The explanation that now is clear is that we gave altogether too much weight to nonhuman capital in making these assessments. We fell into this error … because we failed to take account of human capital and the important part that it plays in production in a modern economy (p. 34).
Human capital theory became especially prominent in the early 1990s, when it
helped to illuminate the reason for the failure of the standard neoclassical growth model
Y= f (K, E, L)
(where Y is the output, E is an efficiency index signifying technological progress, K is
financial capital stock and L is labor input) to explain non-convergence in per capita
production level internationally, which the growth model predicted (Lucas, 1990). At that
time, the standard neoclassical growth model was revised to include human capital,
which improved the fit of the model.
Although the basic human capital model is well-established, many questions still
need to be answered, and new discoveries are being made. HC theory and its practical
application remain a growth industry just as they have been since its origin (Cohen &
Soto, 2001; Hartog & Maassen van den Brink, 2007). This chapter reports on the
literature which helps illuminate one such unanswered question. It investigates the
content of HC, yet more specifically, it studies the question of what factors influence

31
development of HC in a country and therefore, need to be assessed while measuring
national HC for cross-country comparisons.
Historical Perspective on HC
Generally, the term human capital (HC) refers to productive skills and knowledge
embodied in labor stock, which have the economic property of future services of some
value. According to the original HC theory (Becker, 1964; Mincer, 1958; Schultz, 1961),
education is the major factor that enhances skill level in individuals and thereby human
capital. A higher skill level in the workforce increases the overall production capacity.
The classical HC model focused on education (and the measurement of it) because it was
the major national investment and was associated with development of workforce skills
and abilities required for economic success. Consequently, HC theory is a theory of joint
distribution of education and earnings (Hartog, 2001; Psacharopoulos, 1988). This core
model was developed during the period when academic education and on-the-job-training
were considered the major, and probably the only, sources of economic success.
Consequently, all three founders of the theory originally concentrated their attention on
returns to education and training in their attempt to calculate growth of HC. Since that
time, equating education (although measured in different ways) with human capital
became the leading framework, which is still supported by the majority of economists,
and is used by default. For example, speaking about the role of HC in economic
development, Benhabib and Spiegel (1992) stated: “a standard economic approach is to
treat human capital, or the average years of schooling of the labor force, as an ordinary
input in the production function” (p.143).

32
Mincer (1958, 1974) estimated the rates of return on HC by equating the present
value of two earnings streams (with and without education). His model proposed that
with each school year, earnings are multiplied by the discount rate (i.e., the rate on the
resources invested during the period of education, generally equal to the average rate on
business capital). Thus, an increase in annual earnings is compensation for earnings
postponed by education. Consequently, it is possible to say that one can estimate the rate
of return as the coefficient of schooling years in a cross-section regression for individual
earnings. The regression coefficient of earnings on education is interpreted as the return
to education. Therefore, all that is necessary to calculate increase in HC as return on
education is the information on earnings of individuals with different education and work
experience (Hartog & Oosterbeek, 2007).
Research by Schultz (1961, 1962, 1971) sought to clarify the investment process
and incentives to invest in human capital by calculating return on education for various
groups using the investment approach. His early studies revolved around formal
education and organized research. As his research progressed, he pushed the theory by
expanding HC to include education, training, work experience, migration and health
(1981, 1993), building on his earlier ideas:
Much of what we call consumption constitutes investment in human capital. Direct expenditures on education, health, and internal migration to take advantage of better job opportunities are clear examples. Earnings forgone by mature students attending school and by workers acquiring on-the-job training are equally clear examples. Yet, nowhere do these enter our national accounts. The use of leisure time to improve skills and knowledge is widespread and it too is unrecorded. In these and similar ways the quality of human effort can be greatly improved and its productivity enhanced. I shall contend that such investments in human capital accounts for most of the impressive rise in real earnings per worker (1961, p.1).

33
Becker (1962) estimated the effects of investment in HC for the level and distribution of
earnings by estimating the value of activities that influence future real income through
“the imbedding of resources in people” (p. 9). These activities include education, on-the-
job training, medical care, and acquiring information about the market (which he called
“other knowledge”).
Later, the hypothesis emerged that academic education (as measured in
conventional enrollment rates, years of schooling, or literacy rates) was not the only
factor which produced economic success. Numerous studies failed to support any
hypothesis that attempted to prove that educational attainment alone was a strong
predictor for individual occupational achievement or national economic welfare (Baier,
Dwyer, & Tamura, 2006; Graaf & Huinink, 1992; Hartog, 2001; Howard, Dryden, &
Johnson, 1999; Overstreet, 1954; Hauser & Sewell, 1986; Werner & Smith, 1992). Thus,
a quest surfaced for further research on individuals’ characteristics besides education that
might be involved in the success of the individual in the marketplace.
Views on the Role of Human Capital in National Economics
As stated above, human capital refers to productive skills and knowledge
embodied in labor stock, which have the economic property of future services of value. It
is a measure of the economic value of the individual or group skill set, which includes
areas of knowledge, as well as skills, abilities, attitudes and experiences (Becker, 1964;
Coleman, 1988; Heckman, 2000; Heckman & Cunha, 2007; Jaw, Yu PingWang, & Chen,
2006; Smith, 1776/1937; Schultz, 1961, 1971). Schultz defined HC as “attributes of
acquired population quality, which are valuable and can be augmented by appropriate

34
investment” (Schultz, 1981, p. 21). The distinctive mark of HC (in comparison with other
forms of capital such as physical and financial) is that it is part of the human being, a part
of the very essence of man and woman. As Schultz noted, “it is human because it is
embodied in man, and it is capital because it is a source of future satisfaction, or of future
earnings, or of both” (Schultz, 1971, p. 48).
Becker (1964) suggested that human capital includes qualities that raise future
monetary and psychic income by increasing the resources in people. He found that any
activities that influence income were investments in human capital—any kind of
investment in human capital which increases earnings was legitimate and equally
beneficial like formal education (Becker, 1964, p. 46). In Coleman’s words:
Just as physical capital is created in changes in materials to form tools that facilitate production, human capital is created by changes in persons that bring about skills and capabilities that make them able to act in new ways (Coleman, 1988, p. s100).
Thus any acquired qualities and abilities that help individuals and groups to be
economically productive can be considered as individual/group human capital. Natural
abilities are generally considered to be distributed equally between populations (Mincer,
1958; Pigou, 1950; Schultz, 1981). Simply stated, the difference in population quality
stems from the difference in investment in HC (Ben-Porath, 1967, Schultz, 1981).
Human capital on an individual level causes variance of personal economic
welfare, while aggregate human capital on a group level leads to variance of the market
share. The importance of human capital on national level measures lies in its contribution
to the creation of national competitive advantage, and consequently, to national economic
growth and some level of the world market share (Drucker, 1997; Nehru, Swanson, &
Dubey, 1995; Porter, 1998). Assessment of human capital on these three levels

35
(individual, group and national) constitutes separate fields of social science. For example,
research on human capital at a group level is a part of the Human Resource
Development/Human Resource Management field and has direct ramifications in that
field (McLean, 2001; Nafukho, Hairston, & Brooks, 2004). This dissertation focuses on
human capital evaluation on national and international levels, often connected to the
science of economics.
Views Suggesting the Positive Effect of Human Capital on Economic Development
The importance of national and cross-national HC assessment lies in the well-
accepted fact that economic development is a function not only of natural factor
endowment (resource endowment, geographic location and size, etc) but created factors
as well (culture, education, politics, etc.) (Adelman & Taft-Morris, 1967; Barro & Lee,
2001; Harrison, 1992; Kotkin, 1993; Lal, 1996; LaPorta, Lopez-de-Silanes, Shleifer, &
Vishny, 1998; Schultz, 1971, 1981). Most observed economic growth cannot be
explained by conventional labor and capital measures. According to Adelman and Taft-
Morris (1967), 70 percent of inter-country variations in the level of economic
development are associated with differences in non-economic characteristics.
Human knowledge, skills, attitudes and efforts make the decisive difference in
just about every situation (Fitz-Enz, 2000). In Romer’s (1990) analysis, for example,
innovations are generated by HC stock. Romer modeled an endogenous growth process
in which growth resulted directly from physical capital investment which in turn was
driven by investment in research and development. He suggested that creation of goods
(and consequent economic development) was a function of HC stock and growth. Nelson

36
and Phelps (1966) concluded that HC builds absorptive individual and national capacity
and consequently increases the growth rate of total factor productivity. They created a
model that attempted to show that the level of national HC affected the speed of
technological upgrade. Therefore, the ability of a nation to adopt and implement new
technology from abroad is a function of the domestic HC stock. Investment in population
quality and in knowledge in large part determines the future prospects of mankind: “the
decisive factors of production in improving the welfare of poor people are not space,
energy, and cropland; the decisive factors are the improvement in population quality and
advances in knowledge” (Shultz, 1981, p. 4).
A group of researchers argued that inclusion of an HC variable in growth models
and numerous economic development equations improved their explanatory power
(Mankiw, Romer, & Weil, 1992). For example, Mankiw et al. (1992) augmented the
classic Solow’s growth model (where output is produced from physical capital, labor and
technology) by including in it accumulation of human capital. The classic Solow’s model
(Solow, 1956, 1988, 2000) predicted that the rates of savings and population growth
determine the steady-state level of income per capita (the higher the rate of savings, the
richer the country; the higher the rate of population growth, the poorer the country),
although it does not correctly predict the magnitude. Inclusion of HC accumulation
corrected the biases within the estimated coefficients on savings and population growth,
which improved the explanatory power of the whole model (Lindahl & Canton, 2007).
Consequently, many social scientists and economists have suggested using
measures of HC (as the changing quality of the labor force) to explain the growth, as well
as differences, in economic performance among countries (Becker, 1964; Gemmell,

37
1996; Griliches, 1997; Haveman et al., 2003; Heckman, Stixrud, & Urzua, 2006;
Mankiw, Romer, & Weil, 1992; Kuznets, 1961; Mincer, 1958, 1962; Mulligan, & Sala-i-
Martin, 1997; Schultz, 1971). HC is the “brain” behind other determinants of a country’s
economic development (infrastructure, political/legal institutions, rule of law, business
climate, business development). As early as the 1960s, it was noticed that though the
stock of physical capital was declining in value relative to income, the stock of human
capital was actually rising (Becker, 1964; Schultz, 1971). Early economists came upon
numerous signs pointing to improvements in the quality of human resources as one of the
major sources of economic growth. As Schultz (1981) put it, “Economic growth models
that treat changes in the labor force by counting the number of workers and that treat
changes in the stock of capital by counting physical structures, equipment, and
inventories are inadequate analytical tools because they omit critically important sources
of modern economic growth” (p. 3).
Views Suggesting That Human Capital Does Not Have Significant Effect on
Economic Development
Though many studies affirmed the applicability of the HC model, others abstained
from acknowledging HC importance or provided inconclusive results. For example, no
significant relationship between investment in HC and gross domestic product’s (GDP)
growth was found for the Organization of Economic Cooperation and Development
(OECD) countries (Lindahl & Canton, 2007). At the same time, Baier, Dwyer and
Tamura (2006) found strong correlation between HC and GDP in developed countries
(including OECD), but no correlation in developing and poor countries. Benhabib and

38
Spiegel’s (1992) study rejected the significance of HC in explaining per capita GDP
growth rate, while finding support for the significance of national HC in explaining the
growth rate of total factor productivity. Hartog (2001) stated that using education
measures in a country as predictors of economic success could not lead to reliable results.
Levin and Raut (1997) supported Levine and Renelt (1992) and concluded that “neither
secondary school enrollment nor other measures of human capital have a robust influence
on GDP growth” (p. 156). For them, “this result is difficult to reconcile with… broad
international evidence for high private and social rates of return on education” (p.156).
Cohen and Soto (2001) summed up the argument well by calling the discussion about the
role of human capital in economic growth “an everlasting topic, which has changed
course at least three times over the past two decades” (p. 2).
Causes for Divergence of Opinions on the Role of Human Capital
One potential explanation for such divergence of opinions is that it is caused by
utilization of incomplete measures of HC. Up to date, there is no consensus between
researchers and practitioners of exactly what factors constitute HC on the individual,
group, and national levels. As Fitz-Enz (2000) noted, “No one has successfully taken on
the challenge of detailing how to demonstrate the relative value of the human element in
the profit equation” (p. xi). Cohen and Soto (2001) explained strong ongoing debates
about the role of HC by difficulties in its measurement, “be it theoretically or
empirically… it has not been very clear how human capital should be proxied” (p. 2).
Various researchers and practitioners have suggested multiple variables that affect HC on
the national level. Even in the case when authors agreed on some conceptual variables

39
designed to capture the essential characteristics of HC accumulation, such variables were
not easily tested empirically (Gemmell, 1996).
As a result, empirical studies of the causes of economic growth often ignore
complex measures of HC by using simple (and rather crude) empirical proxy variables of
school enrollment and literacy rates. When the need to assess HC arises, educational
measures are used by default and are called “human capital.” Because of this ambiguity,
some economists ignore the HC variable in their growth models. For example, in 41
studies using the cross-sectional “sources of growth” regression approach reviewed in
1992, only 13 included an HC measure (Gemmell, 1996, p. 9). Mankiw et al. (1992)
pointed to potentially incorrect conclusions to which this can lead: “One might expect
that ignoring human capital would lead to incorrect conclusions: Kendrick (1976)
estimated that over half of the total US capital stock in 1969 was human capital” (p. 415).
In the empirical economic literature on individual earnings functions, the standard
independent variables are education, experience, the square of experience, and gender. In
some countries, race and region are added as well. Although individual abilities and skills
are acknowledged to be important, they often leave their trace only in the concern over
bias in the estimates of coefficients. The assumption that HC is equivalent to schooling
(and a particular level of schooling is equivalent to the level of HC) undermines the
usefulness of HC theory: “the failure of human capital theory as an articulate theory of
the joint distribution of schooling and earnings remain” (Hartog, 2001, p. 519). Cohen
and Soto (2001, p. 2) concurred:
Years of schooling has long been thought of as the relevant proxy (of HC). Yet a simple glance at the data shows that the regions where the rate of growth of human capital has been the fastest are also those where it started from very low levels…It is hard to believe that a country that rose its average years of studies

40
from 1 to 2 years really doubled its stock of human capital and should correspondingly double its output as well.
Such an assumption leads to significant errors in assessment and prediction of the
levels of economic and social development on national (and individual) levels. One
example of which may be the obvious failure of most attempts of international assistance
to affect lasting positive economic improvement in poor and developing countries. This is
especially detrimental for such nations. As Schultz (1981) put it, “if half of the donor
funds that are being allocated to increase the stock of physical capital in agriculture were
allocated to enhance the abilities of rural people, it would increase the rate of agricultural
development substantially compared to the prospects under the prevailing allocation of
this capital” (p. 130). According to Schultz, the problem is of our own making because
we have used estimates of capital and labor that had been “refined and narrowed in ways
that excluded many of the improvements made in the quality of these resources” (p. 66).
Measurement difficulty is the major reason for such a situation. Mankiw et al. (1992)
admitted that “despite the narrowed focus (on only education) measurement of human
capital presents great practical difficulties” (p. 418). As Fitz-Enz (2000) put it,
The great irony is that the only economic component that can add value in and by itself is the one that is the most difficult to evaluate. This is the human component—clearly the most vexatious of assets to manage. The almost infinite variability and unpredictability of human beings make them enormously more complex to evaluate than one of the electro-mechanical components that comes with predetermined operating specifications. Nevertheless, people are the only element with the inherent power to generate value. All other variables—cash and its cousin credit, materials, plant and equipment, the energy—offer nothing but inert potentials (p. xii).
Hartog (2001) complained that with a small set of variables commonly used for assessing
future economic success, “the researcher is a long shot away” from more precise
assessment. He suggested following the example of business, occupational, and

41
educational psychology in their systematic investigation of individuals and expanding
“the economists’ meager list of variables” (p. 515) that they routinely use for their
analysis.
Summary
The author can summarize the difficulties that present themselves in more precise
evaluation of HC as twofold:
1. There is no consensus about a list of indicators that together constitute HC.
2. Even those indicators which garner overall consensus as the ones that affect
HC, are often not easily empirically measured.
Consequently, there is a need for:
1. Establishing a better consensus about what indicators may be included in
cross-country assessment of HC.
2. Establishing empirical measures of these indicators which can be easily
collected and available for all the world’s countries.
Different Methods of Measuring of Human Capital
The researcher infers from the literature that two major methods of measurement
of a country’s HC exist:
a) HC as measured in financial terms (Baier et al., 2006; Becker, 1964;
Haveman, Bershadker, & Schwabish, 2003; Kendrick, 1976; Kuznets, 1961;
Mankiw, Romer &Weil, 1992; Mincer, 1958, 1962, 1974; Mulligan & Sala-i-
Martin, 2000; Schultz, 1971; Weisbrod, 1961).

42
b) Human capital as measured by the accumulation of contributing variables
(Benhabib & Spiegel, 1994; Hanson, 1996; Globerman & Shapiro, 2002;
Noorbakhsh, Paloni, & Youssef, 2001; Warner, 2002; United States Agency
for International Development [USAID]; United Nations Development
Program [UNDP]).
The first approach measures the value of national HC in financial terms and hard
currency. Essentially, it answers a question: how much is a particular aggregate HC
worth? This approach has two types of measurement of HC: in terms of return on
investment in HC and in terms of the cost of resources invested in acquiring HC. The
second approach does not measure the actual amount of wealth that a specific HC can
produce, but instead, measures the degree of presence of variables that contribute to HC
on the national level. The second approach, in contrast to the first one, potentially allows
for incorporation of intangible variables into the HC measurement tool.
Human Capital as Measured in Financial Terms Method
Human Capital as Measured by Return on Investments—the Classical Approach
The first method is founded on the rate of return on investment and present value of
expected earnings approach. This approach considers HC from a purely economic
efficiency understanding, as financial value of labor qualities that are embodied in a
country’s population capable of producing national wealth. This definition reflects the
analytics underlying the economist’s concept of physical capital and is analogous to
evaluation of physical capital in a country: “the value of the human capital stock is the
discounted present value of the stream of outputs attributed to the potential productive

43
activities” (Haveman et al., 2003, p. 2). This method measures the flow of income from
physical or human capital in a similar way in terms of their worth as productive assets.
HC’s worth is reflected in the earned wages: earning capacity (potential) and earning
over lifetime are measures of this approach.
According to Becker (1964), the estimate of the value of HC can be based on the
rule that the value of an asset equals the discounted sum of the income stream yielded.
This means that “the value of the human wealth ‘owned’ at a particular age would equal
the discounted sum of subsequent earnings” (p. 145). All earnings are generally
discounted at an interest rate, which is about the average rate on business capital (p. 147).
Mincer (1974) estimated the rates of return from cross-sections by equating the present
value of two earnings streams (with and without education). His model proposed that for
every year in school, earnings are multiplicatively augmented by the discount rate (i.e.,
the discount rate on the resources invested during the period of education, generally equal
to the average rate on business capital).
HC estimates produced this way are often used together with physical capital
stock estimates to calculate production functions used to derive total factor productivity
growth for countries (Nehru, et al., 1995). Basically, this view is based on measurement
of returns on investments toward HC, where economic importance is constituted as
significant financial rates of return on every indicator included in HC structure.
In the framework of this view there have been several propositions of what
constitutes national HC. As described earlier, Mincer (1958, 1974) measured human
capital as a function of average years of schooling using a macro-equation of the form:
H=e p(s)

44
where s is average years of schooling, p is the rate of return on education, and e is an
efficiency index. He estimated the rates of return on education by equating the present
value of two earnings streams—with and without education. Becker (1964) extended this
original framework to reflect other types of HC investments among which individuals can
choose: schooling, on-the-job training, medical care, migration, and information about
the market. As indicators of a certain level of HC he spoke about levels of education,
experience, health, morale, character qualities. He even admitted the role of luck (Becker
& Tomes, 1976), although its role disappears with the second derivative.
Although Becker suggested all the above variables, he actually used only
education and experience in his analysis. Becker (1962) created Standard Competitive
Theory, where he differentiated between general training and firm-specific training. He
used labor market experience as a proxy for general training and job tenure (seniority) as
proxy for specific training. In the regression (wages regressed on experience), the
coefficient on labor market experience was interpreted as return to general training and
the coefficient of job tenure was interpreted as the return to specific human capital.
Becker (1962, 1964) measured HC in terms of rates of return on investments
which were utilized to obtain it. He estimated the effects of investment in HC by
estimating the value of activities that influenced future real income through “the
imbedding of resources in people” (1962, p. 9). His classical formula for measuring
return on on-the-job training is as follows:
MP+G=W+C
where MP is marginal product of labor, G is present value of return from training
collected by the firm, W is the wages and C is the cost of training for the firm. His basic

45
formula for measuring returns on education measures the difference between actual
earnings and direct school costs, and can be presented as
W=MP-K
where W stands for net earnings, MP is marginal product assumed equal to earnings, and
K is the direct costs of acquiring education. This formula can be expanded further to
include potential earnings and indirect costs:
W=MPo-G
where MPo is the marginal product that could have been received, and G is the sum of
direct and indirect costs. Resources spent on acquiring information about the job market
and the market as a whole, as well as relocation, can significantly raise income by the
function of increased opportunities and a better match between an individual’s HC and
the new environment. These expenditures yield a return in the form of higher earnings
than could have been received in the previous market. Resources invested in
improvement of emotional and physical health of people are also a part of HC investment
from Becker’s perspective.
Schultz (1961, 1971) sought to clarify the investment process and the incentives
to invest in human capital by calculating return on education for different groups of
people, using the investment approach. Originally his studies revolved around formal
education and organized research, yet as his research progressed, he pushed the theory by
expanding HC to include a combination of schooling, learning on the job, advances in
health, migration, family factors and the stock of information about the economy.

46
Human Capital as Measured by Return on Investments—Modern Approach
Contemporary scholars build on this foundation, while suggesting different
combinations and/or forms of education-training measures. For example, Mankiw, Romer
and Weil (1992) used secondary enrollment rates as proxies of human capital stock. They
proposed a Cobb-Douglas production function of the form
Y= Ka H b (EL) 1-a-b
where H is the human capital stock of the workforce, a is production elasticity of the
physical capital, b is the production elasticity of human capital and 1-a-b is the
production elasticity of labor.
Lucas (1988) and Barro and Sala-i-Martin (1995) incorporated schooling and
experience as the two well-known ways of building HC. They employed the formula:
Y= Ka (uH) 1-a
where u is the time devoted to production and H is human capital. They modeled human
capital as:
QH = B (1-U) – R
where QH is the growth rate of human capital for an individual (which, if aggregated
across all individuals in the economy, will signify the growth rate of HC in an economy),
(1-U) is the time devoted to learning, B is transformational rate of learning into HC and R
is depreciation of HC. Choice between education (or as Lucas, 1988 called it, learning-
or-doing) and experience (learning-by-doing) depends on maximization of the utility
functions of the consumer. (There is substantial literature for measuring experience, for
example, Ford, 1997.)

47
Mulligan and Sala-i-Martin (1997) measured HC for an economy as the sum of all
workers weighted by the ratios of their wages to the wage of the zero-human-capital-
worker. Baier, Dwyer, and Tamura (2006) followed a similar path. They computed HC
per worker from average education, and average experience, basing the transformation
from educational attainment and experience to HC on estimated parameters of earnings
regressions. They distinguished between primary (and intermediate), secondary and
higher education because of substantial diminishing average returns to different levels of
schooling (also assuming that primary school takes up to four years, as well as
intermediate school, with secondary and higher education taking the rest of the years
spent on education).They computed average years of work experience according to the
following equation:
Yw = Age - Ys - 6
where Ys is average of years of schooling in a population, and Age is average age of
population. Consequently, they define HC as:
H=H0EXP (aP + bI + cS + dEX + eEX²)
where H is human capital, Ho is the level of human capital with no schooling or
experience, a, b, c are parameters on years of primary, intermediate and secondary
education, and d and e are parameters on years of work experience and experience
squared. They used the values of parameters as derived from regressions between wages
and years of schooling and experience across countries in the world. Other researchers
(Gemmel, 1996; Nehru at el., 1995) used a similar approach.
Even though the authors diverge slightly in what factors affect HC, they are
unified in their view of how to measure it. In this approach, HC is assessed by the present

48
value of the stream of outputs attributable to human capital. Consequently, although
several less tangible factors were suggested as important (family factor, informal
education, character qualities of population, emotional health, social services, morale,
migration), their measures have not been intensively studied. Neither have all these
measures ever been put together in one unified measure of HC. As Becker put it,
“unfortunately, few empirical studies of rates of return on other (than education) human
capital have been made” (p. 90). Schultz conferred: “Meanwhile, … there have been
important advances in economic thinking with respect to investment in human
capital…most of the work thus far has concentrated on the first of the set (education)” (p.
8).
Overall, the variables in this approach that have been individually assessed as
separate kinds of HC are as follows:
• Formal education (returns on education measured as net earnings for each
education period—Becker, 1964; Shultz, 1971; Solow, 1988, 2000); (returns
on education measured as years of schooling—Mincer, 1958; Shultz, 1971).
• Experience (measured by difference in wages; Becker, 1964).
• Information about the market and employment opportunities (measured in
financial terms as the difference between the highest-paying employer and the
lowest-paying employer, and the difference between the money spent on
search; Becker, 1964; Stigler, 1962).
• Physical and emotional health (measured in financial terms as increase in
wages that employees need to receive in order to make investments in factors

49
that improve health, such as medical examinations and improved nutrition;
Becker, 1964).
• The effect of HC on health (in terms of the effect of education on health) was
calculated using the value of a statistical life and a statistical life year. The
value of the health gain due to one year of education (one-year increase in
HC) is estimated to be in the range of 1.3-5.8% (Groot & Maassen, 2007).
• Abilities (as measured in earnings while holding quality of education,
discrimination, nepotism, health, on-the-job-training as constant factors.
Abilities can also be measured by the following factors: IQ score, father’s
occupation, rank in academic class, and earning differential related to them;
Becker, 1964).
Although other variables were suggested as important determinants of the level of
HC, they have not been measured. There is no practical place in this view for any
intangible factors that may affect HC because it will be difficult to measure ROI of such
factors. Benefits that are not manifested in earnings, and which are not directly captured
in the earnings stream are hard to identify and measure, and thus cannot be considered
seriously in this approach. Schultz summed up the issue very vividly by stating,
“Although an investigation of many kinds of human capital would be illuminating, the
absence of readily available data makes it necessary to concentrate primarily on formal
education” (p. 69). Weisbrod (1961) conferred:
We view the value of a person in terms of his worth as a productive asset, having some marginal productivity per period. A person’s value as a companion to, and the leader of, his family is neglected—not because it is deemed insignificant or irrelevant, but because it seemed too difficult to measure, at least for the present. (p. 426)

50
Human Capital as Measured by the Financial Cost of Investments in Creation of HC
This method is based on the assumption that the measurement of HC should cover
the range of investments that human beings make in themselves and in others (Nehru,
1995). It was pioneered by John Kendrick (1976) and measures the nation’s HC stock as
“cost-based,” in that human assets are valued by the investment costs embodied in them,
rather than the returns that they are capable of generating over their lifetime. Kendrick
defined the nation’s stock of HC to be the sum of rearing costs, plus the cost of
education, training, healthcare and mobility. Basically, this view measures the cost of
investment in HC. The variables that have been assessed by this method are:
• Education as measured in financial terms as the value of the resources that
have been used, including opportunity costs foregone (on Elementary, Middle,
High school and college levels; Schultz, 1971).
• Education in terms of the cost of services charged by schools (Kendrick,
1976).
Human Capital as Measured by the Method of Accumulating of Contributing Variables
This method considers HC from a developmental viewpoint, and potentially allows
for more precise estimation of HC. This method does not measure the actual economic
outcomes of HC or its contributing variables in terms of return on/cost of investments,
but instead, measures the intensity of variables contributing to it. This is a method of
accumulating scores on individual items to form a composite measure of a complex
phenomenon. Consequently, HC indices created this way are based on the degree of

51
presence of specific factors. When HC indices are compared in countries, what is
compared is not the actual amount of wealth that HC produces, but the degree of
variables present that contribute to HC (and which are known to be positively correlated
with economic welfare). This method assembles the qualities which have been suggested
as those that can bring economic benefit for those who possess them. This approach is the
only method (out of the three) that allows for inclusion of intangible variables into the
HC index and estimating them. Indices created by this method potentially can integrate
various social, political, and economic variables into one measure. Booysen (2002)
argued that the increasing social, political, and economic heterogeneity of countries
makes combining of both synthetic and specialized indicators inevitable. This method is
widely used by international aid and development organizations and researchers working
in the area of international development (Hanson, 1996; Haveman et al., 2003; Human
Development Report of UNDP, Globerman & Shapiro, 2002; Noorbakhsh, Paloni, &
Youssef, 2001; UN E-Government Readiness Assessment, UN World Public Sector
Report; Warner, 2002).
Noorbakhsh et al. (2001) calculated HC as proxied by the three measures:
secondary school enrollment ratio, number of accumulated years of secondary education
present in the working-age population, and number of accumulated years of tertiary
education present in the working-age population. For them, the first measure reflected a
flow of investment in HC. The other two measures reflected the education stock of a
country. The authors did not attempt a combination of those three variables in any form
but used all of them individually as “HC group.” Warner (2002) suggested calculating an
HC index as a simple average of standardized indices of educational attainment of

52
population (i.e. primary, secondary, and tertiary) and a subjective measure of schooling
quality (collected through surveying business managers). Globerman and Shapiro (2002)
used the measure of HC which they perceived to be the sum of the education and health
subindices of the Human Development Index (UN). Mankiw et al. (1992) used the
percentage of the working-age population that is in secondary school as the proxy for
HC. They used UNESCO Yearbook data on the fraction of the eligible population (aged
12 to 17) enrolled in secondary school, which they multiplied by the fraction of the
working-age population that is of school age (ages 15-19). Hanson (1996) employed the
measure of HC as the square of the adult literacy rate to represent the stock of education
and training. Squaring the rate utilizes the hypothesis of educational externalities. Some
national statistics describing the contribution of human capital to the economy are based
on demographics and are simply counts of people—for example, the number of people in
the labor force or the number of people employed (Haveman et al., 2003).
This method is potentially instrumental in helping countries improve, as it allows
for more specification of what factors need to be addressed in order for a country’s labor
to be of a higher quality. What gets measured gets done. It has been generally accepted
that publishing cross-country comparative data inspires governments to reform.
Currently, the most used and accepted HC index in international comparisons is the index
developed by the United Nations. According to the UNDP, HC index is based on UNDP
Education Index and is a composite of adult literacy rate and combined
primary/secondary/tertiary gross enrollment ratio with two thirds of the weight given to
adult literacy and one third to gross enrollment ratio (UN, 2003). For a country X, with

53
an adult literacy rate of 96.3 per cent and a combined gross enrollment of 81.2 percent in
2002, the HC/Education Index would be:
2/3 (0.963) + 1/3 (0.812) = 0.913
(United Nations Department of Economics and Social Affairs, 2003). Other international
organizations use this method of HC measurement by default. For example, United
Nations Government E-Readiness Index (United Nations, 2008), which includes
Infrastructure, E-Participation, and HC indices, defines its HC exactly according to that
method:
The data for the human capital index relies on the UNDP ‘education index,’ which is a composite of adult literacy rate and the combined primary, secondary, and tertiary gross enrollment ratio with two thirds weight given to adult literacy and one third to gross enrollment ratio.
Conclusion
The methods discussed above are valuable tools in the hands of researchers
attempting assessment of HC development on individual country level, or on the cross-
country level. Although both methods allow for some degree of assessment, the second
method can potentially be more precise, as it allows for incorporating not only empirical
but also intangible variables.
The Need for a More Precise Measure of Human Capital
All methods discussed above rely heavily on using different education measures
as proxies for HC. The strength of this approach is mainly in availability of data, as these
indicators can be relatively easily defined and empirically tested. Furthermore, there is
widespread agreement about the value of what is being measured. These social indicators

54
are “objective” in that they do not depend on individual perception (Diener & Suh, 1997).
As Becker (1964) noted, “the investment period of education can be measured by years
of schooling, but the periods of on-the-job training, of the search for information, and of
other investments are not readily available” (p. 44). Using education as a proxy for HC is
based on the assumption that formal education makes a fundamental contribution to HC
accumulation, which can be complemented but not readily substituted by other forms of
HC investment. It is assumed that formal education is the most important component of
HC because it also increases the ability of people to live healthier lives and learn rapidly
on the job once they enter the labor force (Nehru et al., 1995).
Another reason why simplistic education measures are often used as proxies for
national HC is a lack of understanding of the true nature of the concept of this capital.
“Failure to treat human resources explicitly as a form of capital, as a produced means of
production, as the product of investment, has fostered the retention of the classical notion
of labor as a capacity to do manual work requiring little knowledge and skill, a capacity
with which, according to this notion, laborers are endowed about equally” (Schultz, 1971,
p. 28).
Meanwhile, much criticism is aimed toward the use of education-related measures
as the only kind of measures of HC. Welch (1965) remarked: “Frankly, I find it hard to
conceive of a poorer measure of the marketable skills a person acquires in school than the
number of years he has been able to endure a classroom environment. My own
justification for using such a crude measure is that I can find nothing better” (p. 67).
Following is a brief discussion of the weaknesses introduced into measures of HC when
only education-related variables are used.

55
• The average year of schooling per working person in economy. This measure
used by itself as a proxy of HC (suggested, for example, by Nehru et al., though
understanding that the measure is “one-dimensional in nature and subject to weaknesses”
Nehru et al., 1995, p. 25), suffers from the basic evaluation problem. First, it assumes that
workers of each education category are perfect substitutes for workers of all other
categories. The second assumption is that the productivity differentials among workers
with different levels of education are proportional to their years of schooling. For
example, a worker with 16 years of schooling is 16 times more productive than a worker
with one year of schooling. The assumption here is that someone with X years of
education would have earned the same income as someone with 0 years of education if
s/he had also chosen 0 years of education. And it is assumed that someone who chose 0
years of education would have earned the same income as someone who chose X years if
s/he had chosen these number of years (Hartog & Oosterbeck, 2007). Third, one year of
schooling allegedly delivers the same increase in skill, regardless of the field of study,
quality of teachers and educational infrastructure.
• Attained levels of education. This measure may be used for intra-national
analysis, yet it errs when applied to cross-country comparison. Nehru et al.
(1995) suggested that years of schooling as a proxy for education is subject to
error in cross-country analysis because the number of days and hours of
schooling per year can vary substantially across countries. For example, the
study by Blau and Kahn (1996) assumed that a year of education in the US
had exactly the same meaning, in terms of produced skills, as a year of
education in Germany. Using such an assumption, they came to a conclusion

56
that 50% of the German workforce belonged to the lowest 30% of US’
workforce in terms of skills. In addition, calculations of the average number
of years of schooling in the population often suffer from the inability of
researchers to exclude years of unemployment.
Furthermore, returns to education by itself are rather modest (Appleton &
Teal,1998; Freeman, 1986). Freeman (1986) noted that “every study finds that, by itself,
years of schooling explains a relatively small part of the variance of log earnings, say 3-5
percent at most” (p 377). Other researchers (Harmon, Walker, & Westergaard-Nielsen,
2001; Heckman, 1995; Krueger, 2002) estimated higher return of up to 10 percent as
return on educational investment. Another problem to consider here is that quality of
education tends to increase with time, which also leads to productivity differential
between young and old workers with the same education (Nehru, et al., 1995). Also,
since quality of education differs considerably between countries, calculating only this
measure can lead to an overestimation or underestimation of the level of the education
stock as well as the level of HC. Unfortunately, no good indicator of the quality of
education is easily available for developing countries (Nehru, et al., 1995). One popular
measure often used for this purpose, the teacher-student ratio, does not seem to be
strongly related to the value added of the school system (Barro, 1991; Hanushek, 1997;
Nehru et al., 1995).
• Enrollment. This access to education measure in quantitative terms does not
tell us much about the product of education: the increase of cognitive and
other skills (Dijkstra & Hanmer, 2000). Furthermore, it has been argued that

57
enrollment ratios are more of future rather than present indicators of the HC
level (Carneiro, & Heckman, 2003; Krueger, 2002).
• Adult literacy rate. This variable taken by itself is not a sufficient measure
either, because it measures basic literacy, which can be a proxy for only low-
cost, low value-added production, which has been losing its importance
economically. According to UNDP (2003), “Adult literacy is the percentage
of people aged 15 and above who can, with understanding both read and write
a short simple statement on their everyday life.” This hardly measures modern
national dynamic competitive advantage.
• Public expenditure on education. This is also not a sufficient measure.
Empirical results show that some countries which have high public
expenditure on education, do not have a highly educated population
(Hanushek, 1997). Public expenditure on health care is subject to the same
problem, especially considering the problem of redistribution of limited
resources in highly corrupt countries.
• Head count. Head count is a very unreliable proxy of HC as well.
As Fitz-Enz put it (2000), “If the key to wealth creation were only a head count, then the
dullest, lowest-level person would be as valuable as the brightest, highest-level person. In
actuality, it is the information that the person possesses and his or her ability and
willingness to share it that establish value potential” (p. 6).
Currently, an HC index can be as broad as to include all of the above mentioned
variables (combined primary/secondary/tertiary gross enrollment ratio, adult literacy rate,
job experience, expenditures on health, expenditure on education, mortality rate, GDP per

58
capita, growth rate of the labor force) or it can be as narrow as to include only one or two
variables (mostly school enrollment or literacy rate). However, even including all the
variables currently applied cannot give us an exhaustive and policy-useful HC measure,
because they do not describe all the aspects of human capital.
Although education is a critical component of HC, other intangible factors also
affect it, which leads to modification of the level of economic profit produced. To a great
degree, education variables are affected and augmented by non-education intangible
variables. Therefore, it is necessary to take into consideration these variables if we want
to correctly assess the economic value of education, and HC altogether. It is necessary to
give HC a more detailed and specific “face.” More than two decades ago such a need was
expressed by Ben-Porath (1980) as “a departure from impersonal economics” (p. 1).
The Need for HC Measures to Expand Their Variable-Base
Despite the vast array of literature on HC, researchers have emphasized that
existing HC measures lack precision, and are in fact reductionist measures, incorporating
only subsets of possible indicators. As discussed in the Introduction, with an increasing
number of studies which failed to support the classical assumption that educational
attainment (measured in basic enrollment and literacy figures) was a strong predictor of
individual’s occupational achievement or national economic welfare, the search for other
influential factors became important. Researchers in different countries have made
multiple attempts to build an expanded HC index. However, there is considerable
difference of opinion regarding how to establish more robust and specific measures of
HC.

59
Nehru et al. (1995) stated that though “the measurement of HC should cover the
range of investments that human beings make in themselves and in others, including
formal and informal education, on-the-job training, health, nutrition, and social
services…. So far, no researchers have put together such a composite measure” (p. 380).
According to Heckman (2000),
Current policies regarding education and job training around the world are based on fundamental misconceptions about the way …skills embodied in persons are produced…The preoccupation with cognition and academic “smarts” as measured by test scores to the exclusion of social adaptability and motivation causes a serious bias in the evaluation of human capital interventions. (p.4)
Becker (1964) concurred :
Economists have long been aware that conventional measures of ability—intelligence tests or aptitude scores, school grades, and personality tests… do not reliably measure the talents required to succeed in economic sphere. The latter consists of particular kind of personality, persistence, and intelligence. (p. 61).
Porter (1998) stated that the human resources of a nation include not only skills, but work
ethic. Schultz (1971) suggested that HC can be displayed in various forms beyond the
conventional: “If it were possible to aggregate all of the different forms of human capital,
it would exceed by a wide margin all nonhuman capital” (p. vii). He proposed that HC
consists of differentiated forms of capital and is “exceedingly heterogeneous” (p. 48).
Knight (1996) also supported this idea and said that not all human capital is
produced by education, and not all education produces human capital. Godfrey (1997),
Heckman and Cunha (2007) stressed that non-cognitive abilities (perseverance,
motivation, ability to deal well with other people, risk aversion, etc.) have direct affects
on wages. Carneiro and Heckman (2003) conducted an analysis which challenged the
conventional point of view that equated skill with intelligence, thereby demonstrated the
importance of both cognitive and non-cognitive skills in socioeconomic success. Hanson

60
(1996) found evidence that qualities of labor besides education and training seem to deter
investments in some countries. Specifically, he referred to “personal qualities of workers”
(p. 86). Kluckhohn’s (1954) earlier study supportes this idea as well. As Adelman and
Taft-Morris (1967) put it, “key economic functions used in analyzing advanced
economies may take quite different form in less-developed countries for reasons that are
largely political, social, and institutional” (p.3).
HRD scholars recognize the importance of intangible assets and their impact on
corporate productivity and growth. At the same time, the endeavor of measuring the
impact of developing such assets in the HRD field has been undertaken by just few
scholars (Cho & McLean, 2000; Nafukho, et al., 2004). Overall, HR professionals,
economists, and educators have made little progress in solving the tricky problem of how
to measure human capital within a single country over time, let alone for comparisons
between countries. As Schultz (1971) put it, “ [investments in human capital] seem
amorphous compared to brick and mortar, and hard to get at compared to the investment
accounts of corporations, but they assuredly are not a fragment; they are rather like the
contents of Pandora’s box, full of difficulties and hope” (p. 35).
At the same time, the urgent importance of knowing what constitutes HC can be
illustrated by the almost constant failure of the international donor community to receive
sufficient return on their humanitarian investments in poor countries, in the form of
enhanced economic productivity and improved social relationships in these countries.
Schultz (1981) raised the question by comparing ROI on the Marshall Plan and several
other programs instituted by the US. The Marshall Plan, although available for only few
years, significantly enhanced the economic recovery of Japan and West Germany. In

61
contrast, the Point Four Latin American Aid program, similar to the Marshall Plan US
foreign aid program administered during the 1950s, contributed very little to the
productivity of Latin American countries. Schultz suggested (1981) that while the war
destroyed physical capital of Japan and West Germany, their human capital was
relatively intact. By providing funds for physical capital, the Plan simply added physical
means of production to high-level HC. In contrast, Latin American countries’ low level
of HC did not allow for similar success.
This example illustrates the importance of HC, but does not really address the
need to knowing exactly what factors contribute to HC. This need can be illustrated by
comparing politico-socio-economic success of the former socialist countries after the
collapse of the socialist system. Some countries progressed significantly while others
stagnated, although general education, training, and research levels among those
countries were similar due to specificities of a planned socialist economy (a comparison
of Ukraine and Poland over the period from 1991-2007 may be helpful in this regard).
Variables Suggested for Inclusion in Human Capital Measure
As a prophetic voice in economics, Adam Smith included all acquired and useful
abilities of the inhabitants of a country as part of capital. For him, HC included
psychological, intellectual, physical qualities of people (Smith, 1776/1937). Becker
(1964) spoke about classical HC components like on-the-job training and schooling, as
well as other economically useful knowledge, such as information about the job market.
He also stressed the importance of intangible components of HC such as morale,
character, emotional and physical health, as well as even luck (Becker & Tomes, 1986).

62
He noted, “I am going to talk about a different kind of capital. Schooling, a computer
training course, expenditures on medical care, lectures on the virtues of punctuality and
honesty are capital too, in the sense that they improve health, raise earnings, or add to a
person’s appreciation of literature over much of his or her lifetime” (Becker, 1964, p. 39).
For Becker, “one way to invest in human capital is to improve emotional and physical
health. Emotional health increasingly is considered an important determinant of earnings
in all parts of the world” (Becker, 1964, p. 33).
Schultz (1971) said that the “unsatisfactory state of economic theory in solving
the mystery of modern abundance has turned some economists to an array of explanatory
factors that are predominantly cultural, social and political” (p. 3). He suggested
considering the following categories as investments in HC: investment in schooling, on-
the-job training, health, job information, and migration. The category of individual health
includes all expenditures that affected vigor, vitality, and life expectancy of people (any
health facilities and services); migration includes movements of individuals and families
to adjust to changing job opportunities. Later (1981), he expanded his view by adding
other variables: “the principal activities that contribute to the acquisition of human capital
are child care, home and work experience, schooling and health. The value of such added
human capital depends on the additional well-being that people derive from it” (p.23). He
also considered entrepreneurial abilities as a part of HC (Schultz, 1981).
Heckman (2000) viewed human capital as a combination of cognitive and non-
cognitive skills, both of which were equally important. He suggested that focusing on
only education as human capital to the exclusion of social skills, self-discipline and a
variety of non-cognitive skills that were known to determine success in life, would lead

63
to fundamental misconceptions about the way socially useful skills embodied in persons
were produced. According to Heckman “ popular discussions of skill formation almost
always focus on expenditures in schools or on educational reforms and neglect important
non-institutional sources of skill formation , which are equally important, if not more
important, producers of the varieties of skills that are useful in a modern economy” (p.4.).
Both kinds of skills—cognitive and noncognitive—are affected by families and schools,
but they differ in their malleability over the life cycle, with noncognitive skills being
more malleable later in life (Carneiro & Heckman, 2003).
Non-cognitive abilities are important for schooling and labor market success. This
finding is supported by studies of early childhood interventions (The Perry Program,
Head Start) that improve primarily non-cognitive skills with a much weaker effect on
cognitive ability. These longitudinal studies showed substantial positive effect on future
schooling and labor market outcomes (Krueger, 2002). Mentoring programs during
childhood through teenage years can significantly affect these skills as well (Werner &
Smith, 1992). Becker (1964) also suggested that any kind of learning, not just formal
education or on-the-job training, invests in human capital (p. 46). Therefore, according to
Becker, there is no conflict between interpretations of the shape of earning profiles based
on learning theory and those based on investment in human capital since the former is a
special case of the latter.
Becker (1993) also saw great importance in the individual character as it shapes
HC. He suggested that behavior is rooted in character and is interrelated with HC:
The various kinds of behavior included under the rubric of human capital help explain why the concept is so powerful and useful. It also means that the process of investing or disinvesting in human capital often alters the very nature of a person: training may change a lifestyle from one with perennial unemployment to

64
one with stable and good earnings, or accumulated drinking may destroy a career, health, and even the capacity to think straight (p. 392).
Consequently, social adaptability, motivation, and other similar character traits need to be
considered as a part of the human capital variable. Other writers (Fitz-Enz, 2000;
Psacharopoulos & Woodhall, 1985) supported this idea and noted that attitudes,
motivations, character traits are a part of HC and are necessary for economic and social
development. Goleman’s (1995) classic study attests to this view as well.
A group of researchers (Almond & Verba, 1963; Boettke & Subrick, 2003;
Denzau & North, 1994; Franke, Hofstede, & Bond, 1991; Guiso et al., 2006; Hofstede,
1980, 2001; Harrison, 1992; Lal, 1996, 1998; Lim, 2002; Mason,1995; Reisinger, W.,
Miller, A., Hesli, & Maher, K.,1994; Shulman, 2005) have suggested that culture has a
strong economic effect. They documented that countries more skewed in favor of
autonomy and egalitarianism, exhibited higher rule of law, less corruption, and more
democratic accountability. For example, Lal (1996, 1998) strongly supported that culture,
which is historically formed under the influence of many socio-geopolitical factors,
influences the way people behave economically. For example, he quoted Frankfort
(1948) in his example of two ancient nations—Mesopotamia and Egypt. Their
worldviews were different, which affected social and economic spheres:
This contrast in outlook is curiously in keeping with the physiographical differences between the two countries. The rich Nile Valley lies isolated and protected between the almost empty desert on either side, while Mesopotamia lacks clear boundaries and was periodically robbed and disrupted by the mountaineers on its east or the nomads on its west. Egypt derived its prosperity from the annual inundation of the Nile, which never fails to rise, even if the floods differ greatly in effectiveness. But Mesopotamia is for much of its grazing, dependent on an uncertain rainfall and possesses in the Tigris an unaccountable, turbulent, and most dangerous river (p. 24).

65
At the same time, Shultz (1981) did not see culture as a relevant variable in the economic
development equation, calling research on the effect of culture “at best intellectual
curiosities” (p. 4).
McCleary & Barro (2006) researched the relationship between religion and
economy and finds fairly strong correlation between them. Shulman (2005) spoke about
the role of national identity in the success of economic reforms, and also found support
for positive correlation between those variables. In strong tandem with him, Prizel (1998)
provided evidence for strong correlation between the national identity and foreign policy
of a country, which affects economic development:
National identity remains the main, if not the sole, glue of all societies… All polities, whether or not they are aware of it, have an identity that helps define their values and serves as the basis of ranking their priorities. These values and priorities, along with a host of objective factors, shape foreign as well as domestic policy (p. 2, 413). The cultural and socio-political situation of a country has important effects on the
quality of HC (Hanson, 1996). The role of culture, though hard to measure, is attracting
more and more research attention. Overall, sociologists and anthropologists interested in
the problems of developing countries consistently stress the close interaction between
sociocultural and economic aspects of change (Granovetter & Swedberg, 2001; Hoselitz,
1960, Mingione & Goodrick 1991). Hoselitz (1960) examined the process of economic
growth in terms of sociological pattern variables, summarizing patterns of change that
can be described by change in cultural values (i.e., transformation from communally-
oriented values to individualistic achievement-oriented values).
The role of family affiliation is very important, though often neglected in the
assessment of HC (Ben-Porath, 1980; Griliches, 1997). Strong families contribute to the

66
overall national human capital by increasing the traits that lead to high HC. The value of
a strong family affiliation manifests itself in personal individual traits, including honesty,
various skills, and ingenuity. Moreover, “the degree to which the family takes
responsibility for actions of its members correlates with the degree of trust between the
outsiders and the family members” (Ben, Porath, 1980, p.12). It has been argued that
ascribed status has greater practical significance than achieved status for those outsiders
who deal with family members. A caring head of the family (i.e. who has the utility of
members in his own utility function) can generate socially optimal behavior by family
members (Becker & Tomes 1986). Heckman, 2000, and Heckman et al., 2006, postulated
that a family’s role lies in fostering skills and a variety of abilities required to succeed in
the modern economy. Families who lack the above qualities produce members with low
ability and thus poorly motivated students who do not succeed. Policies directed toward
families may be a more effective means for improving the performance of schools than
direct expenditure on teacher salaries or technical resources.
Other researchers have noticed other qualities that affect HC. For example,
Richards and Amjad (1994) mentioned ethical values, responsible citizenry, and a healthy
attitude toward work. They emphasized that both attitude to work and cognitive skills
matter in determining the efficacy of workers. Sjaastad (1962) treated migration as an
activity that develops HC. The main reason for this is that a misplaced resource is
equivalent to a less productive resource properly located. Stigler (1962) suggested using
availability of labor market information as a variable affecting HC for similar reason, as
well.

67
Conclusion
As a result of the literature review, there follows a list of variables that are
perceived to be instrumental in composing the HC of a national population:
• Character qualities of the population
• Cultural values
• Educational attainment
• Work experience
• Ethical values
• Family background and values
• Physical health
• Market Information available
• Measure of trust between citizens
• Morale
• Emotional health
• Migration opportunities available within the country
• Awareness of national identity
• Unity among citizens
• Religion in the country
• Social skills and quality of interaction
• Variety of non-cognitive skills
• Work Ethics
Out of the list of indicators, educational attainment, work experience, physical health,
migration and information about the market are not new measures. They were mentioned

68
by classical HC theory although not extensively developed. The author of this study
decided to concentrate only on the variables that have never been developed or included
in HC measurement tools before. Out of the remaining list, the researcher chose three
variables: (1) National identity awareness, (2) Families, and (3) Character qualities most
common in the population. The choice of these variables is based on the parsimonious
requirement of a dissertation. Consequently, the three chosen variables to be studied
further are as follows:
• National identity awareness in the population (abbr. National Identity
Awareness)
• Families in a country (abbr. Family factor)
• Character qualities most common in the population (abbr. Character Qualities
factor)
Summary of the Reviewed Literature on Human Capital
The list of additional variables that constitute national HC, and may potentially
improve the fit of HC models, indicates that the way HC is currently measured produces
incomplete results by neglecting important variables. HC theory may be changed from
the theory of joint distribution of education and economic welfare to the theory of joint
distribution of productive skills, qualities and knowledge and economic welfare.
Therefore, HC measurement tools will greatly benefit from incorporating
intangible/latent measures which describe diverse qualities and skills of a country’s
population, not only the overall level of its education.

69
After identifying additional factors as ones that affect HC, there was a need to
operationalize them by conducting analyses of their structures and suggesting a potential
set of measurable indicators of performance for these multidimensional constructs. In the
following section, the three newly suggested HC factors were examined and the initial
models of these factors were developed. Complex measures, reflecting different aspects
of each new factor were created, combining interrelated aspects of the relevant feature
within each single factor. The author sought to include the aspects that were conceptually
relevant to a particular factor, as well as easily empirically measurable and available for
all (or at least most) countries.
National Identity Awareness Factor
National Identity Awareness as a Formative Component of National Human Capital
Though National Identity Awareness has been noted as an important contributor
toward the level of national HC, it has yet to be measured. This section explores and
establishes the relationship between national consciousness of people in a country and
HC of this people. It is followed by the section which identifies specific channels of the
process of citizens’ national identity awareness influencing their HC.
As a family provides its members with a sense of belonging (Ben-Porath, 1980), a
nation provides its members with a sense of national identity, which is a powerful means
of defining and locating individual selves in the world (Smith, 1991). National identity
may be defined as citizens’ conception of the factors that do or should unite the
population of a nation-state into a single community and that differentiate that
community from others (Shulman, 2005). A polity cannot exist in a state of prolonged

70
anomie; it needs an identity to provide a psychological frame of reference in which to
function. All polities have an identity that helps define their values and serves as an
instrument by which to rank their priorities (Prizel, 1998). Therefore, it can be stated that
each country has its unique national identity.
Is there a relationship between HC in a nation and its national identity awareness,
and can a theory of this relationship be established? A group of researchers ( Eke &
Kuzio, 2000; Harrison, 1992; Kevane, 1997; Kuzio, 2000; Prizel, 1998; Shulman, 2005;
Smith, 1991) have emphasized the relationship between national identity awareness and
the success of economic and democratic reforms of this nation. The overall hypothesis
that inclusion of identity substantively changes conclusions of economic analysis seems
to be strongly supported (Akerlof & Canton, 2000; Kevane, 1997; Landa, 1994; Sen,
1986; Thomas, 1996). One reason identity matters in economics is that individuals,
groups and corporate actors in an economy have equilibrium strategies predicated on
their identities (Kevane, 1997). According to Ben-Porath (1980, p. 1-4):
Recent works in economics deal with many issues in which the identity of the agents and the mechanics of their interaction matter (because) the identity of the people engaged in a transaction is a major determinant of the mode of transaction.
The organization of activity is determined by the implicit attempt of participating actors
to benefit from the returns to scale on both—the personal and the impersonal—
dimensions of transactions, as well as the interaction between them. Identity can either
dominate or be subsumed under the impersonal dimensions of a transaction and the
degree to which this happens shapes the actual type of transaction. In other words,
organization of activity depends on: 1) whether identity dominates or 2) whether
impersonal dimensions of transactions dominate. This affects the level of welfare derived

71
from an activity and its major recipient(s). This array of research on the role of group
identity in the nature of the group’s economic interactions comes to similar conclusions
as research on the relationship between the sense of personal identity (a person’s sense of
self) and personal level of welfare (economic success). Akerlof and Kranton (2000)
suggested that identity could account for many phenomena on individual and group levels
that current economics cannot explain well.
(Many) problems such as ethnic and racial conflict, discrimination, intractable labor disputes, and separatist politics all invite an identity-based analysis. Because of its explanatory power, numerous scholars in psychology, sociology, political science, anthropology, and history have adopted identity as a central concept. …Identity can be brought to economic analysis, allowing a new view of many economic problems…Identity is likely to affect economic outcomes, for example, in areas of political economy, organizational behavior, demography, the economics of language, violence, education, consumption and saving behavior, and labor relations (Akerlof & Kranton, 2000, p. 716, 745).
According to the earlier definition, HC can be defined as a characteristic of a country’s
populace which includes any acquired human qualities and abilities that help individuals
become economically productive and which affect the nation’s economic welfare. Since
identity awareness is a human quality and seems to be correlated with national economic
development, a deduction can be made that national identity awareness is a part of
national HC. (Note: it is not a specific national identity, given by birth, but rather
national identity awareness/national consciousness of people.)
The Basic Model of National Identity Awareness Factor
The previous section provided theoretical evidence for relationships between
national identity awareness of people in the country and development of national HC.
This section explores the actual model of the variable of national identity awareness.

72
Moreover, it identifies the channels through which the national consciousness of
population affects HC of this people. It explores how consciousness of national identity
creates value.
As noted earlier, national identity may be defined as citizens’ conception of the
factors that do or should unite the population of a nation-state into a single community
and that differentiate that community from others (Shulman, 2005). Jenkins and Sofos
(1996) note:
the potential ingredients (of collective national identity) are diverse - a common language, a shared history or culture, religious particularism, a sense of territorial, ethnic or ‘racial’ distinctiveness and /or assertion of opposition to other communities, or indeed the existence either in the past or in the present of some political identity - a state or subordinate administrative unit (p. 11).
According to Webster’s dictionary, a nation is a community of people composed of one
or more nationalities and possessing a more or less defined territory and government.
According to other definitions, a nation can be described as a community of people
obeying the same laws and institutions within a given territory (Smith, 1991). This
implies some common institutions and a single code of rights and duties for all members
of the community. It also suggests a definite social place, a fairly well bounded territory,
with which the members identify and to which they feel they belong. This presupposes a
measure of common values and traditions among the population (Smith, 1991)—“In
other words, nations must have a measure of common culture and a civic ideology, a set
of common understandings and aspirations, sentiments and ideas, that bind the population
together in their homeland” (p. 11). Divided nations (for example, West and East
Germany, North and South Korea) serve as good examples for this definition. Although
East and West Germans obeyed different laws and were governed by different institution,

73
all of them viewed themselves as Germans based on earlier history, culture and overall
identity as Germans.
Historic territory, common institutions, legal-political equality of members, and
common civic culture and ideology comprise the standard model of a nation (Smith,
1991). Consequently, national identity is awareness of these features and their functions.
It is awareness of these commonly held (and often unspoken) rules and norms, and the
appreciation and support of them. Therefore, national identity is a function of:
• Common culture, norms and values shared by a country’s population
• Perception of collective destiny (goals) among the people in the
country
• Common institutions/rights and duties for all members of a society
• Common myths and historic memories among citizens of a country
Shulman (2005) suggested that national identity was formed around the following
factors: basic unifying and distinguishing features, compatibility of multiple ethnic or
national identities, domestic policy, and foreign policy. In its approach, Smith’s concept
of national identity formation corresponds to Schulman’s concept. Smith’s common
culture, norms and values, and common goals correspond to Shulman’s basic unifying
and distinguishing features, and Shulman’s domestic policy corresponds to Smith’s
common institutions and legal rights and duties for all members. As far as foreign policy,
it is suggested that this policy is based on national identity awareness of the leaders who
make international decisions (Smith, 1991)—“The selection of political personnel, the
regulation of political conduct and the election of governments are grounded in criteria of

74
national interest, which is presumed to reflect the national will and national identity of
the inclusive population” (p.16).
Decisions by the leadership most closely reflect the will and interests of the
population when there is a strong national identity awareness in the population. When the
sense of national identity is strong, the nation becomes “a faith-achievement group, able
to surmount obstacles and hardships” (Smith, 1991, p. 17). Strong national identity unites
a nation and strengthens the fiber of the country, individually and collectively. For
Rustow (1970), national unity means that the vast majority of citizens have no doubt or
mental reservations as to which political community they belong. Harrison (1992) called
national identity awareness the radius of identification. He stated that in countries with
relatively high degrees of identification, the politically and economically powerful are
more likely to concern themselves with the well-being of the masses. One area which
concerns this reflection is government decisions aimed at the increased welfare of the
nation, budget allocations, high levels of literacy and public health, and other areas of
social stability and welfare. An indication of a strong perception of national identity is
when belonging to a particular social class does not overshadow an individual’s
economic actions to the degree that national interests are neglected or abused. Strong
national identity is also displayed when individuals possessing above average power and
authority make important national economic decisions, not based on their personal
association with a particular social class or on their desire to increase their personal
resources, but based on the economic interests of the nation (when applicable). Such an
attitude can be called country-responsible self-interest. Smith (1991) described such an
attitude as “a consciousness of belonging to the nation, together with sentiments and

75
aspirations for its security and prosperity” (p. 72). Velychenko (1993) supported this idea
and said that national identity usually appears as a means to attain social or economic
goals, and is “essential to group survival” (p. 18). In such situation, citizens see the nation
as existing perpetually, and this belief serves as a framework for political-socio-economic
decisions the country’s leaders make. National identity plays an important role in the
politico-economic development of a nation. It legitimates common legal rights and duties
of legal institutions, which define specific values of the nation and reflect the customs of
its people.
Other researchers working in the area of national identity support this framework.
For example, Canovan (1996), Duijker and Frijda (1960) emphasized the role of national
institutions (organizations that regulate the habits of people) and norms and values in the
formation of national identity. Prizel (1998) wrote that abiding institutions and collective
memories are the major foundations of national identity. Harrison (1992) pointed to the
level of ethical behavior, trust, and cultural norms, as well as institutions that support
their perpetuation. Jenkins and Sofos (1996) underlined the importance of territorial
distinction and opposition to (distinction from) other communities. They suggested that
creation of an “us” and “them” attitude facilitates awareness of citizens of a nation as
those belonging to a particular nation.
The earlier discussion established the existence of a relationship between national
HC and national identity awareness. Consequently, national HC is also affected by the
variables which influence national identity development. More specifically, national HC
may be said to be affected by the following factors, and is a function of them:
• Common norms, values, and culture shared by a country’s population

76
• Perception of collective destiny (goals) among people in a country
• Common institutions/rights and duties for all members of a society
• Perpetuation of common myths and historic memories among citizens of a
country
This section has established a basic model of the factor of national identity
awareness. It has specified the major variables through which national identity is formed.
Following is description of the process of operationalization of each of these variables.
Operationalization of Common Norms, Values, and Culture Variable
The variable of common norms, values and culture can be assessed by the degree
a society is cohesive in norms, values, and culture. Because cultural and normative values
are generally grounded in ethnicity, religion, and language, this variable essentially
measures the degree of linguistic/ethnic/religious homogeneity of a nation. The degree of
homogeneity will be a pattern for the degree of communality in values, culture and
norms. This study suggests evaluating homogeneity by simultaneous assessment of the
strength of forces that increase and decrease it.
Factors that Decrease Homogeneity in a Society
The presence of unorganized diversity in language, culture, religion, and race
generally results in a lack of social and economic integration, which consequently
negatively affects the process of nation-building. Attachments to different customs,
religions, languages and races conflicts with the requirements for political integration,
and in particular, with the need for more generalized commitment to a nation-wide civil
order.

77
Adelman and Morris (1967) suggested using the proportion of people belonging
to the same ethnic/religious/language group as an indicator of the extent of linguistic,
religious and racial homogeneity of a country. A trend in research (Alesina,
Devleeschauwer, Easterly, Kurlat, & Wacziarg, 2003; Annett, 2000; Bossert,
D’Ambrosio, & LaFerrara, 2006) has suggested assessing the level of group
homogeneity/heterogeneity by calculating the fractionalization index. This index serves
as a proxy for the number of competing groups in a society. Fractionalization index
measures the probability that two randomly selected persons from a given country will
not belong to the same group (Alesina et al., 2003). A group may be defined according to
different qualities. In this dissertation, the fractionalization index measures the
probability that two randomly selected persons from a given country do not belong to the
same ethnic/religious/language groups, and thus, do not share common norms, values and
culture.
Annett (2000) suggested that societies are composed of multiple self-interested
groups who act non-cooperatively. With an increase in the number of such groups in a
society, a possibility of cultural/norm/value conflict increases. The bigger the diversity in
languages, religions and ethnicities, the smaller the degree of common culture, norms and
values that they share. Annett (2000) cited Canning and Fay (1993), who argued that a
more fractionalized population displays lower productivity growth (Annett, 2000, p. 572).
Vigdor (2002), Alesina and La Ferrara (2000, 2005) concluded that an individual’s
willingness to invest resources in local public goods, as well as participate in
heterogeneous communities depends on how many members of the community share the
same ethnicity of that individual. The greater the initial cultural and ethnic heterogeneity

78
of a society, the less likely it is that modern integrative mechanisms such as education
and mass communication will be effective in promoting a unified population.
Factors That Increase Homogeneity in a Society
It has been suggested (Alesina et al., 2003; Bossert et al., 2006; La Porta, Lopez-
de-Silans, Shleifer, & Vishny, 1999; Smith, 1991) that a high level of fractionalization in
a country can be offset by a strong government and strong national institutions. If a
country is comprised of many nationalities, but has strong national institutions to
organize them, such a country displays stronger integration, and the population more
strongly adheres to common norms and values than a country with many nationalities, but
no force to organize them together in a unified nation. In fact, a country with strong
institutions or government is capable of building and supporting an “umbrella” culture
that welcome diverse cultures. In spite of forces which tend to result in disruption of
national cohesion (such as major wars, occupation, deportation, influx of immigrants),
some nations still preserve it, while others dissolve and assimilate. There must be some
strong institutions that keep people together. It can be either strong and effective
government or any other nationally-recognized institution that is equally effective (for
example, the Catholic Church in Poland and Judaism in Israel). The historical experience
of countries with opposite political systems, which were able to reach significant
economic growth, reveals the fact that often it is not the content of the institutions that is
important but their strength and ability to keep the society together, effectively utilizing
the human and material resources of the population (the USSR and USA can serve as a
good comparison here). Rationally organized administrative services can help establish

79
and strengthen the public services necessary for social integration and economic growth.
Effective institutional bureaucracy can display the responsibility, rationality, and high
professionalism necessary to achieve this goal (La Palombara, 1963).
It has been suggested that the quality of a government’s work in building a
cohesive and homogeneous society may be measured in terms of the amount of financial
resources it consumes (Annett, 2000). This suggestion is based on the nature of
government consumption. One major component of government consumption is the wage
bill of the bureaucracy, which is responsible for establishing and running national
institutions capable of strengthening social cohesion. Another major component is
transfer of fiscal resources to the various groups of society. This transfer usually takes
form of public provision of goods (either of public goods or publicly provided private
goods). As Annett (2000) succinctly put it, “the most natural interpretation of government
consumption is to think of it as the quantity of publicly provided goods provided by the
government at any point it time” (p. 564). Examples of such goods are schools, health
care, recreation facilities, etc. It has been shown that ethnic fractionalization is strongly
negatively correlated with good schooling, well-developed financial institutions, and
institutional quality (Easterly & Levine, 1997). Government consumption may be viewed
as a measure of the degree to which the government is capable of placating high social
fractionalization (Annett, 2000; Rodrik, 1997). This can appease competing groups and
reduce the level of conflict in a society divided by ethnic, religious, and language lines.
Conversely, high fractionalization of society is associated with low schooling,
underdeveloped financial institutions, high government deficit and poor institutional
quality. In a related work, Alesina, Baqir, and Easterly (1999) studied the relationship

80
between fractionalization and the provision of local public goods in the US. They found
that an increase in the level of ethnical diversity in a region is associated with higher
spending and deficits per capita, but with lower spending on basic public goods like
education. Therefore, cohesion in a society can be measured by both variables—the
overall level of government consumption or government spending on basic public goods,
such as education and healthcare. Because the former potentially covers a broader range
of public services than the latter, this study will utilize the measure of overall government
consumption.
It has been suggested (Alesina, Baqir, Easterly, 1999; Annett, 200o),that
government consumption needs to be measured as the share of government consumption
in GDP minus the ratio of government expenditure on defense. The reason for excluding
military spending is the different nature of military spending, and the correlation between
military expenditure and instability in countries.
Final Operationalization of the Variable of Common Norms, Values, and Culture
Utilizing discussion of the previous two sections, the following indicators are
suggested to measure the variable of common norms, values, and culture:
• Language cohesion
• Ethnic cohesion
• Religious cohesion
• Level of total government consumption minus military expenditure as percent
of GDP

81
Operationalization of Perception of Collective Destiny Variable
This variable assumes the existence of collective goals in a nation and perception
of collective destiny by the major groups in a nation. Such an understanding is based on a
framework that assumes perpetual existence of a country, and views personal welfare as
nested in the context of the welfare of the country. Politico-socio-economic decisions by
leadership are affected by the degree to which such an understanding exists in the
country. The author of this study suggests assessing this variable by measuring 1) the
degree to which people in the country view themselves as “sailing together in one boat;”
2) the proportion of people in a country who see their personal welfare in the context of
the welfare of the country; 3) the degree to which the actions of the leadership are
affected by a wider sense of identity.
The Degree People in the Country View Themselves as “Sailing Together In One Boat”
As a proxy for this measure, the researcher suggests using Corruption Perception
Index compiled by Transparency International. The reasoning of using this variable is
grounded in the fact that any corruption hurts the national economy through artificial
market distortions (Hellman, Klich, & Kaufman, 2000; Shleifer & Vishny, 1993). A
competitive market is known to deliver the most economically efficient results.
Influencing the market through corruption reduces its competitiveness, and consequently
hurts national interests. A high level of corruption is known to reduce the strength of a
country in terms of its territory and independence of its interior and exterior decisions. At
the same time, corruption creates personal economic rent, which may be attractive for
some individuals. Businesspersons and politicians often encounter situations when they

82
can make either choice: seeking their personal rent at national expense hurts national
interests, while seeking national interests may obliterate chances for (unlawful) personal
gain. Countries with a high level of corruption have politicians and business leaders who
are willing to choose personal economic rent at the expense of national market
distortions. This means that they do not identify their financial welfare with that of their
country. They do not see themselves as “sailing together in one boat” with the rest of
people in the country, and, consequently, are not interested in improving the conditions of
this “boat.” They do not see themselves as agents in perpetuating the existence and
welfare of the country into future generations. Therefore, they do not have strong national
identification with their country. As suggested earlier, behavior of national leaders
generally can be viewed as a typical behavior of the rest of population. Therefore, a high
level of corruption may be said to be a characteristic of a country whose population, by
their own choice or under the pressure of circumstances, does not see itself as one nation
“sailing together in one boat.”
The Proportion of People in a Country Who See Their Personal Welfare as Nested in the
Context of the Welfare of the Country
Gini coefficient (as a proxy for the size of the middle class in a country) can serve
as a measure of the number of people who see their personal welfare as nested in the
context of the welfare of the country. Gini coefficient is a well-accepted measure of
inequality in a country (as measured by income distribution). It has been suggested
(Aghion, Caroli, & Garcia-Penalosa, 1999; Berkowitz & Jackson, 2005; Glaeser,
Scheinkman, Shleifer, 2003) that equitable income distribution is conducive to economic

83
growth of a country through being instrumental toward the creation of a powerful middle
class. Historically, the middle class is known as the group of people whose economic
interests are concentrated inside the country and who are therefore interested in the
country’s healthy politico-socio-economic development. In comparison with the upper
class (who is predominantly cosmopolitan in its economic interests) and the lower class
(who does not have a strong voice in national decisions), the middle class sees
improvements in the country as the foundation of improvements in their own lives, and
possesses enough power to initiate national actions based on this understanding
(Fidrmuc, 2000; Romanenko, 2007). Anthony Smith has recommended that nations must
have a set of common aspirations to be successful in their pursuit of affluence. Adelman
and Taft-Morris (1967) added that the presence of active indigenous groups in the middle
class is considerably more conducive to the initiation of the growth process than is the
presence of expatriate groups in that class. The middle class is the group of people who
most logically possess such common aspirations.
The middle class can be defined in both economic terms, meaning a relatively flat
income distribution, and in political terms, meaning a bloc of centrist voters (Berkowitz
& Jackson, 2005). The difficulty with this measure is that direct measures of classes in a
society do not exist. As Fuller and Clarke (1994) put it (cited in Buchmann, 2002, p.
167), “the greatest weakness… is the lack of social class measures that are culturally
relevant to the particular society or community being studied.” Because of this, some
researchers use such ethnomethodological measures as types of livestock and modern
items in possession (Buchmann, 2002, p. 167) to validly discriminate families’ levels of
wealth and social class. It has also been suggested (studies at the University of

84
Pennsylvania, mentioned by Buchmann, 2000), that home possessions data can prove a
more comparable measure of SES than parental education and occupation.
At the same time, both—sensitivity to local context and concern for comparability
across multiple contexts—are important. Although researchers need to be careful in
applying Western measures in non-Western contexts, the use of broadly divergent
measures may lead to not reliable results (Buchmann, 2002). Therefore, this study
suggests using Gini Coefficient measure as a proxy for the size of the middle class in a
country (with an understanding that this measurement has its weaknesses).
The Degree a Country’s Leaders’ Actions Are Affected by a Wider Sense of Identity
An array of literature suggests that there is strong relationship between the core
values of a nation and its elite (Duijker & Frijda, 1960; Hofstede, 2001; Kotkin, 1993;
Smith, 1991). Dujker and Frijda (1960) stated that “national character is determined by
the character of the elite” (p. 28). They suggested that elites represent most clearly those
psychological features which distinguish one nation from another. “The very fact that
they are national elites might make it probable that they represent and embody the values
current in their nation more clearly, more completely… than the other strata of the
population” (p. 29). Kotkin (1993) concurred that national decline and rise are connected
with the quality of national elites. Hofstede (2001) saw the reason for strong correlation
between characteristics of national elites and characteristics of the whole nation in the
fact that “elites were more likely than non-elites to shape the institutions that perpetuate a
culture” (p.14). Prizel (1998) described evolution in a country’s national identity as
transfer of that identity from the elite to the popular level. Generally, the ideas, attitudes

85
and practices of the elite serve as models to other members of a society. The question is
whether elites and the general strata have national development in their utility function,
or if they perceive their socio-economic success as independent from the wellbeing of the
country in which they are located. The question is whether the elite identify with success
of the country or whether they see no correlation between their personal economic and
social wellbeing (as measured in personal income and socio-political voice), and those of
their country.
Kevane (1997) and Cremer (1986) suggested thinking of national identity in terms
of membership in an ongoing organization (a nation). They state that if individuals fully
realize that they were born into an infinitely lived social organization, which covers a
much longer period than their personal lives, they will adjust their socio-economic
behavior to include this fact into their utility function even if they as individuals have
finite life spans. Sen (1986) supported this idea by explaining how identity becomes
important in the socio-economic development of a country: “…the choice of actions may
be seen as a group choice and ‘self-interest’ in that context may involve a
correspondingly wider sense of ‘identity.’ ‘We’ may be the natural unit of first-person
decision” (p. 351). Such a conclusion is grounded in basic economic way of looking at
behavior, which assumes that “individuals maximize welfare as they conceive it, whether
they be selfish, altruistic (or) loyal (Becker, 1993, p. 386). In other words, if individuals
in a nation conceive perpetuation of welfare of this nation as a part of their utility
function, they will maximize their welfare by aiming for a goal of increased welfare for
the nation. Jenkins and Sofos (1996) concurred: “national identity articulates demands for

86
expression of the national/popular general will, without however linking them to the
representation of particular social identities and interests” (p.14).
Smith (1991) said that strong national identity awareness signifies strong social
and political movements to achieve the goals of the nation. He proposed that it was “a
consciousness of belonging to the nation, together with sentiments and aspirations for its
security and prosperity” (p.72). Consequently, having national goals, and actually
pursuing them on a national level with all strata of society, as well as being aware of
them and participating in them, is a consequence of strong national identity awareness in
the nation.
The question that becomes very important is how many people in society view
their experiences in these terms. As a possible proxy for such a belief, the researcher
suggests using the measure of time a country has been independent. The reasoning for
the use of this variable is grounded in the fact that the time factor improves the chances
of citizens developing a strong national awareness.
Final Operationalization of the Variable of Perception of Collective Destiny/Common
Goals
Utilizing discussion of the previous three sections, the following indicators are
suggested to measure Collective Destiny/Common Goals variable:
• Period of national independence
• Corruption Perception Index
• Gini Coefficient

87
Operationalization of Common Institutions/Rights and Duties for All Members
Variable
It has been suggested that institutions reflect national character and support the
perpetuation of national culture. It has also been suggested that the economic conditions
of a country to some degree are a function of its socio-cultural customs and institutions
(Adelman & Taft-Morris, 1967; Duijker & Frijda, 1960; Fukuyama & Avineri, 1994;
Harrison, 1992; Sen, 1985, 1986). As Harrison put it, “it is impossible to answer
(economic) questions without examining the impact of culture on human progress - the
values and attitudes of a nation, and the institutions that both reflect and reinforce those
values and attitudes” (p. 6). Duijker & Frijda (1960) agreed that the national system of
norms and values, the general pattern of characteristics specific for a nation, were evident
in the nation’s institutions. Hofstede (2001) stated that institutions, once established,
reinforced societal norms and the ecological conditions that had led to their
establishment. Societal norms lead to the development and pattern maintenance of
institutions in society with particular structures and ways of functioning. Generally, the
major institutions of the country are those which uphold the overall livelihood of the
country, such as the institution of government, the institution of education, legal
institution, and media institution. To assess these institutions, it is necessary to assess the
quality of service they provide to the country. The World Bank is an organization which
consistently assesses the quality of national institutions of all countries. Therefore, this
study uses their measures for the discussed factor. (The institution of education is not
included in the current discussion in order to avoid multicollinearity problems during the
statistical analysis).

88
Final Operationalization of the Variable of Common Institutions/Rights and Duties for
All Members
This study suggests operationalizing this variable by selected measures of the
World Bank’s Governance Indicators:
• Government Effectiveness measure: a composite measure for the
quality of public services, civil services, and the quality of policy
formulation and implementation (Kaufmann, Kraay, & Mastruzzi,
2007).
• Voice and Accountability measure: a composite measure which
evaluates the extent to which a country’s citizens are able to
participate in selecting their government, as well as freedom of
expression and media (Kaufmann, Kraay, & Mastruzzi, 2007).
Operationalization of Common Myths and Historic Memories Variable
This variable measures the degree to which national identity awareness in the
population is developed via citizens’ being reminded about the uniqueness of their
country by stories about its history or its current successes. The researcher suggests
operationalizing this measure by the indicators which measure how often citizens in a
country are reminded about the uniqueness of their country by their direct and indirect
participation in cultural and sport activities and institutions that set aside their country as
different from others.

89
Citizens’ Active Participation in Perpetuation of Common Myth and Historic Memories
This study suggests the following indictors to measure this variable: school life
expectancy and the number of national holidays that are celebrated in a country.
School life expectancy (in years). Generally, children and youth learn their
national history in school. School is the major institution responsible for perpetuating
citizen awareness in national memory and culture. Education is the major tool for
reproducing the existing structure of the society, including the myths and legends that
support that national culture (Bourdieu, 1977). Generally, learning national history is
strengthened with every academic year in accordance with the gradation of historical
complexity. Consequently, the more years in school a child has completed, the more
chances he/she has had to learn more about his/her country and internalize the national
identity.
Number of holidays that the country celebrates. The reason for inclusion of this
variable is that holidays are generally a time when family/national history and traditions
are remembered and practiced.
Citizen Non-Active Participation in Perpetuation of Common Myths and Historic
Memories
This dissertation suggests the following indicators to measure the variable of
citizens’ non-active participation in perpetuation of common myths and historic
memories: number of Nobel Prize laureates in a country and number of Olympic medals.
The honor of a country’s citizen winning the Nobel Prize or a country’s team winning a
medal in Olympic Games increases national pride, forces citizens to be united as a nation

90
and remind them in which country they live. An occasion of winning the Nobel Prize or a
country winning Olympic medal can be used by the government as a good opportunity
for further developing national pride.
Conclusion
The preceding sections analyzed the structure of the construct of national identity
awareness by way of literature content analysis. Four factors which constitute this
variable were analyzed, and empirically measurable proxies for every factor were
suggested as a result of the analysis. Overall, the variable of national identity awareness
may be presented as a function of the following indicators:
Common norms, values, and culture
• Ethnic cohesion
• Linguistic cohesion
• Religious cohesion
• Total government consumption minus Military expenditure as percent of
GDP
Perception of collective destiny
• Corruption Perception Index
• Gini Coefficient
• Time of Independence
Common institutions/Rights and duties for all members
• Government Effectiveness measure
• Voice and Accountability measure

91
Perpetuation of common myths and historic memories
• Number of Nobel Prize laureates in a country (1901-2005)
• Number of Olympic medals (1998-2005)
• School life expectancy
• Number of holidays that the country celebrates
Family Background Factor
As previously discussed in this chapter, the role of the family is an important
factor in the formation of HC in its members. On an aggregate level, families in a country
contribute to development of national HC. This chapter establishes specific mechanisms
of this process, develops a model of the Family factor construct, and suggests empirical
measures for this construct.
Family Background Factor as a Formative Component of National Human
Capital
This section explores and establishes the relationship between families within a
country and the level of HC that the country attains. It identifies specific channels for the
process of the Family factor’s influence on national HC.
A sizable group of HC authors have argued (Heckman & Cunha, 2007; Heckman
et al., 2006; Mincer & Polachek, 1974; Schultz, 1971) that the major function of the
family as a social institution is the building of human capital of children, as Schultz
(1971) called it, “child capital.” In his words, “A particular class of human capital
consisting of ‘child capital’ may hold the key to the economic theory of population. The

92
formation of ‘child capital’ by the household, man and wife, would begin with the
bearing of children and proceed through their rearing through childhood” (p. vii).
Family background is one of the major contributing factors in the process of
formation of children’s HC by their families. It plays a crucial role in shaping the
educational experiences and achievement of children and the generational transmission of
status. Three interrelated processes explain the process of family background’s affect on
children: 1) transmission of financial capital; 2) transmission of cultural resources; 3)
transmission of social capital from parents to children (Ben-Porath, 1980; Bourdieu,
1990; Buchmann, 2002; Nash, 1990).
Much has been written in academic literature on the models and processes of
transmission of financial capital as a type of non-market transaction (Becker, 1993;
Becker & Tomes, 1976; 1986; Ben-Porath, 1980; Schultz, 1986). Bourdieu’s ideas (1977,
1986) are very prominent in any discussion of the transmission of cultural and social
capital. He noted that cultural capital could exist in three forms: embodied as a
disposition of the mind and body; objectified as cultural goods; and in its institutionalized
state, for example, education (Bourdieu, 1986). Bourdieu recognized social capital as
“the aggregate of the actual or potential resources which are linked to the possession of a
durable network of more or less institutionalized relationships of mutual acquaintance
and recognition” (p. 248). Ascribed status as a member of a certain family has a greater
operational significance for others outside the family than the actual achieved status of
the individual. Family creates a collective identity that affects the transactions of each
member with people outside the family (Becker, 1993; Ben-Porath, 1980; Buchmann,
2002; Van Zanted, 2005). The role of family affiliation vis-à-vis others is based to a

93
significant degree on its value as a signal of personal traits and the degree to which the
family is responsible for its members’ actions. All three sources of capital—financial,
cultural, and social—are distinctive resources that can be mobilized through the family in
support of its children. These avenues are used by families to affect their children’s
development and, together, act toward development of HC of children in the family.
Specific Channels of the Family Background Factor’s Influence of Human Capital
Development
Transmission of Cultural Capital
Education. One major mechanism in the transmission of cultural and social
capital takes place through the formal and non-formal education of a child. Since
education is an essential HC variable, it has been suggested that families affect HC in a
country through affecting the education potential of children (Heckman, & Cunha 2007;
Heckman, Layne-Farrar, & Todd, 1996).
Conventional wisdom, which places educational institutions in the center of
producing skills and knowledge necessary to succeed in modern economy, neglects the
crucial role of families in fostering these skills and a variety of other abilities crucial for
economic and social success (Heckman, 2000; Heckman, Layne-Farrar, & Todd, 1996).
It has long been recognized that parental influences are key factors governing child
development, as abilities are created, not solely inherited, and are multiple in variety.
Heckman (2000) suggested that the family’s effects on the educational achievement of
children are twofold: a) families engage in skills, character, and abilities formation from
the moment a child is born, much earlier than any educational institution, and b) families

94
are the prime places where socially and economically valuable non-cognitive skills and
motivations are formed, which are variables in economic success.
Children’s tastes for education and their expectations about their life chances are shaped by those of their parents. The influence of family factors that are present from birth through adolescence accumulate over many years to produce ability and college readiness (Heckman, 2000, p. 15).
It has been argued that the disincentive affects of college tuition on college
attendance are dramatically weakened when ability is entered into the analysis of college
attendance (Cameron & Heckman, 1998). Since Schultz (1981) stated that natural
abilities are normally spread between and among nations, and that the major difference in
the quality of HC among nations comes from acquired abilities, it is possible to say that it
is family which constitutes an important influence in abilities acquisition (along with
school, which steps into the process considerably later in a child’s life).
Supporting this view is a group of researchers who argue that the role of the
family in shaping children’s social and academic readiness is evident in the fact that
ability gaps between individuals and across socioeconomic group become noticeable at
an early age for cognitive, as well as non-cognitive skills, while school quality and
resources have relatively small effects on these gaps (Hanushek, 1997). At the same time,
other researchers (Krueger, 2002; Mosteller, 1995) found strong support for the opposite
view, arguing that “the literature exhibits systematic evidence of a positive relationship
between class size and achievement, and between expenditures and achievement”
(Krueger, 2002, p. 35), as measured in gains and losses on test scores during the school
year. However, the same group of researchers acknowledged that this gain’s effect
disappears when school is not in session, because children from poor families receive

95
little academic enrichment during that time. Consequently, their argument once again
points to the importance of families in children’s academic success.
It has been stated that for many skills and abilities, later remediation for
disadvantage is possible, but is much less efficient and effective than if given to children
at early age (Heckman & Cunha, 2007). A study by Hopkins and Bracht (1975) showed
that IQ scores become stable only by the time a child is 10 years old. Goleman (1995)
provided evidence that the neocortex of the brain, which is responsible for reasoning and
thinking processes, completes its development late into the teenage years. Early
childhood is when children spend most of their time with parents. This means that
families are in large part responsible for the level of IQ their children will have as adults.
An opposite view is represented by Herrnstein and Murray (1994), who claimed that a
general ability factor is mostly determined by heredity and is of utmost importance as it
overrides the importance of family background and of any other factor. However, these
claims are not shared by economists (Daniels, Devlin, & Roeder, 1997; Fienburg &
Resnick, 1997; Korenman & Winship, 2000).
Disposition of mind. Families play a crucial role, not only in developing
children’s academic skills and knowledge, but also in the development of the child’s
emotional and social skills. Development of emotional skills is achieved through the
channels of social-psychological factors that the family provides—parental involvement
with children, psychologically safe and nurturing environment, and family social and
cultural capital (Buchmann, 2002; Goleman, 1995; Gerber & Hout, 1995; Haller &
Portes, 1973; Sewell, Haller & Portes, 1969). According to Emotional Intelligence theory
(Bar-On & Parker, 2000; Goleman, 1995), people’s emotional well-being is the key to

96
their economic and social success. By families’ active participation in emotional
development of children and their help in assisting children to develop into emotionally
mature adults, families strongly contribute to formation of a high level of HC in a
country.
Cultural goods. Family background affects development of children’s HC through
providing cultural goods, which include various cultural events, works of classic and
contemporary art, history and science. More affluent families are in a better financial
position to do this. At the same time, a similar effect can be achieved by less wealthy
families who realize importance of children’s exposure to classical and contemporary
culture and art and act consistently upon this understanding.
Transmission of Social Capital
Social capital can be broadly defined as a supportive network that furthers an
individual’s goals. In the words of James Coleman (1988):
Social capital is defined by its function. It is not a single entity but a variety of different entities, with two elements in common: they all consist of some aspect of social structures, and they facilitate certain actions of actors—whether persons or corporate actors—within the structure. Like other forms of capital, social capital is productive, making possible the achievement of certain ends that in its absence would not be possible (p. S 98).
Social capital exists in relations among persons, through goodwill and fellowship
between individuals. The amount of resources individuals in a network possess, as well
as the sheer number of individuals involved in the network, affects efficacy of social
capital derived from such a network. Family background is a factor which generally
causes these variables. Consequently, HC of family members is affected by the family’s
social capital, which, in its turn, is influenced by the family’s background.

97
Family’s Role in Meeting Psychological Needs of Family Members
Emotional Intelligence theory can also been applied to argue that families affect
HC of not only children, but their adult members as well. According to Maslow’s needs
theory, a psychologically safe, nurturing and comfortable environment is a basic
psychological need not only of children but also of adults. Therefore, another possible
way family affects national HC is through affecting the psychological/emotional health of
all its members by meeting/not meeting all family members’ needs in this area. As
Becker (1964) noted more than forty years ago, “emotional health increasingly is
considered an important determinant of earnings in all parts of the world… One way to
invest in human capital is to improve emotional (and physical) health” (p. 33).
Consequently, the researcher suggests that family background factor affects HC through:
• Family’s role in governing development of children
o Family affecting children’s cognitive abilities
o Family affecting children’s emotional abilities
• Family’s role in meeting psychological needs of all family members
Family’s Role as Governing Development of Children
According to Hartog (2001), in the simplest possible framework, individuals are
characterized by an ability vector a, which is transferred into skill vector s through an
educational production matrix E. Skills are transferred into outputs q by a productivity
matrix Q. Earnings are determined by output prices p and productivity.
s = Ea

98
q = Qs
y = pq
Therefore earnings y can be presented as:
Y = pQEa
Ability is an indication of the potential of an individual, while skill is the actual
proficiency in an activity. Affecting the ability and skill vectors by affecting the E
production function, family influences the future economic welfare of an individual.
Abilities and skills vectors signify both—cognitive and non-cognitive—characteristics.
Family Affecting a Child’s Cognitive Abilities
Children’s cognitive abilities are affected by two major sources—their parents’
genes and the family environment. In fact, the positive influence of parents’ schooling on
their children’s schooling is driven to a great extent by the family environment and not
ultimately by genes. Although heritability of cognitive abilities in childhood is well-
established (McGue, Bouchard, Iacono & Lykken, 1993; Plomin, 1999), its magnitude
and mechanisms remain unresolved (Turkheimer, Haley, Waldron, & D’Onofrio, 2003).
Research shows that although about 50% of all ability transfers relevant for educational
attainment measured in years “run through genes” (Plug, 2007, p. 88) there is still sizable
transfer through nurture, not nature (Plug & Vijverberg, 2003). Measured abilities are
influenced by both—genetics and environment, and “gene expression is governed by
environmental conditions (Heckman & Cunha 2007, p.3) to a considerable extent.
Turkheimer et al. (2003) study showed that proportions of IQ variance attributable to
genes and environment depend non-linearly on SES. In impoverished families, 60 percent

99
of the variance in IQ is accounted for by the environment and the contribution of genes is
close to zero; in affluent families, the result is almost exactly the reverse (p. 623). This is
true to a considerable extent even for adopted children. (Additional strong support for the
importance of social environment may be found in the well-known results of the social
experiment conducted in 1968 by Jane Elliott, a third-grade teacher in Iowa.)
Social environment is determined by socio-economic status (SES)/family
background to a big extent. An array of research (Plug, 2007) speaks about family’s SES
in determining student achievement. With or without ability controls, parental schooling
and income retain their positive influence on the schooling of children (Plug, 2007).
Although SES is a complex variable, it can be defined as measuring the quality of the
environment in which children are born and raised (Hartog, 2001; Turkheimer et al.,
2003).
Family Affecting a Child’s Emotional/Psychological Abilities
Becker (1993) stated that parental attitudes and behavior have an enormous
influence on children in the family:
Parents who are alcoholic or are addicted to crack create a bizarre atmosphere for impressionable youngsters, whereas parents with stable values who transmit knowledge and inspire their children favorably influence both what the children are capable of and what they want to do (p. 399).
The “Big Five” personality attributes that are routinely used as robust factors of
predicting a child’s academic success are as follows: emotional stability, agreeableness,
conscientiousness/dependability, openness to experience, and extraversion (Hartog,
2001). The foundations of these qualities are formed early. Children learn them in
families much earlier than they get a chance to develop them at school. A family that

100
provides for the development of such qualities gives a child a great springboard in life.
Furthermore, skills are self-reinforcing and cross-fertilizing, which means that skills
produce new skills, while also increasing their complexity and quality (Heckman &
Cunha 2007). Moreover, better developed emotional skills lead to improvement in
cognitive skills, in terms of learning promotion allowed by good emotional skills. Surely
influenced by early development experiences, these Big Five personality dimensions
have been attributed to work performance in adults (Barrick & Mount, 1991).
Family as Providing for Psychological Needs of All Family Members
As previously stated, one major role of the family is meeting the need for belonging,
a safe and nurturing environment of all member of the family—not only children but
adults as well. According to Maslow’s needs theory, a safe, loving and nurturing
environment is a basic need that must be met for a person to fully devote him/herself to
pursuing higher goals. Family is the major social institution where this need is met. A
group of economists (Becker, 1993; Schultz, 1974) proposed that people’s decision to
marry is an attempt to raise their welfare by comparing benefits and costs. The notion of
welfare includes both economic and emotional aspects, as people maximize welfare as
they perceive it. For example, Becker (1993) discussed “warm atmosphere,” the feeling
of love, duty and inspiration residing in some families, and not in others. It has been
discussed earlier that emotional/psychological stability is considered an important quality
contributing to human capital on the individual and group level (Becker, 1964).
Consequently, the family’s role in taking care of the emotional needs of its members is an
important contribution for the development of HC in the family members. Aggregated

101
across a nation, a country’s families play an important role in formation of the country’s
HC by affecting the emotional aspect of life.
Conclusion
The ability of a family to provide for the cognitive and emotional development of
a child depends on the education of parents and the environmental conditions which the
family is capable of creating, which, in turn, depends on the family’s background.
Therefore, assessment of family background is an important part of assessment of the
degree to which conditions in a family are conducive for child development. As discussed
in previous sections, cognitive and emotional development of children affects the level of
national HC development. Consequently, measures of family background need to be
assessed while evaluating national HC. A family’s ability to meet the emotional needs of
its members is a crucially important factor which also needs to be taken into
consideration in this regard.
The Basic Model of Family Background Factor
The previous sections have established the importance of assessing family
background in order to evaluate the relationship between the Family factor and national
HC. Furthermore, in standard economic analysis, households and firms exist as collective
identities that completely replace the identity of the individuals affiliated with them. That
is why “family background is one of the most important social conditions to consider
when comparing populations cross-nationally” (Buchmann, 2002, p. 152).
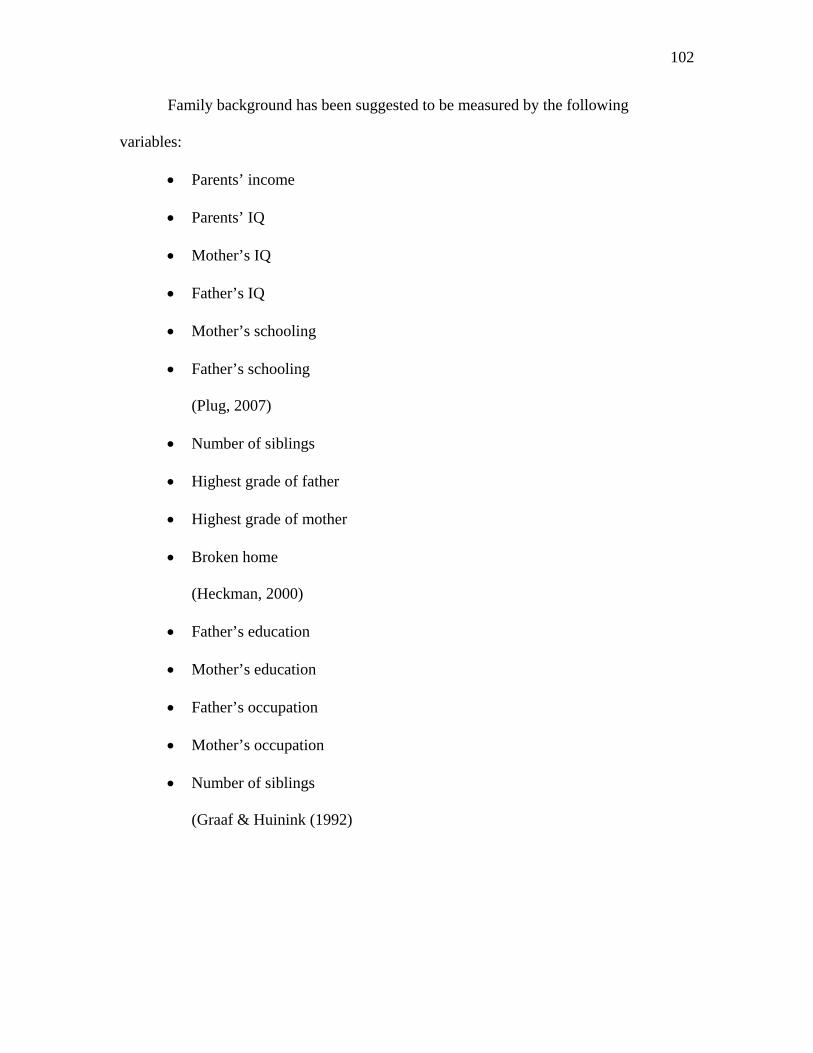
102
Family background has been suggested to be measured by the following
variables:
• Parents’ income
• Parents’ IQ
• Mother’s IQ
• Father’s IQ
• Mother’s schooling
• Father’s schooling
(Plug, 2007)
• Number of siblings
• Highest grade of father
• Highest grade of mother
• Broken home
(Heckman, 2000)
• Father’s education
• Mother’s education
• Father’s occupation
• Mother’s occupation
• Number of siblings
(Graaf & Huinink (1992)

103
• Parental education
• Family structure
• Place of residence
(Carneiro & Heckman (2003)
Data search for availability of these variables showed that most of them were not
available as panel data for many countries. In fact, they were not available for most
countries. One major difference of this study as compared with similar studies is the fact
that this study uses available and empirical data for all of the world’s countries (not just a
few countries as most studies use). Consequently, there was a need to create a more
parsimonious model of the family background factor that would incorporate measures
that were available and easily empirically tested for all (or most of) the 163 countries in
the sample. Therefore, the researcher analyzed the four models of family background
mentioned above in order to create the model which would incorporate as many variables
as possible from the models, according to their frequency of use and providing for cross-
country availability.
Number of Children in the Family
Number of children in the family is an important factor in three out of four
examined models. This factor is also the one that is available as cross-country panel data.
Therefore, this factor was investigated.
Number of children in the family has a unique effect on the way child human
capital is developed. Research suggests (Buchmann, 2002; Mincer, 1974) that number of
children is negatively correlated with educational achievement. Becker (1995) used the

104
term quality of children and stated that it was connected with the home time of parents
that each child received as well as with shared resources: “Quality of children has to be
bought with time as well as money” (p. 263). Therefore, “increase in the quantity of
children raises the cost of the quality of children, and vice versa. This explains why the
observed income elasticity of demand for quality of children is high at the same time that
the observed quantity elasticity is low and often even negative” (Becker & Tomes, 1976,
p.143). An increase in the number of children increases the cost of raising the quality of
children since higher quality applies to more children (Becker, 1993; Schultz, 1986).
Number of siblings (relative to other background variables) is found to have an important
detrimental impact on child quality even for socially and economically advantageous
countries (Blake, 1981). Becker’s insight in explaining this fact is that the expenditure
per child, which the parents consider necessary, rises with family income (Becker, 1993;
1995). This necessary level of expenditure depends on the social class a family belongs
to, which also establishes certain standards of quality (which varies with social class).
Ben-Porath (1980) agreed with this and stresses that the parental decision to have
children and how to behave toward them during their childhood are affected by
expectations concerning future mutual relationships. That is why in standard economic
analysis the number of children is added into the utility function of parents.
Becker suggested that from a pure economics approach, an increase in child
ability-endowments should reduce the investment by parents in children, which in turn
will reduce the cost of children and consequently will lead to increase in the number of
children (Becker & Tomes, 1976). The picture, however, changes when the issue of
quality comes into view. Two opposing forces are at work: a “wealth” effect that

105
motivates parents to compensate less to well-ability-endowed children, and an
“efficiency” effect that induces them to reinforce better-ability-endowed children. There
is a strong presumption that “efficiency” effect dominates for investments in human
capital and the “wealth” effect for investments in nonhuman capital (Becker & Tomes,
1976). Given time constraints, parents may choose to invest more human capital in their
better-endowed children. Taking into consideration the above discussion about the
importance of time with parents for the future of the children, we can say that such
behavior may further increase the quality gap between children, and their consequent
economic success.
Family Size
Family size is an important factor in one out of four examined models. This factor
is also the one that is available as cross-country panel data, thus, this factor was
investigated. Family size, particularly extended family (additional adults living in the
family, for example, grandparents, or other members of an extended family), may affect
the process of HC development by increasing adult attention to children. In a large
household there is greater flexibility—older children can help take care of younger ones,
and older relatives can help as well. Another channel of how family size can affect HC of
family members is through risk-mitigation. Additional adults in a family may reduce the
risk of lowering welfare as well as increase family-structure security in emergency and a
greater likelihood that larger numbers of adult family members will contribute to
aggregate household income.

106
Broken home and place of residence
Broken home and place of residence are important factors in one out of four
examined models. These factors are also the ones that are available as cross-country
panel data. Therefore, these factors were investigated.
Ultimately, this study suggests using the following indicators of family
background:
• Average number of children in a household
• Family size
• Urban/Rural population distribution in the country
• Existence of at least one social security program oriented toward families
• Divorce rate
Final Operationalization of the Family Background Variable
The ability of a family to provide for cognitive and emotional development of all
its members depends on the environmental conditions the family is capable of creating,
which, in turn, depends on its background to a big extent. Therefore, appraisal of family
background is an important part of assessment of the degree to which conditions in a
family are conducive for development of all family members. As previously discussed,
the cognitive and emotional state of family members affects the level of national HC
development. Consequently, measures of family background need to be assessed while
evaluating national HC. Overall, the variable of family background may be presented as
the function of the following indicators:
Family as governing development of children

107
• Average number of children in a household
• Family size (number of occupants per a household)
• Urban/Rural population distribution
• Existence of at least one social security program oriented toward
supporting families
Family as meeting psychological needs of all family members
• Divorce rate
Character Factor
As discussed earlier in this chapter, character qualities of people in a country are
important contributing factors toward national HC. This section establishes specific
mechanisms of the relationship between these variables, develops a model of the
Character factor construct, and suggests empirical measures for this construct. The
specificity of this chapter is that it relies on a more flexible approach in search for the
variables’ proxies because of a lack of applicable theories other than overall theories of
moral development.
Brief Overview of the Framework Utilized in Development of the Character
Factor
Importance of character qualities in human capital have long been recognized.
Writing at the end of the 18th century, Adam Smith (1776/1937) believed that
development and use of human capital was closely associated with the degree to which
the system of democracy (natural liberty) and moral doctrines were allowed to prevail in

108
a society. Smith spoke about the need for education to not only teach basic literacy skills,
but also to develop character qualities, “to prevent cowardice, and stupidity” (Spengler,
1977, p. 34). Many current researchers follow this approach in giving credit to the
importance of character qualities of a population as an important factor in shaping
national HC. For example, Becker (1993) suggested that “various kinds of behavior (are)
included under the rubric of human capital” (p. 392). He established the concept of
human capital as including different work habits,
even including harmful addictions such as smoking and drug use. Human capital in the form of good work habits or addictions to heavy drinking has major positive or negative effects on productivity in both market and nonmarket sectors (p. 392).
Consequently, some behavior which is a part of HC, can improve economic outcomes,
while other behavior, which is also a part of HC, may inhibit it. Psacharopoulos and
Woodhall (1985) underlined the importance of character qualities in student achievement.
They spoke about “individual personality” of students, which is a decisive factor in
schooling output (p. 217). Fitz-Enz (2000) emphasized such character qualities as
openness, cooperative spirit and trust. He underlined the importance of these qualities in
the corporate world, where willingness to share information (information symmetry) for
mutual benefit separates successful and unsuccessful companies. Bar-On and Parker
(2000) and Goleman (1995) proposed that character development is the foundation of
democratic societies. This proposition, together with Adam Smith’s proposition about the
association between democracy and human capital emphasizes the importance of
character as a part of human capital.
This chapter utilizes the framework of the moral development theories
(Durkheim, 2002; Kohlberg, 1981; Piaget, 1997; Turiel, 1983), and attempts to build the

109
model of the Character factor. The founders of the theories believed that morality and
character development resulted from social interaction or immersion in a group. Kohlberg
(1981), as well as many other researchers, believed in the importance of experience as a
moral agent within a community. He suggested that full participation of community
members in decision-making significantly enhances individual character development.
Turiel (1983) underlined character development as grounded in universal concerns for
fairness and human welfare. Therefore, people’s consistent actions grounded in the
understanding of these issues provide for gradual development of their character.
Consequently, one way the Character factor is viewed in this study is as one which is
built within a society and the one that manifests itself in social context. Concomitantly,
some researchers (DeVries & Zan, 1994; Kohlberg, 1973) have viewed character
development and morality as also dependent upon personal reflections. During the
process of personal reflection, a readjustment of an individual’s views take place, which
then is manifested in his/her public and private life. Thus, this is the second way the
Character factor may be viewed and is viewed in this study. Overall, this dissertation uses
these two major avenues of character development as two factors of the Character
construct: Character as manifested in public life, and Character as manifested in private
life.
Another important area of assessment is how the environment influences people’s
character and moral decisions. Extensive research on the role of the environment
indicates that a good environment is positively correlated with positive character
qualities, and actually causes them, while bad environment brings out bad traits even in
decent people (Fullan, 2003; Hofstede, 2001; Veenhoven, 1993). Therefore, the third

110
factor –environment where specific population is located—was added to account for the
importance of environmental influences on individual moral decisions and character
development.
Overall, this study suggests that the Character construct can be modeled as a
combination of three factors: character as manifested in the private life of individuals,
character as manifested in public life of individuals and specific environment where the
population is located. Consequently, this study considers these avenues to assess
Character construct.
Character as Manifested in Private Llife
This section examines the issue of how character manifested in private life can be
measured. It suggests a number of indicators that can be used to measure this factor. The
variables that this study suggests as the ones capable of addressing the issue of evaluating
character of citizens in private life stem from the moral theory assumption that private
life is one of the avenues where character is developed and manifested. The variables
suggested are as follows: a measure of trust in a country, suicide rate, prison population
rate, and attitude toward women in a society.
Measure of Trust in a Country
A line of research (Coleman, 1988; Fukuyama, 1995; Glaeser, Laibson,
Scheinkman, & Soutter, 2000; La Porta et al., 1997; Putnam, 1995; Sapford & Abbott,
2006; Sztompka, 1999, 2002) has argued that trust in a nation determines the
performance of the society’s institutions, and consequently, the whole society. It is an

111
essential foundation for the exercise of agency in societies and is essential for the
working of the market economy and democratic political institutions. Although the trust
factor is generally considered as a part of social capital (access to social networks, status),
it has been suggested that it is appropriate to consider it as a part of human capital as well
(Glaeser et al., 2000; Goldin & Katz, 1999). In fact, social capital may be viewed as “a
subcomponent of human capital that reflects an ability to earn returns from social
situations” (Glaeser et al., 2000, p. 841). Furthermore, its presence or absence affects the
degree of utilization of people’s education and skills (Goleman, 1995). Trust may be
defined as “a cognitive state: a feeling of confidence in those around you and/or in things
unseen; the perception of socioeconomic systems and relations as regularities on which
one may depend” (Sapford & Abbott, 2006, p. 60). Trust is cultural, normative, and
deeply embedded in socially shared understandings. Sztompka (2002) calls a breakdown
of social trust and confidence a cultural drama.
Fukuyama (1995) argued that high trust among citizens accounts for the superior
performance of all institutions in a society, including business. This happens because
higher trust between people in a population is associated with greater cooperation (La
Porta et al., 1997, Sapford & Abbott, 2006), which reduces transaction cost in business
and increases return on investments. As La Porta et al. put it (1997), trust is an input in
the production of wealth, and its relationship with economic and social indicators is
statistically significant and quantitatively large. For example, the effect of trust on large
firms’ share of the economy is large: a one standard deviation increase in trust raises that
share by half of a standard deviation. A one standard deviation increase in trust raises the
percentage of high school graduates in a population by one-half SD, and school adequacy

112
by one-third of a standard deviation (La Porta et al., 1997). Trust is not a truly exogenous
variable. It increases with good past performance of a society’s institutions. According to
Putnam (1995), trust is a habit formed historically by horizontal networks of association
between people, covering commercial and civic activities.
As a proxy for this variable, the researcher suggests using an indicator of public
trust in police. This indicator can come from the cross-country data on appeals to police
for help (as measured in annual reported offenses to police per 100,000 of population).
The degree people appeal to police for help indicates their trust in their effectiveness and
trustworthiness. This premise can be supported by comparing the number of reported
appeals to police across countries. For example, in 2000, Switzerland reported 22,500
appeals to police per 100,000 population, while Burkina Faso reported only 700, and
Romania reported only 3,000 (Encyclopedia Britannica, 2006).
Emotional Stability of Citizens
Becker (1964) underlined the importance of emotional stability for the economic
welfare of people. Generally, emotional stability refers to emotional health and social
adaptability and is measured by scales of confidence-anxiety in the broad range of
everyday life circumstances (Lester & Bishop, 2000). The evidence supporting the
importance of emotional stability in determining success at work and private life is
impressive (Badaracco, 1997; Druskat & Wolff, 2001; Goleman, Boyatsis & McKee,
2002). Generally, measurement tools, which aim to assess individuals’ emotional
stability, address such issues as social integration, social adjustment, friendship, social
activity, self-esteem and psychological well-being (Bar-On, Brown, Kirkcaldy, & Thome,

113
2000; Beck, Steer, & Garbin, 1988; Hills & Argyle, 2001; Lester & Bishop, 2000;
Vitterso, 2001). Based on the meaning of these factors, the current study suggests using
the following empirical indicators for evaluation of emotional stability of citizens for
cross-country comparison:
• Suicide rate
• Prison population rate
• Attitude toward women in a society (in the family, at the job)
Character as Manifested in Public Life
This section examines the issue of how character manifested in public life can be
measured, and suggests a number of indicators that can be used to measure this factor.
Goleman (1995) stated that character development is the foundation of democratic
societies. In his famous Fulton Speech, Winston Churchill (1946) announced freedom of
speech, open and free elections and an independent court system as the foundations of
democracy. Since then, these institutions have been considered as the ones that develop
people as agents of democracy. Therefore, the level of development of democratic
institutions in a country and the degree of citizens’ participation in them can serve as a
proxy for the level of character development of people. Social participation in democratic
institutions in a country can serve as a good indicator of this variable, as it has been
suggested that institutions reflect national character and support perpetuation of national
culture. It has also been suggested that economic conditions of a country to some degree
are a function of its socio-cultural customs and institutions (Adelman & Taft-Morris,
1967; Duijker & Frijda, 1960; Harrison, 1992). As Harrison put it, “it is impossible to
answer (economic) questions without examining the impact of culture on human

114
progress—the values and attitudes of a nation, and the institutions that both reflect and
reinforce those values and attitudes” (p.6). Duijker and Frijda (1960) agreed that a
national system of norms and values, general pattern of characteristics specific for a
nation are evident in the nation’s institutions. Hofstede (2001) stated that institutions,
once established, reinforce societal norms and the ecological conditions that led to their
establishment.
To operationalize this variable, the researcher suggests using measures of
people’s participation in organizations and institutions in a country, as well as the
democratic level of these institutions. The following variables are used in the study:
• Eligible voters participating in national elections
• International NGOs membership density
• Independence of Judicial System
• Level of Political Rights
• Level of Civil Liberties
Environment Where Human Capital Is Located/Level of Happiness of Citizens
This section examines the issue of how environment affects HC, and how this
effect can be measured. It suggests a number of indicators that can be used to measure
this factor.
Just as being a part of a certain family affects human capital development of an
individual, being a particular nation (“a super-family”) affects overall HC of a nation.
Belonging to a particular nation, similar to belonging to a particular family, provides an
individual/ citizen with certain experiences, and causes development of particular

115
abilities and attitudes. Classic comparative studies of the cognitive/social development of
children in different countries have shown that the abilities developed depended on the
task. Children become good at things that are important in a society and that they have
occasion to develop and practice often—what Hofstede (2001) referred to as collective
mental software.
One trend in research emphasized the importance of location qualities in terms of
their effect on productivity of people. If there is a mismatch between individual or group
HC resources and the environment where they are located, the economic value of these
resources will not be completely utilized. Becker (1964) noted that higher economic
benefits (as measured in earnings) might be a result of either better abilities or better
social environment. This research trend is based on an assumption that some societal
conditions better correspond to human needs and capacities than others. An international
organization, Freedom House, uses the term “enabling environment” to describe this
phenomenon.
There is an array of literature which concentrates on studying happiness in
societies (Hills & Argyle, 2001; Veenhoven, 1993). Its main emphasis is on the factors
that are perceived to be the ones which contribute to a feeling of psychological well-
being (or happiness) in a population. One of the most influential of these studies is the
study of happiness conducted by Veenhoven (1993). Veenhoven (1993) conducted a
survey-based comparative study of “goodness” of human societies. He differentiated
several criteria that indicated the level of quality of life in a society: their stability over
time, their productivity in goods and services, the degree to which they realize particular
ideas, and their livability. According to Veenhoven, the livability of a society is the

116
degree to which its provisions and requirements fit with the needs and capacities of its
members.
Because of the lack of theory from which to deduct the necessary living
conditions, Veenhoven (1993) used an empirical approach, and came up with two
(output) factors that best indicate such conditions: the indicator of health in a society (as
measured by life expectancy) and the indicator of overall personal satisfaction with life
among people in society (as measured by self-reported measures of life appreciation in
“quality-of-life” surveys). A basic assumption in these studies is that a good fit between
societal provisions and demands and individual needs and capacities results in high
appreciation of life by individuals. A nation can be more or less livable, which is likely to
be manifest in the happiness of its citizens. According to Veenhoven, these two indicators
explain 37% of the variance in happiness.
The choice of this measure comes from the subjective well-being tradition in the
behavioral sciences. Overall, there are three major philosophical approaches to
determining quality of life (Diener & Suh, 1997). The first approach describes
characteristics of the good life as they are dictated by normative ideas (based on a
religious, philosophical or other system). This approach has nothing to do with the
subjective experiences of people. It is based on rational thought of what is good. This
approach is related to the social indicators tradition. The second approach to defining the
good life is based on the satisfaction of preferences, and is based on whether citizens can
obtain the things they desire while being constrained by their limited resources. This is
the economic approach of utility maximization. The third definition of quality of life is in
terms of the experience of individuals. In this approach, there is a strong correlation

117
between an individual’s life satisfaction and feelings of joy and contentment s/he
experiences in life (Campbell, Converse, & Rodgers, 1976).
The input factors toward the level of happiness in a nation have been named as:
the material comfort the economy provides; social equality in the country; freedom
society provides; and access to knowledge (according to the study, they explain 77% of
the variance in average happiness; Veenhoven, p. 79). The author conducted several
external validity tests to establish the validity of survey assessed happiness for measuring
livability of nations. One objection is that happiness cannot be compared across borders
because of inevitable cultural bias in its measurement. Several commonly mentioned
claims of cultural measurement distortion were checked empirically: language,
desirability distortion, response style and familiarity with the concept. None of these
distortions appeared to be involved. Furthermore, subjective well-being measures possess
adequate validity (Diener & Suh, 1997). For example, “temporal stabilities in the range of
0.5 to 0.7 have been found over a period of several years” (p. 205) and response artifacts
appear not to be strong. This suggests that the survey data on average happiness used in
the study (similar to the World Values Survey) provide a good estimate of true happiness
in countries.
The Economist Intelligence Unit (EIU) developed its Quality-of-Life Index
(2005) separately from Veenhoven’s Index. They used multivariate regression analyses
between life-satisfaction surveys and various factors that have been shown to be
associated with life satisfaction in previous studies. According to EIU, nine important
factors (in order of importance) that influence life satisfaction in countries are: health,
material well-being, political stability and security, family life, community life, climate

118
and geography, job security, political freedom and gender equality. The values of the life-
satisfaction scores that are predicted by these nine indicators represent a country’s
quality-of-life index, which is based on objective cross-country determinants.
Diener and Suh (1997) investigated the construction of several types of Quality-
of-Life indicators. They emphasized that subjective well-being is concerned with the
respondents’ own internal judgment of well-being, rather than what policy makers or
academics consider important. Their research also showed strong correlation between
subjective measures of well-being and income, human rights and societal equality
(Diener & Diener, 1995). They agreed with Veenhoven and the EIU that the degree to
which a society fulfills the basic needs of individuals and provides opportunities for them
to achieve their goals, is an important determinant of national subjective well-being
(Diener & Suh, 1997). Income allows for meeting individual needs and aims; human
rights and equity give individuals opportunities to pursue their goals and needs within a
society.
Although social indicators and subjective well-being correlate across societies,
each type of measure yields additional information about quality of life of societies
(Diener & Diener, 1995; Diener & Suh, 1997; Diener, Sandvik, Seidlitz, & Diener,
1993). Subjective well-being and objective quality of life indicators cannot be considered
synonymous. This is attested to by countries that have similar social indicators, but
different understanding of their well-being.
To operationalize this measure, the researcher suggests using the construct for
assessing the degree of happiness in a country that Veenhoven (1993) suggested: material

119
comfort, social equality, freedom, and access to knowledge. The researcher proposes
using the following indicators:
• Expenditure on leisure as percent of the total family consumption
• Population above income poverty rate
• Parliamentary seats held by women
(The measure of access to education is intentionally not used to avoid the problem of
multicolleniarity in the later analysis.)
Conclusion
Overall, the variable of character may be presented as the function of the
following existing measures:
Character as manifested in private life
• Reported police offenses rate
• Suicide rate
• Prison population
• Attitude toward women in a society (in the family, at the job)
Character as manifested in public life
• Eligible voters participating in national elections
• International NGOs membership density
• Independence of Judicial System
• Political Rights
• Civil Liberties
Environment where specific population is located

120
• Expenditure on leisure as percent of the total family consumption
• Population above income poverty rate
• Parliamentary seats held by women
Conclusion
This chapter has reported on examined literature in four directions. The first part
of the chapter reported on the literature related specifically to national HC, covering such
topics as history of the theory of HC, historical and current measurement tools of HC,
and the need to expand these tools. It also suggested several factors as the ones that
affected HC, and therefore, might be added to currently used HC measures. The second
part of the chapter dealt specifically with development of models and measurements of
these newly suggested variables. Models of three variables (national identity awareness,
family background, and character qualities) were created. Creation of these models
utilized applicable theories and empirical research.

121
CHAPTER III
METHODOLOGY
Introduction
The purpose of this dissertation is to construct and validate a more comprehensive
human capital index, which captures more aspects of HC than conventionally used
indices. Such an expanded HC index includes both—tangible and intangible—qualities of
a population in a country. As such, composite index creation methodology must be
employed as an overall framework for achieving this purpose. Therefore, the first section
of the methodology chapter discusses methodology basics for composite index creation.
The next section applies this methodology to the actual creation of EHCI. It includes the
issues of the choice of variables, factor construction and aggregation of factors into the
index. Finally, methods of validation are discussed and their application to the newly
created index is presented.
Methodology of Composite Index Creation
This section addresses theoretical issues of latent composite index creation. It
discusses two types of composite indices and makes a conclusion on the type to which
EHCI belongs. Moreover, it explains the main rules of construction of latent composite
indices, and presents an example of construction of an existing composite index: Human
Development Index (United Nations).

122
Two Kinds of Composite Indices: Formative and Reflective
A sizeable amount of literature exists on the topic of composite index creation
(Adelman & Taft-Morris, 1972; Babbie, 2004; Booysen, 2002; Diamantopoulos &
Winklhofer, 2001; Healy & Cote, 2001; Jarvis, Mackenzie & Podsakoff, 2003; Johnson
& Reynolds, 2005; Kallman, 1997; McGranahan, 1995; Stapleton & Garrod, 2007).
Overall, composite index can be defined as “a synthesis of numerous factors into one
given factor” (Booysen, 2002, p. 118, quoting Sainz, 1989). Composite indices are the
measures arrived at via some empirical aggregation of a number of diverse variables, and
are evaluated according to their content, method of creation, application, focus, clarity,
availability and flexibility. In other words, good composite indices need to be sufficiently
sensitive to differences in measurement constructs, reliable in terms of repeated measures
yielding stable results, and accurate in being free from systematic error (Adelman & Taft-
Morris, 1972).
Two major measurement models, which use multiple indicators to assess latent
constructs, have been developed—the Principal Factor (Reflective) model and the
Composite Latent Variable (Formative) model (Jarvis, Mackenzie, & Podsakoff, 2003).
The main distinction between the two models is in the direction of causality between the
latent variable and its composite measures: it can be either latent variable –> its empirical
measures or empirical measures –> latent variable (Bagozzi, 1981; Fornell & Bookstein,
1982; Jarvis, Mackenzie, & Podsakoff, 2003). Fornell and Bookstein (1982) noted, “the
unobserved constructs can be viewed either as underlying factors or as indices produced
by the observable variables. That is, the observed indicators can be treated as reflective or

123
formative” (p. 441). The major importance of this question lies in the different methods
of reliability and validity testing for both models.
The Principal Factor (Reflective) model is a model where covariation among the
measures is caused by variation in the latent construct. The direction of causality is from
construct to the measures. If the construct changes, the measures will change as well and
therefore are called reflective measures (Bollen & Lennox, 1991; Fornell & Bookstein,
1982). In this model, the latent variable affects its measures, being responsible for their
intercorrelation, and the indicators are manifestations of the construct. Such constructs
meet all criteria of classical reliability testing. For example, internal consistency
reliability is an appropriate standard for evaluating the adequacy of such a measure. An
example of this model can be self-esteem measure, verbal intelligence measure, or quality
of product measure (as someone’s self-esteem increases, all of its measures inevitably
increase as well).
The Composite Latent Variables (Formative) model assumes that changes in the
measures cause changes in the underlying construct (Jarvis, Mackenzie, & Podsakoff,
2003). Consequently, this model is referred to as a causal or formative model and the
measures that construct the model are called formative measures. Diamantopoulos and
Winklhofer (2001) suggested that the origins of the formative perspective can be traced
to the Operational Definition model. According to that model, a concept becomes its
measure. In contrast with the reflective model, the formative model assumes that all
measures have impact on the construct, and the indicators are defining characteristics of
the construct. “That is, the direction of causality flows from the indicators to the latent
construct, and the indicators, as a group, jointly determine the conceptual and empirical

124
meaning of the construct” (Jarvis, Mackenzie, & Podsakoff, 2003, p. 201). Formative
indicators “are observed variables that are assumed to cause a latent variable”
(Diamantopoulos & Winklhofer, 2001). Different from reflective measures, where
observed variables are perceived as reflective (effect) indicators of an underlying
construct of a latent variable, formative index measures view formative indicators as
variables that cause a latent variable, where formative indicators are exogenous measured
variables (Bollen, 1984; Diamantopoulos & Winklhofer, 2001; MacCallum & Browne,
1993). A formative approach characterizes several composite measures, which are widely
used in international economics. Examples include the Human Development Index
(United Nations Development Program), Level of Corruption Index (the World Bank),
Quality-of-Life Index (Economist Intelligence Unit), and others.
Jarvis et al. (2003) suggests the following guidelines to assist in deciding whether
a construct is formative:
• The indicators are viewed as defining characteristics of the construct
• Changes in the indicators are expected to cause changes in the construct
• Changes in the construct are not expected to cause changes in the indicators
• The indicators do not necessarily share a common theme
• Eliminating an indicator may alter the conceptual domain of the construct
• Change in the value of one of the indicators does not necessarily associate
with a change in all other indicators
• The indicators are not expected to have the same antecedents and
consequences

125
• Internal consistency is not implied (indicators are not expected to co-vary with
each other)
Jarvis et al. (2003, p. 205) specified four possible combinations of formative and
effective indicators (Figure 1).
FIGURE 1. Four Possible Combinations of Formative and Effective Indicators

126
Based on this discussion, the new Expanded Human Capital Index (EHCI) is an example
of the Formative model. More specifically, it belongs to Type IV (although some
components represent formative component’s characteristics more strongly than others),
where Components 1-4 are the factors that compose EHCI. They are formed by their
respective empirical measures (Y1, Y2, Y3… Yn). The Second-Order Construct is the
actual final EHCI, which consists of these Components. Bagozzi and Fornell (1982)
specify a Formative model in the following equation:
A=Y1X1 + Y2X2 + …YnXn
where Yn is a parameter reflecting the contribution of Xn to the latent variable A.
Another model, including a disturbance term, can be specified as:
A= Y1X1 + Y2X2 + … YnXn + b
where b characterizes disturbance (Bollen & Lennox, 1991). The difference between
them is that the first equation posits that the construct is a perfect linear combination of
its measures, while the second one adds an error term to the equation.
Distinctive Properties of the Formative Indices
Formative indicators have several distinctive properties. One of their most
essential features is that traditionally used methods of assessing construct reliability and
validity are not appropriate for them (Bollen & Lennox, 1991). Because formative
measures influence—rather than are influenced by—the latent construct, there is no
requirement of correlation between the formative measures. Correlation may or may not
be present. Indeed, it would be entirely consistent for formative indicators to be
completely uncorrelated (Diamantopoulos & Winklhofer, 2001; Jarvis, Mackenzie, &

127
Podsakoff, 2003). The formative indicators may measure and reflect different areas of the
construct, and may capture its different aspects, and different themes. That is why they
are not necessarily interchangeable. Therefore, internal consistency reliability is not an
appropriate standard for evaluating this model, and another way of assessing its reliability
need to be devised. As Bollen and Lennox (1991) put it, “causal indicators are not
invalidated by low internal consistency so to assess validity we need to examine other
variables that are effects of the latent construct” (p. 312).
The second distinctive property of formative indicators is the possible serious
consequence of a mis-specified model (omitting an indicator or adding a wrong one).
While reflective indicators are not affected by removing or adding an item, with
formative indicators, “omitting an indicator is omitting a part of the construct” (Bollen &
Lennox, 1991, p. 308). Therefore, for formative indicator models, following the standard
scale development procedures of eliminating items with low correlation with other items
may remove precisely those items that would alter the empirical meaning of the
composite latent construct. This is another reason why classical measures of internal
consistency reliability cannot be used here.
The third property is that unlike reflective indicators, error variance in formative
indicators is represented only in the disturbance term, b, which is not correlated with
variables (xs). This means that covariance between them is 0:
cov [Xi, b] = 0
These characteristics are important issues to consider for successful index creation.

128
Methodology of Creation of Formative Indices
Methodology of composite index creation involves four general flexible steps:
selection of variables, weighting/scaling, aggregation, and validation (Babbie, 2004;
Booysen, 2002; Johnson & Reynolds, 2005; McGranahan, 1972, 1995). The following
subsections discuss each of these steps individually.
Selection of Variables
Three issues are important in selecting variables: 1) content specification of the
latent variable that needs to be assessed via observed indicators; 2) specification of the
measures that correspond to this content, and therefore may be used to valuate it; 3)
empirical indicators (proxies) for each of these specified measures (Booysen, 2002). The
first step of the process is specification of the overall content the index as a whole is
intended to capture. Diamantopoulos and Winklhofer (2001) stressed the fact that failure
to consider all content sides of the construct may lead to exclusion of relevant aspects
(which will negatively affect the whole measure). Therefore, a thorough review of
literature is very important at this step. It allows for illuminating all sides of the complex
multidimensional construct.
Referring to the second step, Bollen and Lennox (1991) suggested that a census of
indicators is required for formative measures. More specifically, factors that comprise a
formative index must cover all aspects of the specified index according to its content
specification. This means that indicators need to be selected to capture the entire scope of
the measure. Such selection is generally based on theory, empirical analysis, intuitive
appeal, or some combination of them (Adelman & Taft-Morris, 1972; Diener & Suh,

129
1997). Diamantopoulos and Winklhofer (2001) noted that an extensive review of
literature becomes especially important at this step as well. Searching for empirical
proxies for all of these measures comprises step 3. Such proxies need to reasonably
correspond with the specified measures.
After the initial process of collecting applicable proxies has been completed, both
bivariate and multivariate statistical techniques can be employed to choose the best-fit
proxies out of a bigger number of potentially applicable ones. Bivariate analysis
measures the strength of association between all pairs of variables, and multivariate
analysis measures the ability of any collection of variables to measure any other variable
(Booysen, 2002). Factor analysis (FA) is one of the most widely used methods in
multivariate analysis (Field, 2006; Kallmann, 1997). Pedhazur and Schmelkin (1991)
cited factor analysis as the most useful and valuable tool to study the internal structure of
a set of items. According to them, factor analysis is:
a family of analytical techniques designed to identify factors, or dimensions, that underlie the relations among a set of observed variables…that are the indicators presumed to reflect the construct (p. 66).
Two major types of FA exist: confirmatory and exploratory. Confirmatory factor analysis
(CFA) differs from exploratory factor analysis (EFA) in that EFA seeks to uncover the
underlying structure of a large set of variables with no a priori theory, while CFA allows
researchers to test a hypothesis about a structure of latent variables based on well-
established theory. In other words, EFA is generally thought of as more of a theory-
generating procedure, while CFA is a theory-testing procedure. In CFA, indicator
variables are selected based on theory and the method is used to see if they load as
predicted on the expected factor (Pedhazur & Schmelkin, 1991).

130
Weighting/Scaling of Factors
Scaling means “ordering of things in some meaningful way” with a purpose of
pointing out the relationships among them (Booysen 2002). Weighting is the process of
assigning weights according to the relative importance of each of the components for the
whole construct. There is an option of scaling/not scaling and weighting/not weighting
the factors, and many efforts in composite index construction have employed non-
modified variables in their original form. Although Booysen (2002) suggested scaling,
seven out of twenty composite indices that he studied did not use scaling. Weights may
be assigned to the components in order to reflect the relative importance of each indicator
(Stapleton & Garrod, 2007). A group of researchers (Babbie, 2004; Johnson & Reynolds,
2005; Stapleton & Garrod, 2007) suggested that equal weighting should be the norm.
They base their argument on the fact that different weighting systems imply different
results and are inevitably subjective. Other researchers routinely assign weights
according to the factor analysis extraction sums of squared loadings (Booysen, 2002;
Diener & Suh, 1997; Field, 2005), or based on an expert’s professional (although
subjective) opinion. For example, experts may be asked to assign a total of 100 points
between all index components (Booysen, 2002), after which each component is weighted
with the average percentage points it scored in the expert survey.
Weights may also be based on the researcher’s perceptions. For example,
Harbison and Myers (1964) created their Human Resource Development Index (HRDI),
assigning heavier weights to tertiary education than to secondary education, under the
belief that tertiary education was more important than secondary education when

131
explaining differences between countries in the quality of their human capital. They
multiplied the tertiary enrollment rate by five, and then added it to the secondary
enrollment rate to obtain their index. Weights also can be assigned according to a policy
maker’s purposes of stressing some variables due to implementation of specific policies.
Out of twenty composite indices studied in Booysen (2002), four used principal
component analysis’ or correlation coefficients’ weighting, thirteen used equal averages,
and five used experts’ opinions and mixed approach.
Aggregation of Variables
In the area of composite index construction, aggregation of components is always
a potential area of methodological controversy. Aggregation of components into a
composite score tends to be either additive or functional in nature. Additive aggregation
entails the mere addition of component scores (Field, 2005), while functional aggregation
is based on the estimated functional relationships between variables (Adelman & Taft-
Morris, 1972), which many researchers perceive to be empirically biased in terms of
being wholly dependent on the number of observations and the selected variables
(Booysen, 2002). Out of twenty indices studied by Booysen (2002), sixteen were created
by additive aggregative format, and four by functional format.
Booysen (2002) advised that ideally, composite indices need to be relatively
simple in their construction and interpretation, with the choice of weighting and
aggregation method depending on the purpose of a study. Studies whose purpose is
exploring theoretical concepts of indexing should generally utilize complex techniques.
At the same time, studies aiming to present an informative view tend to use simpler

132
methods and be easier for understanding. The purpose of developmental indicators is
usually presenting broad information for policy makers and the general public, therefore,
they tend to utilize less complicated approach of variables’ aggregation.
For example, Human Development Index (HDI) is a simple average of three sub-
indices: life expectancy index, education index, and GDP index (Human Development
Report, 2007-2008):
HDI = 1/3 (life expectancy index) + 1/3 (education index) + 1/3 (GDP index)
where indices are calculated out of the raw data according to the general formula of a
dimension index:
Dimension Index = the actual value - Min value Max value - Min value
Consequently, the Life Expectancy Index (LEI) is calculated as follows:
LEI = Life expectancy in years - Min expectancy Max expectancy - Min expectancy
The GDP Index is calculated as follows:
GDP Index = Log (GDP per capita) - Log (Min Goalpost) Log (Max Goalpost) - Log (Min Goalpost)
The Education Index (EI) is calculated as follows:
EI = 2/3 (% of adult literacy) + 1/3 (% of gross enrollment)
Validation of the Composite Index
As mentioned previously, the nature of formative indicators renders classical
internal consistency tests (for example, Cronbach’s a) inappropriate. Therefore, other
methods of validation should be used. A widely used approach (Diamantopoulos &
Winklhofer, 2001; Jarvis et al., 2003) is utilization of reflective indicators (the ones that

133
represent effects of the construct) as a validity test. External validation includes
evaluation of the relationship between the index and the outside variables that should
theoretically correlate. Two types of external validation exist: external concurrent
validation (assessing correspondence with indicators of another kind) (Diamantopoulos &
Winklhofer, 2001; Jarvis et al., 2003) and external congruent validation (assessing
correspondence with other indicators in the same class) (Hauser & Goldberger, 1971;
Jöreskog & Goldberger, 1975). It has been suggested that inclusion of reflective
indicators (the ones that represent effects of the construct) in the model and estimation of
the relationship between them and the construct not only serves as a validity test
(concurrent validation), but allows for assessing the contribution and significance of the
individual indicators of the index in terms of their relationship with the reflective
indicator. In its turn, external congruent validity is based on the assumption that if the
index really measures a phenomenon, it should correlate with other indicators of this
phenomenon (Babbie, 2004).
Summary
This section contained a brief discussion of the methodology of composite index
construction. It described two kinds of composite indices—formative and reflective—and
suggested that the EHCI Index is a formative index, based on the definitions of these two
kinds of indices. Consequently, it is subject to the rules governing operations with
formative indicators.

134
Application of the Methodology of Composite Index Creation to the Expanded
Human Capital Index
This section builds on the information on methodology of composite index
creation presented above to create an EHCI. It includes a discussion of procedures used
for data collection as pertaining to the EHCI, description of the data, explanation of
techniques used for aggregation of data and creation of the expanded index, and methods
utilized for validation of the new index.
Data Collection Procedures
The data used in the study spans 6 calendar years (2000-2005) and was available
for most of the163 countries of the specified population of all countries with 100,000
citizens or more. Overall, 30 variables were identified for the subsequent study. The data
were cross-sectional time series data publicly available on websites of United States
Agency for International Development (USAID), United Nations (UN), World Bank,
Organization for Economic Cooperation and Development (OECD), International Labor
Organization (ILO), World Health Organization (WHO), and Encyclopedia Britannica, as
well as statistical offices of individual countries. The rules followed in the process of data
collection were as follows:
• If several sources of data were available for the same country, with some
divergence in the actual data, the source with the most disaggregated data (i.e.
the greatest number of reported factors) and the most recent date was used.

135
• Interpolation was used for missing data (within an observation). Wherever
interpolation was not applicable, the missing values were considered equal to
the most recent available data.
• Wherever data on a country was not available even after the researcher
invested significant efforts to find it, regional averages were used.
• Overall, missing data for each of the suggested 30 variables (for 163
countries) did not exceed the conventionally accepted 20 percent boundary,
with most variables having significantly less than 20 percent of missing data.
• All scores smaller or bigger than 3 standard deviations were omitted in order
to have a normal distribution of data.
For the purpose of comparability of data across countries within each indicator,
most initial (raw) variables were standardized by turning them into percentages, rates, or
scores if they were not collected in one of these forms. More specifically, the raw data on
the number of Nobel Prize laureates in every country was turned into Nobel Prize
laureates in a country as a percent of the total number of laureates in the world; the raw
data on the number of Olympic medals won by every country was turned into Olympic
medals won by a country as a percent of the total number of medals won by all countries
during a specified period. Several variables (school life expectancy in years, number of
holidays that a country celebrates, average number of children in a household, and
average number of occupants per a household) were kept in their original form because of
inappropriateness of their standardization.
For all individual variables to be consistent in their measurement with the original
UNHC index (which measure increases with the increase of availability of a measured

136
product), the scoring for some variables have been reversed (Field, 2006). For example,
Level of political rights and civil liberties was originally measured by Transparency
International on a scale of 7-1 (with 7 representing the min of rights and liberties and 1
representing maximum of available rights and liberties). For this measure to be consistent
with other measures (for example, Enrollment rate is measured on continuum 0-1, with 0
representing min of enrollment and 1 representing max of enrollment), the Level of
political rights and civil liberties variable was reversed so that 7 represents max of rights
and liberties and 1 represents min of rights and liberties.
The variables collected and examined initially included:
• Ethnic cohesion measure
• Linguistic cohesion measure
• Religious cohesion measure
• Level of total central government consumption minus military expenditure as
percent of GDP
• Corruption Perception Index
• Gini Coefficient
• Length of a country’s Independence (in years)
• Government Effectiveness indicator
• Voice and Accountability indicator
• Nobel Prize laureates in a country (1901-2005) as percent of the total number
of Nobel Prize laureates in the world (1901-2005)
• Olympic medals won by a country (1998-2005) as percent of the total number
of Olympic medals won by all countries (1998-2005)

137
• School life expectancy (in years)
• Number of national holidays that a country celebrates
• Reported police offenses rate
• Election participation rate
• Independence of Judicial System measure
• Percent of people in a country who are not in prison (reverse of prison
population rate)
• Percent of deaths in a country as calculated without suicide mortality (reverse
of suicide rate measure)
• Expenditure on leisure as percent of the total family consumption
• Population above income poverty line
• Parliamentary seats held by women
• Political Rights measure
• Civil Liberties measure
• Attitude toward women in a society (in the family, at the job)
• Average number of children in a household
• Average family size (number of occupants per a household)
• Urban population distribution
• Divorce rate
• Existence of at least one social security program oriented toward supporting
families
• International NGOs membership density

138
This subsection provides information on the data used in the study. Following is
brief description of every variable with its definition, calculation and the data sources.
Data Description
The data listed above form the basis for the operationalization of the formative
multidimensional indicators examined in this research. This section presents an overview
of every participating variable. Their definitions, calculations, and sources are described
in Tables 2-28.
Table 2 presents information on the variable on Ethnic/Linguistic/Religious
Cohesion in a Country.
Table 2. Ethnic/Linguistic/Religious Cohesion in a Country
Definition
Calculation Source
Ethnic/Linguistic/Religious cohesion variables measure probability that two randomly selected individuals from a population belong to the same ethnic/linguistic/religious group. (Alesina et al., 2003)
These variables are constructed based on group fractionalization approach. Group fractionalization measures probability that two randomly selected individuals from the population belong to two different groups (Elesina et al., 2003, p 156). Consequently, ethnic/linguistic/religious fractionalization measures probability that two randomly selected individuals from a population belong to two different ethnic/linguistic/religious groups. The measure of cohesion was calculated as one minus Fractionalization Index. Group Fractionalization Index is generally computed as one minus the Herfindahl index of market concentration and can be interpreted as one minus a weighted sum of population shares, where the weights are these shares themselves (Bossert, D’Ambrosion, LaFerrara, 2006). Mathematically, it can be presented in the following way: FRACTIONALIZATION (i) = 1—Σ (S (ij)²) Where S (ij) is the share of group (i) in the population, (i = 1…N) in a country j.
Mainly, Encyclopedia Britannica (EB) Book of the Year (2000-2006) was used to calculate the fractionalization index, and ultimately, the measure of cohesion. Encyclopedia Britannica provides raw data on language, ethnic and religious groups in each country (measured in thousands or millions). Percentage share of each group was calculated based on this data and the total country population, which is also available in EB. However, since EB does not have data for all countries, it was necessary to compliment that data with additional resources. Alesina et al.’s (2003) study showed close correlation between fractionalization measures calculated based on CIA World Factbook data and Encyclopedia Britannica census data (p. 159). Researchers explained it by the fact that both publications use similar country data source. Therefore, in this dissertation, both sources to calculate fractionalization measures (with EB being the primary source) were used. World data sections in EBs which were used are as follows: Neher (2004, 2005, 2006); Neher, PeBenito, & Sturgis (2000, 2001, 2002).

139
Table 2. Continued
Definition
Calculation Source
According to the researcher’s knowledge current (2000-2007) measures of fractionalization for the required 163 countries do not exist. Furthermore, the majority of studies that employ measures of fractionalization still use fractionalization indices based on the 1960 Soviet Atlas Narodov Mira (Atlas of the World People) (Alesina et al., 2003). The most recent study which provides more up-to-date fractionalization indices for 190 countries (Alesina et al., 2003) used different dates for different countries. Some countries have their indices calculated for as late as 2001, while others have them for only 1979, with the majority of countries’ indices dating 1980s-1990s. Group shares stability and time persistence (at the 30-year horizon) was the assumption that underlay using such time-divergent data (Alesina, 2003; Fearon, 2003). At the same time, it seems that the issue of endogeneity (change in the index through time) may be a problem in such assumption. The whole period of 1990s witnessed tremendous change in countries’ populations caused largely by the collapse of the Soviet block and consequent heavy migration. Consequently, population structures in place in late 1980s-early 1990s cannot be used as proxies for the 2000s structure. Therefore, there was a need to recalculate the indices for the 163 countries examined in this study for the period of 2002-2005.
Ethnic and linguistic differences were previously lumped together as part of an “ethnolinguistic” fractionalization variable, however it was suggested that ethnic and linguistic fractionalizations need to be used separately as they measure different forms of distinctions (Easterly & Levine, 1997).
Data Limitations
The potential limitation in development of this measure (which may cause some
measurement error) is that data on ethnic differences is fraught with conceptual problems,
such as the definition of physiological characteristics that distinguish races (Alesina et al.,
2003). Furthermore, the definition of ethnicity involves a combination of racial and
linguistic characteristics. That is why ethnic percentage country data (which may reflect
both racial and language distinctions) may be different from percentage country data on
linguistic distinction. These classifications are based on anthropologists’ and
ethnologists’ classifications, which are not defined precisely, even on an academic level.

140
Therefore, to minimize potential error, this study used the exact published data classified
as “ethnicities in the country,” “religions in the country,” and “languages in the country.”
Table 3 presents information on the variable of theLevel of Total Central
Government Consumption Minus Military Expenditure as Percent of GDP.
Table 3. Level of Total Central Government Consumption Minus Military
Expenditure as Percent of GDP
Definition
Calculation Sources
Central Government consumption refers to Central Government expenditure in terms of its size relative to a national economy. It includes cash payments for operating activities of the government in providing goods and services, such as compensation of employees (in the form of wages and salaries), interest and subsidies, grants, social benefits, and other expenses such as rent and dividends (World Bank 2006, p. 233).
Level of total Central Government consumption minus military expenditure as percent of GDP was calculated as a simple subtraction between total government consumption as percent of GDP and its military expenditure as percent of GDP.
o World Development Indicators (World Bank, 2004, 2005, 2006, 2007)
o Government Finance Statistics
Yearbooks (IMF, 2002, 2003, 2004, 2005)
o CIA World Factbook (CIA, 2000-20006)
o Human Development Reports
(UN, 2002, 2004, 2006)
o UNESCAP Statistics Division
(UN, Countries of the East Region section, 2000-2006)
o UNECLAC (UN, Latin America
and the Caribbean section, 2000-2006)
Limitations of the Data
A limitation with the use of this variable is the different financial data reported by
different sources, or from the same sources across time. Before 2005, the World Bank
reported data derived on the basis of the 1986 International Monetary Fund (IMF)
Manual. In 2005, World Bank started using the 2001 IMF manual. The 2001 Manual

141
does not distinguish between current and capital expenditure, unlike the 1986 Manual
(which means that since 2005 they do not distinguish between them). This means that
until the 2001 Manual, expenditures were reported altogether (current + capital outlays).
Most countries still follow the previous manual however. Because of this, in order to
minimize potential error, this study used only one source for the variable (and did not use
several sources to put together a measure for a particular country).
Table 4 gives information about Corruption Perception Index variable.
Table 4. Corruption Perception Index
Definition
Calculation Sources
Corruption Perception Index relates to perceptions of the degree of corruption as seen by business people, academics, risk analysts, non residents and residents (Transparency International, 2000). It measures the overall extent of corruption (frequency and/or size of bribes) in the public and political sectors (http://www.transparency.org/ ).
This index is calculated using survey data from 14 sources originating from 12 independent institutions, and is measured by the frequency and/or size of bribes in the public and political sectors. An essential condition for inclusion is that the source must provide a ranking of nations on the overall extent of corruption. In other words, each of these sources surveyed different groups of people on their perception of the extent of corruption in a country using different survey questions. Afterwards, an average of the mean values of all sources is determined, which becomes the Transparency International index. Originally, the Index ranges between 10 (highly clean of corruption) and 0 (highly corrupted) countries. In order to make this measure consistent with the other measures and to measure the degree a society is free of corruption, the researcher reversed the score. The results obtained are as follows: 0=min corruption /// 9= max corruption
o This Index is created by Transparency International:
http://www.transparency.org/

142
Table 5 describes definition, calculations, and sources of Gini Coefficient
variable.
Table 5. Gini Coefficient
Definition
Calculation Sources
Gini Coefficient is a measure of income inequality (inequality in a country’s wealth distribution) defined as the area between the Lorenz curve and the perfect equality line divided by the total area underneath the perfect equality line. The range of this index is 0 (perfect equality)—1 (perfect inequality).
In this study, Gini Coefficient was used in its original form without any changes.
o Human Development Report (2006, 2005, 2004, 2002)
o World Development Indicators
(2007, 2006, 2005, 2004, 2000)
o CIA World Factbook (2004,
2005, 2006)
o ECLAC (Economic Commission for Latin America and the Caribbean) statistical database: http://www.eclac.org/
o ESCAP (Economic and Social
Commission for Asia and the Pacific) statistical database: http://www.unescap.org/
o ESCWA (Economic and Social
Commission for Western Asia): http://www.escwa.un.org/
o UNECE (UN Economic
Commission for Europe): http://www.unece.org/
o World Income Inequality
Database: www.wider.unu.edu

143
Table 6 presents information about Length of Countries’ Independence variable.
Table 6. Length of Countries’ Independence (in years)
Definition Calculation Sources
The date of independence refers to the date “when the country, within its present borders, attained full sovereignty over both its internal and external affairs” (Encyclopedia Britannica, 2004, p. 740)
Length of countries’ independence is calculated as the period from their respective years of independence until each year of the 2000-2005 period
o Encyclopedia Britannica, 2000-2006 (Government and International Organizations sections)
Table 7 describes definition, information, and sources for the Government
Effectiveness Indicators variable.
Table 7. Government Effectiveness Indicators
Definition
Calculation Sources
Government Effectiveness measures the quality of public services, the quality of the civil service and the quality of policy formulation and implementation (Kaufmann, Kraay, Mastruzzi, 2007).
The indicator is constructed using an unobserved components methodology. It relies on a large number of individual data sources that provide information on perceptions of governance of a wide range of stakeholders. These data sources consist of surveys of firms and individuals, assessments of commercial risk agencies, NGOs and international aid agencies (http://info.worldbank.org/governance/wgi2007/). These data sources reflect the perceptions of a diverse group of respondents. The indicator is measured in units ranging from -2.5 to 2.5 with higher values corresponding to better governance outcomes. The units in which governance is measured follow a normal distribution with a mean of zero and a standard deviation of one in each period. For calculation purposes of this study, 2.5 was added to each value to eliminate negative values.
o The “Governance Indicators” developed by the World Bank for 1996-2006:
http://info.worldbank.org

144
Table 8 presents information about Voice and Accountability Measure variable.
Table 8. Voice and Accountability Measure
Definition Calculation Sources
Voice and Accountability measures the extent to which a country’s citizens are able to participate in selecting their government, as well as freedom of expression, association and free media (Kaufmann, Kraay, Mastruzzi, 2007).
The indicator is constructed using an unobserved components methodology. The indicator is measured in units ranging from -2.5 to 2.5 with higher values corresponding to better governance outcomes. The units in which governance is measured follow a normal distribution with a mean of zero and a standard deviation of one in each period. For calculation purposes of this study, 2.5 was added to each value to eliminate negative values.
o The “Governance Indicators” developed by the World Bank for 1996-2006:
http://info.worldbank.org
Information about Nobel Prize Laureats in a Country variable can be obtained in
Table 9.
Table 9. Nobel Prize Laureates in a Country (1901-2005) as a Percent of the Total
Number of Nobel Prize Laureates in the World
Definition Calculation Sources
Nobel Prize laureate is an individual who won a Nobel Prize. The Nobel Prize is an award for outstanding contributions in physics, chemistry, medicine, literature, economics, and for the promotion of peace, given by the Nobel Foundation established in 1900 in the will of Alfred Nobel (http://nobelprize.org).
As the first step, the number of NP laureates (individuals and organizations) in every country beginning with 1901—the first year when NP was awarded—until 2005 was calculated. The next step included calculating the percentage of the awards won by every country in relation to the total number of Nobel Prize awards won by all countries during the period of 1901 until each year of the examined period of 2000-2005. By 2000 (including 2000), 712 awards were given: 695 individuals and 17 international organizations. By 2005 (including 2005), 776 awards were given: 757 individuals and 19 international organizations.
o Official website of the Nobel Prize:
http://nobelprize.org

145
Limitations of the Data Utilized for the Variable
Some laureates are listed as representing more than one country. Some laureates
were born in one country, but moved to another one (mostly USA), where they worked.
They are listed according to the later country on the website. The reason for this is that
generally it is the country where they work that gets the majority of recognition, not the
country where they were born (and which they may have had to leave because conditions
there were not conducive for their work).
Table 10 provides information on the number of Olympic Medals.
Table 10. Number of Olympic Medals Won by a Country (1998-2005) as a Percent
of the Total Number of Olympic Medals Won by All Countries (1998-2005)
Definition
Calculation Sources
Silver, bronze, and gold medals won in Winter and Summer Olympic Games. The Olympic Games is an international multi-sport event subdivided into summer and winter sporting events (http://www.olympic.org).
The 1998-2005 period, with 1998 as the beginning year of the period, was chosen because 1998 was the first year when the former USSR countries started presenting themselves individually. As the first step, the number of medals won by every country during the specified period was calculated. The next step included calculating the percentage of medals won by every country in relation to the total number of medals won by all countries during the specified period.
o The official site of the International Olympic Committee:
http://www.olympic.org

146
Table 11 provides information on the variable of Schools Life Expectancy.
Table 11. School Life Expectancy in Years
Definition
Calculation Sources
School life expectancy is the total number of years of schooling which a child can expect to receive, assuming that the probability of his or her being enrolled in school at any particular future age is equal to the current enrolment ratio at that age (UN, Statistics Division)
This measure is available only for one year per country (out of the 2000-2005 examined period). Because this measure cannot drastically change within such a short period, this study used the value for one year as the proxy for the rest of the years in the 2000-2005 examined period.
o United Nations Statistics Division—Demographic and Social Statistics:
http://unstats.un.org/unsd/demographic/products/socind/education.htm
Information about definition, calculations, and sources of Number of National
Holidays that a Country Celebrates variable can be obtained in Table 12. Dickey &
Runchock (2001), Gall (2004), and Gall & Hobby (2007) publication were the major
sources for this variable.
Table 12. Number of National Holidays That a Country Celebrates
Definition
Calculation Sources
The total number of all celebrated national holidays as listed by the Worldmark Encyclopedia of the Nations (2001, 2004, 2007)
The total number of all celebrated national holidays as listed by the Worldmark Encyclopedia of the Nations (2001)
o Worldmark Encyclopedia of the Nations, 2001, 2004, 2007

147
Table 13 provides information on the Reported Police Offenses Rate variable.
Table 13. Reported Police Offenses Rate
Definition Calculation Sources
Offenses reported to the police is the number of total reports (excluding minor traffic violations), not the number of offenders apprehended or tried in courts (EB, 2004, p.842). It is measured per 100,000 population in a country.
In this study, this measure was used as reported in Encyclopedia Britannica in its original form without any changes.
o Encyclopedia Britannica (2000-2006),
“Social Protection” section.
Table 14 provides information on Election Participation Rate variable.
Table 14. Elections Participation Rate
Definition
Calculation Sources
This measure is generally accepted as a measure of citizens’ participation in politics. In this study, it is expressed as the percentage of voters who participated in casting a vote in elections (Legislative or Presidential) in relation to those voters who were of eligible age to do so.
Elections (Legislative or Presidential) participation rate was calculated as the relation of the number of people who voted in the elections (reported as raw data) to the number of citizens over the age of 20 years old (reported as raw data). If a country underwent both—Presidential and Legislative elections in the same year, this study used an average of both elections to form one score per year.
o International Institute for Democracy and Electoral Assistance (IDEA):
http://www.idea.int/
o United Nations Statistics Division:
http://unstats.un.org/
Limitations of the Data Utilized for the Elections Participation Rate Variable
There are several factors that introduce potential error into the calculation of this
variable. Although the use of voting-age population as relative to actual voters allows for
more precise evaluation of political activity of the population than the use of the number

148
of registered voters as relative to the number of actual voters, this approach has several
weaknesses. One of its weaknesses is that the voting-age population measure is not able
to exclude those within the population who may not be eligible for voting due to legal or
systematic barriers (factors such as mental competence or imprisonment.) Furthermore,
although most of the countries in the world have 18 years old as the suffrage age, 20
countries deviate from this age across a period of 16-21 years old (Rose, 2000). For
example, voting age in Austria, Cuba, and Nicaragua is 16; voting age in Indonesia,
North Korea, and Sudan is 17; voting age in Cameroon, Japan, and Tunisia is 20. At the
same time, standard age distribution statistics are reported in periods of 0-19 years of age
and 20+ years of age (United Nations Statistics Division). Following the International
Encyclopedia of Elections (2000), this study used 20+ age as the voting age, although
with understanding that this will inevitably introduce some error into calculations.
Another data limitation is in the fact that in spite of the 1979 United Nations
General Assembly’s resolution emphasizing the importance of equal participation of
women and men in public life, laws restricting women’s right to vote still persist in
several countries: Kuwait, Qatar, Saudi Arabia, Oman, United Arab Emirates. This fact
needs to be taken into consideration in order to achieve very precise estimates of voting
participation rates. One more way error may be introduced into calculations is through
difficulty to precisely assess consequences for voting participation in the countries which
have compulsory voting system. This system may artificially skew the elections
participation results in favor of showing high political activity of the population. Overall,
there are 25 countries in the world with laws which provide for compulsory voting. At the
same time, this requirement is not strictly enforced in many countries (IDEA).

149
The variable of Independence of Judicial System is described in Table 15. Bonk
(2000), as well as Worldmark Encyclopedia of the Nations (2004, 2007) were used as the
sources for this variable.
Table 15. Independence of Judicial System
Definition
Calculation Sources
Ability of the Judicial System to make decisions independently from the Government
Based on the description of countries provided in the volumes of the Worldmark Encyclopedia of the Nations, the countries were grouped according to the following characteristics: 0 = Not independent from the Government 1 = Partly independent from the Government 2 = Independent from the Government
o Worldmark Encyclopedia of the Nations ( 2004, 2007)
o Worldmark Yearbook 2000
Table 16 reports on definition, calculation, and sources for the reverse of Prison
Population Rate variable.
Table 16. Percent of People in a Country Who Are Not in Prison (Reverse of Prison Population Rate)
Definition Calculation Sources
In this study, this is the measure of percent of people in a country who are not incarcerated (Human Development Reports 2000-2006). Prison population is the number of incarcerated people in a country as measured by the number of people in prison per 100,000 of population (Human Development Reports 2000-2006). Percent of people who are not in the prison is the total number of people in the country (100%) minus the percent of people who are incarcerated.
Prison population rate is the number of incarcerated people per 100,000 of citizens in a country (Human Development Reports). Dividing the total country population by 100,000 and multiplying it by prison population rate produces the total number of people in prison in a particular country. Dividing this number by the total country population and multiplying it by 100% produces the measure of percent of people in a country who are in prison. Subtracting this number from 100% produces the measure of percent of people in the country who are not in prison.
o Human Development Reports (2000-2006)
o International Center for Prison
Studies: www.prisonstudies.org

150
Information about reversed variable of Suicide Rate Measure is presented in
Table 17.
Table 17. Percent of Deaths in a Country as Calculated without Suicide Mortality
(Reverse of Suicide Rate Measure)
Definition Calculation
Sources
Suicide is a conscious act of terminating ones’ own life. Suicide rate is measured as the number of suicide deaths per 100,000 of population (World Health Organization, 2000-2007). The inverse of this measure is the annual number of deaths in a country minus the number of deaths caused by suicide.
Suicide rate is measured as the number of suicide deaths per 100,000 of population (World Health Organization, 2000-2007). Dividing the total country population by 100,000 and multiplying it by the suicide rate produces the total number of deaths caused by suicide in a particular country in a particular year. Dividing this number by the total country population and multiplying it by 100% produces the measure of percent of deaths in a country caused by suicide in a particular year. Subtracting this number from 100% produces the measure of percent of deaths in a country without deaths caused by suicide (in a particular year).
o World Health Organization (WHO): http://www.who.int/mental_health/prevention/suicide/country_reports/
o World Health Organization, Department of Measurement and Health Information:
http://www.who.int/healthinfo/statistics/bodgbddeathdalyestimates.xls
o Statistical Yearbook for Asia and the Pacific (2003)
o Ruzicka, L. (1998). Suicide in countries and areas of the
ESCAP region. Asia-Pacific Population Journal, 13(4).
o Darnay, B. (Ed.) (1997). Gale country and world rankings
reporter. Detroit: Gale Research.
Description of the Data Limitations
Generally, cross-country data on suicide rates needs to be used with caution.
Limited data are available documenting suicide rates in Africa and the Middle East. Even
in countries where cause-of-death data is collected systematically, societal attitude
toward suicide may impact the recorded figures. Furthermore, in highly corrupt countries
suicide cause-of-death may be used as a cover-up for criminal causes of death

151
(information retrieved from the World Health Organization’s website on November 12,
2007: http://www.who.int/ ).
The variable of Expenditure on leisure as Percent of the Total Family
Consumption is described in Table 18.
Table 18. Expenditure on Leisure as Percent of the Total Family Consumption
Definition
Calculation Sources
Leisure and recreation expenditure is defined as consumption expenditure on cultural activities other than education (Encyclopedia Britannica, 2004, p. 831; International Labor Organization: http://laborsta.ilo.org/). It is measured as percent of household income. Household (an economic unit and the primary basis of analysis) can be as small as a single person and as large as an extended family (Encyclopedia Britannica, 2004, p. 830). Household income consists of “all receipts whether monetary or in kind (goods and services) that are received by households and their individual members at annual or more frequent intervals. These receipts are available for current consumption and do not reduce net worth of the household through reduction of its cash, disposal of its other financial or non-financial assets or an increase in its liabilities” (http://laborsta.ilo.org/)
Several sources (Encyclopedia Britannica and United Nations Statistics Division) report data on percent of household income used on leisure and recreation, which may be directly utilized. For the missing data, the following sources were used: International Marketing Data and Statistics and European Marketing Data and Statistics. They provide data on total expenditure on leisure and recreation per country. Dividing that measure by the total number of households in a country (Encyclopedia Britannica, 2000-2006, Vital Statistics, Marriage and Family section) provides the measure of leisure and recreation expenditure per household. International Labor Organization (ILO) Bureau of Statistics provides data on average monthly household income, which is available on LABORSTA on-line database (http://laborsta.ilo.org/) for selected countries. Finding the relationship between the measure of leisure and recreation expenditure per household and average household income and multiplying it by 100% provides this study with the measure of family income used for leisure and recreation
o International Labor Organization (ILO) Bureau of Statistics, LABORSTA on-line database: http://laborsta.ilo.org/
o Encyclopedia Britannica Book of the Year (1999-2006)
o United Nations Statistics Division Common Database:
http://unstats.un.org/unsd/cdb/cdb_advanced_data_extract.asp?srID=30256
o International Marketing Data and Statistics, 2006 (Euromonitor International) o European Marketing Data and Statistics, 2005
(Euromonitor International)

152
Population above Income Poverty Line variable is described in Table 19.
Table 19. Population above Income Poverty Line
Definition
Calculation Sources
Income poverty line is defined as national poverty line for developing countries, and as 50 percent of median income as specified on OECD level (Human Development Reports, 2000-2006).
Percent of population below income poverty line measure available through Human Development Reports (UN) was utilized. Percent of population above income poverty line was calculated as 100% of total population minus percent of population below income poverty line.
o Human Development Reports, 1999-2007 (UN).
Tables 20-22 present information on national liberties, such as political rights and
civil liberties, and rights and liberties that women injoy.
Table 20. Parliamentary Seats Held by Women
Definition
Calculation Sources
Seats in Parliament held by women measure refers to seats held by women in a lower or single house or an upper house or senate, where relevant (Human Development Report, 2005, p. 360). This measure is reported as percent of total Parliamentary seats.
In this study, this measure was used as reported in Human Development Reports (2000—2006) in its original form without any changes.
o Human Development Report (2000—2006)

153
Table 21. Political Rights and Civil Liberties Measures
Definition
Calculation Sources
These measures are based on Freedom in the World annual surveys which have been conducted by the Freedom House since 1973 (http://www.freedomhouse.org/ ). These surveys assess state of political rights and civil liberties in 192 countries in the world. Data is collected from professional contacts, international visitors, human rights organizations, specialists in geographic and geopolitical areas, the reports of governments and multilateral bodies, and a variety of domestic and international media.
Level of political rights and civil liberties variable is measured on a scale 7-1 (with 7 representing the min of rights and liberties and 1 representing maximum of available rights and liberties). For this measure to be consistent with other measures, it was converted so that 7 represented max of rights and liberties and 1 represented min of rights and liberties.
o Freedom House website: http://www.freedomhouse.org/
Table 22. Attitude Toward Women in a Society
Definition
Calculation Sources
This variable includes: women’s legal rights and their actual life application, domestic violence, attitude toward women on the job.
For this variable, the researcher used qualitative information on women’s legal rights and their actual life application, domestic violence, attitude toward women on the job available in Social Development section of every country’s profile as presented by the Worldmark Encyclopedia of the Nations (Gale Group). Based on this information, countries were ranked according to three categories: 0—poor 1—moderate 2—good
o Worldmark Encyclopedia of the Nations ( 2004, 2007)
Tables 23-27 pertain to the Family construct, and describe structural composition
of families, availability of aid for families, and population distribution.

154
Table 23. Average Number of Children in a Household
Definition
Calculation Sources
This variable assesses the number of children (under age 15) per household. A threshold for child-age is set at 15 to provide a consistent measure of social minority internationally, though legal minority depends on the law of each country (Encyclopedia Britannica, 2004, p. 771).
Encyclopedia Britannica provides ready-to-use data for 100 countries. For the rest of the countries in the specified population, this study used Encyclopedia Britannica’s data on marriage and family (Total Number of Households in a Country and Total Number of Children Under 15 measures in Vital Statistics, Marriage and Family and Area and Population sections). The researcher assumed that all children 0-14 were in households (and ignored street children and children in orphanages). Dividing number of children (0-14) by the number of households provided the study with a rough estimate of number of children of this age per household.
o Encyclopedia Britannica Book of the Year (1999-2006)
Table 24. Family Size
Definition
Calculation Sources
A family unit is comprised of individuals related by blood or civil register (Encyclopedia Britannica, 2004, p.771). Household/family unit can be as small as a single person and as large as an extended family (Encyclopedia Britannica, 2004, p. 830).
In this study, the measure of average family size was used as reported in Encyclopedia Britannica in its original form without any changes.
o Encyclopedia Britannica Book of the Year (1999-2006)
Table 25. Urban Population Distribution
Definition
Calculation Sources
The urban-rural classification of population in international statistics follows the national census definitions that are usually based on criteria that may include one of the following: size of population in a locality, predominant type of economic activity, legal or administrative boundaries and urban characteristics (United Nations Statistics Division). This measure is reported as percent of urban population in the total country population.
In this study, the measure of urban population distribution was used as reported by United Nations Statistics Division and Encyclopedia Britannica in its original form without any changes. This measure is reported as percent of urban population in the total country population.
o United Nations Statistics Division:
http://unstats.un.org/ o Encyclopedia Britannica Book
of the Year (2000-2006)

155
Table 26. Divorce Rate
Definition
Calculation Sources
A final legal dissolution of a marriage, that is, that separation of husband and wife which confers on the parties the right to remarriage under civil, religious and/or other provisions, according to the law of each country. The number of annual final divorce decrees granted under civil law is presented as per 1000 mid-year population (UN Demographic Yearbook, 2001, p. 641).
In this study, the measure of divorce rate was used as reported in the described sources without any changes.
o UN Demographic Yearbook (1990, 1996, 2000, 2001, 2002, 2003, 2004)
o International Marketing Data and Statistics, 2006 (Euromonitor International)
o European Marketing Data and Statistics, 2005 (Euromonitor International)
o NationMaster online Statistics: http://wwwnationmaster.com
o Eurostat metadata: http://www.epp.eurostat.ec.europa/ o United Nations Statistics Division Common Database: http://unstats.un.org/unsd/cdb/cdb_advanced_data_extract.asp?srID=30256
Limitations of the Data Utilized for the Divorce Rate Variable
This variable has higher proportion of missing data than other variables. Divorce
has not been considered culturally appropriate in many African countries. Therefore,
even if a divorce occurred, it may not be registered. In some Catholic countries divorce is
illegal (for example, Chile, Philippines, Malta). As a result, people in these locations may
travel to other areas to get divorced. In countries where divorce is illegal, an annulment
(announcement that the marriage never existed) is allowed. For the countries where
divorce is allowed, but the data is missing, regional variables were utilized.

156
Table 27. Existence of at Least One Social Security Program Oriented Toward Families
Definition
Calculation Sources
This measure is presented in terms of existence or non-existence of the program Because of great complexity of national programs, a social security program oriented toward families refers to any programs providing financial assistance to families or mothers to help with the cost of raising children (Encyclopedia Britannica, 2004, p.843). Because of great complexity of national programs, this measure is presented in terms of existence or non-existence of the program.
In this study, this measure was used as reported in Encyclopedia Britannica in its original form without any changes.
o Source: Encyclopedia Britannica Book of the Year (1999-2006)
Table 28 describes definition, calculation, and sources for the variable of
International NGOs Membership Density.
Table 28. International NGOs Membership Density
Definition Calculation Sources
Membership density is expressed as the number of memberships in NGOs per 1 million population.
In this study, this measure was used as reported in the Yearbook of International Organizations 2006/2007 in its original form without any changes.
o Union of International Associations (Ed.). (2006). Yearbook of International Organizations 2006/2007. Germany: Union of International Associations
Operationalization of Data
The data reviewed above forms the basis for the operationalization of the three
factors examined in this research (National Identity, Family, and Character). This section
contains a detailed discussion of the process of creating the factors out of the collected
data.

157
Analyses of the Structure of Factors
The data described above was generated based on the results of a content analysis
of literature as described in Chapter II. The next step needed to determine whether the
collected data fit the three hypothesized factors, develop these factors, and determine
reliability. Generally, Cronbach’s alpha is used as the overall reliability estimate of
complex instruments, and factor analysis is used to determine the appropriate assignment
of individual items to factors to see the structure of a factor emerge out of many
potentially applicable variables (Field, 2005; McLean, Yang, Kuo, Tolbert, Larkin,
2005). However, as discussed in the previous section on specificity of formative indices,
internal reliability analysis is not appropriate for such indices. Therefore, only factor
analysis tests were conducted to test the hypothesized structure of the factors and
ultimately develop these factors. Variables hypothesized to represent each of the three
examined factors were factor analyzed. Specifically, thirteen variables hypothesized to
form the National Identity Awareness construct were factor analyzed, as well as twelve
variables hypothesized to represent the Character construct, and five variables
hypothesized to represent the Family construct.
Out of two kinds of factor analysis—exploratory and confirmatory—
confirmatory factor analysis was chosen for use in the study. Pedhazur and Schmelkin
(1991), Field (2005), and Jöreskog & Goldberger (1975) identified confirmatory factor
analysis as a theory-testing technique, which gives a researcher a viable method for
evaluating construct validity. Compared with exploratory factor analysis which explores
data, confirmatory factor analysis tests data for its fit with the theory. More specifically,
in confirmatory factor analysis, a researcher is able to test hypotheses concerning the

158
factor structure of the data due to having a prior model that specifies the number and
composition of the factors. This technique allows a researcher to determine whether
measures created to represent a latent variable really belong together. The model is
expected to specify the number of variables within the model. It may also specify the
degree of correlation between individual variables, and the loadings of variables on
particular factors. The theory-based model is then tested to assess its fit with the data.
The fit statistics are then evaluated to determine whether the predetermined model
explains the relationships between the observed and latent variables. Bentler (1980)
explained the process of confirmatory factor analysis,
The primary statistical problem is one of optimally estimating the parameters of the model and determining the goodness-of-fit of the model to sample data on the measured variables. If the model does not acceptably fit the data, the proposed model is rejected as a possible candidate for the causal structure underlying the observed variables. If the model cannot be rejected statistically, it is a plausible representation of the causal structure (p. 420).
Therefore, the instances of the most effective use of confirmatory factor analysis (CFA)
are as follows:
• If a researcher begins with a hypothesis prior to the analysis
• If a well-established theory exists, that is the foundation for the hypothesis
• There is a need to test a theory, not to generate a theory
There are two approaches to conducting CFA: by using any general-purpose
statistical package, which supports FA, or by using a structural equation modeling (SEM)
package such as AMOS or LISREL. While SEM is typically used to model causal
relationships among factors, it may also be used to explore CFA measurement models. In
this dissertation, SPSS-16.0 package was used to run this analysis.

159
Choice of Eigenvalues
The Principal Component Analysis (PCA) method was used for extraction of
factors. According to Pedhazur and Schmelkin (1991) PCA is a data reduction technique
that is applied to “arrive at a relatively small number of components that will extract most
of the variance of a relatively large set of indicators… Principal components extract both
variance that is unique to an indicator as well as error variance” (p. 598).
Based on the definition of FA, not all factors are retained in the analysis, and
there is a debate over the criterion employed to determine whether a factor is statistically
important (Field, 2005). Kaiser has recommended retaining all factors with eigenvalues
greater than 1 with eigenvalues defined as representing the amount of variation explained
by a factor (Field, 2006). This criterion is based on the idea that an eigenvalue of 1
indicates a substantial amount of variation. Joliffe (1972) suggests retaining all factors
with eigenvalues more than 0.7 because Kaiser’s criterion is too strict. Field (2006, p.
634) suggests using the Kaiser method (which is also a default method in SPSS) because
the closer the communalities are to one, the better the factors are at explaining the
original data. Therefore, in this dissertation, a communality of one is used as a criterion.
Choice of the Loading Level That Is Significant
Loading of variables on factors is the main step in the process of factor extraction.
Rotation (a technique that improves loading of variables) can be used in order to improve
the loading. Two types of rotation exist—orthogonal rotation (used when factors are
independent) and oblique (used when the underlying actors are allowed to correlate).

160
Since there is no good theoretical and empirical reason to suppose that the factors in this
study could correlate, orthogonal rotation (varimax method) was used.
The next step of the analysis was determining the degree of loading that would be
considered significant. As mentioned earlier, factor loading is an indicator of the
substantive importance of a given variable to a given factor. According to Field (2005),
typically, researchers view a loading of 0.3 to be important. At the same time, the
significance of a factor loading depends on the sample size. Stevens (1992) recommends
considering a loading of 0.722 as significant for a sample size of 50, a loading of 0.512+
for a sample size of 100, and a loading greater than 0.364 for a sample size of 200 (pp.
382-384). Because the degree of substantive importance of a variable to a factor is
determined by the amount of variance in a factor accounted for by the variable (like R² it
is calculated by squaring the factor loading), Stevens recommends interpreting only the
factor loading with an absolute value greater than 0.4 (it explains 16% of the variance).
Choosing conservatively, with N=163 in this dissertation, factor loading of 0.5 and
greater is considered significant.
Other Considerations
Another central consideration during selection of variables is the purpose of
measurement. Since the goal is international comparison, the components need to be
available for all countries, as well as be universally significant and cross-culturally
applicable (Booysen, 2002). Other important selection criteria include distinction
between variables focused on ends, means or both. Different authors argue for the use of
either variables focused on ends (Adelman & Taft-Morris, 1972), or those focusing on

161
means (McGranaham, 1972), or both (Morris, 1979 UNDP’s Human Development
Index). The argument for the latter is that some variables represent both—ends and
means (for example, literacy). Therefore, in this study both kinds of indicators have been
employed.
Factor Analysis Results
Results of Factor Analysis of the National Identity Awareness Factor
Two tests, the Kaiser-Meyer-Olkin (KMO) test of sampling adequacy and
Barlett’s test of sphericity, were conducted in order to determine whether the data meets
the requirements for factor analysis (Field, 2006). According to the results of the tests,
the data set for the National Identity Awareness (ID) factor meets the adequacy criteria
for factor analysis (see Appendix A-1).
Factor analysis was conducted for the National Identity Awareness (ID) factor for
each year of the 2000-2005 period (total of 6 years). The 13 items suggested as the ones
comprising this factor were factor analyzed. The percentage of variance explained in the
National Identity Awareness factor (2000-2005) is provided in Appendix B (Tables B1-
B6). According to Pedhazur and Schmelkin (1991), the first two or three components are
supposed to extract at least 50% of the variance. Results presented in Tables B1-B6 show
the extracted eigenvalues for every year and indicate that this requirement was met. In
2000, four components explained 69.09 percent of variance. In 2001, four components
explained 68.73 percent of variance. In 2002, four components explained 68.21 percent
of variance. In 2003, four components explained 69.01 percent of variance. In 2004, three
components explained 62.10 percent of variance. And in 2005, four components

162
explained 70.12 percent of variance. On average, the extracted eigenvalues explained
67.87 percent of variance. In five out of six years (2000-2003 and 2005) these results
were achieved by four components, and in one year (2004), it was achieved by three
components.
The factor loadings for the National Identity Awareness factor (2000-2005) are
provided in Appendix B (Tables B7-B12). Only items with factor loadings of 0.5 and
above were considered. For five out of six years (2000-2003 and 2005), four components
were extracted, and for one year (2004), three components were extracted. Results of the
Rotated Component Matrix and the Total Variance Explained matrix indicate that
components were extracted similar to the hypothesized structure of the ID factor,
although some variables loaded on a different factor that the author hypothesized.
Extracted Factor 1. Four variables that appear in each of the first extracted factor
(for 2000-2005) are Government Effectiveness, Corruption Perception, Voice and
Accountability, and School Life Expectancy. Additionally, Government Expenditure
appears in three years; Medals Won in Olympics variable appears in two years; and The
Number of the Nobel Prize Winners appears in one year. This factor is similar to the
hypothesized Common Institutions/Rights and Duties for all Members factor. Therefore,
based on the results of the tests, the hypothesized model of Common Institutions/Rights
and Duties for All Members factor can be adjusted to:
Common Institutions/Rights and Duties for All Members
• Government Effectiveness measure
• Voice and Accountability measure
• Corruption Perception Index

163
• School life expectancy (in years)
• Level of total government consumption minus Military expenditure as
percent of GDP
Extracted Factor 2. Three variables that appear in each of the second extracted
factor (for 2000-2005) are Language cohesion, Ethnic cohesion, and Religious cohesion.
No additional variables appear. This factor is similar to the hypothesized Common
Norms, Values, and Culture factor. Therefore, based on the results of the tests, the
hypothesized model of Common Norms, Values, and Culture factor can be adjusted to:
Common norms, values, and culture
• Linguistic cohesion
• Ethnic cohesion
• Religious cohesion
Extracted Factor 3. Two variables that appear in each of the third extracted factor
(for each of the 2000-2005 years) are Gini Coefficient and the Number of National
Holidays that a Country Celebrates. Additionally, the variables of Number of Medals
Won in Olympic Games and Years of a Country’s Independence appear once. This factor
is similar to the hypothesized Awareness of Collective Destiny (Collective Goals) factor.
Therefore, based on the results of the tests, the hypothesized model of Awareness of
Collective Destiny (Collective Goals) factor can be adjusted to:
Collective Goals (Awareness of Collective Destiny)
• Number of holidays that the country celebrates
• Gini Coefficient

164
• Number of Olympic medals (1998-2005)
Extracted Factor 4. Two variables that appear in each of the fourth extracted
factor (for each of the 2000-2003 and 2005 years) are Years of Independence and The
Number of Nobel Prize Winners. No additional variables appear. This factor is similar to
the hypothesized Perpetuation of Common Myths and Historic Memories factor.
Therefore, based on the results of the tests, the hypothesized model of Perpetuation of
Common Myths and Historic Memories factor can be adjusted to:
Perpetuation of common myths and historic memories
• Time of Independence
• Number of Nobel Prize laureates in a country (1901-2005)
Based on these results, the researcher can adjust the model of National Identity
Awareness construct. The new adjusted model is as follows:
Common norms, values, and culture
• Linguistic cohesion
• Ethnic cohesion
• Religious cohesion
Collective Goals (Awareness of Collective Destiny)
• Number of holidays that the country celebrates
• Gini Coefficient
• Number of Olympic medals (1998-2005)
Common Institutions/Rights and Duties for All Members
• Government Effectiveness measure

165
• Voice and Accountability measure
• Corruption Perception Index
• School life expectancy (in years)
• Level of total government consumption minus Military expenditure as
percent of GDP
Perpetuation of common myths and historic memories
• Time of Independence
• Number of Nobel Prize laureates in a country (1901-2005)
Therefore, for future studies this model can be considered as the model of the National
Identity Awareness factor.
Results of Factor Analysis of the Character Factor
Two tests, the Kaiser-Meyer-Olkin (KMO) test of sampling adequacy and
Barlett’s test of sphericity, were conducted in order to determine whether the data meets
the requirements for factor analysis (Field, 2006). According to the results of the tests,
the data set for the Character of Citizens in a Country (Character) factor meets the
adequacy criteria for factor analysis (see Appendix A-2).
Factor analysis was conducted for the Character of Citizens in a Country
(Character) factor for each year of the 2000-2005 period (6 years). The 12 items
suggested as the ones comprising this factor were factor analyzed. The percentage of
variance explained in the Character of Citizens in a Country (Character) factor (2000-
2005) is provided in Appendix C (Tables C1-C6). According to Pedhazur and Schmelkin
(1991), the first two or three components are supposed to extract at least 50% of the

166
variance. Results presented in Tables 1-6 show the extracted eigenvalues for every year
and indicate that this requirement was met. In 2000, three components explained 60.40
percent of variance. In 2001, two components explained 52.36 percent of variance. In
2002, three components explained 61.34 percent of variance. In 2003, three components
explained 60.63 percent of variance. In 2004, three components explained 60.80 percent
of variance. And in 2005, three components explained 60.53 percent of variance. On
average, the extracted eigenvalues explained 59.34 percent of variance. In five out of six
years (2000 and 2002-2005) the results were achieved by three components, and in one
year (2001), it was achieved by two components.
The factor loadings for the Character factor (2000-2005) are provided in
Appendix C (Tables C7-C12). Only items with factor loadings of 0.5 and above were
considered. For five out of six years (2000, and 2002 - 2005), three components were
extracted, and for one year (2001), two components were extracted.
Extracted Factor 1. Six factors that appear in each of the first extracted factor
(2000-2005) are Civil Liberties in a Country, Political Rights in a Country, Independence
of Judicial System from the Government, Percent of Population Above Income Poverty
Line, Attitude toward Women and Treatment of Women in a Society (in the family, at
work place), and Expenditure on Leisure and Recreation (as percent of a household
budget). Additionally, Number of Reported Criminal Offenses, INGO Membership
Density and Suicide Rate appear in three years, and Parliamentary Seats Held by Women
in one year.

167
This factor is similar to the hypothesized Environment Where Specific Population
is Located factor. Therefore, based on the results of the tests, the hypothesized model of
Environment Where Specific Population is Located factor can be adjusted to:
Environment where specific population is located
• Level of Civil Liberties in a Country
• Level of Political Rights in a country
• Independence of Judicial System
• Population above income poverty rate
• Attitude toward women and treatment of women in a society (in the
family, at the job)
• Expenditure on leisure as percent of the total family consumption
• International NGOs membership density
• Suicide rate
Extracted Factor 2. One factor that appears in each of the second extracted factor
in five out of six years (except 2001) is Seats in the Parliament Held by Women. Election
Participation Rates factor appears four times (except 2001 and 2005). Additionally,
Reported Police Offenses variable appears three times, and Prison Population and INGO
Density appear once each.
This factor is similar to the Character as Manifested in Public Life variable.
Therefore, based on the results of the tests, the hypothesized model of Character as
Manifested in Public Life factor can be adjusted to:
Character as manifested in public life
• Election Participation Rates

168
• Parliamentary seats held by women
• Reported police offenses (per 100,000 of population)
Extracted Factor 3. One factor that appears in each of the third extracted factor in
five out of six years (except 2001) is Prison Population (per 100,000 population in the
country). No additional variables are present. This factor is similar to the Character as
Manifested in Private Life variable. Therefore, based on the results of the tests, the
hypothesized model of Character as Manifested in Private Life factor can be adjusted to:
Character as manifested in private life
• Prison population (per 100,000 of population)
Based on the results of these tests, the researcher can adjust the model of Character of
Citizens in a Country (Character) construct. The new adjusted model is as follows:
Character as manifested in private life
• Prison population (per 100,000 of population)
Character as manifested in public life
• Election Participation Rates
• Parliamentary seats held by women
• Reported police offenses (per 100,000 of population)
Environment where specific population is located
• Level of Civil Liberties in a Country
• Level of Political Rights in a country
• Independence of Judicial System
• Population above income poverty rate

169
• Attitude toward women and treatment of women in a society (in the
family, at the job)
• Expenditure on leisure as percent of the total family consumption
• International NGOs membership density
• Suicide rate
Therefore, for future studies this model can be considered as the model of the Character
factor.
Results of Factor Analysis of the Family Background (Family) Factor
Two tests, the Kaiser-Meyer-Olkin (KMO) test of sampling adequacy and
Barlett’s test of sphericity, were conducted in order to determine whether the data meets
the requirements for factor analysis (Field, 2006). According to the results of the tests,
the data set for the Family Background (Family) factor meets the adequacy criteria for
factor analysis (see Appendix A-3).
Factor analysis was conducted for the Family Background (Family) factor for
each year of the 2000-2005 period (6 years). The five items which had been suggested as
the ones comprising this factor were factor analyzed. The percentage of variance
explained in the Family Background factor (2000-2005) is provided in Appendix D
(Tables D1-D6). According to Pedhazur and Schmelkin (1991), the first two or three
components are supposed to extract at least 50% of the variance. Results presented in
Tables D1-D6 show that the first component explained the required majority of variance
in this factor. All five of the suggested Family variables loaded as one factor.

170
The factor loadings for the Family factor (2000-2005) are provided in Appendix
D (Tables D7-D12). Only items with factor loadings of 0.5 and above were considered.
In each of the 2000-2005 years only one component was extracted.
Results of the tests indicate that components were extracted somewhat differently
than the hypothesized structure of the Family factor. Although it was hypothesized that
the Family factor consists of two constructs, only one was formed in reality. All
components loaded on one variable that can be identified as Family Background factor.
Such loading is consistent with Becker’s ideas about the economic importance of the
number of children in the family (as discussed in the Literature Review section).
Based on the results of this test, the researcher can adjust the model of Family construct.
The new adjusted model is as follows:
Family Status
• Average number of children in a household
• Family size (number of occupants per household)
• Share of total population living in urban areas
• Availability of family services
• Divorce rate
Therefore, for future studies this model can be considered as the model for the Family
factor.

171
Conclusion
The factor analysis tests discussed above condensed a large number of variables
into distinctly different factors, for which shared characteristics describe the examined
population. Thirteen variables chosen to represent the National Identity Awareness
construct were condensed into four factors; twelve variables chosen to represent
Character construct were condensed into three factors; and five variables chosen to
represent Family construct were condensed into one factor.
Weighting/Scaling and Aggregation of Variables
Based on the discussion presented in the beginning of this chapter, no additional
weighting or scaling was assigned to the extracted factors. Because scaling potentially
hinders the meaning of the employed indicators, and because variables are automatically
standardized during the process of FA, no scaling has been used in this study. No
additional weights have been assigned either. Only factor scores created by the FA have
been used. All further analyses have been carried out on the extracted factors’ scores
rather than the original data, as suggested by Field, 2006 (p. 628).
Based on the theoretical discussion on formative index creation presented in the
beginning of this chapter, the additive aggregation technique was chosen as the method of
factor aggregation into one final score. No theoretical or expert reasoning for functional
method of aggregation has been found. Moreover, this approach is consistent with the
basic formula of formative indicators, which is
A=Y1X1 + Y2X2 + …YnXn

172
where Yn is a parameter reflecting the contribution of Xn to the latent variable A.
Final Results of Formation of the Expanded Index
EHCI (called EHCI-1) is the result of the summative aggregation of four major
variables: UNHCI, National Identity Awareness factor, Character factor, and Family
factor. Appendix E (Table E-1) presents EHCI-1 in non-standardized form. For
standardization, a simple score formula (United Nations Conference on Trade and
Development , 2002) was used:
Score = X i - X min
X max – X min Appendix E (Table E-2) presents the standardized EHCI-1 (with scores ranging between
0 and 1).
Validation of the Expanded Human Capital Index
This section addresses the issue of validation of EHCI. It presents the rationale for
the choice of the use of regression analysis as the best method of validation. Moreover, it
presents a rationale on the choice of the dependent variables utilized.
Theoretical Approach to Validation
As already discussed in this chapter, the nature of formative indicators renders
classical internal consistency tests (for example, item analysis) inappropriate. Therefore,
other methods of validation need to be used. It has been suggested (Diamantopoulos &
Winklhofer, 2001; Jarvis et al., 2003) that utilization of reflective indicators (the ones that

173
represent effects of the construct) can serve as a means of validity testing. External
validation includes evaluation of the relationship between the index and the outside
variables that should theoretically correlate. This is generally done via regression
analysis. Another approach to validation, suggested by the same researchers, links the
index to other constructs with which it would be expected to correlate. In this study,
validation has been conducted by regression analysis between the created index and
several indicators theoretically known to correlate with human capital (percent of high-
value-added products in total country export, amount of a country’s foreign investments,
and export of services by a country).
Validation Method Utilized for EHCI
As discussed earlier, composite indices can be validated by testing their
relationship with the outside variables with which they are theoretically supposed to
correlate. Human Capital can be shown as demonstrating itself twofold: through factors
that contribute to it (input factors), and through factors which are indicative if its level
(output factors). Discussion about contributing factors is one of the major parts of this
dissertation. Representative consequential factors, through which HC is displayed (output
factors), are such factors as export of high-value-added goods (Smith, 2005), export of
services (Kalotay, 2008; United Nations Conference on Trade and Development, 2004),
the number of scientific discoveries, number of patents, and the level of foreign
investments in a country (Dunning & Narula, 2004; Hanson, 1996; Noorbakhsh, Paloni &
Youssef, 2001; United Nations Conference on Trade and Development, 2002). The
degree of relationships between these factors and the HC Index can be tested to determine

174
how much variation in the output factors can be explained by the new measure of HC. If
the new HCI is a good measure of the real state of HC in a country, it must be highest in
the countries that demonstrate the best output (Veenhoven, 1993).
Predictive validity has been determined based on the ability of the new index to
predict another phenomenon better than the original HC index. Generally, in order to
conduct this kind of validation, another variable, which is known to be correlated with the
tested measure, must be examined in relation to this measure. The researcher used the
above mentioned economic variables (export of services, high-value-added export and
foreign investments), as they are theoretically known to be correlated with HC.
Regression analysis was used in the study to examine whether the independent variable
predicted the dependent variables. Regression analysis was chosen as the most
appropriate way of analysis because a regression equation describes the nature of the
relationships between the variables (Field, 2005; Pedhazur & Schmelkin, 1991).
Regression analysis can also be described as prediction analysis because it measures the
degree of linear relationships between the independent predictor variable and the
dependent criterion variable. This study hypothesized a significant correlation between a
new HC index (as the predictor variable) and several outcome variables that are
theoretically known to correlate with HC in a country: the Percent of High-Value-Added
products in national export, export of services as percent of the world total by a country,
and the amount of foreign investments a country attracts.

175
The Procedure of Validation of EHCI
Simple and multiple regression analyses were conducted to examine predictability
of the EHCIs as the predictor variables of the outcome variables (Field, 2005). Simple
regression seeks to predict an outcome variable from a single predictor variable, while
multiple regression aims to predict an outcome variable by several predictors. The
outcome variables that have been used are the variables that are theoretically known to be
positively correlated with the level of HC in a country: inward foreign direct investments
(IFDI/FDI) in a country, the level of high-value-added export, and the level of services
that a country exports. Simple regressions were conducted between these variables (used
separately), and both types of EHCIs as a whole, as well as between these variables (used
separately) and the separate components of EHCIs. Multiple regressions were conducted
by employing all of the components of the new HC index and the outcome variables.
Results of these analyses were compared with the results obtained from the similar tests
with UNHCI and the outcome variables.
In multiple regressions, several methods of entry of explanatory variables can be
utilized: hierarchical entry, forced entry, and stepwise entries. In hierarchical regression,
predictors are chosen based on previous research, and the researcher uses it to decide the
order of entering them into the model. As a general rule, well-established predictors are
entered into the model first, and new predictors are entered next (Field, 2006). In forced
entry regressions, all predictors are entered into the model simultaneously. Similar to
hierarchical, this method utilizes well-established theoretical reasons for including the
chosen predictors. However, unlike hierarchical, the researcher does not make decisions
on the order of entry (Field, 2005). Stepwise methods rely on significance of variables

176
(via mathematical criterion) in entering variables. It has been suggested that Stepwise
methods need to be avoided except for exploratory model building (because it takes many
important methodological decisions out of the hands of a researcher) (Field, 2005;
Wright, 1997). In this dissertation, both hierarchical and forced entry methods were used.
The following test results are considered to be the most important in statistical
assessments: adjusted R², F-test and its significance, B coefficient, and significance of
corresponding with it t-test. They are the measures this study used to evaluate the new
HCI. Generally, R² and adjusted R² are the test results that are instrumental in assessing
the goodness of fit of a model. R² represents the amount of variance in the outcome
explained by the model relative to how much variation there was to explain in the first
place. Therefore, as a percentage, it represents the percentage of variation in the outcome
that is explained by the model (Field, 2005). Adjusted R² indicates how much variance in
the outcome would be accounted for if the sample were generalized to the whole
population.
Another step of assessing the model is through the F-test. This test is based on the
ratio of the improvement due to the model, and the difference between the model and the
observed data. In other words, F-ratio is a measure of how much the model has improved
the prediction of the outcome compared to the level of inaccuracy of the model.
Therefore, a good model needs to have a large F-ratio (Field, 2005).
The value of the B coefficient represents the change in the outcome resulting from
a unit change in the predictor. Consequently, if a variable significantly predicts an
outcome, than its B value is significantly different from 0. A hypothesis is tested using t-
test statistic, which tests the null hypothesis that the value of B is 0. Failure to support the

177
null suggests the hypothesized model will predict the outcome variable. In SPSS, Sig.
measures the exact probability that the observed value of t would occur if the value of B
was really 0 (Field, 2006). When the observed value is less than .05, than B is considered
significantly different from zero and, therefore, contributes to the outcome.
Summary
Applying a general methodology of composite index construction, this researcher
sought to 1) create models of latent factors that may be included in HCI; 2) create an
EHCI; and 3) validate the index established herein. As such, this dissertation critiques,
refines, and re-examines widely used approaches to HC measurement. The predictive
power of the currently used UNHCI is examined, followed by an examination of the
predictive power of the two newly formed HCIs. Finally, the index which has the
strongest predictive power, and consequently, the one best indicator in economic
prediction equations, is determined.

178
CHAPTER IV
DATA ANALYSIS
Introduction
The currently used instruments for measuring HC are based on approaches
developed during the period of mid-18th century—mid-20th century. These approaches
view HC as a combination of the education and experience of a country’s population.
Consequently, they utilize education-related measures in their attempt to assess a level of
national HC development. However, with the increased number of studies providing
evidence for limited capacity of education-related variables to adequately measure
national HC, the need for expanding currently used measures has become apparent.
Intangible qualities of populations have been consistently suggested as the ones that
contribute to the formation of national HC, and, therefore, need to be taken into
consideration when measuring national HC.
The United Nations HC Index was used in this analysis, as the tool that is widely
used internationally for national HC assessment. Although other HC measures exist (as
discussed in the Literature Review section), they are used mostly in academic circles, and
are similar to UNHCI in their approach of using education-related measures for HC
assessment. Therefore, UNHCI can be considered as a good representative of this
approach of measuring HC. The availability of UNHCI data for broad cross-country
comparison, as well as its wide use in international statistical reporting, makes it a good
measure for the use in this study.
In order to test empirically the adequacy of the UNHCI, and whether additionally
suggested variables can be significant contributors toward an improved HC measure, a

179
series of regression equations were modeled. Economic performance measures,
theoretically known to be correlated with HC, were used as the predicted variables. The
rest of the chapter presents results of the analyses in the following format:
• Effect of UNHCI on economic development variables (export of services,
high-value-added export, and foreign investments in a country) was examined.
Effect of the individual newly suggested variables (ID, Family, and Character)
on the economic development variables was examined. Results of these
analyses were compared.
• The effect of the Expanded HC Index—EHCI-I—(the combination of the
three newly suggested variables plus UNHCI as individual variables) was
analyzed in terms of its relationship with the outcome variables (export of
services, high-value-added export, and foreign investments in a country).
These results were compared with the results of the analysis of the effect of
UNHCI as an individual measure on economic variables in order to determine
which measure had more explanatory power in relation to the predicted
outcome economic measures.
• The effect of expanding the HC Index in a different way (the combination of
ID and Character factors plus modified Family factor which incorporated
UNHCI) was analyzed in terms of its relationship with the outcome variables.
Incorporating UNHCI as a part of one of the newly suggested variables
allowed for preserving this factor in the newly created index without adding
uncertainty affiliated with it. The effect of the new index created this way—

180
EHCI-II—was tested against the outcome variables. The results produced by
EHCI-I and EHCI-II were compared.
Comparison of the Effect of UNHCI and Individual Variables (ID, Family, and
Character) on the Economic Development Variables
As suggested, education-based HC measures are not fully adequate measures of
national HC. Three additional latent variables (National Identity Awareness, Family
Background, and Character) have been suggested as ones that may affect national HC,
and therefore, their roles need to be examined. The following three subsections report the
results of examination and compare the effects of these individual variables as separate
factors and UNHCI on the outcome economic variables.
Comparison of the Effect of UNHCI and ID Factor on the Outcome Economic
Development Variables (Export of Services, High-Value-Added Export, and Foreign
Investments)
UNHCI and ID as Tested Against the Export of Services Measure
In the analyses that follow, standardized parameter estimates were examined
instead of unstandardized parameter estimates because this study’s goal was assessing the
relative effect of independent variables on dependent (economic) variables, rather than
actual effect sizes caused by independent variables. Based on the results reported in Table
29, both UNCHI and the ID factor had a statistically significant effect on economic
measures.

181

182
However, the National Identity factor had more explanatory power than the UNHCI.
Variation in national identity awareness in a country’s population could account for 33.7
percent of variation in the country’s export of services for the period 2002-2004, and for
46.7 percent for 2003-2005 period. For UNHCI these measures were 8.3 percent and 11.4
percent respectively.
Linear regression coefficients (statistically significant for both of the examined
time periods) indicate that one SD increase in the level of a country’s citizens
identification with their country increased the country’s export of services by 0.585 SD
in 2002-2004, and by 0.692 SD in 2003-2005. For UNHCI these measures were 0.299 SD
and 0.363 SD respectively. According to F-test results, improvement in prediction of the
level of export of services that resulted from fitting the model with the ID factor, relative
to the inaccuracy that existed in the model was 57.865 in 2002-2004 and 39.559 in 2003-
2005. When UNHCI was utilized in the model, F-test results were 12.802 and 7.418 for
the respective periods.
UNHCI and ID as Tested Against High-Value-Added Export Measure
Based on the results reported in Table 29, both UNCHI and the ID factor were
significant in predicting proportion of high-value-added export (as a share of the total
country export) in national export. However, the National Identity factor had more
explanatory power than the UNHCI. According to the results of regression analysis,
variation in ID factor accounted for 21.5 percent of variation in a country’s high-value-
added export in 2000, 23.7 percent in 2001, 21.8 percent in 2002, and 22.5, 19.9, 17.4
percents in 2003-2005 respectively. The results of this analysis for UNHCI were 18.9,

183
21.9, 21.5, 18.3, 16, and 14.2 percent respectively. On average, variation in ID factor
accounted for 21.13 percent in national high-value-added export in 2000-2005. Variation
in UNHCI accounted for 18.47 percent on average. One standard deviation increase in ID
factor led to 0.470 SD increase in high-value-added export in 2000, 0.493 SD increase in
2001, 0.473 SD, 0.480 SD, 0.452 SD, and 0.424 SD increase in 2002-2005 respectively
(all six regression coefficients are statistically significant at p<0.001). One SD increase in
UNHCI led to 0.441 SD increase in 2000, 0.474 SD increase in 2001, 0.469 SD, 0.434
SD, 0.407 SD and 0.385 SD increase in 2002-2005 respectively (all six regression
coefficients are statistically significant at p<0.001). On average, one SD increase in ID
factor accounted for 0.47 increase in high-value-added export in 2000-2005. On average,
one SD increase in UNHCI accounted for 0.44 increase. According to F-test results,
improvement in prediction of the proportion of high-value-added export in the total
country export that resulted from fitting the model with the ID factor, relative to the
inaccuracy that existed in the model, was 36.78 in 2000, 42.05 in 2001, 38.86, 39.32,
34.23, and 29.35 in 2002-2005 respectively. F-test results for the model with UNHCI in it
were: 34.61, 41.38, 41.21, 33.86, 29.42, and 25.42 respectively. On average, the F-test
result was 36.77 for the ID factor and 34.32 for UNHCI for the examined period of 2000-
2005.
UNHCI and ID as Tested Against Foreign Direct Investments Measure
National identity awareness of population in a country and UNHCI in a country
were shown to be statistically significant predictors of foreign direct investments in a
country for four out of six years, holding other variables constant. Four out of six

184
regression coefficients were statistically significant at (p<0.05 or better), with the sign
being negative for each of the four years. At the same time, UNHCI was a better
predictor of FDI in a country than ID factor. According to the results of regression
analysis (Table 29), variation in the ID factor could account for 3.1 percent of variation in
FDI in a country on average for the 2000-2005 period. Variation in UNHCI could
account for 7.3 percent for the same period. One SD change in ID factor led to 0.23 SD
change in FDI variable, while one SD change in UNHCI led to 0.33 SD change.
Conclusion
Overall, the results reported above provide evidence for the ID factor possessing
more explanatory power in relation to the selected economic variables than the UNHCI,
holding other variables constant. ID factor is more effective in predicting the level of
national export of services and high-value-added export. UNHCI is shown to be more
effective in predicting the amount of foreign investments that a country attracts.

185
Comparison of the Effect of UNHCI and Family Factor on the Outcome Economic
Development Variables (Export of Services, High-Value-Added Export, and Foreign
Investments)
UNHCI and Family Factor as Tested Against the Export of Services Measure
In the analyses that follow, standardized parameter estimates were examined instead
of unstandardized parameter estimates because this study’s goal was assessing the
relative effect of independent variables on dependent (economic) variables, rather than
actual effect sizes caused by independent variables. Based on the test results reported in
Table 30, both Family factor and UNHCI had a statistically significant effect on
economic measures. At the same time, Family factor seemed to be a stronger predictor of
those measures. Variation in the Family factor could account for 23 percent in a country’s
export of services in 2002-2004 period, and for 27.1 percent in 2003-2005 period.
Variation in UNHCI could account for 8.3 percent and 11.3 percent respectively. Linear
regression coefficients (statistically significant for both of the examined time periods at
p<0.01 or better) indicated that one SD increase in the measure of a country’s Family
factor increased the country’s export of services by 0.486 SD in 2002-2004 and by 0.536
SD in 2003-2005. For UNHCI these measures were 0.299 SD and 0.362 SD respectively.
According to F-test results, improvement in prediction of the level of export of services
that resulted from fitting the model, relative to the inaccuracy that existed in the model
was 36.527 in 2002-2004 and 17.704 in 2003-2005. When UNHCI was utilized in the
model, F-test results were 12.793 and 7.396 for the respective periods.

186

187
UNHCI and Family Factor as Tested Against High-Value-Added Export Measure
Based on the reported results (Table 30), Family factor and UNHCI were strong
predictors of the proportion of high-value-added products in a country’s export. At the
same time, Family factor possessed more explanatory power in predicting this economic
measure than UNHCI did. According to the results of the regression analysis, variation in
measures of the Family factor accounted for 32.4 percent of variation in a country’s high-
value-added export in 2000, 30.6 percent in 2001, 29.9 percent in 2002, 32.4, 31.3, and
31.4 percent in 2003-2005 respectively. The results of this analysis for UNHCI were
18.9, 21.9, 21.5, 18.3, 16, and 14.2 percent respectively. On average, variation in Family
factor accounted for 31.3 percent in the measure of high-value-added export in a country
in 2000-2005. Variation in UNHCI accounted for 18.47 percent during this period.
One SD increase in the measures of Family factor led to 0.573 SD increase in
high-value-export in 2000, 0.557 SD increase in 2001, 0.551 SD, 0.574 SD, and 0.564
SD increase in 2002, 2003 and 2005 respectively (all six regression coefficients were
statistically significant at p<0.001). One SD increase in UNHCI led to 0.44 SD increase
in 2000, 0.474 SD increase in 2001, 0.469 SD, 0.434 SD, 0.407 SD and 0.385 SD
increase in 2002-2005 respectively (all six regression coefficients were statistically
significant at p<0.05 or better). On average, one SD increase in Family factor accounted
for 0.56 increase in high-value-added export during the period of 2000-2005. On average,
one SD increase in UNHCI accounted for 0.44 increase. In 2004, the regression
coefficient had a negative sign, which implied reduction by 0.564 of SD in a country’s
high-value export with one SD increase in the measures of Family factor.

188
According to F-test results, improvement in prediction of the proportion of high-
value-added export in the total country export that resulted from fitting the model,
relative to the inaccuracy that existed in the model was 70 in 2000, 63.563 in 2001,
62.865, 68.194, 64.242, and 64.955 in 2002-2005 respectively. F-test results for the
model with UNHCI in it were: 34.61, 41.38, 41.21, 33.86, 29.42, and 25.42 respectively.
On average, F-test result was 65.72 for the Family factor and 34.32 for UNHCI.
UNHCI and Family Factor as Tested Against Foreign Direct Investments Measure
Family factor and UNHCI were shown as being statistically significant predictors
for FDI in a country. At the same time, Family factor had more explanatory power than
the UNHCI. According to the results reported in Table 30, variation in Family factor
could account for 16 percent in FDI in a country in 2000, 20.5 percent in 2001, 14.9
percent in 2002, 13.1 and 5.5 percent in 2003-2004 respectfully. On average, Family
factor could explain 12 percent of variation in variation of national FDI measure. UNHCI
could explain on average 7.3 percent of variation.
The standardized regression coefficient of the Family factor was statistically
significant for five out of six years (except 2005), and Bstd of UNHCI was statistically
significant for four out of six years (except 2004 and 2005) (p<0.05 or better). One SD
change in Family factor led to 0.41 SD change in FDI factor in 2000, 0.46 SD change in
2001, 0.397 SD, 0.374 SD, and 0.254 SD change in 2002-2004. Results for 2005 were
not significant. One SD change in UNHCI led to 0.36 SD change in FDI measure in
2000, 0.36 SD change in 2001, 0.31 SD and 0.27 SD change in 2002-2003. Results for
2004-2005 were not significant. According to the F-test results, improvement in

189
prediction of the amount of FDI in a country that resulted from fitting the model with the
Family factor, relative to the inaccuracy that existed in the model, was on average 16.74
for 2000-2004 (2005 year was not significant). That measure was 12.17 for UNHCI for
2000-2003 (2004-2005 were not significant).
Conclusion
These results provide evidence that the Family factor possesses more explanatory
power in relation to the three outcome economic variables than the UNHCI, holding other
variables constant.
Comparison of the Effect of UNHCI and Character Factor on the Outcome Economic
Development Variables (Export of Services, High-Value-Added Export, and Foreign
Investments)
UNHCI and Character Factor as Tested Against the Export of Services Measure
In the analyses that follow, standardized parameter estimates were examined
instead of unstandardized parameter estimates because this study’s goal was assessing the
relative effect of independent variables on dependent (economic) variables, rather than
actual effect sizes caused by independent variables. Based on the test results reported in
Table 31, both Character factor and UNHCI had a significant effect on economic
measures. At the same time, the Character factor seemed to be a stronger predictor of
these measures. Variation in the Character factor could account for 41.2 percent in a
country’s export of services in 2002-2004 period, and for 51.2 percent in 2003-2005
period. Variation in UNHCI could account for 8.3 percent and 11.3 percent respectively.

190
Linear regression coefficients (statistically significant for both of the examined time
periods at p<0.01 or better) indicated that one SD increase in the measure of a country’s
Character factor increased the country’s export of services by 0.646 SD in 2002-2004 and
by 0.724 SD in 2003-2005.
For UNHCI those measures were 0.299 SD and 0.362 SD respectfully. According
to F-test results, improvement in prediction of the level of export of services that resulted
from fitting the model, relative to the inaccuracy that existed in the model was 68.166 in
2002-2004 and 41.882 in 2003-2005. When UNHCI was used in the model, F-test results
were 12.793 and 7.396 for the respective periods.
UNHCI and Character Factor as Tested Against High-Value-Added Export Measure
Based on the reported results (Table 31), the Character factor and UNHCI were
significant predictors of the proportion of high-value-added products in a country’s total
exports. According to the results of regression analysis, variation in measures of the
Character accounted for 16.2 percent of variation in a country’s high-value-added export
in 2000, 15 percent in 2001, 16.4 percent in 2002, 30.9, 18.3, 17.6 percent in 2003-2005
respectively. The results of this analysis for UNHCI were 18.9, 21.9, 21.5, 183, 16, and
14.2 percent respectively. On average, variation in the Character factor accounted for
19.1 percent in the measure of high-value-added export in a country in 2000-2005.

191

192
Variation in UNHCI accounted for 18.47 percent during this period.
Standardized linear regression coefficients had a positive sign and were
statistically significant for both Character factor and UNHCI (p<0.01 or better). The
values of Bstd were bigger for Character factor than for UNHCI for three years (2003-
2005), but they were bigger for UNHCI for three other years (2000-2002). One SD
increase in the measure of Character factor led to 0.411 SD increase in high-value-export
in 2000, 0.396 SD increase in 2001, 0.413 SD, 0.561 SD, 0.436 SD, and 0.427 SD
increase in 2002-2005 respectively. One SD increase in UNHCI led to 0.44 SD increase
in 2000, 0.474 SD increase in 2001, 0.469 SD, 0.434 SD, 0.407 SD and 0.385 SD
increase in 2002-2005 respectively. On average, one SD increase in the Character factor
accounted for 0.441 SD increase in high-value-added export during the period of 2000-
2005. On average, one SD increase in UNHCI accounted for 0.435 increase.
According to F-test results, improvement in prediction of the intensity of high-
value-added export in the total country export that resulted from fitting the model with
the Character factor, relative to the inaccuracy that existed in the model, was 24.253 in
2000, 21.971 in 2001, 24.459, 57.380, 30.197, and 28.485 in 2002-2005 respectively. The
numbers for the model with UNHCI were as follows: 34.608 in 2000, 41.375 in 2001,
41.209, 33.864, 29.420, and 25.420 in 2002-2005 respectively.
UNHCI and Character Factor as Tested Against Foreign Direct Investments Measure
The Character factor for a country and UNHCI were also shown as being
statistically significant predictors of foreign direct investments in a country, holding other
variables constant. According to the results of regression analysis (Table 31), on average,

193
variation in the Character factor could account for 7 percent of variation in FDI in a
country for the period of 2000-2005; and variation in UNHCI could account for 7.3
percent on average.
Standardized regression coefficients of the Character factor were statistically
significant for two out of six examined years (2000 and 2001), with a sign being
negative. Standardized coefficients of UNHCI were statistically significant for four out of
six years (except 2004 and 2005), with the sign being negative. On average, one SD
change in the Character factor led to 0.45 SD change in FDI measure, and one SD change
in UNHCI led to 0.33 SD change in FDI measure. According to the F-test results,
improvement in prediction of the amount of FDI in a country that resulted from fitting the
model with the Character factor, relative to the inaccuracy that existed in the model, was
on average 20.65 for the period of 2000-2001 (results for 2002-2005 were not
significant). This measure was 12.17 for UNHCI for 2000-2003 (results for 2004-2005
were not significant).
Conclusion
These results provide evidence that the Character factor possesses slightly more
explanatory power in relation to the three outcome economic variables than the UNHCI,
holding other variables constant. It has more explanatory power in terms of the export of
services measure, and is similar to UNHCI in terms of high-value-added export and
foreign investments measures.
These test results provided some evidence for significance of the three newly
suggested variables in terms of their ability to predict selected economic development

194
variables as compared with UNCHI. The factor that appeared consistently better than
UNHCI was the Family factor. It outperformed UNHCI on its ability to predict each of
the three selected economic variables. The National Identity Awareness factor
outperformed the UNHCI on two out of three selected economic variables (export of
services and high-value-added export). The Character factor strongly outperformed
UNHCI on the Export of Services factor. Its predictive power was somewhat similar to
UNHCI in terms of predicting high-value-added export and FDI in a country. For three
out of six examined years it was superior to UNHCI’s predictive power for both
variables.
Attention needs to be drawn to the predicted outcome variables themselves. The
Export of services factor was consistently and strongly predicted by ID, Family, and
Character factors. UNHCI displayed significantly less power for predicting that economic
variable. High-value-added export was similarly consistently predicted by ID, family, and
Character factors. UNHCI displayed significantly less power for predicting this variable.
Foreign direct investments factor, on the contrary, was predicted with similar strength
and consistency by both UNHCI and each of the variables (ID, Family, and Character).
Potential explanation of less significant results between the newly suggested variables
and FDI variables may lie in the nature of the predicted variables themselves.
Export of Services Measure
Literature suggests that currently, countries with better developed human
resources produce higher level of professional services. Therefore, such countries are
positioned to export more of such services than countries with a lower level of human

195
resource development (United Nations Conference on Trade and Development, 2004).
Export of services continues to be dominated by developed countries with USA, Japan,
and the EU being the major participants. The share of the world’s export of services stock
increased for developing countries from 1 percent in 1990 to 10 percent in 2002 (WIR,
2004, p. xxi). By 2001, the service sector accounted for 72 percent of GDP in developed
countries and 52 percent in developing countries (United Nations Conference on Trade
and Development, 2004, p.xxi). Currently, about 60 percent of global investment stock is
in services (United Nations Conference on Trade and Development, 2004, p. xx).
Traditionally, export of services was in banking, insurance and transportation, and was
undertaken by companies investing internationally to support overseas production by
their manufacturing clients. Although this pattern is still fully in place, new trends have
been added, such as exporting services on their own account (i.e., without the need to
support own production) (WIR, 2004). For example, the “Big Four” accounting firms
have global operations and export accounting and management consulting services
around the world with revenues running into billions of dollars. Currently, the Big Four
audit the majority of publicly listed companies in most countries.
Availability of the export of services data as well as its nature makes this measure
a valid measure for assessing national HC level.
High-Value-Added Export Measure
According to the literature reviewed as part of this study, the intensity of high-
value-added exports by a country is one of the indications of the quality of its labor force.
In fact, high-value-added production is often a synonym of human-capital-intensive

196
production (Dyker, Nagy, & Spilek, 2003; Krugman, 1991; Smith, 2005; Wolfmayr-
Schnitzer, 1998). Countries with better developed human resources export significantly
more high-value-added products than do countries with a lower level of HC, which
specialize mostly in export of natural resources. For example, currently, 75 % of intra-EU
trade growth is accounted for high-value-added (human capital intensive) products. Levin
and Raut (1997) point out that export and adoption of modern technologies correlate.
They point to the fact that the productivity differential associated with the export sector is
concentrated in the manufactured export sector rather than the raw materials export
sector. This happens because the export sector utilizes human capital more efficiently
than the rest of the economy (Levin & Raut, 1997). Educated workers can quickly adapt
to advanced and rapidly changing technology, which is crucially important for
competitiveness in the world market.
Availability of the high-value-added export data as well as its nature makes this
measure a valid measure for assessing national HC level.
Foreign Direct Investments Measure
Practical comparison of FDI data (for example, FDI stocks as a percentage of
GDP or FDI flows as a percentage of GDP) shows that this outcome variable has some
practical weaknesses if used as a variable predicted by the degree of national HC
development. Foreign investments are generally divided into four major groups: market-
seeking FDI, resource-seeking FDI, efficiency-seeking FDI, and created-assets-seeking
FDI (United Nations Conference on Trade and Development, 2006, p.158). Market-
seeking FDI generally aims at expanding the customer base, often by investing in

197
middle-income developing economies. Efficiency-seeking FDI targets lower and middle
income developing countries and transition economies in an attempt to reduce the cost of
production. Resource-seeking FDI constitute investments in countries with abundant raw
materials desiring to access key factor inputs and secure their supplies for their home
markets. Created-assets-seeking FDI looks for new technologies to improve productivity
by mainly investing in developed economies.
Although there is evidence that a more highly educated populace attracts FDI
(Kogut & Chang, 1996; Mody & Srinivasan, 1998), this fact is probably more associated
with efficiency-seeking and created-asset-seeking investments. At the same time, data on
FDI grouping on a cross-country level for all countries is generally not reported. In fact,
all attempts by the author (in consultation with experts in the field) to locate such data did
not bring the desired results. One consequence of such data reporting is that the data are
artificially skewed because of poor oil-producing countries as well as tax havens. In both
of these groups of countries, GDP can actually be small, and even a moderate amount of
FDI can show as high in terms of its percentage of GDP. Furthermore, FDI can be the
major driver of the economy specifically because of a country being a tax-haven or an
oil-producer. For example, in Liberia FDI values are 599.5% and 832.6% for 2000 and
2005 (United Nations Conference on Trade and Development, 2006, p. 309); Brunei
displays 89.6% in 2000 and 145.2% in 2005. Luxemburg’s FDI in 2005 is 203% of GDP,
and Bermuda’s—2,419.4% (United Nations Conference on Trade and Development,
2006, p. 312)!
Furthermore, in the modern resource-lacking world, rich countries would go a
long way to insure access to resources, which means that they heavily invest in the

198
locations that are not attractive except for the availability of natural resources. The United
Nations Conference on Trade and Development (2002) suggested that a high (greater
than one) index value might be the result of many factors, such as exceptionally
welcoming regulatory regimes, good macroeconomic environment, efficient business
environment, good growth prospects, ample and economical skilled labor, natural
resources, good R&D capabilities, advanced infrastructure, efficient services support,
favorable location for exporting to large markets, tax-havens and so on. FDI which is a
result of created politico-socio-economic factors, is related to drastically different
features of a country, than FDI which is a result of the availability of natural resources.
Consequently, although raw FDI scores may be similar between these two groups of
countries, FDI in former countries point to a different level of national HC development
than FDI in later countries. Although in this study, oil-producing countries (OPEC states
and former USSR oil-rich states) and tax-havens (as defined by OECD), which
artificially skew FDI distribution toward resource-seeking FDI, were removed, there still
are multiple unaccounted factors, which introduce error into these results.
It appears that the currently available measures of FDI in a country may not be
very good measures from which to make a judgment about the country’s level of HC
development, if national HC is viewed in terms of not only school enrollment and basic
literacy, but in broad terms of nation-wide availability of economically-valuable skills
(which EHCI implies). Resource-seeking and market-seeking FDI requires only
availability of basic skills in the population of the host country, such as literacy. UNHCI
measures exactly these kinds of skills. Consequently, there is stronger relationship
between UNHCI and FDI than the relationship between EHCI and FDI. Potential

199
evidence for this proposition may be the fact that most Bstd coefficients in regressions
between FDI measures and independent variables (different combinations of HC-related
measures) have a negative sign. A negative sign indicates that FDI level decreases with
increased level of human capital. This fact, together with the fact that FDI has been
rising, provides evidence that most reported FDI is, in fact, resource-seeking or market-
seeking, and is not created-assets-seeking FDI, which requires a high level of HC (R&D
may serve an example of such kind of FDI).
Comparison of the Effect of UNHCI and EHCI-1 on the Economic Development
Variables (Simple Case)
The previous section provided some preliminary evidence for the significance of
ID, Family, and Character factors in terms of their ability to predict economic variables.
Therefore, these variables may be used as contributing variables to a new HC measure.
The benefit of expanding UNHCI by adding these variables to it was examined. This
section reports on the results of a simple case aggregation of the above mentioned
variables (ID, Family, and Character) with the currently used UNHCI to form an
expanded measure of HC (called EHCI-I). The effect of EHCI on economic measures
was then compared with effect of UNHCI on economic measures.
Results of Regression Analysis:
Export of Services (as Percent of the World Total) and HC Indices (UNHCI and EHCI-1)
In the analyses that follow, standardized parameter estimates were examined
instead of unstandardized parameter estimates because the goal of this study was to
200
assess the relative effects of independent variables (UNHCI and EHCI-1) on dependent
(economic) variables, rather than actual effect sizes caused by independent variables.
Regression analyses between a country’s export of services and 1) UNHCI; and 2) EHCI-
I were conducted. The export of services data was only available as an average for 2002-
2004 (United Nations Conference on Trade and Development, 2006) and 2003-2005
(United Nations Conference on Trade and Development, 2007). Therefore, all variables
employed in the study were used as 2002-2004 and 2003-2005 averages. Results of two
sets of regressions were compared:
1. Export of services as predicted by the UNHCI (average for 2002-2004) and
Export of services as predicted by the EHCI-I (average for 2002-2004).
2. Export of services as predicted by the UNHC index (average for 2003-2005)
and Export of services as predicted by the EHCI-I (average for 2003-2005).
The results indicate (Table 32) that UNHCI had significantly less explanatory
power in terms of predicting the level of a country’s export of services than EHCI-1. For
2002-2004, UNHCI could explain 8.3 percent of the variation in the export of services,
while the EHCI-1 could explain 60 percent. For 2003-2005, UNHCI accounts for 11.3%
of variation in this variable, while the EHCI-1 explains 53.2%.

201

202
The standardized coefficients for the linear term (Bstd) of UNHCI and for EHCI-1
were statistically significant predictors of export of services for both time periods
examined. However, EHCI-1 indicated a greater effect on the export of services by a
country than UNHCI. Specifically, one standard deviation change in UNHCI led to 0.299
standard deviation change in export of services, while EHCI-1 led to 0.778 change in
export of services (for 2002-2004 period). For 2003-2005, one SD change in UNHCI led
to 0.362 standard deviation change in export of services, and 0.738 SD change if EHCI-1
was used.
When compared to the currently utilized UNHCI, results of the F-statistics
indicated that utilizing EHCI-I significantly improves the regression model’s ability to
predict the level of services exported by a country. For 2002-2004, F-stat was 12.793 for
UNHCI and 126.873 for EHCI-1. For 2003-2005, those numbers were 7.396 and 40.753
respectively (tests were significant at p<0.01 or better).
(Multicollinearity and homoscedasticity statistics for this test were well within the norm.)
Therefore, for the time periods examined, EHCI-1 was a strong predictor of the
level of services that a country exports. It was a significantly stronger predictor than
UNHCI.
Results of Regression Analysis:
High-Value-Added Export (As the Percent of the Total Country Export) and HC Indices
(UNHCI and EHCI-I)
In the analyses that follow, standardized parameter estimates were examined
instead of unstandardized parameter estimates because the goal of the study was

203
assessing relative effects of independent variables (UNHCI and EHCI-1) on dependent
(economic) variables, rather than actual effect sizes caused by independent variables.
Regression analyses comparing high-value-added export as the percent of total
national exports and 1) UNHCI; and 2) EHCI-I were conducted. The high-value-added
export data were available for each year of the period of 2000-2005. Therefore,
regression tests were conducted for each year, and results of two sets of regressions were
compared: high-value-added export as predicted by UNHCI and high-value-added export
as predicted by EHCI-1.
The results indicate (Table 33) that UNHCI had less explanatory power toward
the level of a country’s export of high-value-added goods than EHCI-I. For each year of
the examined period (2000-2005), Adjusted R² statistics for EHCI-1 were comparatively
higher than for the UNHCI. For six years of the examined period on average, 18.5% of
the variation in the proportion of high-value-added export could be explained by variation
in UNHCI, while variation in EHCI-1 explained on average 25.4% of this variation
(Table 33). The standard coefficients for the linear term (Bstd) of UNHCI and EHCI-1
were positive for each of the six years, while also being statistically significant predictors
of the amount of high-value-added export for each year of the examined period.

204

205
At the same time, the values of the coefficients associated with EHCI-1 were higher than
the values of coefficients associated with the UNHCI for every year of the examined
2000-2005 period. On average, one standard deviation change in UNHCI led to 0.44 SD
change in high-value-added export, while a one SD change in EHCI-1 was associated
with 0.51 SD change in high-value-added export.
F-statistics is a measure of how much the model has improved the prediction of
the outcome compared to the level of inaccuracy of the model. Based on the F-statistics
results, a model with EHCI-1 is stronger than the model with UNHCI. For four of the six
years covering the 2000-2005 period, F-statistics were higher when EHCI-1 was used,
and for two years (2002 and 2004), they were higher when UNHCI was used. On
average, EHCI-1 improved the fit of the model by 37.68, while UNHCI improved the
quality of the model by 34.32 (all tests were significant at p<0.001). Multicollinearity
and homoscedasticity statistics for the test are well within the norm.
These results provide evidence that for the time periods examined, EHCI-1 was a
stronger predictor of the proportion of high-value-added products in a country’s total
exports than UNHCI.
Results of Regression Analysis:
Foreign Direct Investments and HC Indices (UNHCI and EHCI-I)
In the analyses that follow, standardized parameter estimates were examined
instead of unstandardized parameter estimates because this study’s goal was assessing the
relative effects of independent variables (UNHCI and EHCI-1) on dependent (economic)
variables, rather than actual effect sizes caused by independent variables. Regression

206
analyses between a country’s foreign direct investment (FDI) performance indices and 1)
UNHCI; and 2) EHCI-I were conducted. The FDI performance data were available for
each year of the 2000-2005 period. Therefore, regression tests were conducted for each of
the years, and results of two sets of regressions were compared: FDI performance as
predicted by the UNHCI and FDI performance as predicted by EHCI-1.
The results indicate (Table 34) that UNHCI and EHCI-1 were somewhat similar
in their abilities to predict investments in a country. UNHCI was significant four out of
six times (2000-2003 years), and EHCI-1 was significant three out of six times (2000-
2002) (p<0.01 or better). Out of the three years that EHCI-1 was significant, its adjusted
R² statistics were higher than this statistic for UNHCI for two years (0.128 vs. 0.126 in
2001 and 0.103 vs. 0.089 in 2002). UNHCI’s R² statistics were higher than this statistic
for EHCI-1 for two years as well (0.124 vs. 0.120 in 2000 and 0.061 vs. 0.033 (not sig) in
2003).
The standard coefficients for the linear term (Bstd) of UNHCI and EHCI-1 were
negative for each of the six examined years for UNHCI and for five years for EHCI-1.
Bstd associated with UNHCI was a statistically significant predictor of the amount of FDI
for four out of six examined years (2000-2003). It was a statistically significant predictor
of FDI for three out of six examined years for EHCI-1. At the same time, the values of
the coefficients associated with EHCI-1 were higher than the values of coefficients
associated with UNHCI. On average, a one SD change in UNHCI led to 0.34 SD change
in FDI, while a one SD change in EHCI-1 led to 0.36 SD change in FDI.

207

208
F-statistics is a measure of how much the model has improved the prediction of
the outcome compared to the level of inaccuracy of the model. Based on the F-statistics
results, EHCI-I did not improve the regression model’s ability to predict the amount of
FDI in a country better than the model with UNHCI. (Multicollinearity and
homoscedasticity statistics for the test were within the norm.)
Therefore, for the time periods examined, evidence was not provided to suggest
that EHCI-I was a stronger predictor of the FDI in a country than the UNHCI. There is
support for this finding in the examined literature, as discussed in the previous section.
Discussion
As the results reported in Tables 32-34 illustrate, adding the three components
(ID, Family, and Character) to UNHCI has made it more adequate to fulfill the role of
predicting the level of national economic development. EHCI-I had more explanatory
power than UNHCI in predicting national export of services and high-value-added
exports, while UNHCI and EHCI-1 had approximately similar explanatory power in
predicting the level of foreign investments in a country. Improved fit of the Expanded
Index model called for the need to examine significance of the contributing variables
inside the new index. The previous results need to be examined while controlling for the
influences of individual EHCI-1 composite variables on the outcome variables.

209
Examination of Significance of Composite Variables of EHCI-1 in Relation to Export of
Services Variable
Effect of the EHCI-I was examined while controlling for the influences of
individual EHCI-1 composite variables on the Export of Services variable. In order to
determine the statistical significance of variables comprising EHCI-I, a hierarchical
regression analysis between a country’s export of services and two variables comprising
EHCI-1 (UNHCI and the sum of ID, Character and Family factors) was conducted (Table
35). In hierarchical regression, predictors are selected based on past research and the
experimenter decides in which order to enter predictors into the model. As a general rule
(Field, 2006), predictors should be entered into the model based on their importance in
predicting the outcome. Because of the results of the previous test, three new variables of
the HCI (ID, Family, and Character) were added into the model first, and were followed
by adding UNHCI in the second step. The obtained results were compared with the
forced entry results, when all predictors were forced into the model simultaneously. The
results were identical.

210

211
The results indicated that UNHCI became insignificant in the presence of the
three additional factors (ID, Character, and Family). For 2002-2004, the standardized
coefficient of the linear term (Bstd) was much higher for the sum of ID, Character and
Family factors that for UNHCI (0.785 and -0.012 respectively). For 2003-2005, the
coefficients were 0.932 and -0.25 respectively. Furthermore, while the sum of the three
variables was significant (p<0.001) all the time, UNHCI was consistently insignificant
(although the whole EHCI-1 was significant). Ability of the model containing only the
sum of ID, Family, and Character factors to predict export of services variable, as
assessed by the AdjR² statistics, was higher than the ability of the model containing both
the sum of ID, Family, and Character factors and UNHCI for the period of 2002-2004.
AdjR² was 0.602 and 0.597 respectfully. Ability of the model containing both the sum of
ID, Family, and Character factors and UNHCI for the period of 2003-2005 was higher
than the ability of the model containing only the sum of ID, Family, and Character
factors. AdjR² was 0.542 and 0.558 respectfully. At the same time, adding UNHCI to the
sum of ID, Family, and Character factors reduced F-statistics from 42.454 to 23.055 (for
the period of 2003-2005) and did not change it for the period of 2002-2004.
(Multicollinearity and homoscedasticity statistics for this test were within the norm).
Therefore, for the time period examined, adding UNHCI as a separate factor to
the sum of ID, Family, and Character factors did not consistently improve the predictive
capacity of the model and added uncertainty to it.

212
Examination of Significance of Composite Variables of EHCI-1 in Relations to High-
Value-Added Export Variable
Effect of the EHCI-I was examined while controlling for the influences of
individual EHCI-1 composite variables on the High-Value-Added Export variable. In the
process, a hierarchical regression analysis between a country’s high-value-added export
and two variables comprising EHCI-1 (the sum of ID, Character, and Family variables
and the UNHCI) was conducted. In hierarchical regression, predictors are selected based
on past research and the experimenter decides in which order to enter predictors into the
model. As a general rule (Field, 2005), predictors should be entered into the model based
on their importance in predicting the outcome. Because of the results of the previous test,
three new variables of EHCI-1 (ID, Family, and Character) were added into the model
first, and were followed by adding UNHCI in the second step. The obtained results were
compared with the forced entry results, when all predictors were forced into the model
simultaneously. The results were identical.
The tests’ results indicated that UNHCI generally became insignificant in the
presence of the three additional factors (ID, Character, and Family). For four of the six
years covering the 2000-2005 period, UNHCI was insignificant, and it was significant for
two years (2002 and 2004) (Table 36). The standardized coefficient of the linear term
(Bstd) was much higher for the variable which is the sum of ID, Character and Family
factors than for UNHCI. It was 0.495, 0.521, 0.387, 0.485, 0.300, 0.654 for the sum of
the three factors for each of the consecutive year of the examined period; and it was
0.037, 0.052, 0.215, 0.074, 0.317, -0.141 for UNHCI for the same period. On average,

213

214

215

216
Bstd was 0.474 for the sum of the three factors, and it was 0.139 for UNHCI. In 2000 and
2001, the presence of UNHCI in EHCI slightly decreased explained variation in the high-
value-added export variable (from 26.9% to 26% and from 30.5% to 29.9%. In 2005, the
presence of UNHCI in EHCI did not change explained variation in the outcome factors,
and in 2002, 2004, and 2005 it increased it (from 24.2% to 26.8%, from 13.6% to 22.4%
and from 29.1% to 29.3% respectively). At the same time, the fit of the model (as
measured by F-statistics) decreased with the presence of UNHCI. For five years of the
examined period (except for 2003), it dropped from 37.316 to 18.525 (2000), from
44.485 to 22.144 (2001), from 33.174 to 19.507 (2002), from 18.812 to 17.320 (2004),
and from 48.173 to 24.797 (2005). In 2003, F-statistics didn’t change. (Multicollinearity
and homoscedasticity statistics for these tests were within the norm.)
Therefore, for the time period examined, adding UNHCI as a separate factor to
the sum of ID, Family, and Character factors did not consistently improve predictive
capacity of the model and added uncertainty.
Conclusion
The above discussion indicates that adding UNHCI as an individual variable into
the index reduced explained variation of the new index to some degree. Although the
earlier analyses provided evidence for less than full adequacy of UNHCI, this measure
was still important and needed to be kept. However, instead of adding certainty, the use
of UNHCI as an individual variable decreased explained variation in several examined
years. In order to keep UNHCI without a negative effect of reduced explained variation,
it was necessary to incorporate it into one of the newly suggested variables.

217
Comparison of the Effect of UNHCI and EHCI-II on the Economic Development
Variables (General Case)
The preceding section provides evidence for the need to create the new HCI
model not as a sum of UNHCI, ID, Family, and Character factors, but to incorporate
UNHCI into one of the three new variables. Keeping UNHCI as an individual variable in
the model added some uncertainty into the model. Concomitantly, UNHCI was still
important and needed to be retained. Incorporating UNHCI as part of one of the newly
suggested variables allowed for preserving this factor in the new HC measure without
adding the uncertainty connected to it. The “host” variable for UNHCI was chosen based
on the results of two statistical tests: factor analysis and correlation analysis. This section
reports on the results of the analyses, the choice of the “host” variable for UNHCI, and
the consequent creation of a new version of HCI (EHCI-II). The new HCI’s (EHCI-II)
effect on economic measures was then compared with the earlier version of EHCI
(EHCI-1), and with UNHCI’s effect on economic measures.
Results of Correlation Analysis: the Choice of the Variable to Include UNHCI
Three participating variables (ID, Family, and Character) were examined in order
to determine the variable where UNHCI would be added. Because this search was
ultimately a search for the highest association between UNHCI and another variable, two
statistical tests’ results appropriate for this task—factor loading in factor analysis and
coefficient in correlation analysis—were considered in the decision process.

218
Factor loading in factor analysis is a correlation between a particular variable and
the extracted factor where it is loaded. Squared factor loading is a variation in the factor,
which is explained by that particular variable (without holding other variables constant).
Therefore, squared factor loading is the amount of variation in the extracted factor that
can be explained by that particular variable (without holding other variables constant in
the extracted factor constant). Consequently, the variable with the highest loading (and
consequent highest squared loading) explains the biggest amount of variation in the
extracted factor (not holding other variables constant).
Correlation is the measure of linear relationship between variables. Correlation
coefficient signifies the degree of linear relationship between the two variables.
Consequently, the highest correlation coefficient between two variables signifies the
biggest degree of relationship between the two variables.
Factor analyses of the ID factor’s contributing variables plus UNHCI, the Family
factor’s contributing variables plus UNHCI, and the Character factor’s contributing
variables plus UNHCI were conducted in order to determine which variable had the
highest factor loading (and consequently explains the biggest amount of variation in the
extracted factor). Results reported in Table 37 indicate that UNHCI had the highest factor
loading in the Family variable.

219
Table 37. Comparison of Factor Loadings for ID + UNHCI, Family + UNHCI, and Character + UNHCI: 2000-2005 ID factor + UNHCI Family factor + UNHCI Character factor + UNHCI
2000 0.711 0.835 0.508 2001 0.633 0.831 0.543 2002 0.728 0.834 0.548 2003 0.623 0.843 0.590 2004 0.658 0.832 0.632 2005 0.662 0.851 0.562
A series of correlation tests between ID factor and UNHCI, Family factor and
UNHCI, and Character factor and UNHCI was conducted in order to determine which of
the three variables has the strongest relationship with UNHCI. Based on the results
reported in Table 38, the highest correlation coefficient between UNHCI and ID, Family
and Character factors was displayed by UNHCI-Family.
Table 38. Comparison of Correlation Coefficients Between National Identity Awareness Factor with UNHCI, Family Factor with
UNHCI, and Character Factor with UNHCI:
2000-2005
ID factor and
UNHCI
Family factor and UNHCI Character factor and UNHCI
2000 0.596* 0.723* 0.717*
2001 0.540* 0.718* 0.707*
2002 0.548* 0.725* 0.308*
2003 0.610* 0.737* 0.325*

220
Table 38. Continued
2004 0.427* -0.716 0.341*
2005 0.609* 0.742* 0.710*
Average 0.555 0.727 0.518
Note: * denotes significance at 0.05 level or better.
Therefore, it was determined that UNHCI would be viewed as a part of the Family factor.
The new factor coefficient of the Family factor was consequently the product of the
original Family variables and UNHCI. Thus, the new measure of HC (EHCI-II) consisted
of the original ID factor, original Character factor and the modified Family factor.
Appendix E (Table E-3) presents EHCI-II in non-standardized form. For standardization,
a simple score formula (United Nations Conference on Trade and Development, 2002)
was used:
Score = X i - X min
X max – X min
Appendix E (Table E-4) presents standardized EHCI-II (with scores ranging between 0
and 1).
Results of Regression Analysis:
Comparison Between Effects of UNHCI, EHCI-I, and EHCI-II on the Export of Services
Variable
In the analyses that follow, standardized parameter estimates were examined
instead of unstandardized parameter estimates because this study’s goal was assessing the

221
relative effect of independent variables on dependent (economic) variables, rather than
actual effect sizes caused by independent variables.
Regression analyses between the measure of Export of Services and 1) UNHCI;
2) EHCI-I; and 3) EHCI-II were conducted. The export of services data was only
available as an average for 2002-2004 (United Nations Conference on Trade and
Development, 2006) and 2003-2005 (United Nations Conference on Trade and
Development, 2007). Therefore, all variables in the study were used as 2002-2004 and
2003-2005 averages. Results of two sets of regressions were compared:
1. Export of services as predicted by the UNHCI (average for 2002-2004)
Export of services as predicted by the EHCI-I (average for 2002-2004)
Export of services as predicted by the EHCI-II (average for 2002-2004)
2. Export of services as predicted by the UNHCI (average for 2003-2005)
Export of services as predicted by the EHCI-I (average for 2003-2005)
Export of services as predicted by the EHCI-II (average for 2003-2005)
The results indicate (Table 39) that UNHCI possessed significantly less
explanatory power than EHCI-I or EHCI-II in terms of predicting the level of a country’s
export of services. Comparison between EHCI-I and EHCI-II indicated that for both
periods examined, EHCI-I and EHCI-II displayed strong explanatory power, although
EHCI-I displayed slightly stronger explanatory power than EHCI-II. For the 2002-2004
period, EHCI-I could explain 60 percent of the variation in the export of services, while
EHCI-II could explain 45.8 percent.

222

223
For 2003-2005, variation in EHCI-I could account for 53.2 percent of variation in
the export of services, while variation in the EHCI-II could account for 52.6 percent. On
average, as reported in Table 39, variation in UNHCI could explain 9.9 percent of
variation in export of services; variation in EHCI-I explained 56.6 percent, and variation
in EHCI-II explained 49.2 percent of variation in this economic measure.
The standardized coefficients of the linear term (Bstd) of both EHCI-I and EHCI-
II were statistically significant predictors of export of services for both periods examined.
However, EHCI-I had a stronger effect on the export of services by a country than EHCI-
II. Specifically, one standard deviation change in the EHCI-I led to 0.778 DS change in
the export of services, while the EHCI-II led to 0.681 SD change (for the 2002-2004
period). For 2003-2005 period, one SD change in EHCI-I led to 0.738 SD change in
export of services, and 0.735 SD when the EHCI-II was used. On average, as reported in
Table 40, one SD increase in UNHCI indicated 0.331 SD increase in export of services;
one SD increase in EHCI-I indicated 0.758 SD increase, and one SD increase in EHCI-II
indicated 0.708 SD increase in this measure.

224

225
The result of the F-statistics indicated that utilizing EHCI-I improved the ability
of the regression model to predict the level of export of services in a country relative to
the existing inaccuracy in the model better than when EHCI-II was employed. For 2002-
2004, F-statistics results were 127.079 for the EHCI-I and 80.304 for the EHCI-II. For
2003-2005, these numbers are 40.753 and 38.709 respectfully (p<.001).
(Multicollinearity and homoscdedasticity statistics for this test were within the norm.)
On average (Table 40), F-stat associated with UNHCI was 10.110, F-stat associated with
EHCI-I was 83.916, and F-stat associated with EHCI-II was 59.507.
Therefore, for the time periods examined, EHCI-I was the strongest predictor of
the level of services that a country exports. EHCI-II had slightly less explanatory power.
UNHCI revealed weak explanatory power as compared with the Expanded HC measures.
Results of Regression Analysis:
Comparison Between Effects of UNHCI, EHCI-I, and EHCI-II on the
High-Value-Added Export (as Percent of the Total Country Export) Variable
In the analyses that follow, standardized parameter estimates were examined
instead of unstandardized parameter estimates because this study’s goal was assessing the
relative effect of independent variables on dependent (economic) variables, rather than
actual effect sizes caused by independent variables.
Regression analyses between a country’s high-value-added export as percent of
the total country export and 1) UNHCI; 2) EHCI-I; and 3) EHCI-II were conducted. The
high-value-added export data were available for each year of the period 2000-2005.

226
Therefore, regression tests were conducted for each year, and results of three sets of
regressions were compared between:
High-value-Added Export as predicted by UNHCI
High-value-Added Export as predicted by the EHCI-I
High-value-Added Export as predicted by the EHCI-II
The results indicate (Table 39) that UNHCI had less explanatory power in terms of
explaining the proportion of high-value-added exports in total country exports than
EHCI-I and EHCI-II. For each year of the examined period (2000-2005), Adjusted R²
statistics in EHCI-I and EHCI-II were higher than this statistic for the UNHCI. For the
six years of the examined period, on average 18.5 percent of the variation in the
proportion of high-value-added export could be explained by variation in UNHCI, while
variation in EHCI-I explained on average 25.4 percent, and variation in EHCI-II could
account for 28.8 percent of variation (Table 39).
The standard coefficients for the linear term (Bstd) of each of the three variables
(UNHCI, EHCI-I, and EHCI-II) were positive for each of the six years, while being
statistically significant predictors of amount of high-value-added export for each year of
the examined period as well (p<0.001). At the same time, the values of coefficients
associated with UNHCI were lower than the values of coefficients associated with EHCI-
I and EHCI-II for every year of the examined 2000-2005 period. On average, one
standard deviation increase in UNHCI signified 0.435 SD increase in high-value-added
export (Table 41). On average, one SD increase in EHCI-I signified 0.507 SD increase in
this variable, and one SD increase in EHCI-II was associated with 0.542 SD increase in
this economic measure.

227
Based on the F-statistics results, on average, UNHCI improved the regression
model’s ability to predict the amount of high-value-added products in total country
exports by 34.32. For EHCI-I this number was 37.68, and for EHCI-II it was 44.077 (all
tests are significant at p<0.001 level). (Mutlicollinearity and homoscedasticity statistics
for the test were within the norm.) The results provide evidence that for the time period
examined, EHCI-II was the strongest predictor of the proportion of high-value-added
products in total country exports. UNHCI was the weaker predictor.
Results of Regression Analysis:
Comparison Between Effects of UNHCI, EHCI-I, and EHCI-II on the
Foreign Direct Investments Variable
In the analyses that follow, standardized parameter estimates were examined
instead of unstandardized parameter estimates because this study’s goal was assessing the
relative effect of independent variables on dependent (economic) variables, rather than
actual effect sizes caused by independent variables. Regression analyses between
countries’ foreign direct investments (FDI) performance indices and 1) UNHCI; 2)
EHCI-I; and 3) EHCI-II were conducted. The FDI performance data were available for
each year of the 2000-2005 period. Therefore, regression tests were conducted for each
year, and results of three sets of regressions were compared between:
FDI performance as predicted by UNHCI
FDI performance as predicted by the EHCI-I
FDI performance as predicted by the EHCI-II

228
The results indicate (Tables 39 and 40) that UNHCI had less explanatory power in terms
of explaining the level of foreign direct investments in the country than did EHCI-II.
Adjusted R² statistics as related to EHCI-II were higher than R² associated with UNHCI.
For the six years of the examined period, on average 7.3 percent of variation in FDI could
be explained by variation in UNHCI, while 8.9 percent could be explained by variation in
EHCI-II. Variation in EHCI-I could account for 6.6 percent in a country’s FDI variation.
The standard coefficients of the linear term (Bstd) for each of the three variables
were negative for each of the six years (except for one year for EHCI-I). Bstd as
associated with UNHCI was statistically significant for four out of six examined years.
For EHCI-I, it was significant for three years, and for EHCI-II it was significant for four
out of six examined years. At the same time, the values of coefficients associated with
UNHCI were lower that the values of coefficients associated with EHCI-I and EHCI-II.
On average, one standard deviation change in UNHCI signified 0.328 SD change in the
amount of foreign direct investments in a country (Table 39). On average, one SD change
in EHCI-I led to 0.361 SD change in FDI, and one SD change in EHCI-II led to 0.371 SD
change. F-statistics results were higher for UNHCI, than for EHCI-I and EHCI-II and
were 12.165, 9.626 and 10.543 respectfully (all tests were statistically significant at
p<0.01 or better). (Mutlicollinearity and homoscedasticity statistics for the test were
within the norm.)
The results provide evidence that for the time period examined, EHCI-II was the
strongest predictor of the amount of foreign investments that a country attracts.

229
Discussion
Based on the results reported and discussed above, EHCI-II, which consists of the
original ID and Character factors and the modified Family factor (which includes original
Family factor together with UNHCI), is the strongest predictor of the selected economic
variables. UNHCI is the weakest predictor. These results indicate the usefulness of
incorporating UNHCI into EHCI-II not as a separate variable, but as part of another
(Family) variable. This way, UNHCI does not diminish the results, but instead, increases
the strength of the component.
Summary
This chapter attempted to fulfill several goals:
• Examine the claim suggested by the literature that the currently used measures
of HC are not adequate, and are too narrow measures of the level of national
HC.
• Examine the claim suggested by the current study that the three latent
factors—National Identity Awareness, Character, and Family factors—may be
used as additional variables in a measure of national HC.
• Examine two types of HC Index. The first type (EHCI-I) was composed of
four individual variables: UNHCI, ID, Family, and Character. The second
type (EHCI-II) was composed of three variables: ID, Character, and a
modified Family factor, which was a combination of Family factor and
UNHCI.

230
These goals were reached via a series of regression analyses with economic
performance measures, theoretically known to be correlated with HC, as the predicted
variable, and the three types of HC indices, as well as their individual components as the
predictor variables. The analyses provided some evidence for ID, Family, and Character
factors to be significant predictors of economic performance variables. It also provided
evidence for the benefit of expanding the currently used UNHCI via these additional
variables. The newly created EHCI-II showed the most significant results as a predictor
of the output economic variables. Therefore, it is suggested that this HC measure is more
effective for measuring national HC.

231
CHAPTER V
DISCUSSION, CONCLUSIONS AND RECOMMENDATIONS
Introduction
There are seven major sections in this chapter. In the second section, the factor
analysis tests results are discussed and their summary is presented. These tests were
instrumental in the creation of the models of the three latent constructs, which were used
to create an expanded HC index. The third section presents analytical results of
regression tests. These tests helped compare newly created Expanded HC index with
United Nations HC index. The fourth section studies the implication of the current study
for academic research. The fifth section contains discussion of the implication of the
current study for practice. The sixth section presents recommendations and directions for
future research. In the final section, strengths and limitations of the study are provided.
This dissertation intended to cover the gap in knowledge about HC. More
specifically, it attempted to create a more complex HC index then the one currently used.
The study was based on the following facts:
1. There is no consensus in the research community about an exhaustive list of
specific indicators that are robust determinants of HC.
2. Even those indicators, which garner overall consensus as the ones that affect
HC, are often not easily empirically measured.
Therefore, there was a need for:
1. Establishing better consensus about what variables may be included as a part of
HC measurement tool.

232
2. Determining how these variables may be measured.
The study suggested three additional variables (National identity awareness in
population, Character qualities of population, and Family background) as the ones that
affect HC on national level, and therefore, may be employed in assessment of the level of
HC. The significance of each of these factors, as well as the whole new HCI which
incorporates them, were studied in relationship to the outcome economic variables.
General Summary
This section summarizes the results of the factor analysis statistical tests
conducted in the study. The result of these tests was the creation of preliminary models of
three latent constructs: National identity awareness in population, Character qualities of
population, and Family background. Literature-based explanation of loadings divergent
from the hypothesized loadings is also provided in this section.
National Identity Awareness Construct as Created by Factor Analysis
Based on the literature review, it was hypothesized that the national identity
awareness construct consisted of four factors: common norms, values and culture,
perception of collective destiny, common institutions, and perpetuation of common myths
and historic memories. Loading of variables on these four factors is discussed in the
following subsections.

233
Common Norms, Values and Culture Factor
Level of Government Consumption variable, although originally hypothesized to
be a part of Common Norms, Values, and Culture factor, did not load as hypothesized.
Instead, three out of six times it loaded on Common institutions/rights and duties for all
members factor. The literature search provided several possible reasons for this.
Government finances include cash payments for operating activities of the government in
providing goods and services, such as compensation of employees, interest and subsidies,
social benefits (World Development Indicators, 2006, p. 233). Through these channels, a
national government fulfills its responsibility to sustain and develop national institutions
(Alesina et al.,1999; Annett, 2001). Therefore, the relationship between central
government finances and institutions in a country appears as a key to the health of the
nation. At the same time, it is hard to generalize this relationship into a causal
relationship in a cross-country comparison. There are two major reasons for this: first, the
very nature of government bureaucrats who, as a group, are responsible for practical
implementation of a government’s role by overseeing and controlling national institutions
and responsible for practical provision of public goods. However, according to
Niskanen’s (1971) theory, bureaucrats maximize budgets beyond efficiency requirements
because a bureaucrat’s utility function does not necessarily include outcome efficiency
(Rolle, 2000). Therefore, quality of institutions in a country does not necessarily directly
and positively correlate with government consumption, as they produce outcomes in a
manner that is often economically ineffective. The second reason is corruption--the
reality that resources are intentionally misallocated to provide personal resources
(Kaufmann, 1998).

234
Ethnic, Linguistic, and Religious Cohesion variables consistently loaded together
and were named Common norms, values and culture variable, as hypothesized.
(ii) Perception of collective destiny
Number of Holidays that a Country Celebrates variable was hypothesized to be a
part of the Perpetuation of Common Myths and Historic Memories factor. However, it
loaded together with the Gini Coefficient variable and was identified as the Perception of
Collective Destiny factor. Logical support for such an outcome can be found by broadly
equating the meaning of two variables: Time of independence and Number of national
holidays in a country. The meaning of both is in strengthening citizens’ association with
the country.
The Number of Medals Won in Olympic Games variable was originally
hypothesized to be a part of Perpetuation of Common Myths and Historic Memories
factor. However, it did not load on this factor, but instead loaded (although only once) on
Perception of Collective Destiny factor. Such an outcome can be based on the broad
meaning of a sport game, which implies a drive toward a certain goal (victory) by a team
and its fans. Symbolically, populations can be viewed as fans of the respective countries’
Olympic teams. Cheering for a country’s team by a country during big international
competitions (such as the Olympic Games) creates the perception of a collective goal
among citizens (the country winning medals) and thus strengthens the nation-wide
perception of politico-socio-economic collective destiny and goals.

235
Common Institutions/Rights and Duties for All Members
School life expectancy variable was originally hypothesized to be a part of
Perpetuation of common myths and historic memories factor. As a result of factor
analysis, it loaded with the variables which were grouped together into the Common
institutions/Rights and duties for all members factor. Support for such loading was found
in the literature. This is consistent with the view of school as one of the strongest national
institutions, which serves as a channel of socializing people into citizens and perpetuation
of the existing socio-economic structure (Bernstein, 1975; Bourdieu, 1977, 1978;
Bourdieu & Passeron, 1990; Hofstede, 2001).
According to the theory of social and cultural reproduction (Bernstein, 1975;
Bourdieu, 1977, 1978; Bourdieu & Passeron, 1990), school is a conservative force that
helps students develop “master patterns” of thinking and behavior. School, theorized as
an institution responsive to an arbitrary class code, is accepted at all levels of the
educational system, which in turn legitimizes the perpetuation of social classes and
consequent politico-socio-economic behavior and practices of people (Bourdieu, 1978;
Nash, 1990; Van Zanten, 2005). Societal norms lead to development and pattern-
maintenance of institutions in society with particular structures and ways of functioning.
These include the family, education system, political system and legislation. These
institutions, once established, reinforce societal norms and conditions that led to their
establishment. Hofstede (2001) called it collective social programming or collective
programming of the mind. He argues that societies use education as a way of conserving
and passing on these mental programs. Therefore, those “mental programs” are passed to
children by way of education in which a society is interested. For example, a democratic

236
society passes on ideas and lessons of democracy to the younger generation; a totalitarian
society passes on ideas and lessons in obedience. Those who succeed in school end up
learning these lessons the best. Generally, those who do well in school end up getting
high-positioned jobs, perpetuating their long-learned beliefs now through creating,
implementing or supporting certain national policies. As a Japanese proverb states, “the
soul of a 3-year-old stays with him until he is 100” (Hofstede, 2001, p. 4).
Corruption perception index variable was also moved from the Perception of
collective destiny factor into Common institutions/rights and duties for all members
factor. Support for such an outcome was found in the literature in the ideas of La Porta et
al. (1998), Hofstede (2001) and Kaufmann (1998). They suggest that institutions are
those structures of a society which govern and regulate the way society operates. From
this standpoint, corruption may be considered as a modified sub-institution (although a
harmful one) in a society. It serves the goal of perpetuating the existing structure of a
society, and is supported by society in turn.
Level of Government Consumption variable, although originally hypothesized to
be a part of Common Norms, Values, and Culture factor, did not load as hypothesized.
Instead, three out of six times it loaded on Common institutions/rights and duties for all
members factor. This has been explained in the above sections.
Perpetuation of Common Myths and Historic Memories
Number of Years a Country Has Been Independent variable loaded together with
Number of Nobel Prize Laureates as hypothesized on Perpetuation of Common Myths
and Historic Memories factor. As discussed in Chapter III, the length of a country’s

237
actual independence may be positively correlated with the number of myths and
memories in a nation and their strength of presence in citizens’ awareness due to the time
factor. Number of Nobel Prize winners in a country nicely adds up to this, as Nobel Prize
winners are rare occasions (not as fleeting as sports victories). A Nobel Prize winner
becomes a permanent national hero, which in a sense is similar to the notion of national
myth and memory.
Character Qualities of Population in a Country Construct as Created by Factor Analysis
Character as Manifested in Public Life
The Eligible voters participating in national elections variable loaded as
hypothesized on Character as manifested in public life factor. The rest of the variables
that were hypothesized to load on this factor (International NGO membership density,
Independence of judicial system, Level of political rights in a country, and Level of civil
liberties in a country) did not load on this factor. Instead, Parliamentary seats held by
women and Reported police offenses variables loaded on this factor five and three times
respectfully. All of the variables that loaded together on this factor (Eligible voters
participating in national elections, Parliamentary seats held by women and Reported
police offenses) signify an active approach to citizenship and assuming personal
responsibility in influencing the activities of public institutions.
Character as Manifested in Private Life
Although several variables (Reported police offenses, Suicide rate, Prison
population and Attitude toward women in a society) were hypothesized to form

238
Character as manifested in private life factor, this factor did not load as hypothesized.
Only the prison population variable was retained in that factor (five out of six years
tested).
Environment Where Specific Population is Located
The loading of variables on the Environment where specific population is located
factor is consistent with Veenhoven’s (1993) model of assessment of the degree of
happiness in a country. According to Veenhoven (1993), this factor can be assessed by
the following measures: material comfort, social equality, freedom, and access to
knowledge. Loading of variables in this study represent good correspondence with this
model. The variables that loaded on this factor are as follows: Level of civil liberties and
political rights in a country, Independence of judicial system, Population above income
poverty rate, Attitude toward women in society (family, job), Expenditure on leisure and
recreation, International NGOs membership density. Absence of any variables to
indicate “access to knowledge” is explained by the fact that the researcher did not
incorporate any access to knowledge measures in order to avoid multicollinearity in the
next step of analysis.
A variable that does not fit this model (Inverse of suicide rate) can still be
considered as the one belonging to measures of happiness in a nation if the Economist
Intelligence Unit’s (EIU, 2005) more expanded model is used. The EIU’s model includes
such additional variables as health, family and community life, and job security. All of
these factors are known to reduce suicide rate thanks to their provision of social support

239
and connections to people, a powerful tool in suicide reduction (Suicide rate variable is
always negative in this factor).
Family Background Construct as Created by Factor Analysis
The Family factor was hypothesized to be constructed out of two measures:
Family as governing development of children and Family as meeting psychological needs
of all family members. Number of children in the family (and corresponding size of the
family) was hypothesized to be the most significant variable. This is consistent with an
economic approach to family and limited resources theory (Becker, 1995; Becker &
Tomes, 1976; Buchman, 2002; Mincer, 1974).
The factor of Family as meeting psychological needs of all family members was
hypothesized to be a separate factor proxied by the divorce rate variable. However, this
factor was not created during factor analysis, as all the variables loaded on one factor,
with the Number of children in the family having the highest loading. Number of single
parent households in a population variable is generally considered as describing family
type, while family income (and parents’ education) is generally considered as referring to
family background. Therefore, the factor created as a result of FA can be described as the
Family background factor.
Analytical Summary
Another result of the study is evidence provided for the usefulness of
incorporating latent variables into the HC index. This was accomplished via multiple
regression analysis tests. This section reports on the results of these tests.

240
Discussion of Regression Analyses Results
Overall, based on the results of this study, the EHCI-II seems to reflect the actual
state of human resources in a country better than UNHCI, and EHCI-1. As the test results
presented in the previous chapter indicate, EHCI-II generally has higher degrees of
correlation with the outcome variables, and has higher explanatory power than UNHCI or
EHCI-1. The fit of the model is also better when the EHCI-II is used than when UNHCI
or EHCI-1 are used.
EHCI-II and Export of Services Variable
According to the results of the tests reported in the previous chapter (Table 15),
adjusted R², which corresponds to the equation with EHCI-II and export of services
variable, is on average more than five times higher than the adjusted R² corresponding to
the equation with UNHCI and export of services variable. This indicates that EHCI-II can
explain more than five times more variation in the outcome variable than UNHCI.
The F-test associated with the use of EHCI-II is on average almost six times bigger than
the F-test corresponding to the use of UNHCI (both tests are significant). This indicates
that EHCI-II improves prediction of the outcome (compared to the level of inaccuracy in
the model) almost six times better than UNHCI. Standardized B coefficient between the
EHCI-II and the Export of Services variable is on average twice larger than the
standardized B coefficient between UNHCI and this variable (both statistics are
significant). These results indicate that based on the Export of Services variable, EHCI-II
has significantly more explanatory power than the UNHCI.

241
EHCI-II and a Country’s High-Value-Added Export Variable
According to the results of the tests reported in the previous chapter (Table 15),
Adjusted R² in the equation with EHCI-II and the high-value-added export variable is on
average 1.5 times higher than the adjusted R² in the equation with UNHCI and high-
value-added export variable. This indicates that EHCI-II can explain 1.5 times more
variation in the in the outcome variable than UNHCI. The F-test associated with the use
of the EHCI-II is on average 1.3 times larger than the F-test corresponding to the use of
the UNHCI (both tests are significant). This translates to EHCI-II predicting the outcome
(compared to the level of inaccuracy in the model) 30% better than the UNHCI.
Standardized B coefficient between EHCI-II and high-value-added products in the export
variable is on average 1.24 times (24 percent) larger than the standardized B coefficient
between UNHCI and this variable (both statistics are significant).These results indicate
that based on the high-value-added export variable, EHCI-II has more explanatory power
than UNHCI.
EHCI-II and Foreign Direct Investments Variable
According to the results of the tests reported in the previous chapter (Table 15),
adjusted R² in the equation with EHCI-II and the foreign investments variable is on
average 1.22 times larger (22 percent) than the adjusted R² in the equation with UNHCI
and foreign investments. The F-test associated with the use of EHCI-II is on average 15
percent smaller than the F-test corresponding to the use of UNHCI (both tests are
significant). This indicates that UNHCI improves prediction of the outcome (compared to

242
the level of inaccuracy in the model) 15 percent better than EHCI-II. Standardized B
coefficient between EHCI-II and foreign investments variable is on average 1.13 times
(13 percent) larger than the standardized B coefficient between UNHCI and this variable
(both statistics are significant). These results indicate that based on the foreign direct
investments variable, EHCI-II has more explanatory power than UNHCI.
Conclusion
Overall, based on the reported results, the EHCI-II reflects the actual state of
human resources in a country significantly better than UNHCI. As the test results
indicate, EHCI-II generally has a higher degree of correlation with the outcome variables,
has higher explanatory power of the outcome variables and displays better fit of the
model than UNHCI.
Implications for Research
This study adds to the relevant research literature in several ways. Specifically, it
highlights the importance of intangible factors in measuring national HC development. It
shows that intangible characteristics of a country’s population affect its HC and
consequently, national economic development. Most importantly, this study suggests that
HC theory may be changed from the theory of distribution of individual/group education
and economic welfare to the theory of distribution of individual/group productive skills,
qualities, education and economic welfare. Moreover, this study created models of three
intangible factors (ID, Family, and Character) and suggested their empirical proxies. The
following subsections describe these contributions in more details.

243
Implications for HC Theory
The fundamental principle governing modern HC theory is the belief that people’s
learning capacities and educational achievements are as valuable in production of goods
and services as such conventional resources as physical and financial capital (Lucas,
1988, 1990). Consequently, modern HC theory is the theory of joint distribution of
education and earnings/economic welfare (Hartog, 2001; Psacharopoulos, 1988).
Although many factors other than education have been suggested to comprise HC,
measurement difficulties, as well as the measurement of their effect on production, have
kept HC theory in the boundaries of education-earnings distribution. Furthermore, a
sizable group of economists and educators hold a belief that education is the most
important part of HC, with other factors merely complementing it (Lau, Jamison &
Louat, 1991). This dissertation has provided some theoretical evidence toward the
importance of intangible qualities and skills of a population in shaping national HC. It
has also shown some statistically significant results toward the importance of these skills
and qualities in improved national production. Moreover, it provided evidence for the
selected intangible factors to be of a higher significance than education in terms of
producing economic results. Therefore, consistent with prior conceptual discussions by
economists and HRD scholars (Hartog, 2001; Heckman, 2000), this study supports the
expansion of HC theory from a theory of joint distribution of education and economic
welfare of population to a theory of joint distribution of skills, qualities, and education of
population and economic welfare.

244
Implications for HRD Research
As suggested by a group of HRD scholars and professionals (McLean, 2001;
2004; McLean, Bartlett, & Cho, 2003; Wang & McLean, 2007), national HRD and
international HRD should go beyond employment issues and include a host of other
considerations that have not typically been considered as human capital investment, such
as culture, community and many others. A view of the labor force only in terms of
unified “faceless” manpower greatly diminishes the diversity of ways training and
development can be conducted and HRD practices may be deployed and assessed.
Similarly resistance to embracing the importance of considering HRD issues at the
national and international level diminishes the potential to develop more effective
approaches to HRD related research and measurement. Consequently, such a view
significantly limits productivity frontiers that may be achieved if all aspects of HRD are
addressed. Much greater growth and productivity on corporate and national levels may be
achieved if these and other intangible human characteristics are addressed through
training and development. At the same time, few researchers have actually measured
these characteristics or organizational/national improvements associated with their
development (Cho & McLean, 2000; Nafukho et al., 2004).
In tandem with this suggestion, McLean (2007) emphasized the need to explore
diverse subfacets of HRD and investigate how national cultures influence national HRD.
He proposes that every country may have its own unique process of development of HRD
based on specific and unique characteristics of its citizens. This view is supported by a
United Nations expert group, which concluded that “an HRD Master Plan must be
sensitive to culturally-influenced change processes” (United Nations, 1994, p. 3), because
245
much depends on the culture and worldviews of the society, which looks for
improvement strategies. Additionally, a different view is expressed by Wang & Swanson
(2008), who proposed that a unified approach to HRD on national and international levels
needs to be achieved.
This dissertation has provided evidence that human capital on a national level is
formed not only by formal education, but by other diverse factors as well. Specifically,
this study assessed National Identity Awareness, Character most common in population,
and Family Background factor as factors contributing to HC development, and provided
some evidence toward the significance of these factors in HC. The proposed model
suggests a holistic approach to HC as it is influenced by many variables. Therefore, these
and other factors need to be taken into consideration by HRD professionals and scholars
in their pursuit of improving employee quality and increasing organizational
effectiveness. If people are considered as a form of capital for development, education,
training and development of national and corporate human resources needs to address a
wide range of human factors that affect production.
Implications for Educational Research
This dissertation provides support for the view expressed by a large group of
educational scholars and economists (e.g., Hanushek, 1997; Heckman, 2000, 2007) about
the importance of non-cognitive qualities in economic success of individuals. It argues
that other factors, for example, character qualities, social skills played important roles in
achieving personal well-being. Therefore, educational institutions need to pay as close
attention to providing opportunities for students to develop these traits as they do in

246
providing opportunities to develop academic skills. National Educational ministries need
to create national policies which will raise this issue to the national level. Thus, it would
not depend on the initiative and willingness of certain schools, but would be required for
all schools. Consequently, assessment of educational outcomes should not single out
academic achievement and drop-out rates as the major measures of school quality. Other
variables in line with the above discussion need to be employed in order to increase the
quality of assessment of education outcome.
Implications for Research of Development
This dissertation utilizes a highly complex set of latent variables from established
sources for cross-country time series assessment for a large sample. An array of research
attempting to incorporate latent variables into cross-country analysis mostly uses either
World Values Survey (Inglehart, 1998, 2004) or International Social Surveys Series
(2002, 2003) (Glaeser, Laibson, Scheinkman, & Soutter, 2000; Shulman, 2005).
Although very helpful, these surveys cover only a few countries. The maximum number
of countries that the latest and the most exhaustive (1999-2001) WVS surveyed was 81.
ISS generally has different sample sizes, which are even smaller than the one used in
WVS. It also does not collect data systematically. This presents severe limitations for the
number of countries (and time periods) that may be studied. Generally, studies attempting
cross-country comparisons or index creation overcome this problem by using small
samples of countries (based on available data), as well as using available but not
necessarily current indicators. For example,

247
• Nehru, Swanson, and Dubey (1995) created a database on human capital stock
for 85 countries using estimates of the stock of education in these countries.
• Cohen and Soto (2001) created a new set of data on HC using OECD and
UNESCO censuses on years of schooling per country for 95 countries (the
range of data used inconsistently for different countries: 1960-2010).
• Mankiw, Romer and Weil (1992) created a measure of HC for 121 countries,
using the percentage of the working-age population that is in secondary school
as the proxy for HC.
• Diener (1995) created a value-based index for measuring national quality of
life for 101 countries.
• Veenhoven (1993) created an indicator of happiness in nations for 55
countries.
• Ranis, Stewart and Samman (2005) attempted development of a new HDI
index for less than 100 countries using the data with a decade difference
between some indicators and the rest of the indicators.
• International Social Survey Program (ISSP) (a part of International Social
Survey Program Series) conducted a survey study on the perception of
national identity for 23 countries.
• Adelman and Taft-Morris (1967) assessed interdependence between the
economic growth of a country and its social, political and economic
characteristics for 74 countries, using available cross-country data as well as
expert interviews in case of the absence of data.

248
• Alesina et al. (2003) constructed ethnic-linguistic-religious fractionalization
indices for 190 countries. The indices were created for different years for
different countries (time span is 1979-2001), which makes it difficult to use
these indices for cross-country comparison or for future analysis.
• Annett (2000) calculated ethnolinguistic fractionalization for 150 countries
using pooled time-series cross section data for the index (range of data
used:1960s-1980s, whatever was available), and looked for its correlation
with his index of political instability (for 108 countries), created using 1996
measures.
• Di Pietro (2006) conducted cross-country comparison of interdependence
between average IQ level in a country and its socio-economic development
for 101 countries.
• The World Bank has been measuring of the global gender gap for the past few
years. Its results are aggregated into The Global Gender Gap Index. The 2006
Index is based on 115 countries, and the 2007 Index is based on 128 countries.
• Ganzeboom, Graaf, and Treiman (1992) created a Standard International
Socio-Economic Index of Occupational Status using 31 datasets, covering 16
nations for various years ranging from 1968 to 1982 for different countries.
• La Porta, Lopez-de-Silanes, Shleifer, and Vishny (1998) examined legal rules
covering protection of corporate shareholders and creditors in 49 countries.
The choice of variables and the number of countries for comparison can be
explained by a general lack of cross-country data. Generally, data on poor and developing
countries is scarce, while data on wealthy ones is abundant. Such a situation describes

249
even the most recent publications. To increase the sample of assessed countries, one often
needs to spend much time “digging for data” or estimate the missing values by
her/himself, using the definitions and methodologies used to calculate the existing
measures. Such a situation with data is not conducive to quality research that can benefit
poor and developing countries, which are the ones that need data-based policies most of
all. Such a situation demonstrates the pressing need for improvements in the availability
of relevant, reliable and timely statistics for all countries of the world.
A contribution of this dissertation to research of development is in its attempt to
incorporate current, readily available empirical measures for a significantly bigger
sample (N=163), which is the total population of independent world countries with
populations of 100,000+, for six consecutive years (2000-2005). Although not all 163
countries have data for each of the 31 variables used, the researcher made all possible
attempts to find or replace the missing data utilizing approaches described earlier.
Creation of Latent Variables out of Empirical Measures
Measuring intangible factors is often connected with difficulties and limitations
because of their non-physical nature. Generally, latent variables are qualitatively
measured, which requires a certain level of funding and research infrastructure. For
example, in 2003, National Identity Awareness was measured as a part of International
Social Survey Series (ISS) in a sample of 34 industrialized countries; in 2002, Family and
Gender Roles were evaluated with a sample of 34 highly developed nations. Many poor
and developing countries cannot afford this kind of research to be conducted
systematically, which negatively affects socio-economic policies implemented in these

250
countries. Therefore, there is a need to create measurement tools of latent factors by way
of utilizing easily accessible empirical measures. This dissertation created tools to assess
three variables in a country (national identity awareness of population, character qualities
of population, and families in the country) by using existing empirical measures.
Providing Evidence for Usefulness of Expanding Currently Used Narrow
Measures of HC
This study supports the group of researchers that find positive correlations
between national human capital and a country’s economic development, when human
capital is measured as a combination of literacy rate in a country, school enrollment rates
(primary, secondary and tertiary), and measures of national identity awareness, character
development of citizens, and family strength. Although this study used UNHCI as a base
for the creation of EHCI, the results of significance of EHCI in relation to UNHCI are
applicable to other HC measures. As extensively discussed in the Literature Review
(Chapter II), all currently used measuring tools of HC rely primarily on
education/training variables (incorporating different forms and combinations of these
variables). Modification of HC measures by intangible variables has not been done
before.
Implications for Practice
Findings from this dissertation may be applied in practice in several ways.
Specifically, they may assist national policy makers in their pursuit of creating policies

251
that improve the socio-economic condition of countries. The following subsections
describe these applications in more detail.
Affecting National Economic Development through Strengthening Citizens’ National
Identity Awareness
Based on the results of the study, intangible characteristics of a country’s
population cause significant modifications in the productivity of education that the
population possesses. Therefore, national policies aiming at quality improvement of
national human resources need to take into consideration these factors as well. Based on
the results of this study, resources allocated toward strengthening of families in a country,
strengthening citizen affiliation with the country, and improvement of the overall ethical
and democratic climate in a country will affect improvement of the quality of national
human resources.
Specifically, this research provides evidence that national identity awareness in
the nation affects the level of economic development of this nation. Linguistic, ethnic and
religious cohesion of the population are some of the factors that influence national
identity awareness. Increase in these variables lead to an increase in the national identity
awareness of people in a country. Out of these three measures, ethnic and religious
structures of the societal fabric are not flexible in the short run. However, linguistic
structure is more elastic. Therefore, one way to increase the level of national identity
awareness in a population (and consequently, the level of national socio-economic
development) is by increasing the level of linguistic cohesion in a society. This may be
achieved by, for example, enforcing the knowledge and use of one national language

252
together with the use of other different languages that exist in the country. Although
many groups in a country may have their own diverse mother tongues, there needs to be
one national language that all citizens in the country know and use.
The study shows that awareness of collective destiny within a country’s
population is positively affected by the number of memorable events (for example,
national holidays that are celebrated in a country, winnings at international sporting
events). This leads to a conclusion that one way to strengthen the level of citizens’
association with their country (and consequently, increase the level of socio-economic
development in the country) is by making sure such events are consistently conducted.
For example, a government may try to either add a number of meaningful national
holidays or improve the way the existing ones are celebrated. A government may also try
to invest more money in developing national athletes.
According to the findings of this study, perpetuation of historic memories in a
nation (which is positively associated with the level of national identity awareness)
depends on the number of Nobel Prize laureates in a country. Although it is very difficult
to affect this measure because of its uniqueness, national governments may try to use
similarly powerful, but less unique events, for example, paying more attention to raising
talented national artists (for example, musicians, painters, sculptors, etc) who can
represent the country internationally and whose achievements can stand the test of time.
253
Affecting National Economic Development through Influencing Citizens’ Character
Qualities
This research provides evidence that character qualities of a population affect the
level of economic development of this nation. Therefore, a possible way of improving
economic development of a country is through paying attention to the elements that
comprise this factor. More specifically, this goal can be achieved by influencing the
variables that affect this factor. This study provides evidence for importance of selected
variables toward Character factor. Consequently, these variables may attract the attention
of national policy makers attempting to design policies toward strengthening of socio-
economic development of a country. For example, specific policies may be designed,
which influence the overall environment in the country by creating policies aiming to
improve attitudes toward women in society; making sure that the national judicial system
is capable of making independent decisions; increasing election participation rates by
providing evidence in importance of a general population’s voice in the elections’
outcomes; increasing trust in institutions of the country and so on.
Affecting National Economic Development through Improving Status of Families in the
Country
This study shows that the condition of families in a country affects the level of
economic development of the nation. It establishes specific variables that affect the
Family background factor, and therefore, the economic development of a country.
Strengthening of families through paying attention to these specific variables may lead to
increased level of national economic development. More specifically, the Family factor

254
may be affected by increasing resources available to families with children. Moreover,
this factor may be affected by improving the living conditions of people in rural areas by
increasing business/educational/cultural infrastructure available to them and closing the
gap between rural and urban opportunities.
Implications for HRD Practitioners
This study is useful for HRD practitioners. Human resources of an organization
are the primary determinant of organizational success due to ever increasing competition
and changes in the employer-employee relationships (Egan, 2002; 2005; Egan, Upton,
Lynham, 2006). Much has been written on how to measure the value of human resources
(Fitz-Enz, 2000; Wang & Swanson, 2008). At the same time, measuring intangible
qualities of employees still requires additional research. This study supports the relevance
of national level considerations for HRD, having demonstrated how intangible qualities
of citizens may be incorporated into a measure of human capital of the country. A similar
approach may be suggested as a possible way of evaluating intangible qualities of
organizational or other levels of human resources.
Implication for Educational Practices
This research provides evidence that national economic welfare does not depend
only on the level of basic education of the population, but also on many other factors.
Specifically, this study shows that a population’s characteristics, such as its national
consciousness, strength of families, and general character, are of great importance as
well. National education policy-makers need to take this fact into consideration by

255
designing policies that promote the importance of not only educational skills and
competencies but also of those that aim to develop character qualities of students.
For international development practitioners and national governments, this study
provides some useful insights into how different intangible factors affect human capital
and the economic development of countries. It provides empirical evidence to support the
argument that investment in basic education only, as well as physical capital, is not
enough for improvement of the quality of national human resources and economic
development of countries. Attention needs to be devoted to intangible factors as well.
Implications for Future Research
The results of this dissertation indicate that EHCI-II is a better measure of
national HC than the currently used UNHCI. This tool provides more accurate
measurement of national HC than previous measures that used only education variables.
National identity awareness of the population, Strength of families in a country and
average Character of citizens of a country are important factors that affect a country’s
human capital and therefore positively augment the existing HC measure. Furthermore,
HC, as measured by the suggested variables, is an important determinant of many cross-
country economic measures. The results suggest that investment in improving a sense of
national identity in the population, strengthening families, and developing fundamental
character traits in people in the country can create the conditions under which a country’s
economic wellbeing will improve. This study creates preliminary models of the three
latent factors. These models may be further developed by employing the structural linear
modeling technique (SEM).

256
Schultz pointed out the extensively diverse nature of human capital. Although
there are many more that may be added to the index, this dissertation examined only three
new constructs (and their underlying elements), Therefore, it would be interesting to
conduct further research in this direction. For example, one of the variables mentioned
consistently as one affecting national HC is the variable of culture. This variable was not
included in this study in an attempt to keep the parsimonious character of the dissertation
(study of culture’s affect on national HC development is a very complex topic, has few
clear supporting measures within the scope of this global investigation, and could easily
comprise a separate dissertation). Furthermore, the results of this study may be used to
create a measurement tool for assessment of human resources level on a corporate level.
Strengths and Limitations of the Study
The major strength of this study is in its attempt to cover a broad range of
countries and utilize a significant number of empirical measures to describe them
consistently for the 2000-2005 period. This dissertation utilizes a large number of
variables (31) to develop a new HCI, while all the previous studies used significantly
fewer numbers of variables. Furthermore, this study employs a wide spectrum of
variables not commonly found in HC measures, and not only educational variables as in
the previous studies. Another strength of this dissertation is the large number of countries
it includes, which is the population of all independent countries with more than 100,000
citizens. Covering such a large number of countries allows for broad comparison of
countries. This is different from many previous studies, which generally cover fewer
states, and are often based on a sample of convenience based on readily available data.

257
Generally, data on poor and developing countries is scarce, while data on wealthy nations
is abundant. Such a situation with data is not conducive to quality research that can
benefit poor and developing countries, which are the ones that need data-based policies
most of all. To increase the sample of assessed countries, this study spent much time
“digging for data” and estimated the missing values using the definitions and
methodologies used to calculate the existing measures. Using data on six consecutive
years (2000-2005) adds to the overall strength of the dissertation. While many previous
studies utilized data on different years for different countries for the same variable, this
study made all possible efforts to use the data for the 2000-2005 years only. Furthermore,
this dissertation utilized measures, which are credible, easily accessible, measurable, and
available for all countries. Although using qualitative data may have been easier for
certain indicators, the researcher chose to use only quantitative data because of its
availability for most (especially poor) of the world’s countries. Another plausible quality
of this dissertation is that it used a large literature base for its theoretical framework.
More than 200 articles and books from reputed academic journals and publishing houses
were selected for inclusion in the study from a much larger pool of reviewed
publications.
There are also several limitations in this study. Limitations of the study are mainly
caused by availability and quality of data. One major limitation is in variation in
availability of data from different sources. Although some sources have data available for
all countries (for example, the World Bank, UNESCO), other sources (for example, ILO,
WHO) have data on a limited number of countries. The researcher looked for comparable
data across sources yet kept the purity of the study by making sure that only the data

258
created by the same methodology was used in the study. Sometimes, the researcher had to
estimate the data by herself, using the methodologies that were utilized to calculate the
available measures. Missing data from the data sources has been another major difficulty.
A source may have all world countries list-wise, but have missing data for some/many.
This necessitated the use of missing data substitutes such as calculated regional averages
and interpolation. Sometimes, country data reported even by the same source was
different in different editions of the publication. Another weakness is the fact that
indicators may have different meaning in different places, cultures, subcultures, et al.
Moreover, even within a given place, the meanings of indicators may change over the
course of time because of historical events, changes in norms, and political upheavals, to
name a few. Although all reasonable precautions were taken to use only comparable data,
some error inevitably was introduced.
Summary
Although a country’s political situation, potential economic risk, rule of law, and
available legal/business infrastructure have been named as the primary factors of its
economic development, it also has been argued that national human capital is quite
possibly more important. HC is a measure of the economic value of knowledge, skills,
abilities, attitudes and experiences of a citizenry—the “brain” behind all other
determinants. The level of development and quality of human capital is one of the most
important factors that differentiate between countries with similar geographic and natural
resources but do vary in terms of their socio-economic development.

259
An alternative method of measuring HC was formed herein by constructing an
expanded human capital index. Rigorous validation procedures have established this new
measure as more reliable in predicting national economic development. It can be utilized
for policy formation, which may bring positive changes to development in countries by
addressing areas that are of highest importance to national development and individual
well-being. The new variables suggested for inclusion in the index may attract the
attention of policy formulators in different countries in order to affect human resources
development of these countries in positive and effective ways.

260
REFERENCES
Adelman, I., & Taft-Morris, C. (1967). Society, politics and economic development.
Baltimore, MD: The John Hopkins Press.
Adelman, I., & Taft-Morris, C. (1972). The measurement of institutional characteristics
of nations: Methodological considerations. Journal of Development Studies, 8(3),
111-135.
Aghion, P., Caroli, E., & Garcia-Penalosa, C. (1999). Inequality and economic growth:
The perspective of the New Growth theories. Journal of Economic Literature,
37(4), 1615-1661.
Akerlof, G., & Canton, R. (2000). Economics and identity. The Quarterly Journal of
Economics, 115(3), 715-753.
Alesina, A., Baqir, R., & Easterly, W. (1999). Public goods and ethnic provisions.
Quarterly Journal of Economics, 114, 1243-1284.
Alesina, A., & La Ferrara, E. (2000). Participation in heterogeneous communities. The
Quarterly Journal of Economics, 115(3), 847-904.
Alesina, A., Devleeschauwer, A., Easterly, W., Kurlat, S., & Wacziarg, R. (2003).
Fractionalization. Journal of Economic Growth, 8, 155-194.
Alesina, A., & La Ferrara, E. (2005). Ethnic diversity and economic performance.
Journal of economic literature, 43(3), 762-800.
Almond, G., & Verba, S. (1963). The civic culture: Political attitudes and democracy in
five nations. Princeton: Princeton University Press.
Annett, A. (2000). Social fractionalization, political instability, and the size of
government. Retrieved October 15, 2007, from http://ssrn.com/abstract=879607

261
Appleton, S., & Teal, F. (1998). Human capital and economic development. Retrieved
May 10, 2007, from
http://www.afdb.org/pls/portal/docs/page/adb_admin_pg/documents/economicsan
dresearch/erp-39.pdf
Babbie, E. (2004). The practice of social research. Belmont, CA: Wadsworth/Thomson
Learning.
Badaracco, J. (1997). Defining moments: When managers must choose between right and
right. Boston: Harvard Business School Press.
Bagozzi, R. (1981). Evaluating structural equation models with unobservable variables
and measurement error: A comment. Journal of Marketing Research, 18, 375-
381.
Bagozzi, R., & Fornell, C. (1982). Theoretical concepts, measurements, and meaning. In
Fornell, C. (Ed.) A second generation of multivariate analysis (pp. 24-38). New
York: Praeger.
Baier, S., Dwyer, G., & Tamura, R. (2006). How important are capital and total factor
productivity for economic growth? Economic Inquiry, 44(1), 23-50.
Barrick, M. R., & Mount M. K. (1991). The big five personality dimensions and job
performance: A meta-analysis. Personnel Psychology, 44, 1-26.
Bar-On, R., Brown, J., Kirkcaldy, B., & Thome, E. (2000). Emotional expression and
implications for occupational stress: An application of the Emotional Quotient
Inventory. Personality and Individual Differences, 28, 1107-1118.
Bar-On, R, & Parker J. D. A. (2000). The handbook of emotional intelligence: Theory,
development, assessment, and application at home, San Francisco: Jossey-Bass.

262
Barro, R. (1991). Economic growth in cross-section of countries. Quarterly Journal of
Economics, 106, 407-444.
Barro, R., & Sala-i-Martin, X. (1995). Economic growth. Cambridge, MA: MIT Press.
Barro, R., & Lee, J. (2000). Data set for a panel of 138 countries. Retrieved October 10,
2006, from http://www2.cid.harvard.edu/ciddata.html
Barro R., & Lee, J. (2001). International data on educational attainment: Updates and
implications. Oxford Economic Papers, 53(3), 541-563.
Baster, N. (1972). Development indicators: An introduction. Journal of Development
Studies, 8(3), 2-20.
Beck, A., Steer, R., & Garbin, M. (1988). Psychometric properties of the Beck depression
inventory: Twenty-five years of evaluation. Clinical Psychology Review, 8, 77-
100.
Becker, G. (1962). Investment in human capital: A theoretical analysis. Journal of
Political Economy, 70, 9-49.
Becker, G. (1964). Human capital. New York, NY: National Bureau of Economic
Research.
Becker, G. (1993). Nobel lecture: The economic way of looking at behavior. Journal of
Political Economy 101, 385-409.
Becker, G. (1995). An economic analysis of fertility. In R. Febrero & P. Schwartz (Eds.)
The essence of Becker (pp. 241-273). Stanford University: Hoover Institution
Press Publication.
Becker, G., & Tomes, N. (1976). Child endowments and the quantity and quality of
children. Journal of Political Economy, 84(4-2), 143-162.

263
Becker, G., & Tomes, N. (1979). An equilibrium theory of distribution of income and
Intergenerational mobility. The Journal of Political Economy 87(6), 1153-1189.
Becker, G., & Tomes, N. (1986). Human capital and the rise and fall of families. Journal
of Labor Economics, 4(3), 1-39.
Benhabib, J., & Spiegel, M.(1992). The role of human capital in economic development:
Evidence from aggregate cross-country data. Journal of Monetary Economics, 34,
143-173.
Ben-Porath, Y. (1980). The F-connection: Families, friends, and firms and the
organization of exchange. Population and Development Review, 6(1), 1-30.
Bentler. P. (1980). Multivariate analysis with latent variables: Causal modeling. Annual
Review of Psychology, 31, 419-456.
Berkowitz, D., & Jackson, J. (2005). The Evolution of an economic and political middle
class in transition countries. Retrieved February 8, 2008, from
http://polisci.lsa.umich.edu/documents/jjackson/apsa05db.pdf
Bernstein, B. (1975). Class, codes and control: Toward a theory of educational
transmission. London: Routledge & Kegan Paul.
Blake, J. (1981). Family size and the quality of children. Demography, 18(4), 421-442.
Blau, F., & Kahn, L. (1996). International differences in male wage inequality:
Institutions versus marker forces. Journal of Political Economy, 104, 791-837.
Boettke, P., & Subrick, R. (2003). Rule of law, development, and human capabilities.
Chicago: University of Chicago.
Bollen, K. (1984). Multiple indicators: Internal consistency or no necessary relationship?
Quality and Quantity, 18, 377-385.

264
Bollen, K., & Lennox, R. (1991). Conventional wisdom on measurement: A structural
equation perspective. Psychological Bulletin, 110(2), 305-314.
Bonk, M. (Ed.). (2000). Worldmark Yearbook (Vols. 1-3). Farmington Hills, MI: The
Gale Group.
Booysen, F. (2002). An overview and evaluation of composite indices of development.
Social Indicators Research, 59, 115-151.
Bossert, W., D’Ambrosio, C., & LaFerrara, E. (2006). A generalized index of
fractionalization. Retrieved March 1, 2008, from ftp://ftp.igier.uni-
bocconi.it/wp/2006/313.pdf
Bourdieu, P. (1977). Cultural reproduction and social reproduction. In J. Karabel, & A.
Halsey, (Eds.), Power and ideology in education (pp. 487-511). New York:
Oxford University Press.
Bourdieu, P. (1978). Changes in the social structure and changes in the demand for
education. In S. Giner, & M. Archer (Eds.), Contemporary Europe: Social
structures and patters (pp.38-50). London: Routledge & Kegan Paul.
Bourdieu, P. (1986). The forms of capital. In J. Richardson (Ed.), Handbook of theory
and research for the sociology of education (pp.241-258). New York:
Greenwood.
Bourdieu, P., & Passeron, J. C. (1990). Reproduction in education, society and culture.
London: Sage Publications.
Bowles, S., Gintis, H., & Osborne, M. (2001). The determinants of earnings: A
behavioral approach. Journal of Economic Literature, 39(4), 1137-1176.

265
Buchmann, C. (2002). Measuring family background in international studies of
Education: Conceptual issues and methodological challenges. In A. Porter & A.
Gamoran (Eds.), Methodological advances in cross-national surveys of
educational achievement (pp. 150-197). Washington, DC: National Academy
Press.
Cameron, S., & Heckman, J. (1998). Life cycle schooling and dynamic selection bias:
Models and evidence for five cohorts of American males. Journal of Political
Economy, 106, 262-333.
Campbell, A., Converse, P., & Rodgers, W. (1976). The quality of American life. New
York: Sage.
Canovan, M. (1996). Nationhood and political theory. Cheltenham, UK: Edward Elgar.
Carneiro, P., & Heckman, J. (2003). Human capital policy. In B. Friedman (Ed.),
Inequality in America. What role for human capital policies? (pp. 71-241).
Cambridge, MS: MIT Press.
Cho, E., & McLean, G. (2000). Measures and indicators of intangibles for research
institutes and colleges: A literature review. In K. Kuchinke (Ed.), Proceedings of
the academy of human resource development (pp. 326-333). Baton Rouge, LA:
AHRD.
Cohen, D., & Soto, M. (2001). Growth and human capital: Good data, good results.
London: Centre for Economic Policy Research.
Coleman, J. (1988). Social capital in the creation of human capital. The American
Journal of Sociology, 94, S95-S120.

266
Cremer, J. (1986). Cooperation in ongoing organizations. Quarterly Journal of
Economics, 101, 33-49.
Daniels, M., Devlin, B., & Roeder, K. (1997). Of genes and IQ. In B. Devlin, S.
Fienberg, D. Resnik, & K. Roeder (Eds.), Intelligence, genes and success:
Scientists respond to the Bell Curve (pp.3-19). NY: Springer Verlag.
Dean, James (2000). Ukraine: Europe’s forgotten economy, Challenge, 43(6), 93-108.
Denzau, A., & North, D. (1994). Shared mental models: Ideologies and institutions.
Kyklos, 47, 3-31.
DeVries, R., & Zan, B. (1994). Moral children: Constructing a constructivist atmosphere
in early education. New York: Teachers College Press.
Diamantopoulos, A., & Winklhofer, H. (2001). Index construction with formative
indicators: An alternative to scale development. Journal of Marketing Research,
38, 269-277.
Dickey, S., Runchock, R. (Eds.) (2001). Worldmark Encyclopedia of the Nations. Detroit:
Thomson Gale.
Diener, E. (1995). A value based index for measuring national quality of life. Social
Indicators Research, 36, 107-127.
Diener, E., Sandvik, L., Seidlitz, L., & Diener, M. (1993). The relationship between
income and subjective well-being: Relative or absolute. Social Indicators
Research, 28, 195-223.
Diener, E., & Diener, C. (1995). The wealth of nations revisited: Income and quality of
life. Social Indicators Research, 36, 275-286.

267
Diener, E., & Suh, E. (1997). Measuring quality of life: Economic, social, and subjective
indicators. Social Indicators Research, 40, 189-216.
Dijkstra, G. A., & Hanmer, L. C. (2000). Measuring socio-economic gender inequality:
Toward an alternative to the UNDP gender-related development index. Feminist
Economics, 6(2), 41-75.
Di Pietro, W. (2006). Income per capita, health and cross-country IQ: An international
comparison. Applied Econometrics and International Development, 6(2), 5-14.
Drucker, P. (1999). Management challenges for the 21st century. New York: Harper
Collins Publishers.
Druskat, V., Wolff, S. (2001). Building the emotional intelligence of groups. The
Harvard Business Review, 79(3), 80-90.
Duijker, H., & Frijda, N. (1960). National character and national stereotypes.
Amsterdam: North-Holland Publishing Company.
Dunning, J. (1998). The changing geography of foreign direct investment: Explanations
and implications. In Kumar, N. (Ed.) Globalization, foreign direct investment and
technology transfer: Impacts on and prospects for developing countries (pp. 43-
91). London: Routledge.
Dunning, J., & Narula, R. (2004). Multinationals and industrial competitiveness.
Northampton, MA: Edward Edgar Publishing.
Durkheim, E. (2002). Moral education. Mineola, NY: Dover Publications.
Dyker, D., Nagy, A., Spilek, H. (2003). “East”— “West” networks and their alignment:
Industrial networks in Hungary and Slovenia, Technovation, 23, 603-616.

268
Easterly, W., & Levine, R. (1997). Africa’s growth’s tragedy: Policies and ethnic
divisions. Quarterly Journal of Economics, 111(4), 1203-1250.
Economic and Social Commission for Asia and the Pacific (2003). Statistical Yearbook
for Asia and the Pacific 2002. New York: United Nations Publications.
Egan, T. (2002). Organization development: An examination of definitions and
dependent variables. Organization Development Journal, 20(2), 59-70.
Egan, T. (2005). Creativity in the context of team diversity: Team leader perspective. In
Waight, C., and Egan, T. (Eds.). Underpinning of creativity in human resource
development. Advances in Developing Human Resources, 7(2), 207-225.
Egan, T., Upton, M., Lynham, S. (2006). Career development, loadbearing wall or
window dressing?: Exploring definitions, theories and prospects of HRD related
theory building. Human Resource Development Review, 5(4), 442-477.
Eke, S., & Kuzio, T. (2000). Sultanism in Eastern Europe: The socio-political roots of
authoritarian populism in Belarus. Europe-Asia Studies, 52(3), 523-547.
Euromonitor International (2005). European marketing data and statistics. Chicago, IL:
Euromonitor International, INC.
Euromonitor International (2006). International marketing data and statistics. Chicago,
IL: Euromonitor International, INC.
Fearon, J. (2003). Ethnic structure and cultural diversity by country. Journal of Economic
Growth, 8(2), 195-222.
Fidrmuc, J. (2000). Political support for reforms: Economics of voting in transition
countries. European Economic Review, 44, 1491-1513.
Field, A. (2005). Discovering statistics using SPSS. London: Sage Publications.

269
Fienburg, S., & Resnick, D. (1997). Reexamining the Bell Curve. In B. Devlin, S.
Fienberg, D. Resnik, & K. Roeder (Eds.), Intelligence, genes and success:
Scientists respond to the Bell Curve (pp.3-19). NY: Springer Verlag.
Fisher, I. (1906). The nature of capital and income. New York: The Macmillan
Company.
Fitz-Enz, J. (2000). The ROI of human capital. New York: American Management
Association.
Ford, J. (1997). Improving training effectiveness in work organizations. Lawrence
Erlbaum, Mahwah, NJ.
Fornell, C., & Bookstein, F. (1982). Two structural equation models: LISREL and PLS
applied to consumer exit-voice theory. Journal of Marketing Research, 19, 440-
452.
Franke, R., Hofstede, G., & Bond, M. (1991). Cultural roots of economic performance: A
research note. Strategic Management Journal, 12, 165-173.
Freeman, R. (1986). Demand for education. In O. Ashenfelter & R. Layard (Eds.),
Handbook of labour economics (pp.359-395). Amsterdam: North-Holland.
Freedom House International. (n.d.). Survey methodology. Retrieved May 5, 2008, from
http://www.freedomhouse.org/uploads/fop08/Methodology2008.pdf
Fukuyama, F. (1995). Trust. New York: Free Press.
Fukuyama, F., & Avineri, S. (1994). Comments on nationalism and democracy. In L.
Diamond & M. Plattner (Eds.), Nationalism, ethnic conflict and democracy. 23-
35. Baltimore, MD: The John Hopkins University Press.
Fullan, M. (2003). Change forces: With a vengeance. New York, NY: Routledge Falmer.

270
Gall, T. (Ed.). ( 2004). Worldmark Encyclopedia of the Nations (11th ed., Vols. 1-5).
Detroit, MI: Thomson Gale.
Gall, T., & Hobby, J. (2007). (Eds.) Worldmark Encyclopedia of the Nations (12th ed.,
Vols. 1-5). Detroit, MI: Thomson Gale.
Ganzeboom, L., De Graaf, P., & Treiman, D. (1992). A standard international socio-
economic index of occupational status. Social Science Research, 21, 1-56.
Gemmell, N. (1996). Evaluating the impacts of human capital stocks and accumulation
on economic growth: Some new evidence. Oxford Bulletin of Economics and
Statistics, 58(1), 9-28.
Gerber, T., & Hout, M. (1995). Educational stratification in Russia during the Soviet
period. American Journal of Sociology, 101, 611-660.
Glaeser, E., Laibson, D., Scheinkman, J., & Soutter, C. (2000). Measuring Trust. The
Quarterly Journal of Economics, 115(3), 811-846.
Glaeser, E., Scheinkman, J, & Shleifer, A. (2003). The injustice of inequality. Journal of
Monetary Economics: Carnegie-Rochester Series on Public Policy, 50(1), 199-
222.
Globerman, S., & Shapiro, D. (2002). Global foreign direct investment flows: The role of
governance infrastructure. World Development, 30(11), 1899-1919.
Godfrey, M. (1997). Introduction. In M. Godfrey (Ed.), Skill development for
international competitiveness (pp. xv-xxix). Cheltenham, UK: Edward Elgar.
Goldin, C., & Katz, L. (1999). Human capital and social capital: The rise of secondary
schooling in America. Journal of Interdisciplinary History, 29, 683-723.
Goleman, D. (1995). Emotional intelligence. New York: Bantam Books.

271
Goleman, D., Boyatsis, R., & McKee, A. (2002). Primal leadership. Boston: Harvard
Business School Publishing.
Graaf, P., & Huinink, J. (1992). Trends in measured and unmeasured effects of family
background on educational attainment and occupational status in the Federal
Republic of Germany. Social Science Research, 21, 84-112.
Granovetter, M., & Swedberg, R. (2001). Introduction to the second edition. In M.
Granovetter & R. Swedberg (Eds.), Sociology of economic life (pp.1-30). Boulder:
Westview Press.
Griliches, Z. (1997). Education, human capital, and growth: A personal perspective.
Journal of Labor Economics, 15(1), 330-344.
Groot, W., & Maassen, H. (2007). The effects of education on health. In. Hartog, J., & H.
Maassen (Eds.), Human capital: Advances in theory and evidence (pp. 65-81).
Cambridge: Cambridge University Press.
Guiso, L., Sapienza, P., & Zingales, L. (2006). Does culture affect economic outcomes?
Journal of Economic Perspectives, 20(2), 23-48.
Haller, A., & Portes, A. (1973). Status attainment process. Sociology of Education, 46,
51-91.
Hanson, J. (1996). Human capital and direct investments in poor countries. Explorations
in Economic History, 33(1), 86-106.
Hanushek, E. (1997). Assessing the effects of school resources on student performance:
An update. Educational Evaluation and Policy Analysis, 19(2), 141-164.
Hanushek, E. (2005). Why quality matters in education. Retrieved October 12, 2006,
from http://www.imf.org/external/pubs/ft/fandd/2005/06/hanushek.htm

272
Harbison, F., & Myers, C. (1964). Education, manpower, and economic growth. New
York: McGraw-Hill Book Company.
Harmon, C., Walker, I, & Westergaard-Nielsen, N. (2001). Education and earnings in
Europe. Cheltenham: Edward Elgar.
Harrison, L. E. (1992). Who prospers? New York: Basic Books.
Hartog, J. (2001). On human capital and individual capabilities. Review of Income and
Wealth, 47(4), 515-540.
Hartog, J., & Maasen van den Brink, H. (2007). Prologue. In J. Hartog & H. Maassen
(Eds.), Human capital: Advances in theory and evidence (pp.1-7). Cambridge:
Cambridge University Press.
Hartog, J., & Oosterbeek, H. (2007). What should you know about private returns to
education? In J. Hartog, & H. Maassen van den Brink, (Eds.). Human capital:
Advances in theory and evidence (pp. 7-20). Cambridge: Cambridge University
Press.
Hauser, R., & Goldberger, A. (1971). The treatment of unobservable variables in path
analysis. In H. Costner (Ed.), Sociological methodology (pp.81-117). San
Francisco: Jossey-Bass.
Hauser, R., Sewell, W. (1986). Family effects in simple models of education,
occupational status, and earnings: Findings from the Wisconsin and Kalamazoo
studies. Journal of Labor Economics 4(3), 83-115.
Haveman, R., Bershadker, A., & Schwabish, J. (2003). Human capital in the United
States from 1975 to 2000. Kalamazoo, MI: W.E. Upjohn Institute for
Employment Research.

273
Healy, T., & Cote, S. (2001). The well-being of nations: The role of human and social
capital. Paris, Center for Educational Research and Innovation: Organization for
Economic Cooperation and Development.
Heckman, J. (1995). Lessons from the bell curve. Journal of Political Economy, 103(5),
1091-1120.
Heckman, J. (2000). Policies to foster human capital. Research in Economics, 54, 3-56.
Heckman, J., Layne-Farrar, A., & Todd, P. (1996). Human capital pricing equations with
an application to estimating the effect of schooling quality on earnings. The
Review of Economics and Statistics, 78, 562-610.
Heckman, J., Stixrud, J., & Urzua, S. (2006). The effects of cognitive and noncognitive
Abilities on labor market outcomes and social behavior. Journal of Labor
Economics, 24(3), 411-482.
Heckman, J., & Cunha, F. (2007). The technology of skills formation. Paper presented as
American Economic Association Conference. Chicago, IL: Jan 5-7.
Hellman, J., Klich, J., Kaufman, D. (2000). Seize the state, seize the day: State capture
corruption and influence in transition. Washington, DC: World Bank.
Herrnstein, R., & Murray, C. (1994). The bell curve: Intelligence and class structure in
American life. New York: Free Press.
Hills, P., & Argyle, M. (2001). Emotional stability as a major dimension of happiness.
Personality and Individual Differences, 31, 1357-1364.
Hofstede, G. (1980). Culture’s consequences: International differences in work-related
values, Beverly Hills, CA: Sage.

274
Hofstede, G. (2001). Culture’s consequences: Comparing values, behaviors, institutions
and organizations across nations. Thousand Oaks, CA: Sage.
Hopkins, K., & Bracht, G. (1975). Ten-year stability of verbal and nonverbal IQ scores.
American Educational Research Journal, 12(4), 469-477.
Hoselitz, B. (1960). Sociological aspects of economic growth. New York: The Free Press
of Glencoe.
Howard, S., Dryden, J., & Johnson, B. (1999). Childhood resilience: Review and critique
of literature. Oxford Review of Education, 25(3), 307-323.
Inglehart, R. (1998). Human values and beliefs: A cross-cultural sourcebook, Ann Arbor,
MI: University of Michigan Press.
Inglehart, R. (2004) Human beliefs and values: A cross-cultural sourcebooh based on the
1999-2002 values surveys, Mexico: Siglo Editors.
International Social Survey Series (2003). National identity survey. Retrieved on May 25,
2008, from
http://www.gesis.org/en/data_service/issp/data/2003_National_Identity_II.htm
International Social Survey Series (2002). Family and gender roles survey. Retrieved on
May 25, 2008,
fromhttp://www.gesis.org/en/data_service/issp/data/2002_Family_III.htm
Jarvis, C., Mackenzie, S., & Podsakoff, P. (2003). A critical review of construct
Indicators and measurement model misspecification in marketing and consumer
research. Journal of Consumer Research, 30, 199-218.

275
Jaw, B., Yu PingWang, C., & Chen, Y. (2006). Knowledge flows and performance of
multinational subsidiaries: The perspective of human capital. International
Journal of Human Resource Management, 17(2), 225-244.
Jenkins, B., & Sofos, S. (1996). Nation and nationalism in contemporary Europe: A
theoretical perspective. In B. Jenkins & S. Sofos (Eds.), Nation and identity in
contemporary Europe (pp.7-30). New York, NY: Routledge.
Johnson, J. B., & Reynolds, H. (2005). Political science research methods.Washington,
DC: A Division of Congressional Quarterly Inc.
Jöreskog, K., & Goldberger, A. (1975). Estimation of a model with multiple indicators
and multiple causes of a single latent variable. Journal of the American Statistica
Association, 10, 631-639.
Kallmann, K. (1997). An introduction to social indicators and social reporting: A digest
of the literature. South Africa: University of Natal.
Kalotay, K. (2008). FDI in Bulgaria and Romania in the wake of EU accession. Journal
of East-West Business, 14(1), 5-39.
Kaufmann, D. (1998). Research on corruption: Critical empirical issues. In A. Jain (Ed.),
Economics of corruption (pp. 163-194). Boston: Kluwer Academic Publishers.
Kaufmann, D., Kraay, A., & Mastruzzi, M. (2007). Governance matters VI: Aggregate
and individual governance indicators 1996-2006. Washington D.C.: The World
Bank.
Kendrick, J. (1976). The formation and stock of total capital. New York: Columbia
University Press.

276
Kevane, J. (1997). Can there be an identity economics? Harvard, MS: Harvard Academy
for International and Area Studies.
Kluckhohn, C. (1954). Culture and behavior. New York: Free Press.
Knight, F. (1944). Diminishing returns from investment. The Journal of Political
Economy, 52(1), 26-47.
Knight, J. (1996). Human Capital in Economic Development. Oxford Bulletin of
Economics and Statistics, 58(1), 5-8.
Kogut, B., & Chang, S. (1996). Platform investments and volatile exchange rate: Direct
investments in the U.S. by Japanese electronic companies. The Review of
Economics and Statistics, 78(2), 221-231.
Kohlberg, L. (1973). The claim to moral adequacy of a highest stage of moral judgment.
The Journal of Philosophy, 70(18), 630-646.
Kohlberg, L. (1981). Essays on moral development: The philosophy of moral
development. San Francisco, CA: Harper & Row
Kotkin, J. (1993). Tribes. New York: Random House.
Korenman, S, & Winship, C. (2000). In K. Arrow, S. Durlauf, & S. Bowles (Eds.),
Meritocracy and inequality (pp.137-160). Princeton: Princeton University Press.
Krueger, A. (2002). Inequality, too much of a good thing. In Friedman, B. (Ed.),
Inequality in America. What role for human capital policies? (pp.1-77).
Cambridge, MS: the MIT Press.
Krugman, P. (1991). Geography and trade. Cambridge, MA: Leuven University Press
and MIT University Press.

277
Kuzio, T. (2000). Transition in post-communist states: Triple or quadruple? Politics,
21(3), 172-189.
Kuznets, S. (1961). Capital in the American economy: Its formation and financing.
Princeton, NJ: Princeton University Press.
Lal, D. (1996). The political economy of poverty, equity, and growth. Oxford: Clarendon
Press.
Lal, D. (1998). Unintended consequences. Cambridge, MS: MIT Press.
Landa, J. (1994). Trust, ethnicity and identity: Beyond the new institutional economics of
trading networks. Ann Arbor: University of Michigan Press.
La Palombara, J. (1963). Bureaucracy and political development. Princeton, NJ:
Princeton University Press.
La Porta, R., Lopez-de-Silanes, F., Scleifer, A., & Vishny, R. (1997). Trust in large
organizations. AEA Papers and Proceedings, 87(2), 310-321.
La Porta R., Lopez-de-Silanes, F., Scleifer, A., & Vishny, R. (1998). Law and finance.
The Journal of Political Economy, 106(6), 1113-1155.
La Porta R., Lopez-de-Silanes, F., Scleifer, A., & Vishny, R. (1999). The quality of
Government. The Journal of Law, Economics, & Organization, 15(1), 222-279.
Lau, L., Jamison, D., & Louat, F. (1991). Education and productivity in developing
countries: An aggregate production function approach. Washington, D.C.: The
World Bank.
Lester, P., Bishop, L. (2000). Handbook of tests and measurement in education and the
social sciences. Lanham, Maryland: The Scarecrow Press.

278
Levin, A., & Raut, L. (1997). Complementarities between exports and human capital in
economic growth: Evidence from the semi-industrialized countries. Economic
Development and Cultural Change, 46(1), 155-174.
Levine, R., & Renelt, D. (1992). A sensitivity analysis of cross-country growth
regressions. American Economic Review, 82, 942-963.
Lim, V. (2002). Money matters; An empirical investigation of money, face and
Confucian work ethic. Personality and Individual Differences, 35, 953-970.
Lindahl, M., & Canton, E. (2007). The social returns to education. In J. Hartog & H.
Maasen van den Brink (Eds.), Human capital: Advances in theory and evidence
(pp. 21-33). Cambridge: Cambridge University Press.
Lucas, R. (1988). On the mechanics of economic development. Journal of Monetary
Economics, 22(1), 3-42.
Lucas, R. (1990). Why doesn’t capital flow from rich to poor countries? American
Economic Review, 80(2), 92-96.
MacCallum, R., & Browne, M. (1993). The use of causal indicators in covariance
structure models: Some practical issues. Psychological Bulletin, 114(3), 533-541.
MacIntosh, R. (1998). Global attitude measurement: An assessment of the world values
survey postmaterialism scale. American Sociological Review, 63(3), 452-464.
Mankiw, G., Romer, D., & Weil, D. (1992) A contribution to the empirics of economic
growth. Quarterly Journal of Economics, 152, 407-437.
Margenau, H. (1950). The nature of physical reality: A philosophy of modern physics.
New York: McGraw-Hill.

279
Mason, D. (1995). Attitudes toward the market and political participation in the
postcommunist states. Slavic Review, 54(2), 385-406.
McCleary, R., & Barro, R. (2006). Religion and economy. Journal of Economic
Perspectives, 20(2), 49-72.
McGranahan, D. (1972). Development indicators and development models. Journal of
Development Studies, 8(3), 91-102.
McGranahan, D. (1995). Measurement of development: Research at the UN’s research
institute for social development. International Social Science Journal 143, 39-57.
McGue, M., Bouchard, T., Iacono, W., & Lykken, D. (1993). Behavioral genetics of
cognitive ability: A life-span perspective. In Plomin, R. and McClearn G. (Eds.),
Nature, nurture and psychology (pp.59-76). Washington, DC: American
Psychological Association.
McLean, G. (2001). Human resource development: Where are we going and how will we
get there? In D. Kress (Ed.), Proceedings of the 6th international ASHRM
conference (p. 229-236). Dammamm, Saudi Arabia: Al-Wafa Printing, for the
Arabian Society for Human Resource Management.
McLean, G. (2004). National human resource development: What in the world is it?
Advances in Developing Human Resources, 6(3), 269-275.
McLean, G. (2007). Déjá Vu, all over again. Human Resource Development
International, 10(4), 459-463.
McLean, G., Bartlett, K., & Cho, E. (2003). Human resource development as national
policy: Republic of Korea and new Zealand. Pacific-Asian Education, 15(1), 41-
59.

280
McLean, G., Yang, B., Kuo, M., Tolbert, A., & Larkin, C. (2005). Development and
initial validation of an instrument measuring managerial coaching skill. Human
Resource Development Quarterly, 16(2), 157-178
Mincer, J. (1958). Investment in human capital and personal income distribution. The
Journal of Political Economy, 66(4), 281-302.
Mincer, J., (1974). Schooling, experience and earnings. National Bureau for Economic
Research. New York: Columbia University Press.
Mincer, J., & Polachek, S. (1974). Family investment in human capital: Earnings of
women. In T. Schultz, (Ed.), Economics of the family (pp.397-430). Chicago, IL:
University of Chicago Press.
Mingione, E. & Goodrick, P. (1991). Fragmented societies: A sociology of economic life
beyond the market paradigm. Cambridge, MA: Blackwell Publishers.
Mody, A., & Srinivasan, K. (1998). Japanese and U.S. firms as foreign investors: Do they
march to the same tune? The Canadian Journal of Economics, 31(4), 778-799.
Mosteller, F. (1995). The Tennessee study of class size in the early school grades. The
Future of Children: Critical Issues for Children and Youth, 5, 113-127.
Mulligan, C., & Sala-i-Martin, X., (1997). A labor income-based measure of the value of
human capital: An application to the states of the Unites States. Japan and the
World Economy, 9, 159-191.
Nafukho, F., Hairston, N., & Brooks, K. (2004). Human capital theory: Implications for
human resource development. Human Resource Development International, 7(4),
545-551.

281
Nash, R. (1990). Bourdieu on education and social and cultural reproduction. British
Journal of Sociology of Education, 11(4), 431-447.
Neher, S. (2004). The world data. In K. Jacobs-Sparks (Ed.), Encyclopedia Britannica:
2004 Book of the year (pp. 499-853). Chicago, IL: Encyclopedia Britannica, Inc.
Neher, S. (2005). The world data. In K. Jacobs-Sparks (Ed.), Encyclopedia Britannica:
2005 Book of the year (pp. 499-855). Chicago, IL: Encyclopedia Britannica, Inc.
Neher, S. (2006). The world data. In K. Jacobs-Sparks (Ed.), Encyclopedia Britannica:
2006 Book of the year (pp. 499-853). Chicago, IL: Encyclopedia Britannica, Inc.
Neher, S., PeBenito, M., & Sturgis, J. (2000). The world data. In C. Trumbull (Ed.),
Encyclopedia Britannica: 2000 Book of the year (pp. 531-885). Chicago, IL:
Encyclopedia Britannica, Inc.
Neher, S., PeBenito, M., & Sturgis, J. (2001). The world data. In C. Trumbull (Ed.),
Encyclopedia Britannica: 2001 Book of the year (pp. 531-883). Chicago, IL:
Encyclopedia Britannica, Inc.
Neher, S., PeBenito, M., & Sturgis, J. (2002). The world data. In C. Trumbull (Ed.),
Encyclopedia Britannica: 2002 Book of the year (pp. 531-885). Chicago, IL:
Encyclopedia Britannica, Inc.
Nehru, V., Swanson, E., & Dubey, A. (1995). A new database on human capital stock in
developing and industrial countries: Sources, methodology, and result. Journal of
Development Economics, 46, 379-401.
Nelson, R., & Phelps, E. (1966). Investment in humans, technological diffusion, and
economic growth. American Economic Review, 56(1-2), 69-75.

282
Noorbakhsh, F., Paloni, A., & Youssef, A. (2001). Human capital and FDI inflows to
developing countries: New empirical evidence. World Development, 29(9), 1593-
1610.
Organization of Economic Cooperation and Development. (n.d.). Investment Compact
for south east Europe. Retrieved October 10, 2006, from
www.investmentcompact.org
Overstreet, H. (1954). The mature mind. New York, NY: W-W-Norton Company-INC.
Pedhazur, E., & Schmelkin, L. (1991). Measurement, design, and analysis: An integrated
approach. Hillsdale, NJ: Lawrence Erlbaum Associates Publishers.
Piaget, J. (1997). The moral judgment of the child. New York, NY: Free Press.
Pigou, A. (1950). The economics of welfare. London:
Plomin, R. (1999). Genetics and general cognitive ability. Nature, 402, 25-29.
Plug, E. (2007). Are successful parents the secret to success? In J. Hartog & H. Maasen
van den Brink (Eds.), Human capital: Advances in theory and evidence (pp. 81-
101). Cambridge: Cambridge University Press.
Plug, E., & Vijverberg, W. (2003). Schooling, family background, and adoption: Is it
nature or is it nurture? Journal of Political Economy, 111, 611-641.
Porter, M. (1998). The competitive advantage of nations. New York: The Free Press.
Prizel, I. (1998). National identity and foreign policy. Cambridge, UK: Cambridge
University Press.
Psacharopoulos, G. (1988). Education and development: A review. World Bank Research
Observer, 3, 99-116.

283
Psacharopoulos, G., & Woodhall, M. (1985). Education for development: An Analysis of
investment choices. Oxford: Oxford University Press.
Psacharopoulos, G., & Arriagada, A. (1986). The educational composition of the labour
force: An international comparison. International Labour Review, 125(5), 561-
574.
Putnam, R. (1995). Making democracy work: Civic traditions in modern Italy. Princeton,
NJ: Princeton University Press.
Ranis, R., Stewart, F., & Samman, E. (2005). Human development: Beyond the HDI.
New Haven, CN: Economic Growth Center.
Reisinger, W., Miller, A., Hesli, & Maher, K. (1994). Political values in Russia, Ukraine
and Lithuania: Sources and implications for democracy. British Journal of
Political Science, 24(2), 183-223.
Richards P., & Amjad, R. (1994). New approaches to manpower planning and analysis.
Geneva: International Labor Organization.
Rodrik, D. (1997). What drives public employment? Cambridge, MS: National Bureau of
Economic Research.
Rolle, A. (2000). Matching to the beat of a different drum: An empirical analysis of
public school corporations as budget-maximizing bureaus. Ann Arbor, MI: UMI
Dissertation Services, A Bell & Howell Company.
Romanenko, Y. (2007). What will the next revolution be like? Retrieved October 12,
2007, from http://www.pravda.com.ua/news
Romer, P. (1989). Human capital and growth: Theory and evidence. National Bureau of
Economic Research. Working paper No 3173. Cambridge, MA.

284
Romer, P. (1990). Endogenous technological change. Journal of Political Economy,
98(5), 71-102.
Rose, R. (Ed.). (2000). International Encyclopedia of Elections. Washington, DC:CQ
Press.
Rustow, D. A. (1970). Transitions to democracy: Toward a dynamic model Comparative
Politics, 2(3), 350-360.
Sadie, J. (1960). The social anthropology of economic underdevelopment. Economic
Journal, 70, 290-301.
Sapford, R., & Abbott, P. (2006). Trust, confidence and social environment in post-
communist societies. Communist and Post-Communist Studies. 39, 59-71.
Schneider, F., & Frey, B. (1985). Economic and political determinants of foreign direc
investment. World Development, 13, 161-175.
Schultz, T. (1961). Investment in human capital. The American Economic Review, 51, 1-
17.
Schultz, T. (1962). Reflections on investment in man. Journal of Political Economy, 70,
1-8.
Schultz, T. (1971). Investment in human capital. New York: NY: The Free Press.
Schultz, T. (1974). Fertility and economic values. In T. Schultz (Ed.), Economics of the
family: Marriage, children, and human capital (pp. 3-25). Chicago: University of
Chicago Press.
Schultz, T. (1981). Investing in people: The economics of population quality. Berkeley,
CA: University of California Press.

285
Schultz, T. (1986). The changing economy and the family. Journal of Labor Economics.
4(3-2), 278-287.
Sen, A. (1985). Goals, commitment, and identity. Journal of Law, Economics and
Organization, 1, 341-355.
Sen, A. (1986). Rationality, interest and identity. In A. Foxley (Ed.), Development
democracy, and the art of trespassing (pp. 343-353). Notre Dame: University of
Notre Dame Press.
Sewell, W., Haller, A., & Portes, A. (1969). The educational and early occupational
attainment process. American Sociological Review, 34, 82-92.
Shleifer, A., Vishny, R. (1993). Corruption. Quarterly Journal of Economics. 58(3), 599-
617.
Shulman, S. (2005). National identity and public support for political and economic
reform in Ukraine. Slavic Review, 64(1), 59-88.
Sjaastad, L. (1962). The costs and returns on human migration. The Journal of Political
Economy, 70, 80-93.
Solow, R. (1956). A contribution to the theory of economic growth. Quarterly Journal of
Economics, LXX, 65-94.
Solow, R.(1988). Growth theory. New York: Oxford University Press.
Solow, R. (2000). Human capital: The Lucas model. UK: Oxford University Press.
Smith, A. (1937). An inquiry into the nature and causes of the wealth of nations. New
York: Random House. (Original work published 1776).
Smith, A. (1991). National identity. Reno, Nevada: the University of Nevada Press.

286
Smith, A. (2005). Foreign direct investments and international trade. In D. Turnock & F.
Carter (Eds.), Foreign direct investment and regional development in East
Central Europe and the Former Soviet Union (pp. 55-71). Burlington, VT:
Ashgate Publishing Company.
Spengler, J. (1977). Adam Smith on human capital. The American Economic Review,
67(1), 32-36.
Stapleton, L., & Garrod, G. (2007). Keeping things simple: Why the human development
index should not diverge from its equal weights assumption. Social Indicators
Research, 84, 179-188.
Stevens, J. (1992). Applied multivariate statistics for the social sciences. Hillsdale, NJ:
Erlbaum.
Stigler, G. (1962). Information in the labor market. The Journal of Political Economy, 70,
94-105.
Sztompka P. (1999). Trust: A sociological theory. Cambridge, MA: Cambridge
University Press.
Sztompka, P. (2002). Cultural trauma: The other face of social change. European Journal
of Social Theory, 3, 441-465.
Thomas, K. (1996). The defensive self: A psychodynamic perspective. In R. Stevens
(Ed.), Understanding the self (pp. 281-338). Thousand Oaks, CA: Sage
Publications.
Turiel, E. (1983). The development of social knowledge: Morality and convention. New
York: Cambridge University Press.

287
Turkheimer, E., Haley, A., Waldron, M.,& D’Onofrio, B. (2003). Socioeconomic status
modifies heritability of IQ in young children. Psychological Science, 14(6), 623-
628.
United Nations. (1994). Changing perspectives on human resource development.
Retrieved July 20, 2008, from
http://unpan1.un.org/intradoc/groups/public/documents/un/unpan000116.pdf
United States Agency for International Development Program Office. (2006). Monitoring
Country progress in Eastern Europe & Eurasia. Retrieved November 20, 2006,
from
http://www.usaid.gov/locations/europe_eurasia/country_progress/ninth/sc.pdf
United Nations Conference on Trade and Development. (2002). World investment report.
Geneva: Printing Office.
United Nations Conference on Trade and Development. (2003). World investment report.
Geneva: Printing Office.
United Nations Conference on Trade and Development. (2004). World investment report.
Geneva: Printing Office.
United Nations Conference on Trade and Development. (2005). World investment report.
Geneva: Printing Office.
United Nations Conference on Trade and Development. (2006). World investment report.
Geneva: Printing Office.
United Nations Conference on Trade and Development. (2007). World investment report.
Geneva: Printing Office.

288
United Nations. (2007) United Nations e-government knowledge base. Retrieved on
March 1, 2008, from
http://www.unpan.org/egovkb/egovernment_overview/humancapital.htm
United Nations Department of Economics and Social Affairs. (2003). E-Government
Report. Retrieved on November, 5, 2006, from
http://www.unpan.org/egovkb/egovernment_overview/humancapital.htm
United Nations Statistics Division. (n.d.). Retrieved on April 3, 2008 from
http://unstats.un.org/unsd/default.htm
Van Zanted, A. (2005). New modes of reproducing social inequality in education: The
changing role of parents, teachers, schools and educational policies. European
Educational research Journal, 4(3), 155-169.
Veenhoven, R. (1993). Happiness in nations. Rotterdam, Netherlands: Erasmus
University of Rotterdam.
Velychenko, S. (1993). Shaping identity in eastern Europe and Russia. New York, NY:
St. Martin’s Press.
Vigdor, J. (2002). Interpreting ethnic fragmentation effects. Economic Letters, 75, 271-
276.
Vitterso, J. (2001). Personality traits and subjective well-being: Emotional stability, not
extraversion, is probably the important predictor. Personality and Individual
Differences, 31, 903-914.
Vogel, J. (1989). Social indicators: A Swedish perspective. Journal of Public Policy,
9(4), 439-444.

289
Wang, X., & McLean, G. (2007). The dilemma of defining international human resource
development. Human Resource Development Review, 6(1), 96-108.
Wang, G., & Swanson, R. (2008). The idea of national human resource development: An
analysis based on economic and theory development methodology. Human
Resource Development Review, 7(1), 79-106.
Warner, A. (2002). International wage determination and globalization. Paper presented
at the NBER conference on Labor and Global Economy, May 30 2002, Helsinki,
Finland.
Weisbrod, B. (1961). The valuation of human capital. The Journal of Political Economy,
69, 425-436.
Welch, F. (1965). Human capital theory: Education, discrimination, and life cycles. The
American Economic Review, 65(2), 63-73.
Werner, E., & Smith, R. (1992). Overcoming the odds. High risk children from birth to
adulthood. Ithaca: Cornell University Press.
Wolfmayr-Schnitzer, Y. (1998). Trade performance of CEECs according to technology
classes. In Organization of Economic Cooperation and Development (Ed.), The
competitiveness of transition economies (pp.41-70). Paris: OECD Publishing.
Wooldridge, J. M. (2006). Introductory econometrics. Mason, OH: Thomson Higher
Education.
World Bank. (2006). World Development Indicators. Retrieved December 8, 2006, from
http://devdata.worldbank.org/wdi2006/contents/
World Bank. (2007). The global gender gap index (2006). Retrieved January 29, 2008,
from http://www.weforum.org/pdf/gendergap/rankings2007.xls

290
World Health Organization. (2007). World health indicators. Retrieved March 7, 2008
from http://www.who.int/
Wright, D. (1997). Understanding statistics: An introduction for the social sciences.
London: Sage.

291
APPENDIX A
Tests for Factor Analysis Adequacy
Table A-1 National Identity Factor
2000
2001 2002 2003 2004 2005 Average
KMO
0.760 0.750 0.742 0.742 0.759 0.761 0.752
Bartlett’s test of
Sphericity
Sig. 0.000 (p<0.001)
Sig. 0.000 (p<0.001)
Sig. 0.000 (p<0.001)
Sig. 0.000 (p<0.001)
Sig. 0.000 (p<0.001)
Sig. 0.000 (p<0.001)
Sig. 0.000 (p<0.001)
Table A-2 Character Factor
2000
2001 2002 2003 2004 2005 Average
KMO
0.846 0.855 0.823 0.822 0.831 0.834 0.835
Bartlett’s test of Sphericity
Sig. 0.000 (p<0.001)
Sig. 0.000 (p<0.001)
Sig. 0.000 (p<0.001)
Sig. 0.000 (p<0.001)
Sig. 0.000 (p<0.001)
Sig. 0.000 (p<0.001)
Sig. 0.000 (p<0.001)
Table A-3 Family Factor
2000 2001 2002 2003 2004 2005 Average
KMO
0.710 0.691 0.701 0.699 0.697 0.703 0.700
Bartlett’s test of Sphericity
Sig. 0.000 (p<0.001)
Sig. 0.000 (p<0.001)
Sig. 0.000 (p<0.001)
Sig. 0.000 (p<0.001)
Sig. 0.000 (p<0.001)
Sig. 0.000 (p<0.001)
Sig. 0.000 (p<0.001)

292
APPENDIX B
Factor Analysis Tests
ID Factor
Table B-1 Total Variance explained for the ID Factor (2000)
Initial Eigenvalues Rotation Sums of Squared Loadings
Component Total % of Variance Cumulative % Total % of Variance Cumulative % 1 4.743 36.486 36.486 3.775 29.036 29.036 2 1.697 13.056 49.542 1.849 14.226 43.262 3 1.512 11.632 61.174 1.785 13.734 56.996 4 1.029 7.913 69.087 1.572 12.091 69.087 5 .870 6.689 75.777 6 .794 6.111 81.887 7 .600 4.614 86.501 8 .461 3.550 90.051 9 .432 3.320 93.370 10 .326 2.507 95.877 11 .257 1.975 97.853 12 .201 1.545 99.398 13 .078 .602 100.000
Table B-2 Total Variance explained for the ID Factor (2001)
Initial Eigenvalues Rotation Sums of Squared Loadings Component Total % of Variance Cumulative % Total % of Variance Cumulative % 1 4.689 36.067 36.067 3.904 30.034 30.034 2 1.656 12.736 48.803 1.843 14.176 44.210 3 1.517 11.670 60.474 1.675 12.882 57.092 4 1.073 8.255 68.729 1.513 11.637 68.729 5 .864 6.648 75.377 6 .809 6.221 81.597 7 .621 4.778 86.376 8 .477 3.668 90.044 9 .427 3.282 93.326 10 .335 2.574 95.900 11 .269 2.072 97.972 12 .195 1.503 99.475 13 .068 .525 100.000

293
Table B-3 Total Variance explained for the ID Factor (2002)
Initial Eigenvalues Rotation Sums of Squared Loadings
Component Total % of Variance Cumulative % Total % of Variance Cumulative % 1 4.632 35.632 35.632 3.684 28.337 28.337 2 1.660 12.772 48.404 1.864 14.336 42.673 3 1.492 11.476 59.880 1.785 13.727 56.400 4 1.082 8.326 68.207 1.535 11.807 68.207 5 .924 7.110 75.316 6 .815 6.268 81.584 7 .610 4.690 86.274 8 .481 3.698 89.972 9 .429 3.300 93.272 10 .354 2.726 95.999 11 .260 1.998 97.997 12 .194 1.493 99.489 13 .066 .511 100.000
Table B-4 Total Variance explained for the ID Factor (2003)
Initial Eigenvalues Rotation Sums of Squared Loadings
Component Total % of Variance Cumulative % Total % of Variance Cumulative % 1 4.782 36.783 36.783 3.907 30.055 30.055 2 1.633 12.564 49.347 1.816 13.967 44.022 3 1.507 11.596 60.943 1.638 12.600 56.621 4 1.048 8.062 69.005 1.610 12.384 69.005 5 .872 6.711 75.717 6 .795 6.119 81.836 7 .621 4.775 86.610 8 .481 3.699 90.309 9 .420 3.230 93.540 10 .332 2.550 96.090 11 .261 2.010 98.099 12 .188 1.448 99.548 13 .059 .452 100.000

294
Table B-5 Total Variance explained for the ID Factor (2004)
Initial Eigenvalues Rotation Sums of Squared Loadings
Component Total % of Variance Cumulative % Total % of Variance Cumulative % 1 4.881 37.547 37.547 4.505 34.651 34.651 2 1.669 12.835 50.382 1.900 14.618 49.269 3 1.523 11.719 62.101 1.668 12.832 62.101 4 .986 7.587 69.688 5 .854 6.571 76.259 6 .747 5.744 82.004 7 .616 4.741 86.745 8 .485 3.730 90.475 9 .431 3.316 93.791 10 .305 2.346 96.138 11 .267 2.052 98.189 12 .179 1.379 99.568 13 .056 .432 100.000
Table B-6 Total Variance explained for the ID Factor (2005)
Initial Eigenvalues Rotation Sums of Squared Loadings
Component Total % of Variance Cumulative % Total % of Variance Cumulative % 1 4.897 37.672 37.672 3.868 29.756 29.756 2 1.701 13.081 50.753 1.820 14.002 43.758 3 1.496 11.508 62.261 1.737 13.361 57.119 4 1.021 7.855 70.116 1.690 12.997 70.116 5 .835 6.426 76.542 6 .760 5.849 82.392 7 .594 4.573 86.964 8 .467 3.596 90.560 9 .403 3.101 93.661 10 .309 2.380 96.041 11 .262 2.017 98.058 12 .187 1.442 99.499 13 .065 .501 100.000

295
Table B-7 Rotated Component Matrix for the ID factor (2000)
Component
1 2 3 4 GVMT Effectiveness Index for 2000 .914
Corruption Perception Index for 2000 -.865
Voice and Accountability Index for 2000 .854
School Life Expectancy in years for 2000 .742
GVMT expenses as % of GDP without military expenses for 2000
Language Fractionalization Index for 2000 .849
Ethnic Fractionalization Index for 2000 .747
Religious Fractionalization Index for 2000 .613
Number of national holidays a country celebrates -.777
Gini Coefficient for 2000 .739 Percent of total Olympic Games medals for 1994-2000 period
Years a country has been independent by 2000 .818
Percent of total Nobel Prize laureates in the country by 2000 .686
Extraction Method: Principal Component Analysis. Rotation Method: Varimax with Kaiser Normalization 4 Components extracted

296
Table B-8 Rotated Component Matrix for the ID factor (2001)
Component
1 2 3 4 GovEff01 .916 VAI01 .855 CorInd01 -.854 School01 .751 MedPer01 .505 GovExp01 LangFr01 .863 EthFra01 .766 RelFra01 .557 Gini01 .781 Holida01 -.727 YERind01 .812 PercNP01 .527 .603
Extraction Method: Principal Component Analysis. Rotation Method: Varimax with Kaiser Normalization 4 Components extracted Table B-9 Rotated Component Matrix for the ID factor (2002)
Component
1 2 3 4 GovEff02 .904 CorInd02 -.877 VAI02 .841 School02 .745 LangFr02 .855 EthFra02 .764 RelFra02 .577 Gini2002 .792 Holida02 -.620 MedPer02 .571 GovExp02 YERind02 .817 PercNP02 .555
Extraction Method: Principal Component Analysis. Rotation Method: Varimax with Kaiser Normalization 4 Components extracted

297
Table B-10 Rotated Component Matrix for the ID factor (2003)
Component
1 2 3 4 GovEff03 .899 VAI03 .857 CorInd03 -.852 School03 .744 GovExp03 .549 MedPer03 LangFr03 .844 EthFra03 .742 RelFra03 .619 Gini2003 .751 Holida03 -.751 YERind03 .828 PercNP03 .672
Extraction Method: Principal Component Analysis. Rotation Method: Varimax with Kaiser Normalization 4 Components extracted Table B-11 Rotated Component Matrix for the ID factor (2004)
Component
1 2 3 GovEff04 .901 CorInd04 -.865 VAI04 .854 PercNP04 .733 School04 .727 MedPer04 .653 GovExp04 .535 LangFr04 .856 EthFra04 .760 RelFra04 .603 Holida04 .726 YERind04 .645 Gini2004 -.593
Extraction Method: Principal Component Analysis. Rotation Method: Varimax with Kaiser Normalization 3 Components extracted

298
Table B-12 Rotated Component Matrix for the ID factor (2005)
Component
1 2 3 4 GovEff05 .900 VAI05 .871 CorInd05 -.856 School05 .744 GovExp05 .574 LangFr05 .829 EthFra05 .720 RelFra05 .657 Holida05 -.783 Gini2005 .722 MedPer05 YERind05 .812 PercNP05 .738
Extraction Method: Principal Component Analysis. Rotation Method: Varimax with Kaiser Normalization 4 Components extracted

299
APPENDIX C
Factor Analysis Tests
Character Factor
Table C-1 Total Variance explained for the Character Factor (2000)
Initial Eigenvalues Rotation Sums of Squared Loadings
Component Total % of Variance
Cumulative % Total
% of Variance
Cumulative %
1 5.166 43.052 43.052 4.355 36.292 36.292 2 1.054 8.784 51.836 1.590 13.249 49.542 3 1.028 8.564 60.401 1.303 10.859 60.401 4 .947 7.894 68.294 5 .859 7.161 75.455 6 .682 5.683 81.138 7 .646 5.381 86.519 8 .523 4.358 90.878 9 .374 3.120 93.997 10 .348 2.904 96.901 11 .304 2.534 99.436 12 .068 .564 100.000
Table C-2 Total Variance explained for the Character Factor (2001)
Initial Eigenvalues Rotation Sums of Squared Loadings
Component Total % of Variance
Cumulative % Total
% of Variance
Cumulative %
1 5.164 43.030 43.030 4.572 38.099 38.099 2 1.119 9.328 52.358 1.711 14.259 52.358 3 .993 8.273 60.631 4 .975 8.122 68.753 5 .829 6.910 75.663 6 .654 5.453 81.117 7 .623 5.191 86.308 8 .516 4.299 90.607 9 .374 3.117 93.725 10 .361 3.009 96.734 11 .321 2.677 99.411 12 .071 .589 100.000

300
Table C-3 Total Variance explained for the Character Factor (2002)
Initial Eigenvalues Rotation Sums of Squared Loadings
Component Total % of Variance
Cumulative % Total
% of Variance
Cumulative %
1 5.188 43.230 43.230 4.185 34.878 34.878 2 1.141 9.504 52.734 1.890 15.747 50.625 3 1.033 8.608 61.342 1.286 10.717 61.342 4 .986 8.219 69.561 5 .810 6.751 76.312 6 .649 5.409 81.721 7 .600 4.997 86.718 8 .516 4.298 91.016 9 .379 3.161 94.177 10 .332 2.770 96.947 11 .319 2.656 99.603 12 .048 .397 100.000
Table C-4 Total Variance explained for the Character Factor (2003)
Initial Eigenvalues Rotation Sums of Squared Loadings
Component Total % of Variance Cumulative % Total
% of Variance Cumulative %
1 5.068 42.237 42.237 3.815 31.788 31.788 2 1.159 9.657 51.894 2.233 18.612 50.400 3 1.048 8.735 60.629 1.227 10.229 60.629 4 .928 7.736 68.365 5 .886 7.382 75.747 6 .718 5.981 81.728 7 .639 5.323 87.051 8 .502 4.183 91.234 9 .389 3.245 94.479 10 .337 2.808 97.287 11 .277 2.310 99.598 12 .048 .402 100.000

301
Table C-5 Total Variance explained for the Character Factor (2004)
Initial Eigenvalues Rotation Sums of Squared Loadings
Component Total % of Variance
Cumulative % Total
% of Variance
Cumulative %
1 5.066 42.217 42.217 3.852 32.099 32.099 2 1.169 9.744 51.961 2.153 17.944 50.043 3 1.061 8.842 60.803 1.291 10.760 60.803 4 .903 7.528 68.332 5 .821 6.845 75.176 6 .719 5.989 81.165 7 .687 5.721 86.886 8 .519 4.321 91.208 9 .390 3.250 94.458 10 .363 3.026 97.484 11 .257 2.140 99.624 12 .045 .376 100.000
Table C-6 Total Variance explained for the Character Factor (2005)
Initial Eigenvalues Rotation Sums of Squared Loadings
Component Total % of Variance
Cumulative % Total
% of Variance
Cumulative %
1 5.073 42.277 42.277 4.120 34.331 34.331 2 1.132 9.433 51.710 1.910 15.920 50.251 3 1.058 8.820 60.530 1.233 10.279 60.530 4 .936 7.797 68.327 5 .841 7.005 75.332 6 .732 6.097 81.429 7 .630 5.250 86.679 8 .507 4.224 90.903 9 .394 3.284 94.186 10 .368 3.068 97.254 11 .280 2.330 99.584 12 .050 .416 100.000

302
Table C-7 Rotated Component Matrix for the Character factor (2000)
Component
1 2 3 Civil Liberties in 2000 .877 Political rights in 2000 .851 Independence of Judicial system from the government in 2000 .812
% of Population above Income Poverty Line in 2000 .651
Respect toward women in the family, at the work place and in society as a whole in 2000 .639
Number of reported criminal offenses per 100,000 of population in 2000
.625
Expenditure on leisure and recreation as % of a household budget .604
Intl NGO membership density in 2000 .516
Number of suicides as measured per 100,000 of population in 2000
Elections Participation rates for 2000 .803
Seats in Parliament held by women as % of total in 2000 .529
Prison population per 100,000 of people in the country in 2000 -.915
Extraction Method: Principal Component Analysis Rotation Method: Varimax with Kaiser Normalization

303
Table C-8 Rotated Component Matrix for the Character factor (2001)
Component
1 2 CivLib01 .828 PolRig01 .791 Women01 .721 RecExp01 .704 Judici01 .690 Report01 .677 PopAb01 .658 ParWE01 .637 ElecPT01 Prison01 -.859 INGOde01 .575 Suicid01
Table C-9 Rotated Component Matrix for the Character factor (2002)
Component
1 2 3 PolRig02 .803 CivLib02 .796 Judici02 .792 PopAb02 .743 Women02 .668 RecExp02 .576 Report02 .553 Suicid02 -.542 INGOde02 .508 ElecPT02 .758 ParWE02 .745 Prison02 .923

304
Table C-10 Rotated Component Matrix for the Character factor (2003)
Component
1 2 3 PopAb03 .804 PolRig03 .752 Judici03 .750 CivLib03 .740 Women03 .698 RecExp03 .595 Suicid03 -.566 INGOde03 ParWE03 .860 Report03 .710 ElecPT03 .525 Prison03 .924
Table C-11 Rotated Component Matrix for the Character factor (2004)
Component
1 2 3 PopAb04 .861 Women04 .768 Judici04 .742 CivLib04 .738 PolRig04 .713 RecExp04 .602 Suicid04 -.522 ParWE04 .835 Report04 .677 ElecPT04 .550 Prison04 .851 INGOde04

305
Table C-12 Rotated Component Matrix for the Character factor (2005)
Component
1 2 3 CivLib05 .821 PolRig05 .798 PopAb05 .793 Judici05 .771 Women05 .731 RecExp05 .619 INGOde05 .513 Suicid05 ParWE05 .884 Report05 .731 ElecPT05 Prison05 -.924

306
APPENDIX D
Factor Analysis Tests
Family Factor
Table D-1 Total Variance explained for the Family Factor (2000)
Initial Eigenvalues
Component Total % of Variance Cumulative % 1 2.787 55.747 55.747 2 .778 15.563 71.310 3 .742 14.846 86.156 4 .545 10.904 97.060 5 .147 2.940 100.000
Table D-2 Total Variance explained for the Family Factor (2001)
Initial Eigenvalues
Component Total % of Variance Cumulative % 1 2.744 54.880 54.880 2 .788 15.764 70.645 3 .756 15.126 85.771 4 .586 11.727 97.497 5 .125 2.503 100.000

307
Table D-3 Total Variance explained for the Family Factor (2002)
Initial Eigenvalues
Component Total % of Variance Cumulative % 1 2.770 55.407 55.407 2 .776 15.521 70.928 3 .756 15.116 86.044 4 .579 11.574 97.618 5 .119 2.382 100.000
Table D-4 Total Variance explained for the Family Factor (2003)
Initial Eigenvalues
Component Total % of Variance Cumulative % 1 2.736 54.725 54.725 2 .780 15.609 70.335 3 .772 15.443 85.778 4 .597 11.947 97.724 5 .114 2.276 100.000
Table D-5 Total Variance explained for the Family Factor (2004)
Initial Eigenvalues
Component Total % of Variance Cumulative % 1 2.702 54.050 54.050 2 .810 16.197 70.247 3 .764 15.275 85.522 4 .611 12.220 97.742 5 .113 2.258 100.000

308
Table D-6 Total Variance explained for the Family Factor (2005)
Initial Eigenvalues
Component Total % of Variance Cumulative % 1 2.704 54.082 54.082 2 .822 16.441 70.523 3 .735 14.692 85.215 4 .623 12.459 97.674 5 .116 2.326 100.000
Table D-7 Rotated Component Matrix for the Family factor (2000) Rotated Component Matrix, 2000
Component
1 Number of children under age 15 in a family in 2000
-.887
Average size of a family in 2000 -.885
Share of total population living in urban areas in 2000
.736
Family services in 2000 .601 Divorce rate in 2000 .561
Table D-8 Rotated Component Matrix for the Family factor (2001)
Component
1 Average size of a family in 2001 -.893 Number of children under age 15 in a family in 2001 -.893
Share of total population living in urban areas in 2001 .701
Family services in 2001 .597 Divorce rate in 2001 .550

309
Extraction Method: Principal Component Analysis 1 component extracted Table D-9 Rotated Component Matrix for the Family factor (2002)
Component
1 Average size of a family in 2002
-.898
Number of children under age 15 in a family in 2002 -.894
Share of total population living in urban areas in 2002
.702
Family services in 2002 .585Divorce rate in 2002 .573
Extraction Method: Principal Component Analysis 1 component extracted Table D-10 Rotated Component Matrix for the Family factor (2003)
Component
1 Number of children under age 15 in a family in 2003
-.899
Average size of a family in 2003 -.898
Share of total population living in urban areas in 2003
.687
Family services in 2003 .575Divorce rate in 2003 .564
Extraction Method: Principal Component Analysis 1 component extracted

310
Table D-11 Rotated Component Matrix for the Family factor (2004)
Component
1 Number of children under age 15 in a family in 2004
.902
Average size of a family in 2004 .901
Share of total population living in urban areas in 2004
-.660
Family services in 2004 -.569 Divorce rate in 2004 -.564
Extraction Method: Principal Component Analysis 1 component extracted Table D-12 Rotated Component Matrix for the Family factor (2005)
Component
1 Number of children under age 15 in a family in 2005
-.903
Average size of a family in 2005 -.895
Share of total population living in urban areas in 2005
.643
Divorce rate in 2005 .589Family services in 2005 .571
Extraction Method: Principal Component Analysis 1 component extracted

311
APPENDIX E
Human Capital Indices
Table E-1
EHCI-1 (2000-2005) Non-Standardized
Country EHCI1_00 EHCI1_01 EHCI1_02 EHCI1_03 EHCI1_04 EHCI1_05 Afghanis Albania 0.61172 0.62155 1.77962 1.73809 0.78776 1.19514 Algeria -1.41529 -0.91211 -0.95053 -0.97571 1.33296 -1.68087 Angola -5.8665 -2.8173 -2.22277 -1.65651 -3.60449 -5.89156 Argentin 4.20535 3.12888 5.00643 4.67852 4.66005 3.91683 Armenia -0.40849 -0.05092 0.6694 0.67227 0.64255 -0.09554 Australi 9.44964 8.16537 10.10527 10.53116 4.40901 9.6624 Austria 9.1689 8.64687 9.69168 9.23134 4.7658 8.75553 Azerbaij -0.06349 -0.27189 -0.45675 -1.05855 -2.36763 -0.24876 Bahamas 4.53343 3.62659 -0.88032 -0.98785 -1.07369 5.8444 Bahrain -0.09475 -0.11592 -0.622 -0.41423 0.3063 -0.12398 Banglade -1.98916 -1.90614 -0.29364 -0.25711 2.17889 -1.79412 Barbados Belarus Belgium 8.97059 8.15854 9.4756 9.15655 4.44324 8.7446 Belize 0.61984 0.66058 -4.50819 -4.81655 -1.08995 1.6405 Benin -4.41791 -3.63684 -2.28983 -2.26725 0.24479 -4.47973 Bhutan 0.31028 -0.53743 -1.36695 -0.68162 -0.44813 -0.25338 Bolivia -0.63071 -0.8448 1.0869 0.14609 2.71434 -1.47498 Bos&Ger 1.33621 1.46054 -0.00329 0.7587 -2.88017 0.60177 Botswana -0.04238 0.28433 -2.487 -2.50011 -0.54223 0.77074 Brazil 2.08383 1.88574 3.31665 2.63355 3.62179 2.10608 Brunei Bulgaria 5.17108 5.39015 4.9191 5.58382 0.17638 5.68997 BurkFaso -6.35654 -5.66695 -4.20054 -4.18395 -0.03985 -6.54121 Burundi -1.62094 -2.8068 -1.62077 -1.80224 -0.2769 -1.35082 Cambodia -0.98671 -1.70089 -0.27977 -0.04888 1.49964 -1.15619 Cameroon -3.65335 -3.13066 -3.52741 -3.587 -1.90086 -3.58451 Canada 7.39518 7.13827 8.61246 8.80105 3.07617 7.21055 Cape Ver 0.68244 1.37572 1.2152 1.18055 2.072 0.8739 CenAfrRe -5.94789 -2.38828 -5.56306 Chad -4.88275 -4.64316 -3.19265 -3.6216 -1.70336 -4.9742 Chile 2.16849 1.98922 2.47306 1.97188 3.5593 2.72581 China Colombia Comoros -1.64462 -0.8776 -0.28019 -0.24063 0.93411 -2.06348 CostaRic 3.20822 3.40496 4.44556 3.60094 5.31034 3.48565 CotedIvo -5.03374 -3.58477 -5.4963 -4.17159 -2.87015 -5.58913 Croatia 1.75443 4.68619 Cuba

312
Cyprus CzechRep 6.40708 6.77532 5.27925 5.72614 -0.09304 6.86158 Denmark Djibouti -2.5697 -0.81794 -1.55558 -1.419 -2.89629 -1.89594 DominRep 0.92638 0.84249 1.91592 1.75847 3.71642 1.24785 Ecuador 0.03923 -0.08807 1.75234 1.01824 3.68437 0.06098 Egypt -0.52663 0.75142 0.12679 0.51236 0.32396 -0.71696 ElSalvad -0.88837 -0.02307 -0.02331 -0.01207 3.1509 0.48496 EqGuinea -2.79818 -2.48276 -3.03224 -3.31935 -0.54289 -2.54735 Eritrea -3.74001 -3.77241 -3.83805 -3.84844 -1.99801 -3.68138 Estonia 5.75511 6.05994 0.42258 1.0386 -3.13778 6.55106 Ethiopia Fiji -1.3587 1.81883 -0.82044 Finland 10.13211 5.47065 9.79459 France Gabon -2.4395 -2.07667 -2.11851 -2.36612 -2.14532 -2.73887 Gambia Georgia 0.46014 0.60558 -0.4119 -0.04585 -2.42841 1.95586 Germany Ghana -4.36537 -2.68291 -0.32581 -0.17235 1.14311 -2.29655 Greece 4.11383 5.84743 8.30247 7.73861 5.85308 5.95211 Guatemal -4.09866 -2.80082 -1.6421 -1.67251 0.8387 -3.55211 Guinea -3.77845 -2.06805 1.94165 -3.85543 Guyana Haiti Honduras Hungary 6.86158 7.21125 5.14948 5.8145 0.02694 6.50789 Iceland India -1.88221 Indonesi -0.84937 -1.17262 0.61761 0.21923 1.56115 -1.20255 Iran -2.63018 -1.39167 -2.73342 -3.11536 -2.41853 -1.86293 Iraq Ireland 6.40421 6.95223 7.1803 7.27662 4.67141 6.20105 Israel 5.25116 5.07805 4.56753 4.59843 1.14758 5.95786 Italy 9.64748 9.17141 11.909 11.60865 6.15186 9.66132 Jamaica 1.84114 2.22473 1.69059 1.68688 -0.52376 1.75085 Japan Jordan -1.29554 -0.21119 -1.3251 -0.83261 1.28891 -0.74149 Kazakhst 3.02764 2.17536 -4.62006 -3.78081 -7.54788 2.80115 Kenya Korea N Korea S Kuwait -0.64331 -1.3814 -0.63777 Kyrgyzst 1.14331 0.6555 -4.10676 -2.42649 -4.00247 0.42127 Laos -0.6072 -2.74438 -3.07148 -3.01832 0.52901 -1.43623 Latvia 5.67267 5.47411 0.11314 0.78755 -3.04254 5.63208 Lebanon -1.4863 -0.49257 -2.10917 -2.36054 -1.14668 -1.58476 Lesotho -2.1838 -1.95375 -1.4579 -1.90027 0.96098 -1.67601 Liberia Libya 0.28444 0.12709 -0.87916 -1.2679 1.25075 0.04941

313
Lithuani 3.47121 Macedoni 0.97826 0.96923 1.99634 2.38422 -0.29113 1.87383 Madagasc Malawi -2.69627 -3.05668 -1.71576 -1.59781 -0.19179 -3.06705 Malaysia -0.76853 1.38565 -1.46383 Mali -4.99553 -4.0275 -2.19089 -2.18447 0.18772 -5.39508 Malta Mauritan -2.39512 -1.62285 -0.73296 -0.9012 -0.01809 -2.66173 Mexico 0.53055 0.71883 2.41693 1.60101 3.82883 1.32217 Moldova 1.34431 1.32741 -1.13982 -0.34348 -5.56444 2.24658 Mongolia 2.19444 1.95914 -0.36771 -0.87806 -0.41543 1.47206 Morocco Mozambiq -1.33595 -1.69523 -3.4933 Burma Namibia Nepal -2.13587 -2.46658 -0.60044 -0.8532 1.45157 -3.13047 Netherla 10.97012 9.96326 12.09198 11.65596 5.81004 10.46604 New Zela 6.60721 2.82829 7.81525 Nicaragu 0.05258 -0.78878 1.07276 0.12816 3.33346 -0.43135 Niger -4.93033 -3.86475 -2.67076 -2.73277 0.04965 -5.01136 Nigeria -4.48285 -4.33228 -2.38635 -2.23527 -0.82775 -4.8579 Norway 11.7606 11.17362 12.65535 12.58502 6.02586 11.6199 Oman -1.58945 -1.50105 -0.79063 -0.61575 1.01628 -1.65268 Pakistan -2.79554 -2.00166 -2.02844 -2.20362 -0.19334 -3.98004 Panama 0.63554 0.3521 0.18534 -1.1675 2.65101 1.83304 Papua NG -1.30784 -1.45845 0.15308 -3.28524 Paraguay -1.53892 -0.86124 0.52618 0.06586 3.44448 -1.64515 Peru 0.32699 -0.37538 2.94327 1.97713 5.29111 0.84188 Philippi -2.29721 -1.92796 -0.31341 -0.59386 1.34005 -2.43344 Poland 7.22871 7.35778 Portugal Qatar -1.54369 -1.28849 -1.70298 -1.3238 -0.1497 -1.42586 Romania 5.71098 5.88168 5.091 5.42919 0.64463 5.60921 Russia Rwanda -1.65677 0.88774 -0.6681 Samoa -0.45389 -0.03321 -1.99755 -1.81113 0.9847 1.29666 Saudi Ar Senegal Sierra L -6.8044 -5.54113 -4.43593 -4.70774 0.35878 -4.79894 Singapor Slovakia 5.32274 5.15878 5.21304 4.89831 0.95291 4.77123 Slovenia 5.79133 5.7382 4.7756 5.07591 2.03795 5.19084 Somalia South Af 3.12244 1.8475 0.09855 -0.40148 0.13004 3.21652 Spain 7.85966 7.581 10.04428 9.24425 7.70737 7.99474 Sri Lank 0.07247 1.1951 -0.08284 Sudan -5.31493 -5.27237 -4.5035 -4.39553 -1.69826 -5.43952 Suriname -2.50941 Swazilan -1.62048 -1.6357 -4.85939 -4.68211 -0.35339 -2.23788 Sweden

314
Switzerl 11.49977 12.2906 12.43425 12.88792 5.74075 11.58624 Syria -1.70012 -1.61294 -1.04142 -1.13053 0.38729 -2.00698 Taiwan Tajikist -0.31545 -1.61124 -1.24555 -0.92958 -0.48057 -0.09058 Tanzania -3.06529 -3.17545 -1.96886 -2.29985 -0.03092 -2.76495 Thailand 4.40016 4.01629 3.21016 4.29629 3.68494 Togo -4.40362 0.74836 -5.26452 Trin&Tob 2.20217 1.75186 -1.20826 -1.56137 -0.15477 2.34725 Tunisia 1.92453 1.58621 0.60492 -0.29231 1.75318 1.7583 Turkey 0.52145 0.44263 1.94345 1.41247 1.70143 0.34915 Turkmeni 2.41561 0.6675 -4.77356 -4.95783 -3.97595 1.93849 Uganda -3.75193 -4.46576 -2.43731 -2.21836 -0.49249 -2.91241 Ukraine 5.47704 4.16642 -0.90111 -0.44231 -4.47842 5.30427 UnArabEm -4.43869 -1.37706 -1.6786 UnitedKi USA Uruguay 5.63975 5.19421 4.90807 4.56871 5.62889 Uzbekist 1.33639 -0.10016 -1.28615 -1.07844 -1.23455 0.08683 Venezuel -0.53861 0.25537 1.48881 1.10174 2.99659 -0.75218 Vietnam Yemen -2.35384 -2.06719 -1.32037 -1.35286 1.77877 -2.70244 Zambia -4.43414 -3.81152 -4.2467 -3.97396 -2.08107 -4.60549 Zimbabwe -2.64622 -2.619 -3.51174 -3.43967 -2.99609 -2.15101

315
Table E-2
EHCI-1 (2000-2005) Standardized
Country EHCI1_00 EHCI1_01 EHCI1_02 EHCI1_03 EHCI1_04 EHCI1_05 SCORE SCORE SCORE SCORE SCORE SCORE Afghanis Albania 0.40 0.35 0.40 0.41 0.55 0.43 Algeria 0.29 0.26 0.25 0.26 0.58 0.27 Angola 0.05 0.16 0.18 0.23 0.26 0.04 Argentin 0.59 0.49 0.58 0.56 0.80 0.58 Armenia 0.34 0.31 0.34 0.35 0.54 0.35 Australi 0.88 0.77 0.86 0.87 0.78 0.89 Austria 0.86 0.80 0.84 0.81 0.81 0.84 Azerbaij 0.36 0.30 0.28 0.26 0.34 0.35 Bahamas 0.61 0.52 0.25 0.26 0.42 0.68 Bahrain 0.36 0.31 0.27 0.29 0.51 0.35 Banglade 0.26 0.21 0.29 0.30 0.64 0.26 Barbados Belarus Belgium 0.85 0.77 0.82 0.80 0.79 0.84 Belize 0.40 0.35 0.05 0.06 0.42 0.45 Benin 0.13 0.11 0.18 0.20 0.51 0.11 Bhutan 0.38 0.29 0.23 0.28 0.47 0.35 Bolivia 0.33 0.27 0.36 0.32 0.67 0.28 Bos&Ger 0.44 0.40 0.30 0.36 0.31 0.39 Botswana 0.36 0.33 0.17 0.18 0.46 0.40 Brazil 0.48 0.42 0.49 0.46 0.73 0.48 Brunei Bulgaria 0.65 0.62 0.57 0.61 0.51 0.67 BurkFaso 0.02 0.00 0.07 0.09 0.49 0.00 Burundi 0.28 0.16 0.21 0.22 0.48 0.29 Cambodia 0.31 0.22 0.29 0.31 0.59 0.30 Cameroon 0.17 0.14 0.11 0.13 0.37 0.16 Canada 0.76 0.71 0.78 0.78 0.70 0.76 Cape Ver 0.40 0.39 0.37 0.38 0.63 0.41 CenAfrRe 0.00 0.34 0.05 Chad 0.10 0.06 0.13 0.12 0.38 0.09 Chile 0.48 0.43 0.44 0.42 0.73 0.51 China Colombia Comoros 0.28 0.27 0.29 0.30 0.56 0.25 CostaRic 0.54 0.51 0.55 0.51 0.84 0.55 CotedIvo 0.10 0.12 0.00 0.09 0.31 0.05 Croatia 0.61 0.62 Cuba Cyprus CzechRep 0.71 0.69 0.59 0.62 0.49 0.74 Denmark

316
Djibouti 0.23 0.27 0.22 0.24 0.30 0.26 DominRep 0.42 0.36 0.41 0.41 0.74 0.43 Ecuador 0.37 0.31 0.40 0.37 0.74 0.36 Egypt 0.34 0.36 0.31 0.34 0.52 0.32 ElSalvad 0.32 0.31 0.30 0.32 0.70 0.39 EqGuinea 0.22 0.18 0.14 0.14 0.46 0.22 Eritrea 0.17 0.11 0.09 0.11 0.36 0.16 Estonia 0.68 0.65 0.33 0.37 0.29 0.72 Ethiopia Fiji 0.24 0.61 0.31 Finland 0.85 0.85 0.90 France Gabon 0.24 0.20 0.19 0.19 0.35 0.21 Gambia Georgia 0.39 0.35 0.28 0.31 0.34 0.47 Germany Ghana 0.13 0.17 0.28 0.31 0.57 0.23 Greece 0.59 0.64 0.76 0.73 0.88 0.69 Guatemal 0.15 0.16 0.21 0.23 0.55 0.16 Guinea 0.16 0.19 0.62 0.15 Guyana Haiti Honduras Hungary 0.74 0.72 0.59 0.62 0.50 0.72 Iceland India 0.27 Indonesi 0.32 0.25 0.34 0.33 0.60 0.29 Iran 0.22 0.24 0.15 0.15 0.34 0.26 Iraq Ireland 0.71 0.70 0.70 0.70 0.80 0.70 Israel 0.65 0.60 0.55 0.56 0.57 0.69 Italy 0.89 0.83 0.96 0.93 0.90 0.89 Jamaica 0.47 0.44 0.40 0.41 0.46 0.46 Japan Jordan 0.30 0.30 0.23 0.27 0.58 0.32 Kazakhst 0.53 0.44 0.05 0.12 0.00 0.51 Kenya Korea N Korea S Kuwait 0.28 0.40 0.33 Kyrgyzst 0.43 0.35 0.08 0.19 0.23 0.38 Laos 0.33 0.16 0.13 0.16 0.53 0.28 Latvia 0.67 0.62 0.31 0.36 0.30 0.67 Lebanon 0.29 0.29 0.19 0.19 0.42 0.27 Lesotho 0.25 0.21 0.22 0.21 0.56 0.27 Liberia Libya 0.38 0.32 0.25 0.25 0.58 0.36 Lithuani 0.50 Macedoni 0.42 0.37 0.41 0.44 0.48 0.46 Madagasc

317
Malawi 0.22 0.15 0.21 0.23 0.48 0.19 Malaysia 0.27 0.59 0.28 Mali 0.10 0.09 0.18 0.20 0.51 0.06 Malta Mauritan 0.24 0.23 0.26 0.27 0.49 0.21 Mexico 0.40 0.36 0.44 0.40 0.75 0.43 Moldova 0.44 0.39 0.24 0.30 0.13 0.48 Mongolia 0.48 0.42 0.28 0.27 0.47 0.44 Morocco Mozambiq 0.24 0.38 0.17 Burma Namibia Nepal 0.25 0.18 0.27 0.27 0.59 0.19 Netherla 0.96 0.87 0.97 0.93 0.88 0.94 New Zela 0.67 0.68 0.79 Nicaragu 0.37 0.27 0.36 0.32 0.71 0.34 Niger 0.10 0.10 0.16 0.17 0.50 0.08 Nigeria 0.13 0.07 0.17 0.20 0.44 0.09 Norway 1.00 0.94 1.00 0.98 0.89 1.00 Oman 0.28 0.23 0.26 0.28 0.56 0.27 Pakistan 0.22 0.20 0.19 0.20 0.48 0.14 Panama 0.40 0.34 0.31 0.25 0.67 0.46 Papua NG 0.23 0.24 0.50 0.18 Paraguay 0.28 0.27 0.33 0.32 0.72 0.27 Peru 0.38 0.29 0.46 0.42 0.84 0.41 Philippi 0.24 0.21 0.29 0.28 0.58 0.23 Poland 0.76 0.73 Portugal Qatar 0.28 0.24 0.21 0.25 0.48 0.28 Romania 0.67 0.64 0.58 0.60 0.54 0.67 Russia Rwanda 0.23 0.55 0.32 Samoa 0.34 0.31 0.19 0.22 0.56 0.43 Saudi Ar Senegal Sierra L 0.00 0.01 0.06 0.07 0.52 0.10 Singapor Slovakia 0.65 0.60 0.59 0.58 0.56 0.62 Slovenia 0.68 0.64 0.57 0.59 0.63 0.65 Somalia South Af 0.53 0.42 0.31 0.29 0.50 0.54 Spain 0.79 0.74 0.86 0.81 1.00 0.80 Sri Lank 0.32 0.57 0.36 Sudan 0.08 0.02 0.05 0.08 0.38 0.06 Suriname 0.33 Swazilan 0.28 0.22 0.04 0.07 0.47 0.24 Sweden Switzerl 0.99 1.00 0.99 1.00 0.87 1.00 Syria 0.27 0.23 0.25 0.26 0.52 0.25 Taiwan

318
Tajikist 0.35 0.23 0.23 0.27 0.46 0.36 Tanzania 0.20 0.14 0.19 0.19 0.49 0.21 Thailand 0.56 0.52 0.49 0.78 0.56 Togo 0.08 0.54 0.07 Trin&Tob 0.49 0.41 0.24 0.23 0.48 0.49 Tunisia 0.47 0.40 0.34 0.30 0.61 0.46 Turkey 0.39 0.34 0.41 0.39 0.61 0.38 Turkmeni 0.50 0.35 0.04 0.05 0.23 0.47 Uganda 0.16 0.07 0.17 0.20 0.46 0.20 Ukraine 0.66 0.55 0.25 0.29 0.20 0.65 UnArabEm 0.08 0.40 0.27 UnitedKi USA Uruguay 0.67 0.60 0.57 0.56 0.67 Uzbekist 0.44 0.31 0.23 0.26 0.41 0.36 Venezuel 0.34 0.33 0.38 0.37 0.69 0.32 Vietnam Yemen 0.24 0.20 0.23 0.24 0.61 0.21 Zambia 0.13 0.10 0.07 0.10 0.36 0.11 Zimbabwe 0.22 0.17 0.11 0.13 0.30 0.24

319
Table E-3
EHCI-II (2000-2005) Non-Standardized
Country EHCI2_00 EHCI2_01 EHCI2_02 EHCI2_03 EHCI2_04 EHCI2_05 Afghanis Albania -0.17595 -0.20561 0.94228 0.93493 0.24142 0.42629 Algeria -1.92985 -1.49734 -1.54325 -1.54043 -1.70064 -2.21899 Angola -6.61044 -3.62033 -3.03747 -2.38307 -5.86850 -6.61439 Argentin 3.31751 2.23199 4.11857 3.78679 5.53453 3.05829 Armenia -1.14074 -0.84233 -0.09550 -0.09278 0.05546 -0.82887 Australi 8.39490 7.07265 9.02680 9.44944 6.82157 8.59127 Austria 8.13950 7.58960 8.64442 8.18213 6.81936 7.70519 Azerbaij -0.76583 -1.01563 -1.19180 -1.80394 -3.18422 -0.98510 Bahamas 3.71319 2.78207 -1.73111 -1.81645 -1.03206 Bahrain -0.72598 -0.79354 -1.30930 -1.08114 -1.25274 -0.74978 Banglade -2.67801 -2.64937 -1.04062 -0.97350 -0.55688 -2.46628 Barbados Belarus Belgium 7.89046 7.04134 8.35552 8.02259 7.35063 7.62209 Belize 0.07630 0.08564 -5.10091 -5.42428 -3.47236 1.07392 Benin -5.08518 -4.36984 -3.01362 -2.94834 -3.10384 -5.09596 Bhutan -0.39237 -1.31178 -2.12881 -1.42064 -2.87986 -0.95957 Bolivia -1.36902 -1.59323 0.33515 -0.58306 1.67505 -2.14907 Bos&Ger 0.51065 0.60355 -0.85524 -0.08334 -2.96253 -0.22067 Botswana -0.67642 -0.39611 -3.19783 -3.20407 -2.06522 0.08923 Brazil 1.22204 1.01368 2.43322 1.74539 4.21766 1.24403 Brunei Bulgaria 4.21504 4.41405 3.94266 4.58410 1.87725 4.67579 BurkFaso -7.02781 -6.41725 -4.89680 -3.91710 -7.21565 Burundi -2.48836 -3.73434 -2.51517 -2.65296 -1.95239 -2.22200 Cambodia -1.60247 -2.37791 -0.93376 -0.67994 -1.15151 -1.78056 Cameroon -4.33849 -3.88075 -4.26549 -4.31379 -3.78842 -4.29681 Canada 6.36341 6.08607 7.57349 7.75112 5.21287 6.16975 Cape Ver -0.03759 0.60981 0.45657 0.41668 0.95457 0.11788 CenAfrRe -6.76138 -4.45531 -6.35720 Chad -5.62367 -5.44732 -3.97915 -4.42756 -4.13185 -5.71735 Chile 1.31412 1.10505 1.58862 1.08245 4.29822 1.85524 China Colombia Comoros -2.36913 -1.66322 -1.04944 -0.95748 -1.84134 -2.73439 CostaRic 2.32782 2.48688 3.54588 2.70280 5.62602 2.59417 CotedIvo -5.69683 -4.33609 -6.20948 -4.85105 -6.21158 -6.26013 Croatia 2.98058 3.72746 Cuba Cyprus CzechRep 5.32300 5.65473 4.16908 4.60498 2.39682 5.74252 Denmark Djibouti -3.52734 -1.84182 -2.56676 -2.41351 -2.90182 -2.87778

320
DominRep 0.15700 0.05043 1.11107 0.97163 3.14101 0.50418 Ecuador -0.65889 -0.81936 1.01322 0.30120 2.51533 -0.60238 Egypt -1.25699 -0.03143 -0.65511 -0.24910 -1.40660 -1.42622 ElSalvad -1.56056 -0.73115 -0.76323 -0.72989 1.69321 -0.18545 EqGuinea -3.50577 -3.23936 -3.77040 -4.04475 -2.04399 -3.26486 Eritrea -4.52637 -4.61200 -4.66631 -4.63512 -4.28845 -4.42554 Estonia 4.71420 4.98389 -0.62695 -0.02072 -0.97342 5.48079 Ethiopia Fiji -1.93686 -0.73964 -1.35548 Finland 9.06644 7.66719 8.72957 France Gabon -3.28276 -2.95330 -2.99396 -3.22812 -2.48574 -3.55720 Gambia Georgia -0.32731 -0.21025 -1.22035 -0.85355 -2.61060 1.16622 Germany Ghana -5.04465 -3.40681 -1.05327 -0.92356 -0.93837 -2.95070 Greece 3.22569 4.94797 7.40099 6.82658 6.82970 5.03343 Guatemal -4.71661 -3.46363 -2.32288 -2.33417 -1.40710 -4.17371 Guinea -4.54648 -2.84272 -1.26730 -4.50514 Guyana Haiti Honduras Hungary 5.86017 6.18078 4.12467 4.78740 1.82096 5.47320 Iceland India -2.52424 Indonesi -1.52901 -1.89423 -0.08396 -0.50073 0.23881 -1.89396 Iran -3.39229 -2.21556 -3.55604 -3.93298 -3.18273 -2.64649 Iraq Ireland 5.51495 6.03158 6.26154 6.35491 5.62931 5.26642 Israel 4.31955 4.12041 3.62149 3.65095 2.37204 5.02313 Italy 8.72563 7.44339 Jamaica 1.05538 1.39664 0.86083 0.85422 -0.65988 0.92581 Japan Jordan -1.89289 -0.84966 -1.95745 -1.43746 -0.96490 -1.29510 Kazakhst 2.16457 1.27228 1.90174 Kenya Korea N Korea S Kuwait -1.55849 -1.06925 -1.51391 Kyrgyzst 0.39888 -0.11658 -4.85899 -3.16106 -4.97026 -0.31635 Laos -1.18995 -3.35451 -3.66676 -3.57002 -3.10687 -1.94836 Latvia 4.64085 4.43349 -0.92593 -0.22373 -1.25265 4.57356 Lebanon -2.25574 -1.31691 -2.92057 -3.17564 -1.47115 -2.39092 Lesotho -2.79532 -2.60220 -2.10535 -2.52647 -1.55056 -2.25640 Liberia Libya -0.27759 -0.47083 -1.46416 -1.82372 -1.37060 -0.42788 Lithuani 2.40740 Macedoni 0.20403 0.16196 1.20610 1.58422 -0.69759 1.07442 Madagasc Malawi -3.34797 -3.75621 -2.41455 -2.26656 -2.63782 -3.69535

321
Malaysia -1.49999 0.25144 -2.15329 Mali -5.74594 -4.87546 -3.04015 -2.98921 -2.57837 -6.15933 Malta Mauritan -3.16917 -2.45684 -1.54735 -1.66597 -2.20840 -3.41633 Mexico -0.19428 -0.05094 1.64004 0.81512 3.34053 0.54884 Moldova 0.39094 0.30402 -2.17584 -1.42016 -3.98447 1.20858 Mongolia 1.48307 1.21131 -1.10502 -1.62047 -1.15126 0.73662 Morocco Mozambiq -2.13044 -3.64158 -4.23733 Burma Namibia Nepal -2.78879 -3.17804 -1.31083 -1.52115 -1.51724 -3.76388 Netherla 9.92883 8.89577 11.04515 10.60517 8.05095 9.42487 New Zela 5.55171 5.01306 6.78063 Nicaragu -0.64436 -1.54250 0.35706 -0.57548 1.57751 -1.12426 Niger -3.36283 -5.73457 Nigeria -5.15992 -5.05754 -3.11752 -2.91259 -3.13679 -5.50372 Norway 10.71801 8.38326 10.55610 Oman -2.16482 -2.14868 -1.43673 -1.24769 -1.37005 -2.25656 Pakistan -3.45713 -2.73111 -2.75458 -2.87303 -3.46125 -4.59723 Panama -0.06648 -0.38663 -0.56566 -1.90862 1.80086 1.13980 Papua NG -2.05204 -2.18843 -2.29146 -3.94742 Paraguay -2.19109 -1.55348 -0.17615 -0.62250 2.06737 -2.30176 Peru -0.32984 -1.06974 2.22756 1.27885 4.12228 0.17728 Philippi -2.87740 -2.56176 -0.95535 -1.22163 -0.54751 -3.03079 Poland 6.36141 6.46015 Portugal Qatar -2.16484 -1.93714 -2.36458 -1.95324 -2.06752 -2.01177 Romania 4.77031 4.91609 4.12475 4.45672 1.83711 4.64664 Russia Rwanda -2.32636 -1.72730 -1.28609 Samoa -0.96840 -0.62310 -2.54284 -2.33772 -2.33174 0.74926 Saudi Ar Senegal Sierra L -7.43155 -6.21901 -5.12414 -5.37401 -3.10196 -5.40051 Singapor Slovakia 4.37803 4.17920 4.23068 3.91437 2.22514 3.78692 Slovenia 4.87978 4.80180 3.84170 4.13687 3.24397 4.24713 Somalia South Af 2.41466 1.07668 -0.66798 -1.16933 -0.72567 2.46170 Spain 6.96606 6.65606 9.11364 8.29058 7.00308 Sri Lank -0.66197 0.07736 -0.81544 Sudan -6.01044 -6.02436 -5.24590 -5.09133 -4.54554 -6.07796 Suriname -2.85351 Swazilan -2.14834 -2.20155 -5.43151 -5.22201 -3.81415 -2.72125 Sweden Switzerl 10.47931 8.09641 Syria -2.35337 -2.33958 -1.74829 -1.83864 -1.16505 -2.72904 Taiwan Tajikist -0.84716 -2.18666 -1.80168 -1.47858 -3.10570 -0.64260

322
Tanzania -3.69352 -3.86077 -2.65947 -2.96868 -2.65493 -3.38684 Thailand 3.50627 3.11955 2.31042 4.80243 2.80866 Togo -5.07189 -2.01470 -5.90152 Trin&Tob 1.42129 0.95936 -2.00111 -2.34688 -0.88253 1.56844 Tunisia 1.13538 0.74846 -0.22640 -1.12101 1.18094 0.93700 Turkey -0.19334 -0.31073 1.18344 0.67035 0.92955 -0.39108 Turkmeni 1.76158 -0.03134 -5.43869 -5.62189 1.29049 Uganda -4.48613 -5.23142 -3.18863 -2.93609 -2.64500 -3.61034 Ukraine 4.38669 3.04860 -2.00586 -1.54161 -2.25816 4.18244 UnArabEm -5.10722 -3.40559 -2.27748 UnitedKi USA Uruguay 4.64509 4.16569 3.90390 3.42192 4.55496 Uzbekist 0.71853 -0.74859 -1.91387 -1.69980 -3.22210 -0.52470 Venezuel -1.21369 -0.45448 0.77317 0.40374 1.80328 -1.40772 Vietnam Yemen -2.93374 -2.69812 -1.92989 -1.90514 -2.42322 -3.18218 Zambia -5.11470 -4.53018 -4.96366 -4.68323 -4.33472 -5.22959 Zimbabwe -3.33074 -3.35001 -4.25873 -4.17551 -4.29192 -2.84766

323
Table E-4
EHCI-II (2000-2005) Standardized
Country EHCI2_00 EHCI2_01 EHCI2_02 EHCI2_03 EHCI2_04 EHCI2_05 SCORE SCORE SCORE SCORE SCORE SCORE Afghanis Albania 0.40 0.41 0.41 0.44 0.44 0.43 Algeria 0.30 0.32 0.27 0.30 0.31 0.28 Angola 0.05 0.18 0.18 0.25 0.02 0.03 Argentin 0.59 0.56 0.60 0.61 0.80 0.58 Armenia 0.35 0.36 0.35 0.38 0.43 0.36 Australi 0.87 0.88 0.88 0.93 0.89 0.89 Austria 0.86 0.91 0.86 0.86 0.89 0.84 Azerbaij 0.37 0.35 0.29 0.29 0.21 0.35 Bahamas 0.61 0.60 0.26 0.28 0.35 Bahrain 0.37 0.37 0.28 0.33 0.34 0.36 Banglade 0.26 0.25 0.30 0.33 0.39 0.27 Barbados Belarus Belgium 0.84 0.88 0.84 0.85 0.93 0.83 Belize 0.41 0.42 0.06 0.08 0.19 0.47 Benin 0.13 0.13 0.19 0.22 0.21 0.12 Bhutan 0.39 0.33 0.24 0.31 0.23 0.35 Bolivia 0.33 0.32 0.38 0.36 0.54 0.29 Bos&Ger 0.44 0.46 0.31 0.38 0.22 0.39 Botswana 0.37 0.39 0.17 0.20 0.28 0.41 Brazil 0.48 0.49 0.50 0.49 0.71 0.48 Brunei Bulgaria 0.64 0.71 0.59 0.65 0.55 0.67 BurkFaso 0.02 0.00 0.11 0.16 0.00 Burundi 0.27 0.18 0.21 0.24 0.29 0.28 Cambodia 0.32 0.26 0.31 0.35 0.35 0.31 Cameroon 0.17 0.17 0.11 0.14 0.17 0.16 Canada 0.76 0.82 0.80 0.84 0.78 0.75 Cape Ver 0.41 0.46 0.39 0.41 0.49 0.41 CenAfrRe 0.00 0.12 0.05 Chad 0.10 0.06 0.13 0.13 0.14 0.08 Chile 0.48 0.49 0.45 0.45 0.72 0.51 China Colombia Comoros 0.28 0.31 0.30 0.33 0.30 0.25 CostaRic 0.54 0.58 0.57 0.54 0.81 0.55 CotedIvo 0.10 0.14 0.00 0.11 0.00 0.05 Croatia 0.63 0.62 Cuba Cyprus CzechRep 0.70 0.79 0.60 0.65 0.59 0.73 Denmark

324
Djibouti 0.22 0.30 0.21 0.25 0.23 0.24 DominRep 0.42 0.42 0.42 0.45 0.64 0.43 Ecuador 0.37 0.37 0.42 0.41 0.60 0.37 Egypt 0.34 0.42 0.32 0.37 0.33 0.33 ElSalvad 0.32 0.37 0.32 0.35 0.54 0.40 EqGuinea 0.22 0.21 0.14 0.16 0.29 0.22 Eritrea 0.16 0.12 0.09 0.12 0.13 0.16 Estonia 0.67 0.74 0.32 0.39 0.36 0.71 Ethiopia Fiji 0.28 0.37 0.33 Finland 0.91 0.95 0.90 France Gabon 0.23 0.23 0.19 0.20 0.26 0.21 Gambia Georgia 0.39 0.41 0.29 0.34 0.25 0.47 Germany Ghana 0.13 0.20 0.30 0.34 0.36 0.24 Greece 0.59 0.74 0.79 0.78 0.89 0.69 Guatemal 0.15 0.19 0.23 0.25 0.33 0.17 Guinea 0.16 0.20 0.34 0.15 Guyana Haiti Honduras Hungary 0.73 0.82 0.60 0.67 0.55 0.71 Iceland India 0.27 Indonesi 0.33 0.30 0.35 0.36 0.44 0.30 Iran 0.22 0.27 0.15 0.16 0.21 0.26 Iraq Ireland 0.71 0.81 0.72 0.76 0.81 0.70 Israel 0.65 0.69 0.57 0.60 0.59 0.69 Italy 0.89 0.94 Jamaica 0.47 0.51 0.41 0.44 0.38 0.46 Japan Jordan 0.31 0.36 0.25 0.31 0.36 0.33 Kazakhst 0.53 0.50 0.51 Kenya Korea N Korea S Kuwait 0.30 0.35 0.32 Kyrgyzst 0.43 0.41 0.08 0.21 0.09 0.39 Laos 0.34 0.20 0.15 0.18 0.21 0.30 Latvia 0.67 0.71 0.31 0.38 0.34 0.66 Lebanon 0.29 0.33 0.19 0.21 0.32 0.27 Lesotho 0.26 0.25 0.24 0.24 0.32 0.28 Liberia Libya 0.39 0.39 0.27 0.28 0.33 0.38 Lithuani 0.53 Macedoni 0.42 0.43 0.43 0.48 0.38 0.47 Madagasc

325
Malawi 0.23 0.17 0.22 0.26 0.24 0.20 Malaysia 0.30 0.44 0.28 Mali 0.09 0.10 0.18 0.22 0.25 0.06 Malta Mauritan 0.23 0.26 0.27 0.29 0.27 0.21 Mexico 0.40 0.42 0.45 0.44 0.65 0.44 Moldova 0.43 0.44 0.23 0.31 0.15 0.47 Mongolia 0.49 0.50 0.30 0.30 0.35 0.45 Morocco Mozambiq 0.27 0.18 0.17 Burma Namibia Nepal 0.26 0.21 0.28 0.30 0.32 0.19 Netherla 0.96 1.00 1.00 1.00 0.98 0.94 New Zela 0.71 0.77 0.79 Nicaragu 0.37 0.32 0.38 0.36 0.53 0.34 Niger 0.20 0.08 Nigeria 0.13 0.09 0.18 0.22 0.21 0.10 Norway 1.00 1.00 1.00 Oman 0.29 0.28 0.28 0.32 0.33 0.28 Pakistan 0.22 0.24 0.20 0.22 0.19 0.15 Panama 0.41 0.39 0.33 0.28 0.55 0.47 Papua NG 0.24 0.26 0.27 0.18 Paraguay 0.29 0.32 0.35 0.35 0.57 0.28 Peru 0.39 0.35 0.49 0.46 0.71 0.42 Philippi 0.25 0.25 0.30 0.32 0.39 0.24 Poland 0.76 0.84 Portugal Qatar 0.29 0.29 0.22 0.28 0.28 0.29 Romania 0.67 0.74 0.60 0.65 0.55 0.67 Russia Rwanda 0.26 0.31 0.33 Samoa 0.36 0.38 0.21 0.25 0.27 0.45 Saudi Ar Senegal Sierra L 0.00 0.01 0.06 0.08 0.21 0.10 Singapor Slovakia 0.65 0.69 0.61 0.61 0.58 0.62 Slovenia 0.68 0.73 0.58 0.63 0.65 0.65 Somalia South Af 0.54 0.49 0.32 0.32 0.38 0.54 Spain 0.79 0.85 0.89 0.87 0.80 Sri Lank 0.35 0.43 0.36 Sudan 0.08 0.03 0.06 0.10 0.11 0.06 Suriname 0.23 Swazilan 0.29 0.28 0.05 0.09 0.16 0.25 Sweden Switzerl 0.99 0.98 Syria 0.28 0.27 0.26 0.28 0.35 0.25 Taiwan

326
Tajikist 0.36 0.28 0.26 0.30 0.21 0.37 Tanzania 0.21 0.17 0.21 0.22 0.24 0.22 Thailand 0.65 0.54 0.52 0.75 0.56 Togo 0.10 0.29 0.07 Trin&Tob 0.49 0.48 0.24 0.25 0.37 0.49 Tunisia 0.47 0.47 0.35 0.32 0.51 0.46 Turkey 0.40 0.40 0.43 0.43 0.49 0.38 Turkmeni 0.51 0.42 0.04 0.04 0.48 Uganda 0.16 0.08 0.18 0.22 0.24 0.20 Ukraine 0.65 0.62 0.24 0.30 0.27 0.64 UnArabEm 0.10 0.19 0.28 UnitedKi USA Uruguay 0.67 0.69 0.59 0.59 0.66 Uzbekist 0.45 0.37 0.25 0.29 0.20 0.38 Venezuel 0.34 0.39 0.40 0.41 0.55 0.33 Vietnam Yemen 0.25 0.24 0.25 0.28 0.26 0.23 Zambia 0.13 0.12 0.07 0.12 0.13 0.11 Zimbabwe 0.23 0.20 0.11 0.15 0.13 0.25
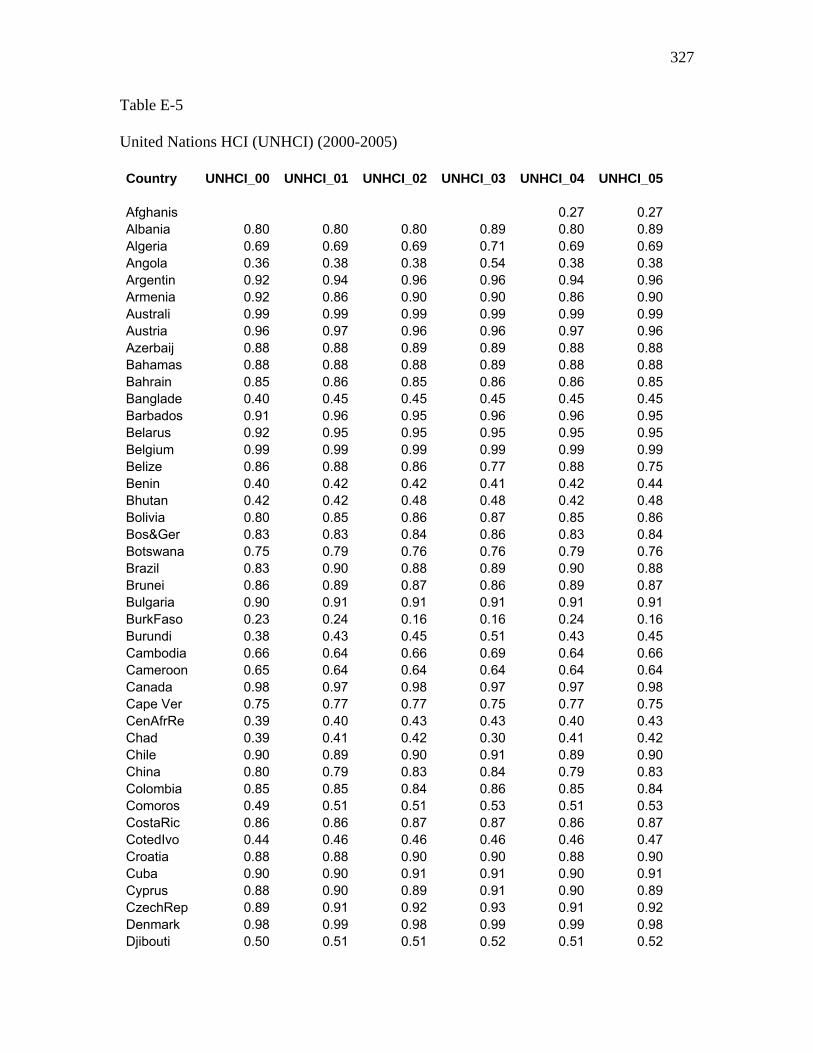
327
Table E-5
United Nations HCI (UNHCI) (2000-2005)
Country UNHCI_00 UNHCI_01 UNHCI_02 UNHCI_03 UNHCI_04 UNHCI_05 Afghanis 0.27 0.27Albania 0.80 0.80 0.80 0.89 0.80 0.89Algeria 0.69 0.69 0.69 0.71 0.69 0.69Angola 0.36 0.38 0.38 0.54 0.38 0.38Argentin 0.92 0.94 0.96 0.96 0.94 0.96Armenia 0.92 0.86 0.90 0.90 0.86 0.90Australi 0.99 0.99 0.99 0.99 0.99 0.99Austria 0.96 0.97 0.96 0.96 0.97 0.96Azerbaij 0.88 0.88 0.89 0.89 0.88 0.88Bahamas 0.88 0.88 0.88 0.89 0.88 0.88Bahrain 0.85 0.86 0.85 0.86 0.86 0.85Banglade 0.40 0.45 0.45 0.45 0.45 0.45Barbados 0.91 0.96 0.95 0.96 0.96 0.95Belarus 0.92 0.95 0.95 0.95 0.95 0.95Belgium 0.99 0.99 0.99 0.99 0.99 0.99Belize 0.86 0.88 0.86 0.77 0.88 0.75Benin 0.40 0.42 0.42 0.41 0.42 0.44Bhutan 0.42 0.42 0.48 0.48 0.42 0.48Bolivia 0.80 0.85 0.86 0.87 0.85 0.86Bos&Ger 0.83 0.83 0.84 0.86 0.83 0.84Botswana 0.75 0.79 0.76 0.76 0.79 0.76Brazil 0.83 0.90 0.88 0.89 0.90 0.88Brunei 0.86 0.89 0.87 0.86 0.89 0.87Bulgaria 0.90 0.91 0.91 0.91 0.91 0.91BurkFaso 0.23 0.24 0.16 0.16 0.24 0.16Burundi 0.38 0.43 0.45 0.51 0.43 0.45Cambodia 0.66 0.64 0.66 0.69 0.64 0.66Cameroon 0.65 0.64 0.64 0.64 0.64 0.64Canada 0.98 0.97 0.98 0.97 0.97 0.98Cape Ver 0.75 0.77 0.77 0.75 0.77 0.75CenAfrRe 0.39 0.40 0.43 0.43 0.40 0.43Chad 0.39 0.41 0.42 0.30 0.41 0.42Chile 0.90 0.89 0.90 0.91 0.89 0.90China 0.80 0.79 0.83 0.84 0.79 0.83Colombia 0.85 0.85 0.84 0.86 0.85 0.84Comoros 0.49 0.51 0.51 0.53 0.51 0.53CostaRic 0.86 0.86 0.87 0.87 0.86 0.87CotedIvo 0.44 0.46 0.46 0.46 0.46 0.47Croatia 0.88 0.88 0.90 0.90 0.88 0.90Cuba 0.90 0.90 0.91 0.91 0.90 0.91Cyprus 0.88 0.90 0.89 0.91 0.90 0.89CzechRep 0.89 0.91 0.92 0.93 0.91 0.92Denmark 0.98 0.99 0.98 0.99 0.99 0.98Djibouti 0.50 0.51 0.51 0.52 0.51 0.52

328
DominRep 0.80 0.81 0.82 0.84 0.81 0.82Ecuador 0.87 0.85 0.85 0.86 0.85 0.85Egypt 0.62 0.63 0.63 0.62 0.63 0.62ElSalvad 0.74 0.74 0.74 0.76 0.74 0.75EqGuinea 0.77 0.76 0.77 0.78 0.76 0.76Eritrea 0.46 0.49 0.49 0.49 0.49 0.49Estonia 0.95 0.96 0.98 0.97 0.96 0.98Ethiopia 0.35 0.38 0.39 0.40 0.38 0.39Fiji 0.90 0.88 0.86 0.86 0.88 0.86Finland 0.99 0.99 0.99 0.99 0.99 0.99France 0.97 0.96 0.96 0.97 0.96 0.96Gabon 0.76 0.75 0.72 0.72 0.75 0.72Gambia 0.39 0.41 0.41 0.41 0.41 0.40Georgia 0.89 0.89 0.89 0.90 0.89 0.89Germany 0.97 0.96 0.95 0.96 0.96 0.95Ghana 0.62 0.64 0.65 0.51 0.64 0.65Greece 0.92 0.93 0.95 0.97 0.93 0.95Guatemal 0.62 0.65 0.65 0.66 0.65 0.65Guinea 0.37 0.37 0.41 0.39 0.37Guyana 0.88 0.94 0.89 0.90 0.94 0.89Haiti 0.50 0.51 0.51 0.50 0.51 0.52Honduras 0.70 0.71 0.71 0.74 0.71 0.74Hungary 0.93 0.93 0.95 0.96 0.93 0.95Iceland 0.96 0.96 0.96 0.98 0.96 0.96India 0.57 0.57 0.59 0.61 0.57 0.59Indonesi 0.79 0.80 0.89 0.81 0.80 0.80Iran 0.75 0.73 0.73 0.74 0.73 0.74Iraq 0.93 0.93Ireland 0.96 0.96 0.96 0.97 0.96 0.96Israel 0.91 0.93 0.94 0.95 0.93 0.94Italy 0.94 0.93 0.93 0.95 0.93 0.93Jamaica 0.79 0.83 0.83 0.83 0.83 0.83Japan 0.93 0.94 0.94 0.94 0.94 0.94Jordan 0.78 0.86 0.86 0.86 0.86 0.86Kazakhst 0.91 0.92 0.93 0.94 0.92 0.93Kenya 0.72 0.73 0.74 0.66 0.73 0.74Korea N 0.96 0.97Korea S 0.95 0.96 0.97 0.97 0.98 0.98Kuwait 0.74 0.73 0.81 0.80 0.73 0.81Kyrgyzst 0.87 0.91 0.92 0.93 0.91 0.92Laos 0.52 0.63 0.64 0.66 0.63 0.64Latvia 0.93 0.95 0.95 0.96 0.95 0.95Lebanon 0.83 0.83 0.84 0.84 0.83 0.84Lesotho 0.76 0.77 0.77 0.76 0.77 0.76Liberia 0.00 0.00Libya 0.84 0.84 0.87 0.86 0.84 0.87Lithuani 0.93 0.94 0.96 0.97 0.94 0.96Macedoni 0.86 0.86 0.87 0.87 0.86 0.87Madagasc 0.58 0.58 0.60 0.64 0.58 0.60Malawi 0.65 0.65 0.66 0.67 0.65 0.66

329
Malaysia 0.80 0.83 0.83 0.83 0.83 0.83Mali 0.37 0.27 0.21 0.23 0.27 0.21Malta 0.88 0.87 0.87 0.85 0.87 0.87Mauritan 0.40 0.41 0.42 0.49 0.41 0.42Mexico 0.84 0.86 0.85 0.85 0.86 0.85Moldova 0.90 0.86 0.87 0.85 0.86 0.87Mongolia 0.88 0.87 0.89 0.90 0.87 0.89Morocco 0.50 0.50 0.53 0.53 0.50 0.53Mozambiq 0.37 0.43 0.45 0.45 0.43 0.45Burma 0.75 0.72 0.73 0.76 0.72 0.73Namibia 0.81 0.80 0.79 0.80 0.80 0.79Nepal 0.48 0.50 0.50 0.53 0.50 0.50Netherla 0.99 0.99 0.99 0.99 0.99 0.99New Zela 0.99 0.99 0.99 0.99 0.99 0.99Nicaragu 0.65 0.66 0.73 0.74 0.66 0.73Niger 0.16 0.17 0.17 0.17 0.17 0.18Nigeria 0.58 0.59 0.59 0.66 0.59 0.59Norway 0.98 0.99 0.99 0.99 0.99 0.99Oman 0.67 0.68 0.71 0.71 0.68 0.71Pakistan 0.42 0.41 0.40 0.44 0.41 0.40Panama 0.86 0.86 0.86 0.88 0.86 0.86Papua NG 0.55 0.57 0.57 0.52 0.57 0.57Paraguay 0.83 0.84 0.85 0.86 0.84 0.85Peru 0.87 0.88 0.86 0.88 0.88 0.86Philippi 0.91 0.90 0.89 0.89 0.90 0.89Poland 0.94 0.95 0.96 0.96 0.95 0.96Portugal 0.94 0.97 0.97 0.97 0.97 0.97Qatar 0.79 0.82 0.83 0.87 0.82 0.83Romania 0.88 0.88 0.88 0.89 0.88 0.88Russia 0.92 0.93 0.95 0.96 0.93 0.95Rwanda 0.58 0.63 0.64 0.61 0.63 0.64Samoa 0.89 0.89 0.89 0.89 0.89 0.89Saudi Ar 0.71 0.71 0.71 0.72 0.71 0.71Senegal 0.37 0.38 0.38 0.39 0.38 0.39Sierra L 0.33 0.41 0.39 0.35 0.41 0.39Singapor 0.91 0.91 0.87 0.87 0.87 0.91Slovakia 0.91 0.90 0.91 0.91 0.90 0.91Slovenia 0.94 0.94 0.96 0.98 0.94 0.96Somalia 0.10 0.00South Af 0.88 0.83 0.82 0.81 0.83 0.83Spain 0.97 0.97 0.97 0.97 0.97 0.97Sri Lank 0.84 0.82 0.82 0.83 0.82 0.83Sudan 0.50 0.51 0.51 0.52 0.51 0.52Suriname 0.90 0.88 0.87 0.83 0.88 0.87Swazilan 0.77 0.79 0.74 0.73 0.79 0.74Sweden 0.99 0.99 0.99 0.99 0.99 0.99Switzerl 0.94 0.95 0.95 0.93 0.95 0.95Syria 0.71 0.70 0.75 0.76 0.70 0.75Taiwan Tajikist 0.88 0.90 0.90 0.91 0.90 0.90

330
Tanzania 0.61 0.61 0.61 0.60 0.61 0.62Thailand 0.84 0.88 0.86 0.86 0.88 0.86Togo 0.59 0.61 0.62 0.57 0.61 0.62Trin&Tob 0.84 0.88 0.87 0.88 0.88 0.87Tunisia 0.72 0.73 0.73 0.73 0.73 0.74Turkey 0.77 0.77 0.80 0.82 0.77 0.80Turkmeni 0.92 0.92 0.93 0.91 0.92 0.93Uganda 0.60 0.69 0.70 0.71 0.69 0.70Ukraine 0.92 0.93 0.94 0.95 0.93 0.94UnArabEm 0.74 0.73 0.74 0.76 0.73 0.74UnitedKi 0.99 0.99 0.99 0.99 0.99 0.99USA 0.98 0.97 0.97 0.97 0.97 0.97Uruguay 0.92 0.93 0.94 0.94 0.93 0.94Uzbekist 0.91 0.91 0.91 0.91 0.91 0.91Venezuel 0.83 0.84 0.86 0.87 0.84 0.86Vietnam 0.84 0.83 0.83 0.82 0.83 0.82Yemen 0.48 0.49 0.50 0.51 0.49 0.50Zambia 0.68 0.68 0.68 0.61 0.68 0.68Zimbabwe 0.81 0.79 0.78 0.78 0.79 0.79
Source: United Nations, Human Development Reports (2000-2007), United Nations, E-Government Readiness Knowledge Base.

331
Table E-6
Expanded HCI-1 (2000-2005) Standardized (Sorted According to Values)
SCORE SCORE SCORE SCORE SCORE SCORE Country EHCI1_00 Country EHCI1_01 Country EHCI1_02 Country EHCI1_03 Country EHCI1_04 Country EHCI1_05 Norway 1.00 Switzerl 1.00 Norway 1.00 Switzerl 1.00 Spain 1.00 Norway 1.00 Switzerl 0.99 Norway 0.94 Switzerl 0.99 Norway 0.98 Italy 0.90 Switzerl 1.00 Netherla 0.96 Netherla 0.87 Netherla 0.97 Netherla 0.93 Norway 0.89 Netherla 0.94 Italy 0.89 Italy 0.83 Italy 0.96 Italy 0.93 Greece 0.88 Finland 0.90 Australi 0.88 Austria 0.80 Australi 0.86 Australi 0.87 Netherla 0.88 Australi 0.89 Austria 0.86 Australi 0.77 Spain 0.86 Finland 0.85 Switzerl 0.87 Italy 0.89 Belgium 0.85 Belgium 0.77 Austria 0.84 Spain 0.81 Finland 0.85 Austria 0.84 Spain 0.79 Spain 0.74 Belgium 0.82 Austria 0.81 CostaRic 0.84 Belgium 0.84 Canada 0.76 Poland 0.73 Canada 0.78 Belgium 0.80 Peru 0.84 Spain 0.80 Poland 0.76 Hungary 0.72 Greece 0.76 Canada 0.78 Austria 0.81 New Zela 0.79 Hungary 0.74 Canada 0.71 Ireland 0.70 Greece 0.73 Ireland 0.80 Canada 0.76 CzechRep 0.71 Ireland 0.70 CzechRep 0.59 Ireland 0.70 Argentin 0.80 CzechRep 0.74 Ireland 0.71 CzechRep 0.69 Slovakia 0.59 New Zela 0.67 Belgium 0.79 Estonia 0.72 Slovenia 0.68 Estonia 0.65 Hungary 0.59 Hungary 0.62 Australi 0.78 Hungary 0.72 Estonia 0.68 Romania 0.64 Romania 0.58 CzechRep 0.62 Thailand 0.78 Ireland 0.70 Romania 0.67 Greece 0.64 Argentin 0.58 Bulgaria 0.61 Mexico 0.75 Israel 0.69 Latvia 0.67 Slovenia 0.64 Bulgaria 0.57 Romania 0.60 DominRep 0.74 Greece 0.69 Uruguay 0.67 Latvia 0.62 Uruguay 0.57 Slovenia 0.59 Ecuador 0.74 Bahamas 0.68 Ukraine 0.66 Bulgaria 0.62 Slovenia 0.57 Slovakia 0.58 Brazil 0.73 Bulgaria 0.67 Slovakia 0.65 Uruguay 0.60 Israel 0.55 Argentin 0.56 Chile 0.73 Latvia 0.67 Israel 0.65 Slovakia 0.60 CostaRic 0.55 Israel 0.56 Paraguay 0.72 Uruguay 0.67 Bulgaria 0.65 Israel 0.60 Thailand 0.52 Uruguay 0.56 Nicaragu 0.71 Romania 0.67 Bahamas 0.61 Thailand 0.56 Brazil 0.49 CostaRic 0.51 ElSalvad 0.70 Ukraine 0.65 Argentin 0.59 Ukraine 0.55 Peru 0.46 Lithuani 0.50 Canada 0.70 Slovenia 0.65 Greece 0.59 Bahamas 0.52 Chile 0.44 Thailand 0.49 Venezuel 0.69 Slovakia 0.62

332
CostaRic 0.54 CostaRic 0.51 Mexico 0.44 Brazil 0.46 New Zela 0.68 Croatia 0.62 South Af 0.53 Argentin 0.49 Macedoni 0.41 Macedoni 0.44 Bolivia 0.67 Argentin 0.58 Kazakhst 0.53 Jamaica 0.44 Turkey 0.41 Peru 0.42 Panama 0.67 Thailand 0.56 Turkmeni 0.50 Kazakhst 0.44 DominRep 0.41 Chile 0.42 Banglade 0.64 CostaRic 0.55 Trin&Tob 0.49 Chile 0.43 Albania 0.40 DominRep 0.41 Cape Ver 0.63 South Af 0.54 Mongolia 0.48 Mongolia 0.42 Ecuador 0.40 Albania 0.41 Slovenia 0.63 Kazakhst 0.51 Chile 0.48 Brazil 0.42 Jamaica 0.40 Jamaica 0.41 Guinea 0.62 Chile 0.51 Brazil 0.48 South Af 0.42 Venezuel 0.38 Mexico 0.40 Fiji 0.61 Trin&Tob 0.49 Tunisia 0.47 Trin&Tob 0.41 Cape Ver 0.37 Turkey 0.39 Yemen 0.61 Moldova 0.48 Jamaica 0.47 Tunisia 0.40 Bolivia 0.36 Cape Ver 0.38 Croatia 0.61 Brazil 0.48 Moldova 0.44 Bos&Ger 0.40 Nicaragu 0.36 Venezuel 0.37 Tunisia 0.61 Georgia 0.47 Uzbekist 0.44 Cape Ver 0.39 Armenia 0.34 Estonia 0.37 Turkey 0.61 Turkmeni 0.47 Bos&Ger 0.44 Moldova 0.39 Indonesi 0.34 Ecuador 0.37 Indonesi 0.60 Macedoni 0.46 Kyrgyzst 0.43 Macedoni 0.37 Tunisia 0.34 Latvia 0.36 Cambodia 0.59 Panama 0.46 Macedoni 0.42 DominRep 0.36 Paraguay 0.33 Bos&Ger 0.36 Nepal 0.59 Tunisia 0.46 DominRep 0.42 Egypt 0.36 Estonia 0.33 Armenia 0.35 Malaysia 0.59 Jamaica 0.46 Cape Ver 0.40 Mexico 0.36 Panama 0.31 Egypt 0.34 Philippi 0.58 Belize 0.45 Panama 0.40 Turkmeni 0.35 Egypt 0.31 Indonesi 0.33 Algeria 0.58 Mongolia 0.44 Belize 0.40 Belize 0.35 Latvia 0.31 Bolivia 0.32 Jordan 0.58 Mexico 0.43 Albania 0.40 Kyrgyzst 0.35 South Af 0.31 Nicaragu 0.32 Libya 0.58 Samoa 0.43 Mexico 0.40 Albania 0.35 Bos&Ger 0.30 Sri Lank 0.32 Sri Lank 0.57 DominRep 0.43 Turkey 0.39 Georgia 0.35 ElSalvad 0.30 Paraguay 0.32 Israel 0.57 Albania 0.43 Georgia 0.39 Turkey 0.34 Cambodia 0.29 ElSalvad 0.32 Ghana 0.57 Cape Ver 0.41 Peru 0.38 Panama 0.34 Comoros 0.29 Georgia 0.31 Oman 0.56 Peru 0.41 Bhutan 0.38 Botswana 0.33 Banglade 0.29 Cambodia 0.31 Samoa 0.56 Botswana 0.40 Libya 0.38 Venezuel 0.33 Philippi 0.29 Ghana 0.31 Lesotho 0.56 Bos&Ger 0.39 Nicaragu 0.37 Libya 0.32 Ghana 0.28 Comoros 0.30 Slovakia 0.56 ElSalvad 0.39 Ecuador 0.37 ElSalvad 0.31 Mongolia 0.28 Banglade 0.30 Comoros 0.56 Kyrgyzst 0.38 Botswana 0.36 Samoa 0.31 Georgia 0.28 Tunisia 0.30 Rwanda 0.55 Turkey 0.38 Azerbaij 0.36 Armenia 0.31 Azerbaij 0.28 Moldova 0.30 Guatemal 0.55 Uzbekist 0.36 Bahrain 0.36 Ecuador 0.31 Nepal 0.27 South Af 0.29 Albania 0.55 Ecuador 0.36 Tajikist 0.35 Uzbekist 0.31 Bahrain 0.27 Bahrain 0.29 Togo 0.54 Libya 0.36 Armenia 0.34 Bahrain 0.31 Mauritan 0.26 Ukraine 0.29 Romania 0.54 Sri Lank 0.36 Samoa 0.34 Jordan 0.30 Oman 0.26 Philippi 0.28 Armenia 0.54 Tajikist 0.36 Egypt 0.34 Azerbaij 0.30 Libya 0.25 Oman 0.28 Laos 0.53 Armenia 0.35 Venezuel 0.34 Peru 0.29 Bahamas 0.25 Kuwait 0.28 Syria 0.52 Bahrain 0.35

333
Laos 0.33 Lebanon 0.29 Ukraine 0.25 Bhutan 0.28 Sierra L 0.52 Azerbaij 0.35 Bolivia 0.33 Bhutan 0.29 Algeria 0.25 Malaysia 0.27 Egypt 0.52 Bhutan 0.35 Indonesi 0.32 Nicaragu 0.27 Syria 0.25 Jordan 0.27 Bahrain 0.51 Nicaragu 0.34 ElSalvad 0.32 Djibouti 0.27 Moldova 0.24 Nepal 0.27 Benin 0.51 Kuwait 0.33 Cambodia 0.31 Bolivia 0.27 Trin&Tob 0.24 Mongolia 0.27 Mali 0.51 Rwanda 0.32 Jordan 0.30 Paraguay 0.27 Tajikist 0.23 Mauritan 0.27 Bulgaria 0.51 Egypt 0.32 Algeria 0.29 Comoros 0.27 Uzbekist 0.23 Tajikist 0.27 Papua NG 0.50 Jordan 0.32 Lebanon 0.29 Algeria 0.26 Papua NG 0.23 Algeria 0.26 South Af 0.50 Venezuel 0.32 Paraguay 0.28 Indonesi 0.25 Yemen 0.23 Bahamas 0.26 Niger 0.50 Fiji 0.31 Qatar 0.28 Qatar 0.24 Jordan 0.23 Azerbaij 0.26 Hungary 0.50 Cambodia 0.30 Oman 0.28 Iran 0.24 Bhutan 0.23 Uzbekist 0.26 Mauritan 0.49 Indonesi 0.29 Swazilan 0.28 Oman 0.23 Lesotho 0.22 Syria 0.26 Tanzania 0.49 Burundi 0.29 Burundi 0.28 Tajikist 0.23 Djibouti 0.22 Panama 0.25 BurkFaso 0.49 Qatar 0.28 Comoros 0.28 Syria 0.23 Burundi 0.21 Libya 0.25 CzechRep 0.49 Laos 0.28 Syria 0.27 Mauritan 0.23 Guatemal 0.21 Qatar 0.25 Qatar 0.48 Malaysia 0.28 India 0.27 Swazilan 0.22 Qatar 0.21 Mozambiq 0.24 Trin&Tob 0.48 Bolivia 0.28 Banglade 0.26 Cambodia 0.22 Malawi 0.21 Yemen 0.24 Malawi 0.48 Lebanon 0.27 Nepal 0.25 Banglade 0.21 Tanzania 0.19 Fiji 0.24 Pakistan 0.48 Paraguay 0.27 Lesotho 0.25 Philippi 0.21 Samoa 0.19 Djibouti 0.24 Burundi 0.48 Oman 0.27 Philippi 0.24 Lesotho 0.21 Pakistan 0.19 Papua NG 0.24 Macedoni 0.48 Lesotho 0.27 Yemen 0.24 Pakistan 0.20 Guinea 0.19 Trin&Tob 0.23 Swazilan 0.47 UnArabEm 0.27 Mauritan 0.24 Yemen 0.20 Lebanon 0.19 Malawi 0.23 Mongolia 0.47 Algeria 0.27 Gabon 0.24 Gabon 0.20 Gabon 0.19 Angola 0.23 Bhutan 0.47 Banglade 0.26 Djibouti 0.23 Nepal 0.18 Mali 0.18 Rwanda 0.23 Tajikist 0.46 Iran 0.26 Iran 0.22 EqGuinea 0.18 Angola 0.18 Guatemal 0.23 Uganda 0.46 Djibouti 0.26 Zimbabwe 0.22 Zimbabwe 0.17 Benin 0.18 Burundi 0.22 Jamaica 0.46 Syria 0.25 Malawi 0.22 Ghana 0.17 Nigeria 0.17 Samoa 0.22 Botswana 0.46 Comoros 0.25 Pakistan 0.22 Laos 0.16 Uganda 0.17 Lesotho 0.21 EqGuinea 0.46 Zimbabwe 0.24 EqGuinea 0.22 Guatemal 0.16 Botswana 0.17 Mali 0.20 Nigeria 0.44 Swazilan 0.24 Tanzania 0.20 Burundi 0.16 Niger 0.16 Pakistan 0.20 Bahamas 0.42 Ghana 0.23 Cameroon 0.17 Angola 0.16 Iran 0.15 Uganda 0.20 Belize 0.42 Philippi 0.23 Eritrea 0.17 Malawi 0.15 EqGuinea 0.14 Nigeria 0.20 Lebanon 0.42 EqGuinea 0.22 Uganda 0.16 Cameroon 0.14 Laos 0.13 Benin 0.20 Uzbekist 0.41 Mauritan 0.21 Guinea 0.16 Tanzania 0.14 Chad 0.13 Tanzania 0.19 UnArabEm 0.40 Yemen 0.21 Guatemal 0.15 CotedIvo 0.12 Zimbabwe 0.11 Lebanon 0.19 Kuwait 0.40 Gabon 0.21 Ghana 0.13 Benin 0.11 Cameroon 0.11 Gabon 0.19 Mozambiq 0.38 Tanzania 0.21

334
Benin 0.13 Eritrea 0.11 Eritrea 0.09 Kyrgyzst 0.19 Sudan 0.38 Uganda 0.20 Zambia 0.13 Zambia 0.10 Kyrgyzst 0.08 Botswana 0.18 Chad 0.38 Malawi 0.19 Nigeria 0.13 Niger 0.10 BurkFaso 0.07 Niger 0.17 Cameroon 0.37 Nepal 0.19 Chad 0.10 Mali 0.09 Zambia 0.07 Laos 0.16 Eritrea 0.36 Papua NG 0.18 Niger 0.10 Nigeria 0.07 Sierra L 0.06 Iran 0.15 Zambia 0.36 Mozambiq 0.17 Mali 0.10 Uganda 0.07 Sudan 0.05 EqGuinea 0.14 Gabon 0.35 Guatemal 0.16 CotedIvo 0.10 Chad 0.06 Belize 0.05 Zimbabwe 0.13 Azerbaij 0.34 Cameroon 0.16 Sudan 0.08 Sudan 0.02 Kazakhst 0.05 Cameroon 0.13 CenAfrRe 0.34 Eritrea 0.16 Angola 0.05 Sierra L 0.01 Turkmeni 0.04 Chad 0.12 Iran 0.34 Guinea 0.15 BurkFaso 0.02 BurkFaso 0.00 Swazilan 0.04 Kazakhst 0.12 Georgia 0.34 Pakistan 0.14 Sierra L 0.00 CotedIvo 0.00 Eritrea 0.11 Suriname 0.33 Benin 0.11 Afghanis Zambia 0.10 CotedIvo 0.31 Zambia 0.11 Afghanis Barbados Afghanis CotedIvo 0.09 Bos&Ger 0.31 Sierra L 0.10 Barbados Belarus Barbados BurkFaso 0.09 Djibouti 0.30 Nigeria 0.09 Belarus Brunei Belarus Sudan 0.08 Zimbabwe 0.30 Chad 0.09 Brunei CenAfrRe Brunei Togo 0.08 Latvia 0.30 Niger 0.08 CenAfrRe China CenAfrRe UnArabEm 0.08 Estonia 0.29 Togo 0.07 China Colombia China Swazilan 0.07 Angola 0.26 Mali 0.06 Colombia Croatia Colombia Sierra L 0.07 Turkmeni 0.23 Sudan 0.06 Croatia Cuba Croatia Belize 0.06 Kyrgyzst 0.23 CenAfrRe 0.05 Cuba Cyprus Cuba Turkmeni 0.05 Ukraine 0.20 CotedIvo 0.05 Cyprus Denmark Cyprus CenAfrRe 0.00 Moldova 0.13 Angola 0.04 Denmark Ethiopia Denmark Kazakhst 0.00 BurkFaso 0.00 Ethiopia Fiji Ethiopia Afghanis Fiji Finland Fiji Barbados Afghanis Afghanis Finland France Finland Belarus Barbados Barbados France Gambia France Brunei Belarus Belarus Gambia Germany Gambia China Brunei Brunei Germany Guinea Germany Colombia China China Guyana Guyana Guyana Croatia Colombia Colombia Haiti Haiti Haiti Cuba Cuba Cuba Honduras Honduras Honduras Cyprus Cyprus Cyprus Iceland Iceland Iceland Denmark Denmark Denmark Iraq India India Ethiopia Ethiopia Ethiopia Japan Iraq Iraq France France France Kenya Japan Japan Gambia Gambia Gambia

335
Korea N Kenya Kenya Germany Germany Germany Korea S Korea N Korea N Guinea Guyana Guyana Kuwait Korea S Korea S Guyana Haiti Haiti Liberia Kuwait Kuwait Haiti Honduras Honduras Lithuani Liberia Liberia Honduras Iceland Iceland Madagasc Lithuani Lithuani Iceland India India Malaysia Madagasc Madagasc India Iraq Iraq Malta Malaysia Malaysia Iraq Japan Japan Morocco Malta Malta Japan Kenya Kenya Mozambiq Morocco Morocco Kenya Korea N Korea N Burma Mozambiq Mozambiq Korea N Korea S Korea S Namibia Burma Burma Korea S Liberia Liberia New Zela Namibia Namibia Liberia Lithuani Lithuani Papua NG New Zela New Zela Madagasc Madagasc Madagasc Portugal Papua NG Poland Malta Malta Malta Russia Portugal Portugal Morocco Morocco Morocco Rwanda Russia Russia Burma Burma Burma Saudi Ar Rwanda Rwanda Namibia Namibia Namibia Senegal Saudi Ar Saudi Ar Poland Poland Poland Singapor Senegal Senegal Portugal Portugal Portugal Somalia Singapor Singapor Russia Russia Russia Sri Lank Somalia Somalia Saudi Ar Saudi Ar Saudi Ar Suriname Sri Lank Sri Lank Senegal Senegal Senegal Sweden Suriname Suriname Singapor Singapor Singapor Taiwan Sweden Sweden Somalia Somalia Somalia Thailand Taiwan Taiwan Suriname Sweden Suriname Togo Togo Togo Sweden Taiwan Sweden UnArabEm UnArabEm UnArabEm Taiwan UnitedKi Taiwan UnitedKi UnitedKi UnitedKi UnitedKi USA UnitedKi USA USA USA USA Uruguay USA Vietnam Vietnam Vietnam Vietnam Vietnam Vietnam

336
Table E-7
Expanded HCI-II (2000-2005) Standardized (Sorted According to Values)
SCORE SCORE SCORE SCORE SCORE SCORE Country EHCI2_00 Country EHCI2_01 Country EHCI2_02 Country EHCI2_03 Country EHCI2_04 Country EHCI2_05 Norway 1.00 Netherla 1.00 Netherla 1.00 Netherla 1.00 Norway 1.00 Norway 1.00 Switzerl 0.99 Austria 0.91 Spain 0.89 Australi 0.93 Switzerl 0.98 Netherla 0.94 Netherla 0.96 Australi 0.88 Australi 0.88 Finland 0.91 Netherla 0.98 Finland 0.90 Italy 0.89 Belgium 0.88 Austria 0.86 Spain 0.87 Finland 0.95 Australi 0.89 Australi 0.87 Spain 0.85 Belgium 0.84 Austria 0.86 Italy 0.94 Austria 0.84 Austria 0.86 Poland 0.84 Canada 0.80 Belgium 0.85 Belgium 0.93 Belgium 0.83 Belgium 0.84 Hungary 0.82 Greece 0.79 Canada 0.84 Greece 0.89 Spain 0.80 Spain 0.79 Canada 0.82 Ireland 0.72 Greece 0.78 Australi 0.89 New Zela 0.79 Canada 0.76 Ireland 0.81 Slovakia 0.61 Ireland 0.76 Austria 0.89 Canada 0.75 Poland 0.76 CzechRep 0.79 CzechRep 0.60 New Zela 0.71 Ireland 0.81 CzechRep 0.73 Hungary 0.73 Estonia 0.74 Romania 0.60 Hungary 0.67 CostaRic 0.81 Estonia 0.71 Ireland 0.71 Greece 0.74 Hungary 0.60 CzechRep 0.65 Argentin 0.80 Hungary 0.71 CzechRep 0.70 Romania 0.74 Argentin 0.60 Bulgaria 0.65 Canada 0.78 Ireland 0.70 Slovenia 0.68 Slovenia 0.73 Bulgaria 0.59 Romania 0.65 New Zela 0.77 Greece 0.69 Romania 0.67 Latvia 0.71 Uruguay 0.59 Slovenia 0.63 Thailand 0.75 Israel 0.69 Estonia 0.67 Bulgaria 0.71 Slovenia 0.58 Slovakia 0.61 Chile 0.72 Bulgaria 0.67 Uruguay 0.67 Slovakia 0.69 Israel 0.57 Argentin 0.61 Brazil 0.71 Romania 0.67 Latvia 0.67 Uruguay 0.69 CostaRic 0.57 Israel 0.60 Peru 0.71 Latvia 0.66 Ukraine 0.65 Israel 0.69 Thailand 0.54 Uruguay 0.59 Mexico 0.65 Uruguay 0.66 Slovakia 0.65 Thailand 0.65 Brazil 0.50 CostaRic 0.54 Slovenia 0.65 Slovenia 0.65 Israel 0.65 Ukraine 0.62 Peru 0.49 Lithuani 0.53 DominRep 0.64 Ukraine 0.64 Bulgaria 0.64 Bahamas 0.60 Mexico 0.45 Thailand 0.52 Croatia 0.63 Slovakia 0.62 Bahamas 0.61 CostaRic 0.58 Chile 0.45 Brazil 0.49 Ecuador 0.60 Croatia 0.62 Argentin 0.59 Argentin 0.56 Macedoni 0.43 Macedoni 0.48 CzechRep 0.59 Argentin 0.58 Greece 0.59 Jamaica 0.51 Turkey 0.43 Peru 0.46 Israel 0.59 Thailand 0.56 South Af 0.54 Kazakhst 0.50 DominRep 0.42 Chile 0.45 Slovakia 0.58 CostaRic 0.55 CostaRic 0.54 Mongolia 0.50 Ecuador 0.42 DominRep 0.45 Paraguay 0.57 South Af 0.54 Kazakhst 0.53 Chile 0.49 Albania 0.41 Albania 0.44 Bulgaria 0.55 Kazakhst 0.51 Turkmeni 0.51 South Af 0.49 Jamaica 0.41 Jamaica 0.44 Romania 0.55 Chile 0.51 Mongolia 0.49 Brazil 0.49 Venezuel 0.40 Mexico 0.44 Hungary 0.55 Trin&Tob 0.49

337
Trin&Tob 0.49 Trin&Tob 0.48 Cape Ver 0.39 Turkey 0.43 Venezuel 0.55 Turkmeni 0.48 Chile 0.48 Tunisia 0.47 Nicaragu 0.38 Cape Ver 0.41 Panama 0.55 Brazil 0.48 Brazil 0.48 Cape Ver 0.46 Bolivia 0.38 Venezuel 0.41 ElSalvad 0.54 Moldova 0.47 Tunisia 0.47 Bos&Ger 0.46 Indonesi 0.35 Ecuador 0.41 Bolivia 0.54 Georgia 0.47 Jamaica 0.47 Moldova 0.44 Armenia 0.35 Estonia 0.39 Nicaragu 0.53 Panama 0.47 Uzbekist 0.45 Macedoni 0.43 Paraguay 0.35 Bos&Ger 0.38 Tunisia 0.51 Macedoni 0.47 Bos&Ger 0.44 Belize 0.42 Tunisia 0.35 Armenia 0.38 Cape Ver 0.49 Belize 0.47 Kyrgyzst 0.43 DominRep 0.42 Panama 0.33 Latvia 0.38 Turkey 0.49 Tunisia 0.46 Moldova 0.43 Turkmeni 0.42 Estonia 0.32 Egypt 0.37 Malaysia 0.44 Jamaica 0.46 Macedoni 0.42 Egypt 0.42 Egypt 0.32 Indonesi 0.36 Albania 0.44 Samoa 0.45 DominRep 0.42 Mexico 0.42 South Af 0.32 Nicaragu 0.36 Indonesi 0.44 Mongolia 0.45 Belize 0.41 Kyrgyzst 0.41 ElSalvad 0.32 Bolivia 0.36 Sri Lank 0.43 Mexico 0.44 Cape Ver 0.41 Albania 0.41 Bos&Ger 0.31 Paraguay 0.35 Armenia 0.43 DominRep 0.43 Panama 0.41 Georgia 0.41 Latvia 0.31 Sri Lank 0.35 Philippi 0.39 Albania 0.43 Albania 0.40 Turkey 0.40 Cambodia 0.31 Cambodia 0.35 Banglade 0.39 Peru 0.42 Turkey 0.40 Panama 0.39 Philippi 0.30 ElSalvad 0.35 Jamaica 0.38 Cape Ver 0.41 Mexico 0.40 Botswana 0.39 Banglade 0.30 Georgia 0.34 Macedoni 0.38 Botswana 0.41 Libya 0.39 Venezuel 0.39 Comoros 0.30 Ghana 0.34 South Af 0.38 ElSalvad 0.40 Georgia 0.39 Libya 0.39 Ghana 0.30 Comoros 0.33 Fiji 0.37 Bos&Ger 0.39 Peru 0.39 Samoa 0.38 Mongolia 0.30 Banglade 0.33 Trin&Tob 0.37 Kyrgyzst 0.39 Bhutan 0.39 ElSalvad 0.37 Azerbaij 0.29 Bahrain 0.33 Ghana 0.36 Turkey 0.38 Nicaragu 0.37 Uzbekist 0.37 Georgia 0.29 Tunisia 0.32 Jordan 0.36 Libya 0.38 Ecuador 0.37 Bahrain 0.37 Bahrain 0.28 South Af 0.32 Estonia 0.36 Uzbekist 0.38 Botswana 0.37 Ecuador 0.37 Nepal 0.28 Philippi 0.32 Bahamas 0.35 Ecuador 0.37 Bahrain 0.37 Armenia 0.36 Oman 0.28 Oman 0.32 Kuwait 0.35 Tajikist 0.37 Azerbaij 0.37 Jordan 0.36 Libya 0.27 Moldova 0.31 Mongolia 0.35 Bahrain 0.36 Tajikist 0.36 Azerbaij 0.35 Algeria 0.27 Bhutan 0.31 Cambodia 0.35 Sri Lank 0.36 Samoa 0.36 Peru 0.35 Mauritan 0.27 Jordan 0.31 Syria 0.35 Armenia 0.36 Armenia 0.35 Bhutan 0.33 Bahamas 0.26 Tajikist 0.30 Latvia 0.34 Bhutan 0.35 Laos 0.34 Lebanon 0.33 Syria 0.26 Malaysia 0.30 Bahrain 0.34 Azerbaij 0.35 Venezuel 0.34 Algeria 0.32 Tajikist 0.26 Nepal 0.30 Guinea 0.34 Nicaragu 0.34 Egypt 0.34 Nicaragu 0.32 Uzbekist 0.25 Algeria 0.30 Oman 0.33 Rwanda 0.33 Bolivia 0.33 Paraguay 0.32 Yemen 0.25 Ukraine 0.30 Libya 0.33 Jordan 0.33 Indonesi 0.33 Bolivia 0.32 Jordan 0.25 Kuwait 0.30 Egypt 0.33 Fiji 0.33 ElSalvad 0.32 Comoros 0.31 Trin&Tob 0.24 Mongolia 0.30 Guatemal 0.33 Venezuel 0.33 Cambodia 0.32 Djibouti 0.30 Ukraine 0.24 Mauritan 0.29 Lebanon 0.32 Egypt 0.33

338
Jordan 0.31 Indonesi 0.30 Papua NG 0.24 Uzbekist 0.29 Nepal 0.32 Kuwait 0.32 Algeria 0.30 Qatar 0.29 Lesotho 0.24 Azerbaij 0.29 Lesotho 0.32 Cambodia 0.31 Swazilan 0.29 Oman 0.28 Bhutan 0.24 Bahamas 0.28 Algeria 0.31 Indonesi 0.30 Oman 0.29 Tajikist 0.28 Moldova 0.23 Libya 0.28 Rwanda 0.31 Laos 0.30 Qatar 0.29 Swazilan 0.28 Guatemal 0.23 Syria 0.28 Comoros 0.30 Qatar 0.29 Paraguay 0.29 Iran 0.27 Qatar 0.22 Yemen 0.28 Burundi 0.29 Bolivia 0.29 Lebanon 0.29 Syria 0.27 Malawi 0.22 Panama 0.28 Togo 0.29 Malaysia 0.28 Syria 0.28 Cambodia 0.26 Burundi 0.21 Fiji 0.28 EqGuinea 0.29 Algeria 0.28 Comoros 0.28 Mauritan 0.26 Samoa 0.21 Qatar 0.28 Botswana 0.28 Burundi 0.28 Burundi 0.27 Philippi 0.25 Djibouti 0.21 Mozambiq 0.27 Qatar 0.28 Lesotho 0.28 India 0.27 Lesotho 0.25 Tanzania 0.21 Papua NG 0.26 Mauritan 0.27 Oman 0.28 Banglade 0.26 Banglade 0.25 Pakistan 0.20 Malawi 0.26 Ukraine 0.27 UnArabEm 0.28 Nepal 0.26 Yemen 0.24 Guinea 0.20 Rwanda 0.26 Papua NG 0.27 Paraguay 0.28 Lesotho 0.26 Pakistan 0.24 Lebanon 0.19 Guatemal 0.25 Samoa 0.27 Lebanon 0.27 Philippi 0.25 Gabon 0.23 Gabon 0.19 Samoa 0.25 Yemen 0.26 Banglade 0.27 Yemen 0.25 Nepal 0.21 Benin 0.19 Trin&Tob 0.25 Gabon 0.26 Iran 0.26 Mauritan 0.23 EqGuinea 0.21 Angola 0.18 Angola 0.25 Mali 0.25 Swazilan 0.25 Gabon 0.23 Zimbabwe 0.20 Mali 0.18 Djibouti 0.25 Georgia 0.25 Syria 0.25 Zimbabwe 0.23 Laos 0.20 Nigeria 0.18 Lesotho 0.24 Malawi 0.24 Comoros 0.25 Malawi 0.23 Ghana 0.20 Uganda 0.18 Burundi 0.24 Uganda 0.24 Zimbabwe 0.25 Iran 0.22 Guatemal 0.19 Botswana 0.17 Pakistan 0.22 Tanzania 0.24 Djibouti 0.24 Pakistan 0.22 Angola 0.18 Iran 0.15 Nigeria 0.22 Suriname 0.23 Ghana 0.24 EqGuinea 0.22 Burundi 0.18 Laos 0.15 Uganda 0.22 Bhutan 0.23 Philippi 0.24 Djibouti 0.22 Malawi 0.17 EqGuinea 0.14 Benin 0.22 Djibouti 0.23 Yemen 0.23 Tanzania 0.21 Tanzania 0.17 Chad 0.13 Tanzania 0.22 Bos&Ger 0.22 EqGuinea 0.22 Cameroon 0.17 Cameroon 0.17 Zimbabwe 0.11 Mali 0.22 Sierra L 0.21 Tanzania 0.22 Uganda 0.16 CotedIvo 0.14 Cameroon 0.11 Kyrgyzst 0.21 Benin 0.21 Mauritan 0.21 Eritrea 0.16 Benin 0.13 Eritrea 0.09 Lebanon 0.21 Tajikist 0.21 Gabon 0.21 Guinea 0.16 Zambia 0.12 Kyrgyzst 0.08 Botswana 0.20 Laos 0.21 Uganda 0.20 Guatemal 0.15 Eritrea 0.12 Zambia 0.07 Gabon 0.20 Nigeria 0.21 Malawi 0.20 Ghana 0.13 Mali 0.10 Belize 0.06 Laos 0.18 Iran 0.21 Nepal 0.19 Benin 0.13 Nigeria 0.09 Sierra L 0.06 Iran 0.16 Azerbaij 0.21 Papua NG 0.18 Zambia 0.13 Uganda 0.08 Sudan 0.06 EqGuinea 0.16 Uzbekist 0.20 Guatemal 0.17 Nigeria 0.13 Chad 0.06 Swazilan 0.05 Zimbabwe 0.15 Niger 0.20 Mozambiq 0.17 Chad 0.10 Sudan 0.03 Turkmeni 0.04 Cameroon 0.14 UnArabEm 0.19 Cameroon 0.16 CotedIvo 0.10 Sierra L 0.01 CotedIvo 0.00 Chad 0.13 Pakistan 0.19 Eritrea 0.16

339
Mali 0.09 BurkFaso 0.00 Eritrea 0.12 Belize 0.19 Guinea 0.15 Sudan 0.08 Afghanis Zambia 0.12 Mozambiq 0.18 Pakistan 0.15 Angola 0.05 Afghanis Barbados CotedIvo 0.11 Cameroon 0.17 Benin 0.12 BurkFaso 0.02 Barbados Belarus BurkFaso 0.11 Swazilan 0.16 Zambia 0.11 Sierra L 0.00 Belarus Brunei Togo 0.10 BurkFaso 0.16 Sierra L 0.10 Brunei BurkFaso Sudan 0.10 Moldova 0.15 Nigeria 0.10 Afghanis CenAfrRe CenAfrRe UnArabEm 0.10 Chad 0.14 Chad 0.08 Barbados China China Swazilan 0.09 Eritrea 0.13 Niger 0.08 Belarus Colombia Colombia Sierra L 0.08 Zimbabwe 0.13 Togo 0.07 Brunei Croatia Croatia Belize 0.08 Zambia 0.13 Sudan 0.06 CenAfrRe Cuba Cuba CenAfrRe 0.00 CenAfrRe 0.12 Mali 0.06 China Cyprus Cyprus Sudan 0.11 CotedIvo 0.05 Colombia Denmark Denmark Afghanis Kyrgyzst 0.09 CenAfrRe 0.05 Croatia Ethiopia Ethiopia Barbados Turkmeni 0.04 Angola 0.03 Cuba Fiji Fiji Belarus Angola 0.02 BurkFaso 0.00 Cyprus Finland Finland Brunei CotedIvo 0.00 Denmark France France China Afghanis Ethiopia Gambia Gambia Colombia Afghanis Bahamas Fiji Germany Germany Croatia Barbados Barbados Finland Guinea Guyana Cuba Belarus Belarus France Guyana Haiti Cyprus Brunei Brunei Gambia Haiti Honduras Denmark China China Germany Honduras Iceland Ethiopia Colombia Colombia Guyana Iceland India France Cuba Cuba Haiti India Iraq Gambia Cyprus Cyprus Honduras Iraq Italy Germany Denmark Denmark Iceland Italy Japan Guinea Ethiopia Ethiopia Iraq Japan Kazakhst Guyana France France Japan Kenya Kenya Haiti Gambia Gambia Kenya Korea N Korea N Honduras Germany Germany Korea N Korea S Korea S Iceland Guyana Guyana Korea S Kuwait Kuwait India Haiti Haiti Kuwait Liberia Liberia Iraq Honduras Honduras Liberia Lithuani Lithuani Italy Iceland Iceland Lithuani Madagasc Madagasc Japan India India Madagasc Malaysia Malaysia Kazakhst Iraq Iraq

340
Malaysia Malta Malta Kenya Japan Italy Malta Morocco Morocco Korea N Kazakhst Japan Morocco Mozambiq Mozambiq Korea S Kenya Kenya Mozambiq Burma Burma Liberia Korea N Korea N Burma Namibia Namibia Madagasc Korea S Korea S Namibia New Zela New Zela Malta Liberia Liberia New Zela Niger Niger Morocco Lithuani Lithuani Niger Norway Norway Burma Madagasc Madagasc Papua NG Papua NG Poland Namibia Malta Malta Portugal Portugal Portugal Niger Morocco Morocco Russia Russia Russia Norway Burma Burma Rwanda Rwanda Rwanda Poland Namibia Namibia Saudi Ar Saudi Ar Saudi Ar Portugal Poland Poland Senegal Senegal Senegal Russia Portugal Portugal Singapor Singapor Singapor Saudi Ar Russia Russia Somalia Somalia Somalia Senegal Saudi Ar Saudi Ar Sri Lank Sri Lank Sri Lank Singapor Senegal Senegal Suriname Suriname Suriname Somalia Singapor Singapor Sweden Sweden Sweden Suriname Somalia Somalia Taiwan Switzerl Switzerl Sweden Spain Suriname Thailand Taiwan Taiwan Switzerl Sweden Sweden Togo Togo Togo Taiwan Taiwan Switzerl UnArabEm UnArabEm UnArabEm Turkmeni UnitedKi Taiwan UnitedKi UnitedKi UnitedKi UnitedKi USA UnitedKi USA USA USA USA Uruguay USA Vietnam Vietnam Vietnam Vietnam Vietnam Vietnam

341
VITA
Name: Olha Verkhohlyad
Address: Olha Verkhohlyad Department of EAHR 511 Harrington Tower
MS 4226 College Station, TX 77843
E-mail Address: [email protected]
Education: B.A., Education, Mykolaiv State Pedagogical University, 1994 M.A., Christian Education, Dallas Theological Seminary, 2002 Ph.D., Educational Administation, Texas A&M University, 2008 Professional Certifications: International Transfer Pricing Certificate, Texas A&M University Certificate in Advanced International Affairs, Texas A&M University