the development of a high temperature supercritical carbon
TRANSCRIPT

The Development of a High Temperature Supercritical Carbon Dioxide Corrosion Test Rig
by
Ryan Gregory Petrusenko BEng
A thesis submitted to
the Faculty of Graduate and Postdoctoral Affairs
in partial fulfillment of
the requirements for the degree of
Master of Applied Science
Ottawa-Carleton Institute for Mechanical and Aerospace Engineering
Department of Mechanical and Aerospace Engineering
Carleton University
Ottawa Ontario Canada
May 2011
copy2011 Ryan Gregory Petrusenko
11 Library and Archives Canada
Published Heritage Branch
395 Wellington Street OttawaONK1A0N4 Canada
Bibliotheque et Archives Canada
Direction du Patrimoine de Iedition
395 rue Wellington OttawaONK1A0N4 Canada
Your file Votre reference ISBN 978-0-494-83048-2 Our file Notre r6f6rence ISBN 978-0-494-83048-2
NOTICE AVIS
The author has granted a nonshyexclusive license allowing Library and Archives Canada to reproduce publish archive preserve conserve communicate to the public by telecommunication or on the Internet loan distribute and sell theses worldwide for commercial or nonshycommercial purposes in microform paper electronic andor any other formats
Lauteur a accorde une licence non exclusive permettant a la Bibliotheque et Archives Canada de reproduire publier archiver sauvegarder conserver transmettre au public par telecommunication ou par Ilnternet preter distribuer et vendre des theses partout dans le monde a des fins commerciales ou autres sur support microforme papier electronique etou autres formats
The author retains copyright ownership and moral rights in this thesis Neither the thesis nor substantial extracts from it may be printed or otherwise reproduced without the authors permission
Lauteur conserve la propriete du droit dauteur et des droits moraux qui protege cette these Ni la these ni des extraits substantiels de celle-ci ne doivent etre imprimes ou autrement reproduits sans son autorisation
In compliance with the Canadian Privacy Act some supporting forms may have been removed from this thesis
Conformement a la loi canadienne sur la protection de la vie privee quelques formulaires secondaires ont ete enleves de cette these
While these forms may be included in the document page count their removal does not represent any loss of content from the thesis
Bien que ces formulaires aient inclus dans la pagination il ny aura aucun contenu manquant
11
Canada
ii
Abstract
The supercritical carbon dioxide (S-CO2) Brayton cycle represents a highly
efficient means of power conversion however owing to its novelty material
compatibility with CO2 at the operating conditions dictated by this cycle is still relatively
unknown As part of a collaborative research effort a high temperature S-CO2 corrosion
test rig was designed and assembled for use up to 750degC at 150 MPa or 700degC at
250 MPa Functional testing was carried out at 150 MPa to determine and validate the
necessary furnace set points that would give near uniform temperature distributions of
550 600 650 700 and 721degC Temperature variation across the usable length of the
specimen boat was maintained to within a 123 to 168degC window for all nine trials
conducted Preliminary commissioning at 250 MPa also indicated that fluid
temperatures were almost 40degC lower than those measured at 150 MPa using equivalent
furnace set points
iii
Acknowledgements
First and foremost I would like to thank my advisor Dr Henry Saari for his
continuous support both morally and financially throughout the duration of this project
despite numerous setbacks and challenges his thoughtful guidance and direction was
greatly appreciated
I would also like to express my gratitude to CanmetENERGY of Natural Resources
Canada for the funding provided Also many thanks to all those from the Zero
Emissions Technology (ZET) group at the Ottawa Research Centre in Bells Corners that
were involved in some capacity throughout the project Chris Gareau and Dave Faguy
deserve my sincere appreciation for their patience diligence and assistance with the
overall assembly of the test rig As well both Dr Kourosh Zanganeh and Carlos
Salvador are worthy of acknowledgement for their help integrating this project into the
existing infrastructure of the Vertical Combustor (VC) building
Finally I wish to thank my parents family and friends for their encouragement in
addition to Kyla for her help in editing this thesis
IV
Table of Contents
Abstract ii
Acknowledgements iii
List of Tables vi
List of Figures vii
List of Appendices xii
1 Introduction 1
11 Demand for Advanced Power Conversion Cycles 1
12 S-C02 Brayton Cycle 3
13 High Temperature S-CO2 Corrosion 7
14 Objective and Organization of Thesis 9
2 Literature Review - High Temperature S-C02 Corrosion Testing 10
21 A Primer on High Temperature Materials 10
22 Modes of High Temperature Corrosion 16
221 Oxidation 17
2211 Thermodynamics 18
2212 Kinetics of Oxide Formation and Growth 21
2213 Desired High Temperature Oxide Scales 25
222 Carbonaceous Gas Reactions 28
2221 Carburization (ac lt 1) 28
2222 Metal Dusting (ac gt 1) 32
2223 Protection Against Carbon Attack 33
223 Erosion-Corrosion 34
2231 Mechanisms of Erosion 34
2232 High Temperature Corrosion Interaction 37
23 High Temperature Corrosion Testing 39
231 Erosion-Corrosion Rig Testing 40
2311 Rotating-Type Rigs 41
2312 Blast-Type Rigs 43
232 Autoclave Testing 45
2321 S-CO2 Corrosion Test Rigs 48
V
24 Methods of Corrosion Analysis 58
241 Gravimetric Analysis 58
242 Microscopic and Spectroscopic Analyses 59
25 Metallic Corrosion in High Temperature CO2 Environments 60
251 Subcritical Pressure 61
252 Supercritical Pressure 64
26 Summary 69
3 Thesis Objectives and Outline 70 4 Design of the Carleton-NRCan S-CO2 Corrosion Test Rig 71
41 Design Criteria 71
42 Pressure Vessel 72
43 Gas Booster 77
44 Furnace 77
45 Integrated Safety Features 78
451 Passive Elements 79
452 Active Elements 79
46 Specimen Boat 82
47 Conceptual Layout and Assembly 83
5 Commissioning 95 51 Initial Start-up and Modifications 95
52 Thermal Profiling at 150 MPa 101
53 Pressure Effects on Performance I l l
6 Summary and Conclusions 114 61 Future Work 115
References 118
VI
List of Tables
Table 2-1 Compositions of some common nickel-base superalloys [4043] 11
Table 2-2 The roles of selected alloying elements in nickel-base superalloys [3940] 12
Table 2-3 Test conditions used for high temperature S-CO2 corrosion studies 65
Table 4-1 Activation pressures to remedy an overpressurization 80
Table 4-2 Maximum impurity content of BOC Canada Ltd standard grade bulk
C02 85
Table 4-3 Assigned upper threshold alarm triggers 94
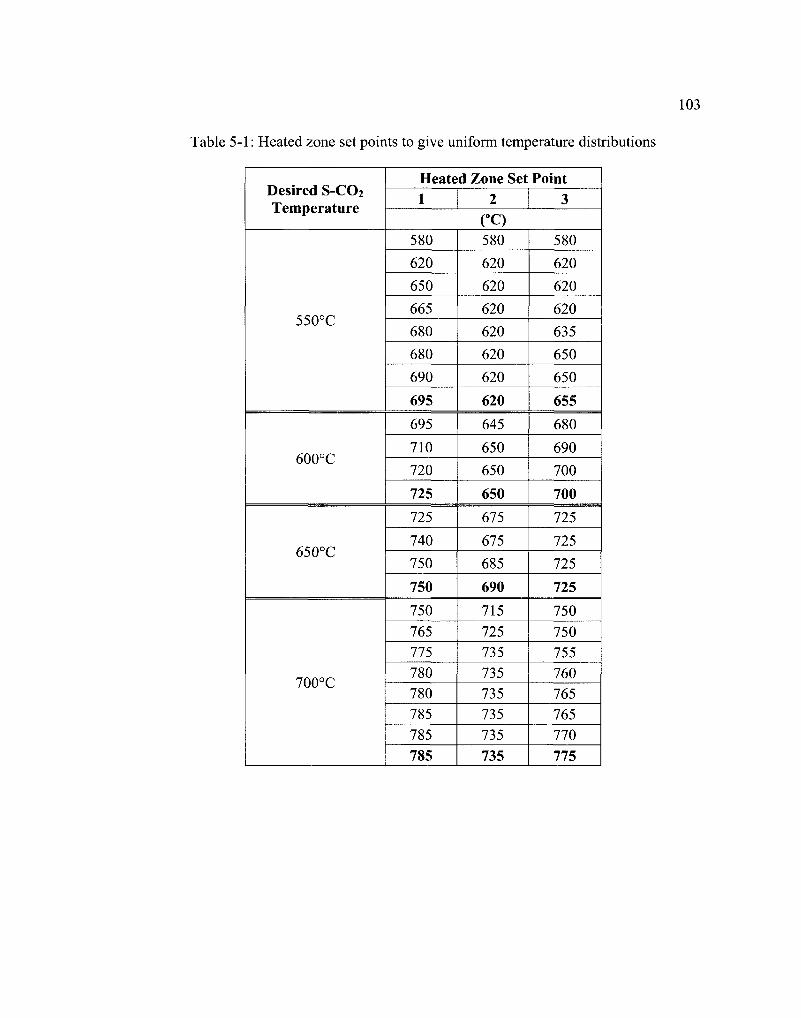
Table 5 -1 Heated zone set points to give uniform temperature distributions 103
Table 5-2 Summary of the thermal profiling trials conducted at 150 MPa 108
Vll
List of Figures
Figure 1-1 Global electricity generation by fuel type [1] 2
Figure 1-2 CO2 phase diagrams for the (a) pressure-temperature plane and (b)
density-pressure plane [16] 4
Figure 1-3 Marked differences in turbine size among the advanced power cycles [6] 5
Figure 1-4 T-s diagram for the S-CO2 recompression cycle Adapted from [6] 6
Figure 1-5 An efficiency comparison of the S-CO2 helium Brayton and supercritical Rankine cycles between 350 and 950degC Reproduced from [6] 7
Figure 2-1 The relationship between creep-rupture life and y volume fraction [40] 13
Figure 2-2 Creep-rupture strength as a function of combined Al and Ti content [39]13
Figure 2-3 Possible morphologies of grain boundary carbides (a) favourable discrete globular type [39] (b) unfavourable continuous film [44] and (c) unfavourable discontinuous cellular type [44] 14
Figure 2-4 Evolution of cast turbine blade grain structure equiaxed polycrystalline (left) columnar grain directionally solidified (centre) and single crystal directionally solidified (right) [39] 16
Figure 2-5 Ellingham diagram for the oxidation of selected metals [47] 20
Figure 2-6 Lattice defects typical of (a) n-type and (b) p-type oxides Interstitial species represent excesses and sub-lattice vacancies represent deficiencies Adapted from [47] 21
Figure 2-7 Evolution of a metallic oxide layer at high temperature (a) metal-oxidant reaction at the metal surface (b) nucleation of a thin oxide film (c) oxide film growth controlled by diffusion (d) possible emergence of oxide layer defects and separation from the metal substrate and (e) subsequent loss of protectiveness Reproduced from [46] 22
Figure 2-8 Common oxidation rate laws with the associated protective (P) temporarily protective (TP) or non-protective (NP) behaviour noted in parentheses 24
Vlll
Figure 2-9 Parabolic oxidation rate constants for metals pertinent to superalloy composition as a function of temperature Reproduced from [46] 26
Figure 2-10 Oxide scale development on a Ni-Cr-Al alloy (a) nickel-rich oxides appear first at the alloy-gas interface (b) lower oxygen activity beneath the external scale promotes discontinuous amp2O3 and AI2O3 formation (c) continuous Cr203 and (d) finally AI2O3 subscales result with the progression of time Reproduced from [47] 27
Figure 2-11 Ellingham diagram for transition metal carbides [57] 29
Figure 2-12 Stability diagram for the Cr-O-C system at 620degC Reproduced from [45] 31
Figure 2-13 Effect of carburization on room temperature mechanical properties of nickel-base superalloys [59] 31
Figure 2-14 Metal dusting mechanism of a Cr203-forming nickel-base alloy (a) carbon diffusion into the substrate initiated at Cr203 scale defect (b) formation of internal carbides (M7C3 and M23C6) and local carbon-supersaturation of substrate (c) graphite nucleation and inward growth and (d) outgrowth of coke corrosion product Reproduced from [55] 33
Figure 2-15 Erosion mechanisms for ductile and brittle materials (a) low angle surface abrasion (b) high angle low velocity surface fatigue (c) excessive plastic deformation at high angle medium velocity (d) surface melting due to high velocity impact and (e) brittle fracture Adapted from [61] 35
Figure 2-16 Effect of particle impact angle on the erosion rate of ductile and brittle
materials 37
Figure 2-17 Erosion-corrosion interaction regimes Adapted from [64] 39
Figure 2-18 Whirling arm erosion-corrosion test rig [69] 42
Figure 2-19 Centrifugal erosion-corrosion test rig [68] 42
Figure 2-20 Gas jet erosion-corrosion test rig [72] 44
Figure 2-21 Wind tunnel-type erosion-corrosion test rig [67] 45
Figure 2-22 Effect of internal pressure on the minimum required wall thickness for a pressure vessel of circular cross-section 46
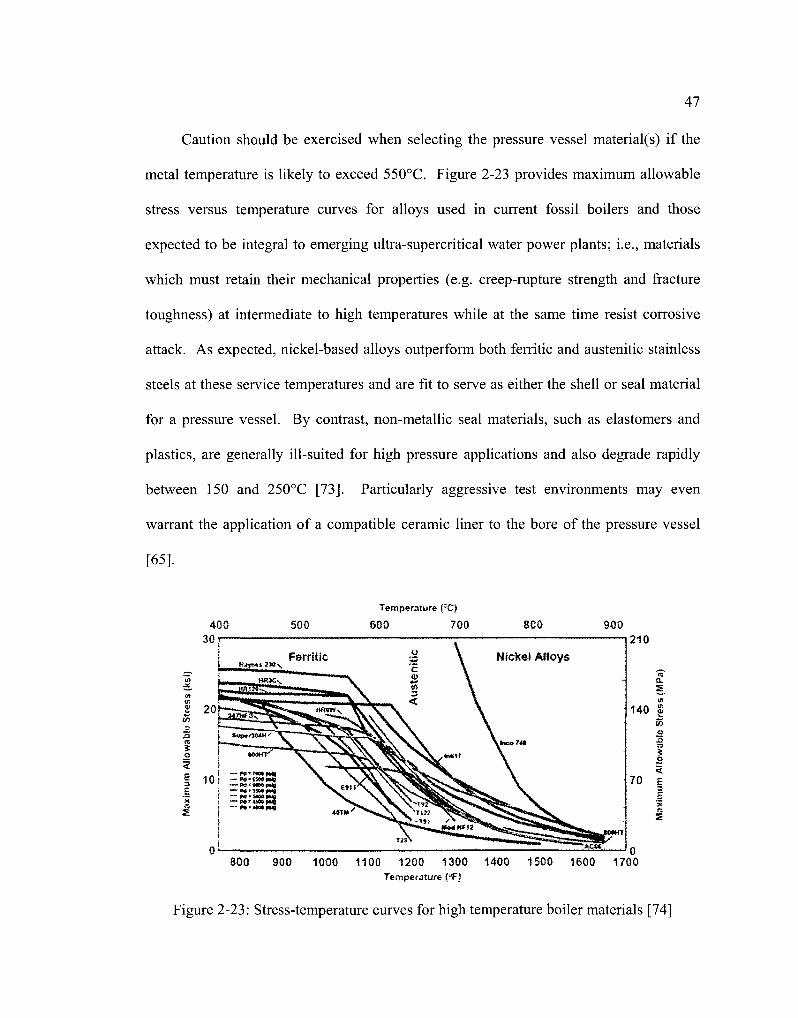
Figure 2-23 Stress-temperature curves for high temperature boiler materials [74] 47
ix
Figure 2-24 Chevron Oil Field Research Company S-CO2 corrosion test rig [23] 49
Figure 2-25 Sandia National Laboratories S-CO2 corrosion test rig [24] 50
Figure 2-26 INL single specimen S-CO2 corrosion test rig Adapted from [11] 52
Figure 2-27 INL multi-specimen S-CO2 corrosion test rig Adapted from [11] 52
Figure 2-28 Tokyo Institute of Technology S-CO2 corrosion test rig Adapted from
[33] 55
Figure 2-29 MIT low pressure S-CO2 corrosion test rig Reproduced from [38] 55
Figure 2-30 MIT high pressure S-CO2 corrosion test rig Reproduced from [38] 56
Figure 2-31 UW-Madison S-C02 corrosion test rig Adapted from [36] 57
Figure 2-32 CEA S-C02 corrosion test rig [78] 57
Figure 2-33 Surface interaction with an incident electron beam [47] 60 Figure 2-34 Multi-layered oxide (Fe304 | SiCgt2 | FeCr204) that formed on a ferritic
stainless steel following 1060 hour exposure to CO2 at 520degC and 40MPa[31] 61
Figure 2-35 Post-breakaway oxidation rate as a function of temperature [27] 62
Figure 2-36 Intergranular attack of IN-617 following 175 hour exposure to CO2 at 1000degCand70MPa[ll] 63
Figure 2-37 Characterization of 410J3-SS oxide structure following 1000 hour exposure to S-CO2 at 600degC and 200 MPa [33] 65
Figure 2-38 Cumulative mass gains of various alloys following a 3000 hour exposure to S-CO2 at 650degC and 207 MPa at UW-Madison Reproduced from [36] 67
Figure 2-39 Cumulative mass gains of nickel-base superalloys following exposure to S-CO2 at various test conditions [38] 68
Figure 4-1 Stress-temperature curves for pressure vessel material candidates Generated with ASME data provided by Moore [83] 73
Figure 4-2 Maximum allowable internal pressure-metal temperature curve for the pressure vessel as per the ASME B313-2008 Process Piping code 74
X
Figure 4-3 Graylocreg connector prior to (left) and following (right) tightening
Adapted from [87] 75
Figure 4-4 Working drawing of the IN-625 pressure vessel [84] 76
Figure 4-5 Furnace dimensions and heated zone locations 78
Figure 4-6 Overpressurization protection flowchart 80
Figure 4-7 Circuit diagram of solenoid valve relay 82
Figure 4-8 Alumina specimen boat 83
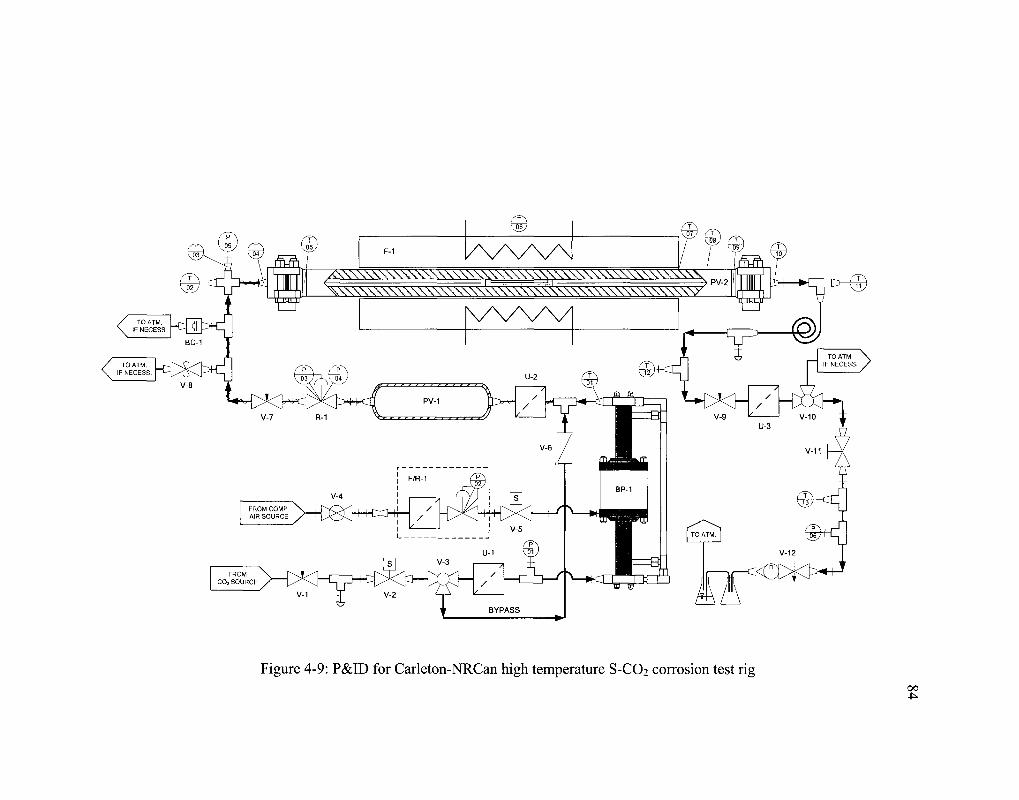
Figure 4-9 PampID for Carleton-NRCan high temperature S-CO2 corrosion test rig 84
Figure 4-10 Carleton-NRCan high temperature S-CO2 corrosion test rig 85
Figure 4-11 Inlet connections to the GBT-1530 gas booster 87
Figure 4-12 At the outlet of the GBT-1530 gas booster 89
Figure 4-13 At the inlet to the pressure vessel 90
Figure 4-14 Downstream of the pressure vessel 92
Figure 4-15 Electrical enclosure 93
Figure 4-16 Thermocouple locations along the length of the pressure vessel 93
Figure 5-1 Location of thermocouples within the pressure vessel (hatched) 96
Figure 5-2 Initial temperature distribution at 150 MPa for furnace set points of
600degC 97
Figure 5-3 Heat reflector positioning within the pressure vessel (hatched) 98
Figure 5-4 Heat reflectors attached to the profile probe sheath 98
Figure 5-5 Effectiveness of the heat reflectors on raising fluid temperature at 150 MPa for furnace set points of 600degC 100
Figure 5-6 Change in metal temperature following the addition of the heat reflectors at 150 MPa for furnace set points of 600degC 101
Figure 5-7 Temperature distributions for 550 600 650 and 700degC using the established furnace set points 104
xi
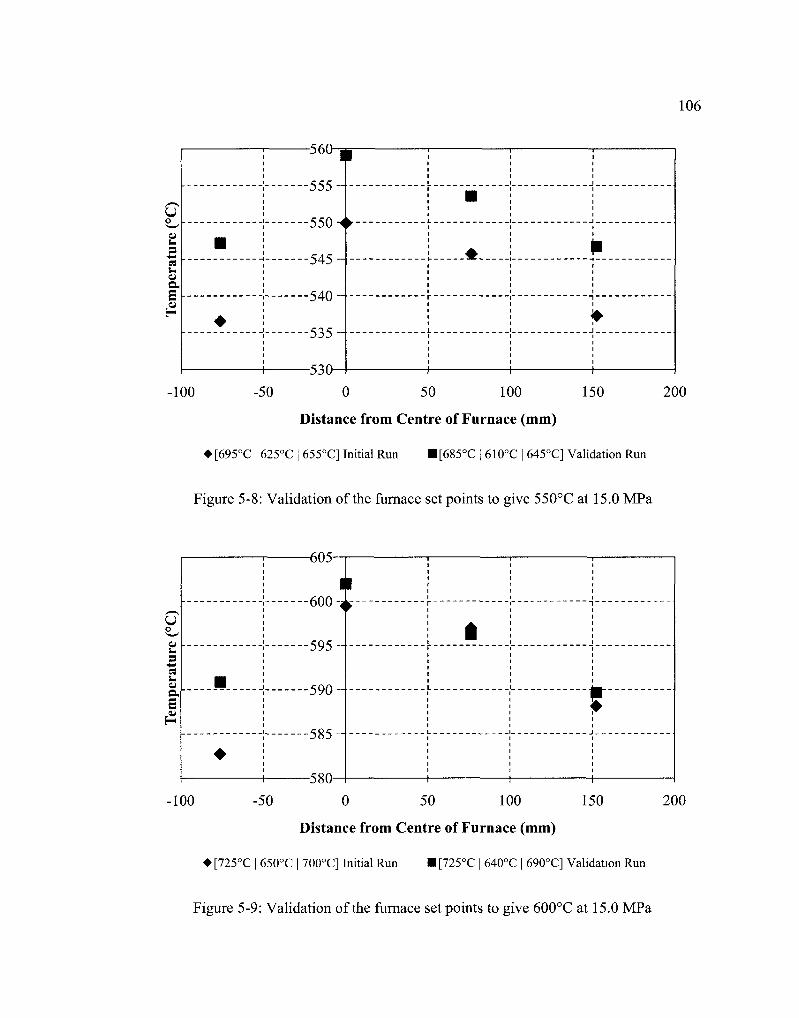
Figure 5-8 Validation of the furnace set points to give 550degC at 150 MPa 106
Figure 5-9 Validation of the furnace set points to give 600degC at 150 MPa 106
Figure 5-10 Validation of the furnace set points to give 650degC at 150 MPa 107
Figure 5-11 Validation of the furnace set points to give 700degC at 150 MPa 107
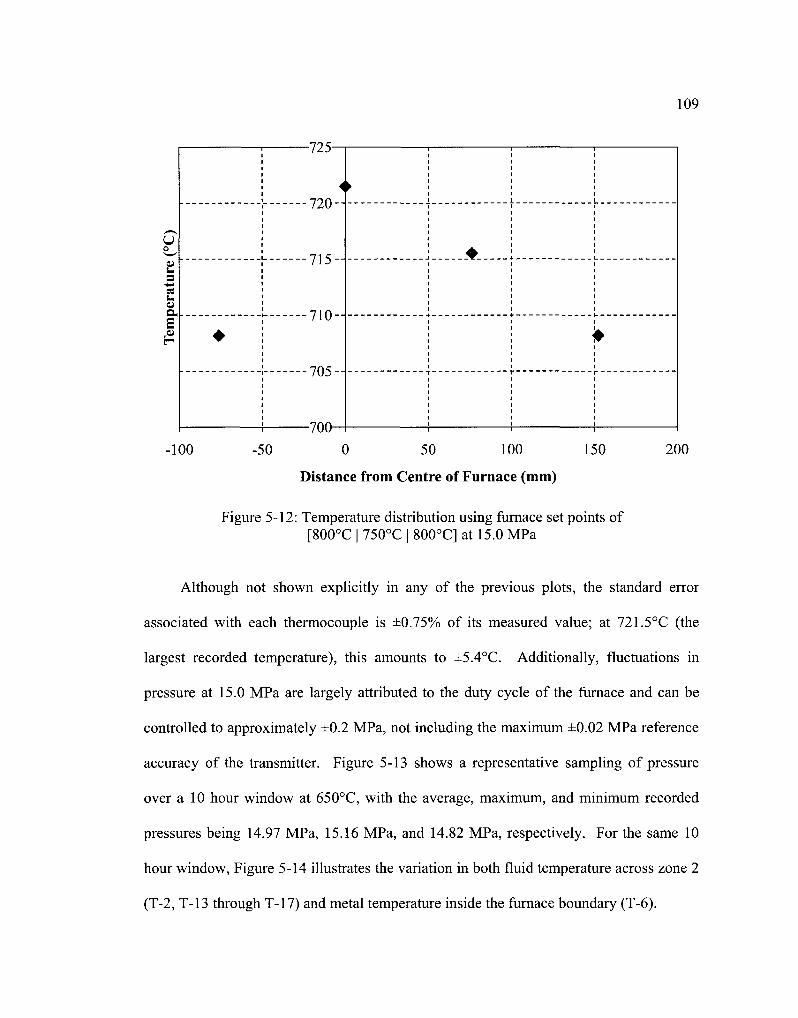
Figure 5-12 Temperature distribution using furnace set points of
[800degC | 750degC | 800degC] at 150 MPa 109
Figure 5-13 Pressure variations at 150 MPa over a 10 hour period at 650degC 110
Figure 5-14 Temperature variations at 650degC over a 10 hour period at 150 MPa 110
Figure 5-15 Differences in metal temperature at 250 MPa from 150 MPa for equivalent furnace set points 112
Figure 5-16 Temperature distributions using fixed furnace set points of [685degC | 610degC | 645degC] at 150 and 250 MPa 112
Figure 5-17 Temperature distributions using fixed furnace set points of [725degC | 640degC | 690degC] at 150 and 250 MPa 113
Figure 5-18 Thermal response of T-15 from room temperature to fixed furnace set points of [685degC | 610degC | 645degC] at 150 and 250 MPa 113
xii
List of Appendices
APPENDIX A Bill of Materials 126
APPENDIX B Representative Thermal Profiles of the Pressure Vessel 129
Introduction
1
11 Demand for Advanced Power Conversion Cycles
The International Energy Agency (IEA) estimates that the global electricity demand
will increase 76 between 2007 and 2030 This marked growth is a direct result of the
continued development and maturation of non-Organization for Economic Co-operation
and Development (OECD) economies Assuming albeit highly unlikely that no changes
are made to existing governmental energy policies Figure 1-1 shows that fossil fuels will
supplement the majority of this increase in electricity generation [1] The combustion of
fossil fuels however has an adverse effect on the environment and potentially the
climate because of the emissions that are produced At the very least efficiency gains
must be made to the design and operation of fossil fuel-based electrical power plants
either by increasing their operating conditions or utilizing improved combustion
technologies The capture and sequestration of carbon emissions would also lessen the
environmental impact of fossil fuel combustion but not remove it entirely Current
carbon dioxide (CO2) capture processes though are energy-intensive and may actually
decrease the electrical output of a power plant once implemented [2] Reducing the role
of fossil fuels in the energy production aggregate represents a more complete solution to
an environmentally-conscience energy source Nuclear energy has the potential to offset
this reduced role
With the intent of achieving the mainstream use of nuclear energy the Generation-
IV International Forum (GIF) was established to facilitate research and development
efforts of future nuclear energy systems Six reactor designs were chosen by the GIF that
2
were deemed to offer the most promise in areas such as sustainability economic
competitiveness safety and proliferation resistance and physical protection In addition
the supercritical Rankine steam cycle helium Brayton cycle and supercritical carbon
dioxide (S-CO2) Brayton cycle were selected as the electric power conversion systems to
complement the Generation-IV reactors [3-5] The inherent advantages of the S-CO2
Brayton cycle in comparison to the other cycles mentioned will be briefly discussed in
the section to follow
2007 2015
bull 2030
Hydro ^ ^ ^ ^ ^ ^ ^ ^ ^ ^ ^ _
t - Gas ^ ^ ^ ^ ^ ^ ^ ^ ^ ^ ^ ^ ^ ^ ^ ^ ^ ^ _
Coal ^ ^ ^ ^ ^ ^ ^ ^ ^ ^ ^ ^ ^ ^ ^ ^ ^ ^ ^ ^ ^ ^ ^ ^ ^ ^ ^ ^ ^ ^ ^ ^ ^ ^ ^ ^ ^ ^ - ^ 1 1 1 1
0 4 000 BOM 12 000 16 WO
TWh
Figure 1-1 Global electricity generation by fuel type [1]
The S-CO2 cycle was originally envisioned to be used as the power conversion
system in both the lead-cooled fast reactor (LFR) and sodium-cooled fast reactor (SFR)
because of their intermediate (550degC) core outlet temperature More recent developments
[46-11] have also suggested the favourable application of this cycle to other advanced
reactor concepts in particular the gas-cooled fast reactor (GFR) molten salt reactor
(MSR) and very high temperature reactor (VHTR) Outside the nuclear field the S-CO2
cycle is being actively researched as an alternative to the traditional steam and organic
Oil
Btomass
Other renewable
Nuclear
3
Rankine cycles used in concentrated solar [1213] and nuclear ship propulsion [6]
systems In fossil fuel-based cogeneration installations the S-CO2 cycle is also being
considered as a possible bottoming cycle option for waste heat recovery [14]
12 S-CO2 Brayton Cycle
The S-CO2 cycle is intended to operate as a closed system and exclusively above
the critical point of C02 ie above 3103degC (30418 K) and 738 MPa (738 bar) [15]
Carbon dioxide phase diagrams are shown in Figure 1-2 for both the pressure-
temperature and density-pressure planes Above the critical point liquid and gaseous
phases become indistinguishable - represented in Figure l-2a by dashed phase
boundaries - and CO2 exists as a homogenous supercritical fluid phase At temperatures
and pressures far exceeding those that define the critical point S-CO2 fluid behaviour
approximates that of an ideal gas Only near the critical point do fluid properties such as
density viscosity and specific heat capacity exhibit large gradients with small changes
in temperature [616] Figure l-2b illustrates how significant this temperature sensitivity
is on the density and hence the compressibility of S-CO2
Exploiting the low compressibility of CO2 in the vicinity of its critical point is
what gives the S-CO2 cycle a distinct advantage over the ideal gas helium Brayton cycle
the extremely low critical point of helium (-26795degC) [17] makes it impracticable to
benefit from these same real gas properties Consequently the S-CO2 cycle uses only
30 of its total turbine work for compression as opposed to the 45 needed by the
helium cycle This reduced compressor work eliminates the need for intercooling
4
decreasing the overall plant footprint complexity and cost [6818-22] Figure 1-3
depicts the extremely compact turbomachinery of the S-CO2 cycle in relation to the
helium Brayton and supercritical Rankine steam cycles
10000
1000
3 w
Q
(a) 200 250 300 350
temperature (K)
400
1000
30 50 70 90 110 130 150 170
(b) pressure (bar
Figure 1-2 CO2 phase diagrams for the (a) pressure-temperature plane and (b) density-pressure plane [16]
bull Steam Turbine 55 stages 250 M W
Mitsubishi Heavy Industries Ltd Japan (with casing)
Helium Turbine 17 stages 333 M W (167 MW e ) XL Yan LM Lidsky (MIT) (without casing)
S-C0 2 Turb ine 4 stages 450 M W (300 MW e ) (without casing and with compressors of comparable size)
Figure 1-3 Marked differences in turbine size among the advanced power cycles [6]
The proposed turbine inlet conditions for the S-C02 and helium Brayton cycles
differ considerably as well Using a thermal efficiency of 45 as a benchmark between
cycles the S-CO2 recompression cycle (the most efficient of all the layouts investigated)
needs only 550degC and 200 MPa to attain this level compared to the 750degC (closer to
800degC if all losses are considered) and 80 MPa required by the helium Brayton cycle [6]
Figure 1-4 provides a temperature-entropy (T-s) diagram for the S-CO2 recompression
cycle illustrating how heat rejection is minimized (or efficiency is improved) with the
addition of another compressor before the pre-cooler The higher operating temperature
of the helium cycle imposes a significant demand on both component cooling and
material requirements [6-81819] In terms of material strength and creep resistance the
higher operating pressure of the S-CO2 recompression cycle is less problematic at the
5 m
6
lower turbine inlet temperature (TIT) Furthermore a higher operating pressure reduces
the detrimental effects that fractional pressure drops have on cycle efficiency Thermal
efficiencies for the supercritical Rankine cycle and both Brayton cycles are plotted in
Figure 1-5 for TITs between 350 and 950degC inclusively For TITs above 550degC the
S-CO2 recompression cycle is the most advantageous of the three cycles considered this
is promising for even greater efficiency gains once confidence is acquired at lower the
initial operating temperature Although the Rankine cycle appears to have superiority
over the S-CO2 recompression cycle at lower temperatures the added plant complexity
and auxiliaries required to do so lead to a higher capital investment [6-819]
6 0 0 i bull bull j bull bull bull 1
13 15 17 19 21 23 25 27
Entropy (kJkgK)
Figure 1-4 T-s diagram for the S-CO2 recompression cycle Adapted from [6]
7
10 bull - Supercritical C02 Brayton cycle
bullmdashHelium Brayton cycle
4mdash Supercritical Rankine steam cycle
350 450 550 650 750 Turbine Inlet Temperature (degC)
850 950
Figure 1-5 An efficiency comparison of the S-CO2 helium Brayton and supercritical Rankine cycles between 350 and 950degC Reproduced from [6]
13 High Temperature S-CO2 Corrosion
While the S-CO2 Brayton cycle offers merit in achieving high thermal efficiencies
the novelty of this cycle poses a unique challenge relating to material selection - the
compatibility of materials with CO2 at the temperature and pressure combination dictated
by the S-CO2 recompression cycle is relatively unknown For the most part CO2
corrosion studies originating from the oil and gas industry involve carbon steels and gas
compositions (high sulphur and water content) [23] that are likely never to be used or
encountered within a S-CO2 cycle Moreover the small fraction of corrosion tests
conducted at supercritical conditions with relatively pure CO2 and prior to the
8
realization of the S-CO2 cycle were done so at rather low temperatures (54 to 238degC)
[2425] Experience with the British Magnox and advanced gas reactor (AGR) program
can provide more relevant insight into material interaction with high temperature CO2 but
only at subcritical pressures - the maximum being about 53 MPa Apart from some
reactor-specific alloys [26] corrosion data obtained as a result of this nuclear program
was primarily for mild and stainless steels [27-32]
The ability to conduct accelerated laboratory corrosion testing in a high
temperature S-CO2 environment is warranted yet still only possible at a small number of
institutions worldwide Preliminary results published by these institutions correlate well
with what was observed in the AGR program despite the differences in pressure
Regarding corrosion resistance austenitic stainless steels still outperform their ferritic
counterparts mainly because of greater chromium (Cr) content [33-37] Repeated testing
at supercritical conditions is required to determine what effect if any pressure has on the
formation and protectiveness of oxide layers Although these S-CO2 studies focused
predominantly on the corrosion behaviour of steels the nickel-base superalloys that were
tested also demonstrated excellent corrosion resistance [343638] Corrosion data
relating to this family of superalloys however needs to be expanded as they represent the
logical material choice for the S-CO2 turbomachinery and heat exchangers Additionally
the duration of future S-CO2 corrosion tests will also need to increase to properly
characterize the corrosion mechanisms involved and assess the long-term stability of
oxide layers
9
14 Objective and Organization of Thesis
In a collaborative effort between Carleton University and CanmetENERGY of
Natural Resources Canada (NRCan) the development and optimization of a 100 MWe
S-CO2 advanced Brayton cycle has been initiated As part of the overall scope of this
project a long-term S-CO2 corrosion study is required to evaluate the corrosion
behaviour of selected structural materials The main objective of this thesis is therefore
to design construct and commission a S-CO2 corrosion test loop that will be used to
conduct this study
In the subsequent chapter an introduction to high temperature corrosion
mechanisms and testing methods is presented at the outset to accompany a review of past
and current high temperature CO2 corrosion studies The specific objectives of this thesis
are outlined in Chapter 3 Chapter 4 describes the design and assembly of the S-CO2
corrosion test loop while its commissioning is detailed in Chapter 5 Finally Chapter 6
summarizes the work carried out for this project draws upon the major conclusions and
lays out recommendations for future work
10
2 Literature Review - High Temperature S-C02 Corrosion Testing
This chapter provides a detailed review of high temperature metal corrosion in a
S-CO2 environment An overview of high temperature materials exclusively the nickel-
base class of superalloys is first presented Following this the thermodynamic and
kinetic principles of high temperature corrosion are explained While several modes of
high temperature corrosion are recognized only those that seem apt for a carbon-rich
atmosphere and closed-cycle gas turbine application will be discussed High temperature
corrosion tests are then described in addition to the methods used to both quantify and
evaluate the extent of corrosion Finally a survey detailing metallic interaction with a
CCgt2-rich environment concludes this chapter This survey begins with high temperature
corrosion investigations conducted at subcritical CO2 pressures and ends with the most
recent corrosion studies related to the S-CO2 Brayton cycle
21 A Primer on High Temperature Materials
High temperature materials more commonly referred to as superalloys consist of
nickel- nickel-iron- and cobalt-base alloy systems At service temperatures above
540degC superalloys possess high creep-rupture strength and exhibit a considerable
resistance to thermo-mechanical fatigue oxidation and corrosion [39-42] This primer
however will focus only on the metallurgical aspects (namely the composition
microstructures processing methods and surface protection) of nickel-base superalloys
due to their prevalence in current gas turbine applications The reader is directed to work
by Donachie [39] for a more comprehensive discussion of all the superalloy classes
11
Nominal compositions of some representative nickel-base superalloys are given in
Table 2-1 The controlled alloying elements - possibly as many as fourteen - that
comprise the listed superalloys have a major influence on the phase structures that form
as well as the mechanical properties and environmental protection that they impart
Thus each element can be classified as having one or more of the following roles within
the nickel-base superalloy matrix strengthener intermetallic precipitate former carbide
former grain boundary strengthener or surface stabilizer [3940] Table 2-2 summarizes
the specific roles of the various alloying elements
Table 2-1 Compositions of some common nickel-base superalloys [4043]
Alloy
Waspaloy Udimet 720
Mar-M246 IN-713LC
IN-792
PWA 1480 CMSX-2
PWA 1484 CMSX-4
CMSX-10
TMS-162
Cr
195 179
83 120
124
100 80
50 65
20
29
Co
135 147
100 -
92
Nominal Composition (wt
Mo W Ta Re Ru
Wrought Superalloys
43 -
30 13 - - -
Conventionally Cast Alloys
07 100 30 45 - -
Directionally Solidified Alloy
19 39 42
bal Ni)
Nb
-
-
-
20
-
First-Generation Single-Crystal Alloys
50 50
40 120 06 80 60
-
-
Second-Generation Single-Crystal Alloys
100 96
20 60 90 30 -06 64 65 30 -
-
-
Third-Generation Single-Crystal Alloy
30 04 50 80 60 - -
Fourth-Generation Single-Crystal Alloy
58 39 58 56 49 60
Al
13 25
55 59
35
50 56
56 56
57
58
Ti
30 50
10 06
39
15 10
-
10
02
-
Hf
-
~
150 -
-
-
-
010 010
003
009
c
008 004
014 016
007
-
-
-
-
-
-
12
Table 2-2 The roles of selected alloying elements in nickel-base superalloys [3940]
Alloying Element Purpose
Cr Co Mo W Fe Re Ta Nb Al Ti Hf C B Zr
Matrix Strengthener X X X X X X
Intermetallic v
Precipitate Former
Carbide Former X X X X
Grain Boundary Strengthener
Surface Stabilizer X
Nickel-base superalloys consist of a face-centred cubic (FCC) gamma (austenitic)
matrix together with several secondary phases The coherent intermetallic gamma prime
(y) phase and the carbides are for the scope of this review considered to be the most
relevant secondary phases The y-phase constitutes the ordered Ni3(AlTi) compounds
that nucleate within the austenitic matrix from an initial solution heat treatment and
evolve with subsequent aging heat treatment(s) The presence of the y-phase distorts the
austenitic matrix so as to impede the movement of dislocations and hence conferring
strength to the superalloy the volume fraction particle size and morphology of the
y-phase all dictate to what extent this strengthening mechanism occurs [394042] All
three factors are controlled by the aluminium and titanium contents of the superalloy and
the heat treatments it has been subjected to [39] Figure 2-1 illustrates the creep-rupture
behaviour of a nickel-base superalloy as a function of its y volume fraction Beyond an
optimum volume fraction of approximately 70 further increases in y volume fraction
X X X
X X X
X X X X
X
13
actually reduce creep-rupture life [40] Similarly Figure 2-2 shows an increase in creep-
rupture strength with greater aluminium and titanium contents
10 000 E 1 1 1 1 1 1 r
1000 r
100 r
ogt 0) 3 10 r
0
o bullj p
01
001
A - - -a J I L
- bull - T M S - 7 5 9 0 0 C -laquo -TMS-75 1100 o C -lt^--TMS-82+900degC -iSr-TMS-824-1100C I
0 20 40 60 80 100
Designed amount of y volume fraction ()
Figure 2-1 The relationship between creep-rupture life and y volume fraction [40]
tn
OU
50
40
m
20
10
0
bull
^ gt
bull V
_ v
i i i j
bull
bull
-
bull Wrought bull Cast
_ i 1 J Utrade
- 345
amp 276
- 207 c o o
138
- 67
0 1 2 3 4 5 6 7 8 9 10
Al + Ti content w i
Figure 2-2 Creep-rupture strength as a function of combined Al and Ti content [39]
14
(a) (b) (c)
Figure 2-3 Possible morphologies of grain boundary carbides (a) favourable discrete globular type [39] (b) unfavourable continuous film [44] and
(c) unfavourable discontinuous cellular type [44]
Carbide species that readily form in these superalloys either at grain boundaries or
within the grains include MC M23C6 MeC and M7C3 where M denotes a refractory
metal atom The carbon content of the superalloy as well as the temperature and duration
of its thermal exposure (be it via heat treatment or through service) affect what carbide
type will form Grain boundary carbides specifically their morphology have a
significant effect on creep-rupture behaviour Discrete globular M23C6 carbides prevent
premature failure by inhibiting grain boundary sliding and allowing adjacent grains to
retain enough ductility to accommodate this redistribution of stress Carbides that
precipitate as continuous films or discontinuous cellular formations however are
detrimental to creep-rupture life [394143] These distinct grain boundary carbide
morphologies are shown above in Figure 2-3 Other functions that carbides have in
nickel-base superalloys are to provide secondary strengthening to the austenitic matrix
and bind to impurity elements that would otherwise degrade mechanical properties [39]
15
Nickel-base superalloys are processed in both wrought and cast forms notable
differences in the size morphology and orientation of the grains exist between the two
processing methods [41] Wrought superalloys typically possess excellent tensile
strength and low-cycle-fatigue (LCF) resistance on account of their finer-sized grains
Conversely the coarser grain sizes of cast superalloys enhance high temperature creep-
rupture properties [39404243] Further benefits to creep-rupture properties are possible
if directionally solidified (DS) casting techniques are employed At elevated
temperature metal fracture occurs intergranularly - often initiated at grain boundaries
oriented perpendicular to the direction of applied loading [39] With control over grain
orientation through DS casting transverse grain boundaries can be removed from the
superalloy to extend creep-rupture life Depicted in Figure 2-4 the logical progression of
turbine blade microstructures - from polycrystalline (PC) to columnar grain directionally
solidified (CGDS) and finally single crystal directionally solidified (SCDS) - reiterates
the improved high temperature performance that was realized first with the elimination of
transverse grain boundaries and then grain boundaries altogether
To protect against material degradation nickel-base superalloys are intentionally
alloyed with elements that form thermodynamically-stable oxides - primarily chromia
(Cr203) and alumina (AI2O3) [41] These oxides develop into continuous adherent
surface films which act to isolate the superalloy from its surrounding environment
Compared to an applied diffusion overlay or thermal barrier coating system the C^Ch
and AI2O3 oxide layers are also regenerative in nature that is even with spallation these
oxide layers are ultimately restored by consuming additional alloying species from the
16
austenitic matrix This regenerative ability however can be damaging to mechanical
properties as both chromium and aluminium contribute to strengthening mechanisms of
the nickel-base superalloy Overlay and thermal barrier coatings do offer the added
benefits of being specially tailored to suit a particular service environment and
significantly reducing metal temperatures respectively [3940] The premise behind
oxidation is explained in greater detail in the succeeding section
Figure 2-4 Evolution of cast turbine blade grain structure equiaxed polycrystalline (left) columnar grain directionally solidified (centre)
and single crystal directionally solidified (right) [39]
22 Modes of High Temperature Corrosion
High temperature (above 500degC) corrosion can be regarded as the non-galvanic
electrochemical reaction between a metal and non-metal whose interfacial anode and
cathode are separated by a layer or film of reaction product [4546] While oxidation is
the most prevalent mode of high temperature corrosion other modes - such as
nitridation carburization and metal dusting halogenation sulfidation erosion-corrosion
17
and molten salt deposition - are also possible depending on the atmospheric composition
that the metal is exposed to For the context of this review however only the principles
of oxidation carburization and metal dusting and erosion-corrosion will be considered
Exclusion of the remaining high temperature corrosion modes follows from the logic that
although contaminant species will inevitably exist within the S-CO2 fluid their trace
levels are unlikely to be the controlling corrosion mechanism(s) This section
summarizes the detailed high temperature corrosion reviews conducted by Lai [45]
Shreir [46] Birks Meier and Pettit [47] and Kofstad [48]
221 Oxidation
Oxidation is potentially the most beneficial form of high temperature corrosion
because if properly exploited the ensuing oxide layer or scale serves as an effective
barrier to subsequent metal attack However if this same oxide layer proves to be
thermodynamically unstable or prone to cracking porosity and spallation the protection
it provides may be compromised or absent altogether [4647] Perhaps of even greater
interest is that environments that are otherwise devoid of molecular oxygen (O2) and
therefore have extremely low oxygen activities such as one composed primarily of CO2
can still support oxidation This section provides an understanding behind the basic
thermodynamics responsible for whether an oxide layer will form and if so the kinetics
that determine at what rate it will evolve To complement these oxidation fundamentals
the selective oxidation of high temperature materials specifically Cr2Cgt3- and AI2O3-
forming nickel-base superalloys will conclude this discussion
18
2211 Thermodynamics
The synthesis of a metallic oxide (MxOy) from a metal (M) and a single gaseous
oxidant O2 for simplicity can be represented by a reaction of the general form
2x 2 mdash M(s) + 0 2 (g) laquo -MOy (s) (21) [46]
Whether or not this reaction indeed tends to be product-favouring that is proceeds
from left to right is indicated by its change in Gibbs free energy (AG) By definition AG
characterizes the algebraic sum of the first and second laws of thermodynamics for an
isothermal (constant temperature) and isobaric (constant pressure) process Thus the
Gibbs free energy change of Equation 21 at absolute temperature T is expressed as
a2y AG = AGdeg + RUT bull In tradefy (22) [46]
aM - a o 2 J
where AGdeg is the standard-state Gibbs free energy of formation Ru is the universal gas
constant and a is the chemical activity of the indicated species
Commonly the metal and oxide activities are taken as unity under the assumption
that both are pure solids and therefore due to their small molar volumes are insensitive
to pressure Furthermore if the oxidant behaves as an ideal gas its activity can be
assumed equivalent to its partial pressure P0Xidant in the given atmosphere but normalized
to standard pressure [454648] However for significant deviations from ideal gas
behaviour such as in the supercritical regime fugacity must be used in lieu of partial
pressure to accurately quantify gas concentrations Incorporating these simplifications at
equilibrium (AG = 0) Equation 22 can be rearranged to give the dissociation pressure of
19
the oxide Po^S o r the ambient oxygen partial pressure above which oxidation of the
metal is possible
Over a desired temperature range a convenient means to assess the relative
thermodynamic stabilities of various oxides and similarly the products of other
metalnon-metal reactions is with the use of an Ellingham diagram [45-48] An
Ellingham diagram in its simplest form plots AGdeg per mole of oxidant consumed as a
function of temperature Apart from the noble metals and away from extreme
temperature metals are naturally disposed to oxide formation [46] and Equation 21
consequently proceeds from left to right Increasingly negative values of AGdeg -
tantamount to moving from the top to bottom of the diagram - are indicative of the
difficulty in which an oxide can be reduced [45-48] ie its thermodynamic stability
Regarding alloys the Ellingham diagram provides initial insight into which constituent
elements oxidation will predominate and thus which phase diagram to use to describe
the variation in oxide structure [47] Figure 2-5 shows both Cr2Cgt3 and AI2O3 curves to
fall below that of nickel(II) oxide (NiO) explaining why in nickel-base superalloys a NiO
oxide layer is not favoured at least not for the long term Also noteworthy of Figure 2-5
are the partial pressure nomograms or ancillary scales surrounding the Ellingham
diagram These nomograms give the dissociation pressure of the oxide either directly by
P0 2 or indirectly via the equilibrium ratio of carbon monoxide (CO) to CO2 for the
following reaction
20
C 0 2 ( g ) ~ C O ( g ) + - 0 2 ( g ) (24)
What can be concluded from either nomogram is that the formation of Cr2Cgt3 and AI2O3
are very difficult to prevent [46] - at 550degC Cr203 and the more thermodynamically
stable AI2O3 need PQ2 of only 1038 atm and 1060atm respectively to form
PcoPco2 10- io^ s io- 0 io-9 io-8 io-7 10-8 10-5 10-4
o o E
laquolaquogt
c
II
lt3 -3
I J
o
OK
u
- 1 0 0
- 2 0 0
-300
-400
-500
-600
-700
-800
-900
1000
1100
1200 c
laquo bull
^
9 S J
^
O j
fTTsM2deg
4ampU+
-|3flts
of ^r^^
^
5^
H
j j S amp S ^ ^
=hltdeg
degA 2^
^
^^
i 2 r
yf
on
M
M
c
i deg -
oj
M
temperature degC
200 400
Pa DP( o2
3^2
M |MJ
y gt ^ i
M
lt ^ fit
J S gt
tf8deg2
^e 0
r2gtf w
B(
cU
M
[hj
bdquodegraquo-
lt 7 o r f ^ M
M mdash c o = cos
M
3
B
1M
wi Melting point or metal
m Melting point ot oxide
600 800 1000 1200 1400 1600 mo-m o-K w^ i o - 4 2 i o - M
1 0 - 1 mdash
t o - 2 -
1 0 - 3 mdash
10 - 4 -mdash
l O 6 - ^
1 0 - ^
1 0 1 ^
io - i ^
10 1 ^
10-
10
1 0
1024
io-2 b
N io-2deg
1 0 M
S I O -
1 0 4
1Q-1
1 0
10
10
10
101
Figure 2-5 Ellingham diagram for the oxidation of selected metals [47]
21
2212 Kinetics of Oxide Formation and Growth
The mechanisms and rates of oxide evolution are as equally important as the
underlying thermodynamics in terms of the level of protection that an oxide layer will
impart to its substrate At elevated temperature metallic oxides can typically be
classified as non-stoichiometric ionic compounds meaning that their metal-to-oxygen
atom ratio differs slightly from what their chemical formula would imply Point defects -
vacancies on cationic (Mn+) and anionic (O2) sub-lattices and ions occupying interstitial
positions - allow for such deviations from stoichiometric composition and in conjunction
with electronic defects preserve the overall electrical neutrality of the oxide [4647]
Free electrons and electron holes (higher valency cations) constitute these electronic
defects and give the metallic oxide either a negative-type (n-type) for the former or a
positive-type (p-type) for the latter semiconductive behaviour [49] Figure 2-6
distinguishes between the two semiconductor types showing either a metal excess or
oxygen deficit for an n-type oxide (Figure 2-6a) and a metal deficit or oxygen excess for
a p-type oxide (Figure 2-6b)
M2+ O2
e O2 M2+
M2+
M2+ O2
e O2- M2+
e M2+ O2
M2+
O2
M2+
O2
M2+
O2 M2+
M2+
M2+ O2
bull M 2 +
M2+ O2
M+
O2 M2+
M2+ O2
O2 M3+
M2+ O2
o2-O2- M2+
M3+ O2
M2+
O2
M2+
O2
M2+
O2 M3+
bull o2
O2 M2+
M3+ O2
M+
O2 M2+
(a) (b)
Figure 2-6 Lattice defects typical of (a) n-type and (b) p-type oxides Interstitial species represent excesses and sub-lattice vacancies represent deficiencies
Adapted from [47]
22
Together the crystalline and electronic defects previously described are for the
most part responsible for oxide growth via diffusion a phase boundary process such as
the dissociation and adsorption of a molecular oxidant establishes the other principal
growth mechanism [48] Depending on the mechanism and ambient temperature
oxidation kinetics may conform to one or some combination of the linear parabolic and
logarithmic rate laws and can be easily measured by a change in mass per unit area f mdashJ
[45-48] A simplified representation of high temperature oxidation in which the rate
controlling step transitions first from a phase boundary process to ionic and electronic
diffusion through the growing oxide layer is illustrated below in Figure 2-7
o2(g) O 0 O 0 0
o2(g)
Metal
i- r-r
Metal
0 oT
Metal To m e
o T o Metal
MOx(g) 02(g)
f yfi^f ol To
Metal
(a) (b) (c) (d) (e)
Figure 2-7 Evolution of a metallic oxide layer at high temperature (a) metal-oxidant reaction at the metal surface (b) nucleation of a thin oxide film (c) oxide film growth controlled by diffusion (d) possible emergence of oxide layer defects and separation
from the metal substrate and (e) subsequent loss of protectiveness Reproduced from [46]
Initially (Figure 2-7a) O2 molecules collide with and are adsorbed on the metal
surface Islands of oxide then rapidly develop (Figure 2-7b) in accordance with Equation
21 and spread laterally over the metal until a continuous thin layer forms Chemical and
electrical potential gradients are established across this layer and in conjunction with the
intrinsic crystalline defects of the oxide promote the diffusion of ions and electrons
23
through it (Figure 2-7c) As a result the thickness of this oxide layer increases with its
direction of growth - either inward from the metal-oxide interface or outward from the
oxide-gas interface - contingent on whether anion or cation migration is favoured
[4648] A complete understanding behind oxide transport properties is beyond the scope
of this review but can be found in either Shreir [46] Birks et al [47] or Toft Sorensen
[49] Micro voids and cracks may begin to appear within the oxide layer (Figure 2-7d) as
a means to alleviate or redistribute stresses induced during growth or from thermal
exposure If these cracks propagate completely through its thickness (breakaway
oxidation) or the oxide is easily vaporized virgin metal is once again exposed leading to
further metal attack (Figure 2-7e) [4648]
The preceding oxidation process exemplifies linear (during initial formation and
potentially again if the oxide layer fails) and parabolic (when solid-state diffusion
predominates) rate behaviour with both rate equations and their combination along with
the logarithmic rate equation plotted in Figure 2-8 Of these three elementary rate
equations only the linear reaction rate remains constant with time and thus independent
of oxide thickness [45] Oxide growth or loss (eg volatilization) consistent with linear
behaviour is likely related to a phase boundary process [46] and may be represented by
where kz and t denote the linear rate constant and time respectively
Protective barriers form when oxidation kinetics follow either a parabolic
^)-kpt + C (26)
24
or logarithmic time dependence
(^-) = klog-log(t + t0)+A (27)
where kp kiog C t0 and A all represent constants In each case reaction rates tend to
decrease and stabilize with the progression of time The logarithmic rate equation
however is usually only applicable to the low temperature (lt 400degC) oxidation of metals
and is often difficult to substantiate with a single growth mechanism [47]
ro O
E
Time
Figure 2-8 Common oxidation rate laws with the associated protective (P) temporarily protective (TP) or non-protective (NP) behaviour noted in parentheses
Using the applicable molar volume molar mass and composition of the oxide
together with the measured change in specimen mass the ordinate of Figure 2-8 can be
just as easily transformed into either the oxide thickness or the depth of metal
penetration In fact the volumetric ratio of oxide produced to metal consumed - termed
the Pilling-Bedworth ratio (PBR) - serves as a preliminary assessor of the protectiveness
of a given oxide layer A PBR less than unity is generally indicative of a porous oxide
layer or one that fails to fully cover the metal surface Conversely a compact and
Parabolic (P)
Logarithmic (P)
25
protective oxide layer is assumed to form when the PBR exceeds unity although an
accumulation of compressive growth stresses could lead to unwanted cracking and
spallation [46-48] Other factors however such as the oxide-substrate adherence must
ultimately be considered when quantifying the protection of an oxide layer
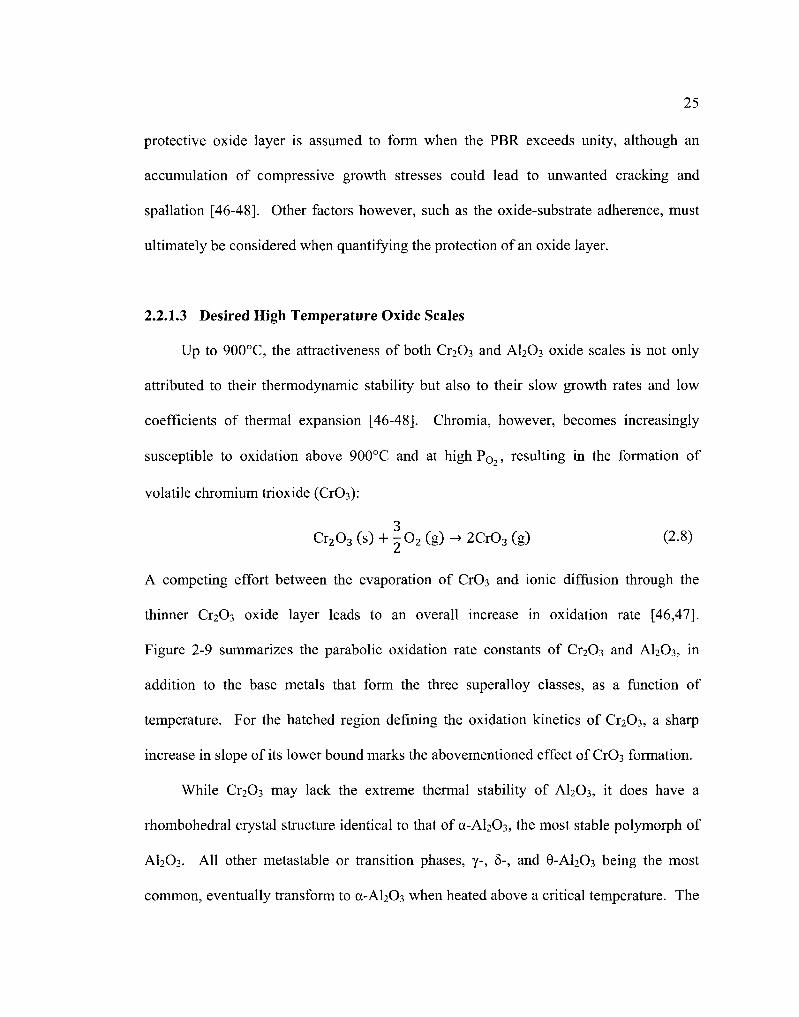
2213 Desired High Temperature Oxide Scales
Up to 900degC the attractiveness of both Cr203 and AI2O3 oxide scales is not only
attributed to their thermodynamic stability but also to their slow growth rates and low
coefficients of thermal expansion [46-48] Chromia however becomes increasingly
susceptible to oxidation above 900degC and at high P 0 2 resulting in the formation of
volatile chromium trioxide (CrOs)
Cr 2 0 3 (s) + ^02 (g) -raquo 2Cr03 (g) (28)
A competing effort between the evaporation of Cr03 and ionic diffusion through the
thinner Cr203 oxide layer leads to an overall increase in oxidation rate [4647]
Figure 2-9 summarizes the parabolic oxidation rate constants of amp2O3 and AI2O3 in
addition to the base metals that form the three superalloy classes as a function of
temperature For the hatched region defining the oxidation kinetics of amp2O3 a sharp
increase in slope of its lower bound marks the abovementioned effect of Cr03 formation
While amp2O3 may lack the extreme thermal stability of AI2O3 it does have a
rhombohedral crystal structure identical to that of (X-AI2O3 the most stable polymorph of
AI2O3 All other metastable or transition phases y- 5- and 0-AI2O3 being the most
common eventually transform to (X-AI2O3 when heated above a critical temperature The
26
magnitude of this temperature and also the rate of phase transformation are largely
influenced by the base metal of an alloy alloying additions such as the rare earths (RE)
Cr and Ti and the presence of an isotypic phase [50] In a binary alloy system
consisting of a nickel base and either chromium or aluminium as the solute element
considerable solute content - at least 18 wt Cr or 17 wt Al - is required to preclude
internal oxidation and the formation of complex less protective spinel Ni(CrAl)204
oxides When both elements are combined to form an alloy of Ni-Cr-Al composition
protective AI2O3 oxide scales can be achieved with Al contents as low as 5 wt due in
part to the gettering effect of chromium [4647] Figure 2-10 characterizes the transient
to steady-state oxidation of a Ni-Cr-Al alloy with time
10 5
T(degC) 1200 1100 1000 900 800 700 600
9 10
104T(K1)
Figure 2-9 Parabolic oxidation rate constants for metals pertinent to superalloy composition as a function of temperature Reproduced from [46]
(a)
(b)
(c)
S NiO S NiO S
Alloy
S | N I O | S gt J I O | S
Alloy
NiO
O0O0O0O0O0O0O
A l l Al ldegy TCr
0 2
(d)
bull Cr20
NiO
Alloy | Al
2 ^ 3 o AI2O3 Ni(CrAI)204
27
Figure 2-10 Oxide scale development on a Ni-Cr-Al alloy (a) nickel-rich oxides appear first at the alloy-gas interface (b) lower oxygen activity beneath the external scale
promotes discontinuous Cr203 and AI2O3 formation (c) continuous Cr203 and (d) finally AI2O3 subscales result with the progression of time Reproduced from [47]
The abundance of nickel in the alloy initially encourages the formation of oxides
that are predominantly nickel-based - NiO and Ni(CrAl)204 - at the alloy-gas interface
(Figure 2-10a) Internal isolated pockets of Q2O3 and AI2O3 develop below this nickel-
based external scale (Figure 2-10b) on account of their thermodynamic stability at lower
oxygen activities With sufficient Cr content a continuous Q2O3 subscale ensues
(Figure 2-10c) further decreasing oxygen activity within the alloy and blocking previous
diffusion paths to the surface Given enough time AI2O3 becomes continuous underneath
this duplex scale (Figure 2-10d) and protects the alloy from subsequent oxidation [47]
28
222 Carbonaceous Gas Reactions
When carbon also comprises the oxidant (eg CO2) the high temperature metal-
gas interaction becomes slightly more complex than it would be with O2 alone In
addition to a metallic oxide CO is also formed as a product of the oxidation reaction
For a CO2 atmosphere with trace levels of CO H2 and H2O Gibbs et al [51] and
Pritchard et al [52] have suggested that carbon activity (ac) is controlled by the
disproportionation of CO as per the Boudouard reaction
2CO(g) ~ C (s) + C0 2 (g) (29)
or via the synthesis gas reaction
CO(g) + H2 (g) ~ C (s) + H20(g) (210)
Carbon (C) ingress into an alloy can affect oxide scale formation morphology and
adhesion because of the precipitation of carbides (carburization) [5354] as well as
disintegrate the alloy entirely (metal dusting) if the local ac is high enough [5556] This
section summarizes carburization (ac lt 1) and metal dusting (ac gt 1) mechanisms as
applicable to nickel-base superalloys in addition to what is done to protect against carbon
attack
2221 Carburization (ac lt 1)
Binary metallic carbides (MxCy) are just as easily formed as oxides assuming that
the ambient carbon activity supports the metal-carbon reaction [4557] With the same
thermodynamic concepts outlined in Section 2211 also applicable to carbide formation
an Ellingham diagram can be constructed to represent the comparative temperature-
dependent stabilities of assorted carbides Such a diagram is shown in Figure 2
metallic carbides specific to nickel-base superalloy compositions
copy p 150 cOj t t
Cor boo activity
tobe 40-00
Figure 2-11 Ellingham diagram for transition metal carbides [57]
30
In the absence of a protective oxide layer nickel and by extension its alloys are
catalytic to the carbon-producing reactions described by Equations 29 and 210 [53]
Thus carbon atoms adsorb on the exposed surface and facilitated by the disinclination of
nickel carbide (NisC) to precipitate (AG gt 0) diffuse into the nickel matrix The ensuing
metal-carbon reaction produces internal Cr and to a lesser extent other refractory
carbides that nucleate both at grain boundaries and within the grains themselves [5458]
Chromium-based carbides (Q23C6 Cr7C3 and Cr3C2) however can be particularly
harmful to an alloy that relies on the formation of a C^Ch scale for protection against
metal attack these carbides consume Cr from the nickel matrix that would otherwise be
used to form the protective oxide layer [45] A stability diagram for a Cr-O-C system at
620degC is depicted in Figure 2-12 and shows that carbide formation only becomes
preferential with extremely low oxygen partial pressures ie PQ2 lt 10 atm
Carbide morphology - controlled by the gaseous carbon activity exposure
temperature and alloy composition - obviously has a direct bearing on how carburization
will affect mechanical properties at service conditions [5354] Creep-rupture life for
example may be slightly improved with the precipitation of finely dispersed carbides
(low temperature and ac) or severely impaired by the formation of continuous carbide
films at the grain boundaries (high temperature and ac) [45] The effect of carburization
on room temperature mechanical properties however is almost always deleterious
regardless of carbide morphology [59] Figure 2-13 reveals significant decreases in both
tensile strength and ductility with increasing carbon content for two nickel-base
superalloys at room temperature pre-carburization data is included for contrast
-14 -12 -10
Log PCo2Pco
- 6 - 4 - 2 0 2 4 6 10 12 U
0
-2
-4
o -6 TO
-10
-12
-14
-16
I I I I I
Cr3C2(s)
Cr7C3(s)
_ Cr23C6(s)
-
Cr(s)
i i i
i i i i
Cl~ 1 -bull)
i i i
i i i i
Cr203(s)
i i i
i
-
-
-
i i
0
-2
-4
-6
-8
-10
-12
-14
-16
o o p_
O O
Q U) o
_ l
-50 -45 -40 -35 -30 -25 -20 - 1 5 - 1 0 - 5 0 5
Log Po2 (atm)
ure 2-12 Stability diagram for the Cr-O-C system at 620degC Reproduced from [45]
en c
pound
Si gt-5
a
pound
1000
soo
600
iOO
60
40
20
0
- mdash | mdash mdash mdash r
Ni-Cr-W
coarse
mdash-fmdashI 1 h - r Romge of data for solution -
bull ^ treated specimens and for spea---
J mens aged at i 950C
- J mdash J j mdash j -
HastelloyXR
I I I I I
Q-ltltin Oi 08 0 04 08
Carbon Content
Figure 2-13 Effect of carburization on room temperature mechanical properties of nickel-base superalloys [59]
32
2222 Metal Dusting (ac gt 1)
Metal dusting or catastrophic carburization occurs when susceptible materials -
coincidentally the base metals of superalloys - are exposed to gaseous carbon activities
greater than unity at temperatures between 400 and 800degC [4555] Graphite nucleation
and growth on or within these alloys is favoured because of the carbon-supersaturated
environment and inevitably leads to their destruction The subsequent corrosion product
(termed coke) consists of disintegrated metal and graphitic carbon in addition to oxides
and carbides depending on the alloy composition [5355] Figure 2-14 provides a
schematic representation of the metal dusting phenomenon for a C^Oyforming nickel-
base alloy
Carbon dissolution into a nickel-base alloy (Figure 2-14a) initiates at a defect or
void in its protective C^Ch oxide layer and accordingly a zone of finely dispersed
internal carbides (M7C3 and M23C6) develops beneath it (Figure 2-14b) Until now metal
dusting and carburization mechanisms are identical What differentiates the two beyond
this point is that the higher ac associated with metal dusting allows this carbide zone to
become supersaturated with carbon over time Graphite nucleates on the still-exposed
substrate surface assuming the oxide layer was unable to properly heal and grows
inward into the carbon-rich zone and dendritically along surrounding grain boundaries
(Figure 2-14c) Moreover metal grains encapsulated by graphite tend to separate from
the bulk metal because of the compressive stresses attributed to an expansion in volume
The outward growth of coke (Figure 2-14d) results in the uptake of metal carbides and
oxides from the substrate leaving behind hemispherical pits when it breaks away [5560]
33
Cr20 j M7C3 Internal carbides
Figure 2-14 Metal dusting mechanism of a Cr203-forming nickel-base alloy (a) carbon diffusion into the substrate initiated at C^C^ scale defect (b) formation of internal
carbides (M7C3 and M23C6) and local carbon-supersaturation of substrate (c) graphite nucleation and inward growth and (d) outgrowth of coke corrosion product
Reproduced from [55]
2223 Protection Against Carbon Attack
Carbon attack is prevented or at the very least hindered by the application or
formation of a barrier impervious to carbon diffusion such as a coating system or oxide
scale [58] or the introduction of gaseous hydrogen sulphide (H2S) [4555] into the
process environment The low carbon solubility in C^Cb and AI2O3 scales as well as Cr-
and Al-based coatings makes them ideal candidates for carbon barriers assuming that
they remain adherent to the substrate and free of porosity Protection imparted by
34
sulphur is slightly different from the former mechanism given that sulphur atoms adsorb
on the alloy surface and interfere with carbon-releasing reactions directly rather than
establish a protective barrier [4555] Too high a sulphur content in the process
environment though can also be harmful and lead to degradation by sulphidation
223 Erosion-Corrosion
Since most practical gaseous environments contain suspended particles erosion-
corrosion can be regarded as the most realistic of all the high temperature corrosion
modes Under that same rationale however the simultaneous surface degradation by both
mechanical and chemical means gives erosion-corrosion the potential to be one of the
most aggressive modes as well [45] Erosion for the context of this discussion applies
only to surface degradation by solid particle impingement and not by tribological
(friction) wear or cavitation This section first gives a brief overview on the mechanisms
of erosion and concludes with a description of the established erosion-corrosion regimes
2231 Mechanisms of Erosion
Erosion mechanisms broadly correspond to either the ability (ductile response) or
inability (brittle response) of a surface to absorb and dissipate the kinetic energy of an
impinging particle [61-63] At high temperature metals will most always exhibit a
ductile response a stark contrast to the brittle nature of such corrosion products as oxide
scales and coke deposits Figure 2-15 shows erosion mechanisms for both ductile and
brittle materials in response to a particle impact The ductile mechanism can be further
35
expanded to illustrate what effect impact angle (the angle measured from the surface to
the particles trajectory) and particle velocity have on surface degradation Other
contributing factors to the erosion rate of a material include the size shape hardness and
mass flux of the erodent [61]
DUCTILE RESPONSE
(a)
Low angle
BRITTLE RESPONSE
(c) High medi
angle ^ um speed V jWmdashgt Flake
formation
(d)
High ang leM- high speed
Melting J~ r ^ p
o O
Figure 2-15 Erosion mechanisms for ductile and brittle materials (a) low angle surface abrasion (b) high angle low velocity surface fatigue (c) excessive plastic deformation at
high angle medium velocity (d) surface melting due to high velocity impact and (e) brittle fracture Adapted from [61]
36
At low impact angles and above a threshold particle velocity the erodent cuts into
the surface of a ductile material (Figure 2-15a) of lesser or equal hardness Surface
gouging and subsequent material loss only intensify as particle velocity is increased
although this relationship between erosion rate and velocity is not shown explicitly in
Figure 2-15 As the impact angle approaches 90 degrees surface damage attributed to
particle impingement transitions from channels or grooves to impact craters At low
velocity but high impact angle plastic deformation is minimal yet the repetitive
bombardment of erodent produces highly localized surface fractures and ultimately leads
to fatigue (Figure 2-15b) Plastic deformation becomes increasingly exaggerated (Figure
2-15c) as does surface melting and re-solidification (Figure 2-15d) with even greater
particle velocities [61] However unlike the ductile mechanism of erosion the brittle
response to particle impact is characterized by negligible plastic deformation the
coalescence of subsurface cracks and subsequent spallation (Figure 2-15e) are
responsible for material removal [63]
Ductile and brittle erosion responses are typified in Figure 2-16 as a function of
impact angle The erosion rate of a ductile material reaches a maximum when surface
cutting predominates (ie an impact angle between 20 and 30 degrees) and decreases
rapidly as the particle trajectory becomes normal to the surface Conversely for a brittle
material the maximum erosion rate occurs when the particle impacts the surface at
90 degrees [6263] Furthermore overall erosion resistance is specific to the material and
not to the controlling erosion mechanism ie AI2O3 (brittle) is superior to both annealed
aluminum (ductile) and graphite (brittle) in terms of erosion resistance [61]
37
LU h -lt DC
O CD O DC LU
IMPACT ANGLE ((3)
Figure 2-16 Effect of particle impact angle on the erosion rate of ductile and brittle materials
2232 High Temperature Corrosion Interaction
Depending on the relative intensities of erosion and corrosion their combined
effect on surface degradation can be categorized into one of four regimes These regimes
are represented schematically in Figure 2-17 and listed in order of increasing erosion rate
or decreasing corrosion rate include pure corrosion erosion-enhanced corrosion
oxidation-affected erosion and pure erosion For each regime (excluding pure erosion)
diffusion-controlled oxidation is assumed to be the dominant corrosion process [64]
The pure corrosion regime as its name would imply is unaffected by the presence
of an erodent Only in the erosion-enhanced regime does the synergistic effect of erosive
and corrosive processes on surface attack first become obvious Moreover this regime
itself encompasses three unique modes - termed types I II and III - of erosion-corrosion
DUCTILE RESPONSE
38
interaction For type I erosion-enhanced corrosion erosive thinning of the oxide scale
leads to an overall increase in oxidation rate However an eventual balance between
erosion and oxidation rates is established and the scale thickness remains constant In
some instances scale thickness may actually increase because of particle impingement a
feature typical of type II erosion-enhanced corrosion Rishel et al [64] has postulated
this behaviour to be a result of one or both of the following mechanisms (i) elements
(eg Al) that would otherwise selectively oxidize and form slow growing protective
oxides scales (eg AI2O3) are removed from the matrix by the erodent or (ii) the number
of short-circuit diffusion pathways in the oxide scale are increased by impact-induced
cracking Lastly type III erosion-enhanced corrosion can be viewed upon as an
extension of type I except that both the intensity and irregularity (either in particle size or
impact frequency) of erosion have increased the oxide scale becomes incoherent
allowing the erodent to now deform the substrate [64]
When erosion prevails over corrosion to become the dominant mode of surface
degradation the oxidation-affected erosion regime is befitting to describe the erosion-
corrosion interaction Successive particle impacts occur and remove material much faster
than the oxide scale can grow laterally over the exposed substrate Consequently a
complex conglomerate of corrosion product erodent and metal develops in lieu of the
oxide scale The final erosion-corrosion regime - the pure erosion regime - occurs in the
absence of an oxidant or at temperatures too low to facilitate scale formation [4764]
Metal recession therefore proceeds according to the ductile erosion response presented in
Section 2231
39
E R O S 1
O N
R A T E
C 0 R R O S 1
o N
R A T E
NO CORR
METAL
SPALLS
A
METAL
COMPOSITE LAYER
METAL
METAL
EROSION OF OXIDE
ONLY
TYPE II
EROSION ENHANCED
CORROSION
TYPE I
TYPE II
OXIDATION AFFECTED EROSION
I
EROSION OF METAL ONLY
Figure 2-17 Erosion-corrosion interaction regimes Adapted from [64]
23 High Temperature Corrosion Testing
Ideally high temperature corrosion testing would be carried out in the intended
service environment to give the most meaningful material response However when
such a task proves impractical frequently because of the costs or safety implications
involved laboratory corrosion test rigs serve as effective alternatives in which to
approximate service conditions [65] Additionally the control afforded by laboratory test
40
rigs over such process variables as temperature pressure flowrate environmental
composition exposure time and entrained particulate allows for a methodological
approach in determining how each will influence corrosion behaviour Very rarely
though if ever are the quantitative results (eg corrosion rates) obtained through
laboratory testing directly exchangeable with the real-world application instead these
results help to rank and identify suitable candidate materials [6566] This section will
discuss laboratory corrosion test rigs as related to high temperature (purposely gas
turbine) applications and summarize the autoclave-based S-CO2 corrosion systems that
have been built to date
231 Erosion-Corrosion Rig Testing
Erosion-corrosion test rigs capable of producing intermediate to high velocity
particle impacts at elevated temperature can be classified into one of two groups the
rotating-type or the blast-type [67] These groups coincide with how contact between the
specimen(s) and erodent (typically silicon dioxide AI2O3 or ash) is initiated - either
indirectly from the rotary action of a motor or from particles entrained within the gas
itself [6768] Despite their obvious differences in operation the main components
comprising each type of erosion-corrosion test rig are essentially the same a unit to hold
erodent either in the form of a hopper or fluidized bed and subsequent system to collect
it a gas-particle mixer and a test chamber which is usually enclosed by a furnace
41
2311 Rotating-Type Rigs
The rotating-type class of erosion-corrosion test rigs whose negligible gas
velocities make them apposite to testing in harsh gas compositions include the whirling
arm [69] and centrifugal designs [68] Both designs can also accommodate multiple
specimens simultaneously allowing for time-efficient testing of different materials under
identical conditions or one material at various impingement angles
Even when compared to its centrifugal counterpart the whirling arm test rig is
unique because the erodent in addition to the corrosive gas remains effectively static
relative to a stationary reference frame Specimens are mounted to an arm or holder
which in turn is rotated though a fluidized bed or stream to encourage particle
interaction [67] Accordingly the particle impact velocity (limited to approximately
30 ms) becomes a function of the rotational speed of the arm and at what radial distance
the specimens are mounted from its axis of rotation [69] A process flow diagram of a
whirling arm test rig used in high-sulphur low-oxygen environments is shown in
Figure 2-18 although other gaseous compositions could be easily interchanged
Centrifugal erosion-corrosion rigs as depicted in Figure 2-19 use a centrally-
located rotating nozzle to eject erodent at specimens Specimens are positioned to
encircle the perforated base of the nozzle and particle impact velocity analogous to the
rotating arm design is governed by its rotational speed [68] Impact velocities and
loading rates of up to 200 ms and 06 kgm2s respectively are possible with the
centrifugal rig but quantifying the total mass of erodent that has impacted with the
specimens becomes convoluted if various impingement angles are tested at once [67]
42
H gt
r Waste gas
Fluid izsd
V Direction of gas flow
bull J Nitrogen
Figure 2-18 Whirling arm erosion-corrosion test rig [69]
Pariide feed nozzle
Rotating (g) Vjirsction
Partltd9 - ~~Zygt Rotating nozzle
Test p i e c a - ^ s ^ f ^ F Heater -
Particle flying dradion
Partcte Particles _ feed nozzle Rotating
l ~J~- - noHte
Heater (insWe)
Test piece (20x50)
Figure 2-19 Centrifugal erosion-corrosion test rig [68]
43
2312 Blast-Type Rigs
Erosion-corrosion test rigs utilizing pressurized gas to accelerate the erodent
represent the most common configuration used at research institutions and in industry due
to their simple construction and inexpensive operation [67] Regardless of their
prevalence gas jet and high velocity rigs are not capable of the same degree of particle
velocity uniformity that can be achieved with the rotating-type designs
For the gas jet blast-type test rig the erodent is introduced to a pressurized reactive
gas accelerated via aerodynamic drag force through a convergent nozzle and accelerator
tube and directed at a single specimen or stage of specimens [7071] A schematic
representation of such a rig is provided in Figure 2-20 Contrary to the rotating-type rigs
particle velocity - typically limited to 40 ms [67] - is dictated by the pressure
differential established between the gas carrier and the test chamber as well as the length
and diameter of the accelerator tube to a lesser extent both particle size and shape in
addition to the temperature at the accelerator tube outlet also influence particle velocity
[71] The reactive gas stream may also be supplied from the exhaust of a combustor
(referred to as a burner rig in this arrangement) with erodent injected into the attendant
air or fuel supply prior to combustion or into the exhaust gas stream following
combustion [67] Likewise burner rigs are imperative to the study of hot corrosion
mechanisms and understanding the deposition behaviour of molten salts
High velocity high temperature wind tunnels draw many parallels to the gas jet
blast-type test rigs but on a much larger scale Erodent is typically injected far upstream
of the test specimen(s) and accelerated by the high velocity gas in a constant area duct
44
The outcome is an erodent-laden gas stream spanning the entire cross-section of the duct
which acts to preserve the aerodynamic characteristics of the fluid field [71] ie the
erosion-corrosion interaction is more representative of what would be seen in service as
opposed to that induced by a localized gas jet Compared to high velocity burner rigs the
wind tunnel configuration can achieve comparable particle velocities (approximately
300 ms) at similar test temperatures (1100degC) but only at a fraction of the operating cost
[67] Figure 2-21 illustrates a wind tunnel erosion-corrosion test rig whose gas stream is
supplied by the exhaust of a can combustor
Particle inflow
MmifM chamber heater
G as laquoHef
Specimen Wdr
Mixing chamber
Nozzle Uoxlk heater Speamen chamber
irnen
Specimen chamber tartar
Copplaquof electrode
Figure 2-20 Gas jet erosion-corrosion test rig [72]
45
( A I R SUPPLY ( I )
XL FUEL
PARTICLE mdash 4 INJECTQS
bullbull PROPANE IGNITER laquo COMBUSTOS (C)
STCAK
ACCELEF-ATION TUNNEL ( F)
^ EXHAUST
J-
SECONDARY a AIR
PARTICLE FEEOtR
( A )
EXHAUST TANK (H)
Figure 2-21 Wind tunnel-type erosion-corrosion test rig [67]
232 Autoclave Testing
High temperature autoclave test systems emphasize the chemical rather than the
mechanical response to the simulated service environment and therefore have no cause
to accelerate erodent and generate high velocity impingements Whether these systems
are intended to be operated under static once-through or recirculating conditions each
will employ some form of a metallic usually cylindrical pressure vessel [65] either to
hold test specimens or to function as one (in the case of a pipe) Here the inclusion of a
pressure vessel permits corrosion studies to be conducted well above standard pressure
something that most erosion-corrosion test rigs are not capable of Exactly what
46
combination of internal pressure and temperature the vessel can safely be subjected to is
determined by its cross-sectional dimensions and construction material
Pressure vessels used in autoclave corrosion test systems tend to limit their capacity
to between 05 and 50 L to minimize the associated material costs [65] Figure 2-22
shows the general relationship between the internal pressure (P) of a pressure vessel and
the minimum required wall thickness (t) to contain it normalized to the maximum
allowable material stress (omax) and internal radius (rj) respectively Regardless of
whether the internal or external radius of the vessel is fixed wall thickness increases
exponentially in response to increasing internal pressure for the former the vessel can
become quite cumbersome as its pressure approaches amax whereas for the latter internal
volume is significantly reduced Often the overall length of the pressure vessel is
extended to maintain a workable internal volume yet still preserve a sensible external
diameter [65]
0 025 05 075 1
POmax
Figure 2-22 Effect of internal pressure on the minimum required wall thickness for a pressure vessel of circular cross-section
47
Caution should be exercised when selecting the pressure vessel material(s) if the
metal temperature is likely to exceed 550degC Figure 2-23 provides maximum allowable
stress versus temperature curves for alloys used in current fossil boilers and those
expected to be integral to emerging ultra-supercritical water power plants ie materials
which must retain their mechanical properties (eg creep-rupture strength and fracture
toughness) at intermediate to high temperatures while at the same time resist corrosive
attack As expected nickel-based alloys outperform both ferritic and austenitic stainless
steels at these service temperatures and are fit to serve as either the shell or seal material
for a pressure vessel By contrast non-metallic seal materials such as elastomers and
plastics are generally ill-suited for high pressure applications and also degrade rapidly
between 150 and 250degC [73] Particularly aggressive test environments may even
warrant the application of a compatible ceramic liner to the bore of the pressure vessel
[65]
800 900 1000 1100 1200 1300 1400 1500 1600 1700 Temperature (dF)
Figure 2-23 Stress-temperature curves for high temperature boiler materials [74]
48
2321 S-C02 Corrosion Test Rigs
The majority of S-CO2 corrosion test rigs (and exclusively those with high
temperature capabilities) have just recently emerged with the advent of S-CO2 Brayton
cycles earlier corrosion test rigs evolved when S-CO2 was being considered for oil
recovery endeavours [23] and as an industrial solvent [24] All S-CO2 test rigs however
at least those published in open literature have been based on the autoclave design (either
at static or low flowing conditions) and exist or once existed at the following institutions
the Chevron Oil Field Research Company [23] Sandia National Laboratories [24] Idaho
National Laboratory (INL) [11] Tokyo Institute of Technology [3375] Massachusetts
Institute of Technology (MIT) [34353876] University of Wisconsin-Madison
(UW-Madison) [36] and the Commissariat a lEnergie Atomique (CEA) [37] Only
Sridharan of UW-Madison has initiated the development of a test loop to investigate
flow-assisted corrosion mechanisms in high temperature S-CO2 environments [77] This
section will review the S-CO2 corrosion facilities listed above in chronological order
One of the earliest references to a test rig dedicated to studying material
compatibility with S-CO2 originated at the Chevron Oil Field Research Company shortly
before 1972 [23] A novel enhanced oil recovery effort at the time Chevron proposed to
inject high pressure CO2 (165 MPa) into spent wells to restore reservoir pressure hence
the construction of a laboratory corrosion test rig was necessitated to replicate the
conditions that would be encountered within these CO2 pipelines As depicted in Figure
2-24 the Chevron test rig consisted of three pressure vessels - large enough to
accommodate test specimens 3048 mm (120 in) in diameter - which were arranged to
49
form two independent recirculating test loops Together an air-driven gas booster pump
and nitrogen-charged accumulator delivered dry CO2 (at 139 MPa) to both loops where
it was heated and then circulated at fluid velocities of 762 to 1016 mmmin (300 to 400
inmin) Provisions in the overall design also allowed for impurity species such as water
and H2S to be easily incorporated into the S-CO2 if so desired Each test loop however
was limited to just 173 MPa - in fact safety relief valves and rupture discs would
activate at 153 and 160 MPa respectively to protect against inadvertent over-
pressurization - and could only reach a maximum temperature of 54degC
v l VIB ~ FUU-FIOW 8ALI VALVES SWF laquo 1MB PSi v3 VSI = SOFT SEATING VALVES W 6006 11
V91 4 SKUt QFf VALVt FOB AIR SWP ISO PSi
Figure 2-24 Chevron Oil Field Research Company S-CO2 corrosion test rig [23]
In 1994 Sandia National Laboratories designed and assembled a static
S-CO2 corrosion test rig to complement research related to using S-CO2 as an industrial
solvent [24] A process flow diagram of the Sandia design is shown in Figure 2-25
Compression to the desired CO2 test pressure (242 MPa) was achieved using a two-
50
stage gas booster pump arrangement to prevent or at the very least minimize problems
(pump hesitation and surging) associated with a low CO2 supply pressure Specimens
were suspended from a glass support stand inside an 18 L sample vessel which because
of the temperature-controlled water bath used to heat it was inherently limited to
temperatures under 100degC (ie the boiling point of water at standard pressure) Upon
depressurization of the sample vessel to atmosphere a 10 L recovery vessel acted as an
intermediary to collect co-solvent (eg water and other alcohols) that would condense as
the solubility in CO2 decreased with pressure The entire corrosion test system -
including both sample and recovery vessels as well as the tubing and fittings - was
fabricated from 316-grade stainless steel (316-SS) and ultimately restricted to test
pressures below 346 MPa
Desiccant Molecular Sieve
M
k 4 Pump
co2
Check Valve
Vent to fume hood
Temp controlled sample vessel
Recovery vessel
Figure 2-25 Sandia National Laboratories S-C02 corrosion test rig [24]
Between 2002 and 2005 the INL conducted an extensive research initiative to
develop a S-CO2 Brayton cycle that could be applied to the VHTR [11] Two test rigs
were created as part of this initiative that would mark the beginning of a series of high
temperature S-CO2 corrosion test rigs The first corrosion test rig while somewhat
51
unconventional in its configuration used water-cooled connections to convert a tubular
test specimen into a functioning segment of high pressure pipe Figure 2-26 shows a
schematic of this initial design with the test specimen supplied with CO2 from a high
precision syringe pump and surrounded by a resistance tube furnace In using the water-
cooled connections the ends of the specimen were kept at a considerably lower
temperature than its center adding axial-varying thermal stresses to the mechanical
stresses already induced at the bore Test conditions (ie pressure and temperature) were
specific to the specimen material even though this once-through test rig was capable of
delivering CO2 at 210 MPa and 25 mLmin and heating it to 1100plusmn5degC prior to
throttling to atmosphere
The second corrosion test rig built by the INL was in fact just an adaptation of their
initial design replacing the single tubular test specimen with five thick-walled 304-
grade stainless steel (304-SS) pipes Each pipe measured 12 m (472 in) in length had
an internal diameter (ID) of 11 mm (043 in) and used a wall thickness that could
withstand an internal pressure of 70 MPa at 1000degC for 10000 hours Multiple
specimens could be inserted into these pipes and tested simultaneously although the use
of 304-SS at elevated temperature left them prone to creep and in one instance resulted in
a rupture Figure 2-27 illustrates the layout of this corrosion test rig complete with a gas
sampling system (a mass spectrometer as well as O2 and COCO2 meters) and confirms
its likeness to its predecessor Both corrosion test rigs have since been decommissioned
following the conclusion of this S-CO2 initiative
52
To Vent
C02
Control Valve
bull Q
Back Pressure Regulator
TC Pump
o A A A A A A A A A A t -CXmdashraquobull Relief Valve
Prc-heater
Resistance Furnace
Heater
A A A
Water cooled seals attached to ends of test tube
V V s Vent to Atmosphere
Figure 2-26 INL single specimen S-CO2 corrosion test rig Adapted from [11]
Pressure Relief Valve
Preheat Tube RfC] Furnace
Cooling Water ( p) fp
It
ffffl pound Filter
(mdash1X1--Xh-
f
DP
Tube Heater
rwww^ mdashIXt-
V4 Header I I High Pressure Pump Test Sections
Corrosion Section 1000degC
T ) ( P
Yi Header
copy Vent 1 Rotameter bull
0 reg
O Meter
LrmdashImdashJ -1X1mdashI
Mass Spec
C0 2
Meter
C02 C02
Figure 2-27 INL multi-specimen S-CO2 corrosion test rig Adapted from [11]
53
Almost concurrent with the INL initiative the Tokyo Institute of Technology in
collaboration with the Japanese Atomic Energy Agency (JAEA) began the first stage of a
very similar advanced energy system project in 2003 The main objective of this project
was to verify the performance and system design of a S-CO2 Brayton cycle for use with a
fast breeder reactor (FBR) [75] In addition to the compressor and heat recovery test
loops that resulted a high temperature S-CO2 corrosion test rig was also developed to
investigate the corrosion resistance of 316-SS and 12-chromium steels This corrosion
test rig largely mirrored the multi-specimen design produced by the INL but as depicted
in Figure 2-28 was modified to function as a recirculating system Two gas booster
pumps pressurized a buffer tank to 220 MPa where CO2 was regulated to 200 MPa and
sent to the five corrosion test sections at 12 kghr Spent CO2 was then cooled from a
maximum test temperature of 600degC reduced to 40 MPa and returned to the booster
pumps Test sections in the furnace though measured only 127 mm (05 in) in outer
diameter limiting the cross-sectional size of specimens that they could accept to just
under 4 mm (016 in)
In 2007 researchers at MIT constructed two single vessel S-C02 corrosion test
rigs to expand upon the high temperature corrosion data assembled by both the INL and
Tokyo Institute of Technology [38] As Figures 2-29 and 2-30 would suggest the
general configuration of each test rig was the same apart from the size of and flow path
through their respective pressure vessels a gas booster pump supplied an Inconel-625
(IN-625) pressure vessel with high pressure CO2 where it was heated by a split-tube
furnace and later exhausted to atmosphere at 10 Lhr through a gas bubbler Residual
54
gas analyzers (RGA) integrated into each test rig allowed gas compositions to be
compared both prior to entering and after exiting the pressure vessel although no
discernible difference between the two streams was ever noted
The smaller of the two pressure vessels (Figure 2-29) had an ID of 127 mm
(05 in) measured 3048 mm (120 in) in overall length (1016 mm or 40 in of which
was heated) and was limited on account of the compression ratio of its gas booster
pump to a maximum operating pressure of 125 MPa at 650degC With only one opening
in its shell gas entry and egress was accomplished using 16 mm (00625 in) and 64 mm
(025 in) tubing arranged in such a way that the annulus surrounding the smaller inner
tube delivered fresh CO2 to the vessel while the inner tube itself provided a pathway to
atmosphere Conversely the larger pressure vessel (Figure 2-30) had an ID of 254 mm
(120 in) and measured 152 m (600 in) in length 061 m (240 in) of which was heated
by a three-zone 50 kW furnace While this vessel could according to American Society
of Mechanical Engineers (ASME) standards safely operate at any combination of
pressure and metal temperature up to 270 MPa and 750degC respectively corrosion
studies following its initial commissioning were restricted to below 220 MPa and 700degC
Furthermore both vessels used carbon steel bolts to hold conical IN-625 end seals in
place requiring additional thermal management (internal heat reflectors and heat sinks)
to ensure that the bolts remained below their tempering temperature
W Water bath PH Pre heater RP Rotary pump
BT Buffer tank DP Dew-point hygrometer FM Flowmeter DPG Differential press gauge O2 Oxygen analyzer
Test Sections
Figure 2-28 Tokyo Institute of Technology S-CO2 corrosion test rig Adapted from [33]
Heat Fin Internal Thermocouple
Gas Booster Pump
Compressed Air Supply
RGA
Sample External Train Thermocouple
Gas Bubbler
C0 2 Supply
Figure 2-29 MIT low pressure S-CO2 corrosion test rig Reproduced from [38]
Furnace
56
Helt Sink
CO2 S u p p k
Bleed V a k e
Internal fcternal Thermocouple Thermocouple
Gas Bubbler
Figure 2-30 MIT high pressure S-CO2 corrosion test rig Reproduced from [38]
No later than 2009 the UW-Madison built its own S-CO2 corrosion test rig joining
the likes of the INL Tokyo Institute of Technology and MIT to assess materials that
could be used in S-CO2 power conversion systems [36] As shown in Figure 2-31 this
once-through test system used a syringe pump to deliver CO2 at 00 to 50 gmin to an
IN-625 pressure vessel The pressure vessel which was wrapped with three resistive
heating cords instead of seated within a tube furnace was designed to contain a
maximum test pressure of 269 MPa at 650degC Unlike the previous high temperature
S-CO2 corrosion test rigs though operation of this system was controlled entirely through
a computer
57
ItslSeaMech f~ ) D u m l X l h e I h c t t l m C l tnllmHlk ltbull Cm L SI
Tliroltlc 0 2 miuui liller ]i cj S Ilea Sim ltt t^~^~^ bull l o uit
Inkl m o ilvt
Ik Ule Pres^ I lani
lnla0 2 miLron hlkr
Bottle I
Bottle 2
1 lcnnl IILULI-2
DORtsistnc Ikat
Ettrnil lit utr ] lElt iml Ikilu
Figure 2-31 UW-Madison S-CO2 corrosion test rig Adapted from [36]
The most recent high temperature S-CO2 corrosion test rig was fabricated by the
CEA to support ongoing French research dedicated to the SFR [37] Specimens were
placed in a 10 L 316L-SS agitated pressure vessel that could withstand 250 MPa at
550degC Figure 2-32 provides a schematic of this very modest static test rig whose only
recorded variable was the temperature within the vessel
Thermocouple
Agitated Reactor
Figure 2-32 CEA S-C02 corrosion test rig [78]
58
24 Methods of Corrosion Analysis
Numerous analytical techniques can be employed both to measure the growth rate
of the corrosion product as well as to characterize its structure and composition While
electrochemical methods are viable at high temperatures a change in specimen mass is
frequently used instead to assess reaction kinetics [66] Additionally the limitations
presented by optical microscopy such as the maximum attainable resolution and inability
to generate elemental maps are overcome with electron microscopy and electron- or ion-
based spectroscopy [79] This section will therefore outline aspects relating to
gravimetric analysis as well as spatially resolved and surface analysis techniques
241 Gravimetric Analysis
Gravimetric analysis can be performed either in-situ or ex-situ of the corrosion test
environment with obvious advantages to each approach In-situ mass gain
measurements provide the most accurate representation of reaction kinetics but
unsurprisingly are expensive and usually less applicable to longer exposure times and at
higher pressures [475366] A single specimen is suspended from a delicate silica fibre
or platinum wire which in turn is attached to a continuous-recording microbalance
Moreover an inert shielding gas of equal or slightly greater pressure than the test
chamber must be used to protect the microbalance against corrosion [4753] In contrast
ex-situ measurements require minimal premeditative effort to carry out and allow
multiple specimens to be tested simultaneously Since specimens must be removed from
the test chamber to be weighed mass gain data is discontinuous and possibly erroneous if
59
the thermal shock imposed on the specimens affects the stability of their corrosion
product [66]
242 Microscopic and Spectroscopic Analyses
Lateral resolutions as low as 10 nm can be achieved with a scanning electron
microscope (SEM) which uses a thermally-generated electron beam under vacuum to
raster scan the surface of the specimen [79] Figure 2-33 depicts the resultant electron
and radiation emissions following the interaction of this incident electron beam with the
surface Typically backscattered and secondary electrons energies are detected
amplified and used in conjunction with a cathode ray tube to produce a topographical or
cross-sectional image of the specimen [7980] These images can then be used to
examine the morphology and total thickness of the oxide layer in addition to the mode
(eg uniform or intergranular) of corrosive attack
Fitted with the appropriate detectors the SEM can also perform Auger electron
spectroscopy (AES) or X-ray photoelectron spectroscopy (XPS) concurrent to the
imaging process Both of these spectroscopic analyses have very limited depth resolution
or penetration but can provide invaluable compositional information (ie the oxidation
state of detected elements) of what is being viewed Secondary ion mass spectroscopy
(SIMS) is often used when a more precise surface characterization of the corrosion
product is required Ion sputtering replaces the electron beam and elemental mass
concentrations are determined either on the surface or as a function of profile depth
[4780]
Incident electron beam
Backscattered electrons
Secondary electrons
Characteristic X-rays
Auger electrons
Diffracted electrons
Inelastically scattered electrons
Transmitted electrons
60
Figure 2-33 Surface interaction with an incident electron beam [47]
25 Metallic Corrosion in High Temperature CO2 Environments
Prior to the realization of the S-CO2 Brayton cycle the British AGR program was
essentially the only motivating force for high temperature CO2 corrosion testing
Fittingly this testing was aimed to investigate the corrosion resistance of proposed
superheater and fuel cladding materials - ferritic and austenitic stainless steels - at CO2
pressures up to 53 MPa While these tests helped to qualify the oxidation kinetics of
steels in high temperature CO2 they could not substantiate whether similar behaviour
would be observed at higher (supercritical) pressures and with nickel-base superalloys
such was the basis for the S-CO2 corrosion test facilities presented in Section 2321
This section will briefly review high temperature CO2 corrosion studies conducted at
both at subcritical and supercritical pressures
61
251 Subcritical Pressure
Corrosion studies carried out as part of the AGR nuclear program affirmed that the
chromium content of an alloy was perhaps the most influential factor in determining its
resistance to CO2 attack Ferritic and austenitic steels were exposed to CO2 up to 700degC
and 53 MPa and the morphology kinetics and composition of the resultant oxide
layer(s) were examined For chromium content characteristic of ferritic stainless steels
(ie below 12) a Cr-partitioned duplex oxide layer formed consisting of a magnetite
(F6304) outer layer and chromite spinel (FeC^CU) substratum [27-31] This duplex oxide
structure is shown in Figure 2-34 The growth mechanism of the FeC^Cv substratum -
the rate controlling oxidation process [29] - was a result of the inward diffusion of the
oxidant opposite to the outward diffusion of Fe needed to sustain to the Fe3Cgt4 layer
However as Figure 2-35 indicates these steels became increasingly susceptible to
breakaway oxidation above 550degC (823 K) following a period of protective and then
transitive behaviour the incubation time to the onset of breakaway oxidation decreased
predominately with increasing temperature although surface finish specimen geometry
prior cold working and silicon content also had some effect [2728]
F e 3 0 4
FeCr SPINEL
INTERNAL OXIDATION ZONE
10 y
Figure 2-34 Multi-layered oxide (FesCM | SiCgt2 | FeCfoO-O that formed on a ferritic stainless steel following 1060 hour exposure to C02 at 520degC and 40 MPa [31]
62
0 1 I 1 1 1 1 1 SIS 873 SS3 773 713 673
TEHPCKATURI (K)
Figure 2-35 Post-breakaway oxidation rate as a function of temperature [27]
Breakaway oxidation was attributed to the underlying metal becoming saturated
with carbon to the point that oxide grains were encapsulated by carbides or graphite and
as a result removed any adherence between the oxide and metal [29] Furthermore the
vacancies left in the ferritic matrix by chromium depletion created new short-circuit
diffusion pathways to the oxide-gas interface increasing the overall oxidation rate
Higher levels of CO in the ambient atmosphere were also found to be conducive to
breakaway oxidation because of the increase in carbon activity and hence tendency for
carburization [28] With chromium content above 18 austenitic stainless steels were
disposed to form continuous Q2O3 oxide layers in addition to the aforementioned
63
duplex oxide structure Unlike their ferritic counterparts though these steels were
unreceptive to breakaway oxidation and their higher chromium content conferred a self-
healing feature to the oxide if damaged [32]
While limited in number similar corrosion studies were also conducted using pure
nickel [81] and nickel-base superalloys [26] As expected pure nickel performed poorly
between 700 and 1100degC relative to the superalloys due to its inability to form Cr- or
Al-based oxide layers At lower temperatures the corrosion resistance of nickel-base
superalloys in CO2 was comparable to that of austenitic stainless steels although the
former seemed to be more affected by internal oxidation Nevertheless Hastelloy X
appeared at the time to be the most stable of all the superalloys in CO2 albeit this was
prior to 1976 [26] Recent work has also shown IN-617 to have a propensity for
intergranular attack in CO2 but only at extreme temperature ie 1000degC [11]
Figure 2-36 illustrates the ingress of corrosion product into the base metal after 175 hours
of testing suggesting that long-term material stability may eventually be compromised
Intercranular attack
2 5jnm Base metal
Figure 2-36 Intergranular attack of IN-617 following 175 hour exposure to C0 2 at 1000degC and 70 MPa [11]
64
252 Supercritical Pressure
While testing in the high temperature S-CO2 regime is still in its infancy early
results would suggest that the larger pressures have a relatively minor influence on
corrosion behaviour Hejzlar et al [76] liken this to the fact that the density of CO2 -
which determines the solubility and dissociation of both corrosive species and subsequent
corrosion products - does not markedly increase with pressure at temperatures so far
above its critical point (3103degC and 738 MPa) Additionally austenitic steels - 304-SS
and 316-SS - tested at temperatures nearer the critical point of CO2 where density is the
greatest showed no discernable evidence of corrosion even with significant impurity
(water methanol or sulphur) content added [23-25] Table 2-3 summarizes the various
test conditions (eg pressure temperature and duration) used by researchers with the
high temperature S-CO2 corrosion facilities described in Section 2321
Much of what was learnt from the AGR program regarding the surface response of
ferritic and austenitic stainless steels to CO2 exposure is equally applicable at
supercritical pressures Ferritic stainless steels - 410J3-SS F91 HCM12A HT-9 and
T91 - exhibited the same breakaway oxidation behaviour due to their inability to form a
continuous Cr2Cgt3 layer and susceptibility to carburization [33-37] Apart from the silica
inner layer Figure 2-37 shows a near identical FeaCVchromite spinel duplex oxide
morphology to that which was depicted in Figure 2-34 In fact S-CO2 corrosion tests
that included ferritic stainless steels were intentionally limited to below 500 hours to
minimize the extent of spallation and avoid potential cross-contamination with other
specimens
65
Table 2-3 Test conditions used for high temperature S-CO2 corrosion studies
Researcher
Oh et al
Furukawa et al
Li et al
Dunlevy
Gibbs
Lim et al
Sridharan et al
Rouillard et al
Institution
INL
Tokyo Institute of Technology and JAEA
MIT
UW-Madison
CEA
Test Conditions Pressure (MPa) 70100
200
128 200
125
200
125
120
220
207 250
Temperature (degC) 1000
400
500
550
600
660
714 650
750
610
650
650
550
Duration (hrs) 500
1991
230
500
1000
3000
230 1032
194
3000
310
Ref
[11]
[33]
[76]
[38]
[34]
[35]
[36]
[37]
Base metal
J 100pm
Figure 2-37 Characterization of 410J3-SS oxide structure following 1000 hour exposure to S-CO2 at 600degC and 200 MPa [33]
66
Excluding 316316L-SS austenitic stainless steels - 310-SS 800800H and
AL-6XN - had mass gains that were indistinguishable from most of the nickel-base
superalloys examined [3436] Figure 2-38 plots the cumulative mass gains for these
steels as well as the other alloys tested at UW-Madison The poor corrosion performance
of 316316L-SS above 650degC while not as severe as what was observed with the ferritic
stainless steels was again ascribed to oxidant eventually permeating through the duplex
oxide layer and reacting with the chromium-depleted austenite matrix Seemingly
counterintuitive the corrosion rate of 316316L-SS was also found to decrease with
increasing temperature - from 011 mgcm -day at 650degC to 006 mgcm -day at 750degC
[38] At higher temperatures the lattice diffusivity of chromium within this alloy was
believed to increase allowing for the formation of an underlying chromite spinel layer to
occur much sooner [76]
Ten nickel-base superalloys constitute the preliminary high temperature S-CO2
corrosion database that has been openly established for this class of high-performance
material IN-625 IN-690 IN-693 IN-718 IN-725 IN-740 IN-740+ Haynes 230
MA754 and PE-16 With sufficient chromium content to promote the growth of a thin
external Cr203 layer all of these superalloys displayed excellent corrosion resistance and
consistency amongst one another [343638] The slight differences in mass gain that
were noted correlated directly to the Al content of the alloy - the growth of a NiAl204
substratum or continuous AI2O3 external layer both served as a more effective barrier to
the outward diffusion of cations than a C^Ch oxide layer could alone
ltJ
200
180
160
140
120
bull | 100 O pound 080 ox
1 pound 060 040
020
000 rTJll
-n
P 500 Hours bull 1000 Hours
D1500 Hours D 2000 Hours
bull 2500 Hours H 3000 Hours
67
[ r f m T l rITB riTB rf i i rrfTM PM2000 316 s s 310 SS AL-6XN 800H HAYNES ALLOY 625 PE16IN-
230 CM-639P
Figure 2-38 Cumulative mass gains of various alloys following a 3000 hour exposure to S-C02 at 650degC and 207 MPa at UW-Madison Reproduced from [36]
Figure 2-39 shows the cumulative mass gains for the various nickel-base
superalloys tested at MIT by Dunlevy [38] For select materials (IN-718 and LN-725)
samples were also cut parallel to the rolling direction of the supply stock under the
assumption that exposed end grains (EG) would facilitate the uptake of oxidant and result
in increased corrosion rates however the formation of a protective oxide layer was likely
so quick that these short-circuit diffusion pathways were covered over almost
immediately Similarly no connection between pressure and corrosion behaviour was
firmly established - in some instances the increase in pressure at higher temperature
appeared to suppress oxidation but the variance in test data at 650degC was too large to
corroborate this Protrusions from the external oxide layer indicated that transitional
68
elements in the alloy (Nb Ti and Zr) in addition to Cr were also diffusing to the surface
and forming carbides While these carbide precipitates had no bearing on the stability of
the oxides in this study Dunlevy [38] suggested that they could serve as eventual sites for
crack initiation within the oxide layer
O016
0014
bullS 0012
i 0010 3) ~ 0008 E () 0006
O) 0004
0002
0000
bull LA2 Cumulative 0-500 Hour T=650 C P=125 MPa
bull LA1 Cumulative 0-500 Hour T=714 C P=20 MPa
I I I III III I I Inconel Inconel Inconel Inconel Inconel Inconel Inconel Inconel
690 693 718 (EG) 718 725 (EG) 725 740 740+
Figure 2-39 Cumulative mass gains of nickel-base superalloys following exposure to S-CO2 at various test conditions [38]
Lastly iron-base oxide-dispersion strengthened (ODS) alloys and particularly
those with high Al content (MA957 and PM2000) demonstrated superior corrosion
resistance to even that of the nickel-base superalloys an adherent but wavy AI2O3 layer
formed on the surface of these alloys [34-36] While they seem like a logical choice for
the structural materials of a S-CO2 Brayton cycle ODS alloys are currently expensive to
process and unfavourable to conventional welding techniques [82] Until these issues are
resolved nickel-base superalloys represent the best alternative
69
26 Summary
The foregoing sections emphasize just how complex and potentially disastrous
material interaction with a high temperature CO2 environment can be Moreover the
reader should now have an appreciation for the current state of corrosion research related
to the S-CO2 Brayton cycle and why the development of a dedicated S-CO2 corrosion
testing facility is justified Summarized below are the key points that should be taken
from this literature review
1 Multi-step chemical processes allow for the release of O and C atoms from a
carbon-rich oxidant to initiate and sustain oxidation carburization and
potentially metal dusting corrosion mechanisms
2 While limited in number all the S-CO2 corrosion facilities that have been built
to date utilize a metallic pressure vessel to either contain test specimens or to
function as one Static once-through and recirculating configurations have
been used
3 Preliminary results from high temperature S-CO2 corrosion studies correlate
well with what was observed at subcritical pressure as part of the British AGR
nuclear program ie the ability to form a continuous adherent Cr203 oxide
layer is an effective but not the best means to protect against CO2 attack
4 Corrosion rates of nickel-base superalloys and ODS alloys that were able to
form AhC^-based oxide layers are the lowest of any of the materials studied in
high temperature S-CO2 environments
70
3 Thesis Objectives and Outline
This thesis contributes to one of the deliverables identified in an ongoing research
partnership between Carleton University and CanmetENERGY of NRCan involving the
design of a 100 MWe S-CO2 advanced Brayton cycle As was noted in the literature
review S-CO2 corrosion data exists only for a limited number of materials and at specific
pressure and temperature combinations - none of which are expected to be identical to
the operating conditions of the cycle that results Thus to properly fulfil this deliverable
and support the selection of suitable materials under relevant test conditions a dedicated
S-CO2 corrosion test facility is required Consequently the main objectives of this thesis
include
1 The comprehensive design and assembly of a high temperature S-CO2 corrosion
test rig from the definition of its test conditions to the layout selection and
procurement of its components
2 Commissioning this test rig through calibration trials and baseline operation to
fully understand and optimize its operation
These objectives purposely coincide with what is necessary to see the development of
such a corrosion test rig to completion In the two chapters to follow both objectives will
be discussed in greater detail
71
4 Design of the Carleton-NRCan S-CO2 Corrosion Test Rig
From the outset of its design the Carleton-NRCan S-CO2 corrosion test rig was to
offer a testing envelope that at the very least matched the pressure and temperature
capabilities established at MIT and UW-Madison While safety considerations would
ultimately influence the final design of this test rig low implementation costs and a high
level of usability were also regarded as important design criteria This section first states
the requirements of the Carleton-NRCan S-CO2 corrosion test rig and details such
fundamental components as the pressure vessel pump furnace integrated safety features
and specimen boat The rationale behind how these and other auxiliary components were
arranged to form this test rig is then elucidated
41 Design Criteria
Summarized below in bullet form are the compulsory design requirements of the
Carleton-NRCan S-CO2 corrosion test rig
bull A primary operating point of 250 MPa at 700degC with potential to test as high as
750degC but only at 150 MPa
bull The capability to sustain a continuous CO2 flowrate of at least 10 Lhr (at
standard conditions) and allow for intermittent static periods
bull Near-autonomous operation during testing
bull A pressure vessel that could readily accommodate test specimens with a
maximum cross-sectional diameter of 127 mm (05 in) and do so without
restricting flow
72
bull The use of CO2 whose purity is close to or above 999
bull A method of specimen support that itself would be unreceptive to corrosion and
relatively inert so as to not serve as a catalyst for any chemical reaction
bull The incorporation of both passive and active safety systems to protect against
and quickly remedy any inadvertent overpressurization or thermal runaway
bull All applicable components to be registered with the Technical Standards and
Safety Authority (TSSA) in Ontario as pressure-retaining devices
42 Pressure Vessel
The proposed operating conditions of this test rig removed the applicability of any
commonly available pressure vessel and demanded that one be custom designed and
fabricated from a suitable high temperature material Figure 4-1 shows maximum
allowable stress versus temperature curves of three nickel-base superalloys - IN-617
IN-625 and Haynes 230 - initially considered for the construction material of the
pressure vessel for comparison 316-SS is also included to exhibit its rapid deterioration
of mechanical properties above 550degC Despite all three candidate nickel-base
superalloys having comparable strengths above 700degC IN-625 was selected as the
pressure vessel body material because of its recent (but favourable) service experience at
MIT [3438] and UW-Madison [36] with high temperature S-C02 Much like those used
in prior S-CO2 corrosion test rigs this pressure vessel was to be tubular in shape
however an ID larger than 127 mm (05 in) suggested that round bar stock would need
to be bored through to give the minimum required wall thickness
73
225 i 1 1 1
0 -I 1 1 1 1 1 1 1 bullmdashi
0 100 200 300 400 500 600 700 800 900
Temperature (degC)
Figure 4-1 Stress-temperature curves for pressure vessel material candidates Generated with ASME data provided by Moore [83]
Initial sizing calculations were performed in accordance to the ASME
B313-2008 Process Piping standard and later verified by Moore [84] at Pressure Vessel
Engineering Ltd of Waterloo Ontario for Canadian Registration Number (CRN)
designation Given the two proposed operating conditions design points of 2941 MPa at
750degC and 1765 MPa at 800degC were chosen for the pressure vessel with its final cross-
sectional geometry based on whichever condition represented the limiting case For each
point the design pressure was equated to the burst pressure of the rupture disks
similarly design temperatures were made 50degC higher than their respective operating
temperatures - as determined from simulations conducted by Schuegraf [85] - to account
for the higher furnace set points that would be needed to offset heating losses Moreover
considering the very nature of this facility a conservative corrosion allowance of
74
635 mm (025 in) was also applied to the bore of the vessel Failure of the pressure
vessel would inevitably be dictated by its circumferential stress and thus the minimum
required wall thickness (tmjn) was calculated from
tmin = 0 + CA) (T + P
+ CA (41) [86]
where CA and omax denote the specified corrosion allowance and temperature-dependent
yield stress respectively With a fixed ID of 254 mm (10 in) an OD of 889 mm
(35 in) was found to provide an acceptable wall thickness for both operating conditions
Figure 4-2 depicts the anticipated operating pressure and the maximum internal pressure
this vessel can withstand at metal temperatures ranging from 650 to 875degC inclusively
~ s R
OH
pound s SB SB
~ a laquo s 01
bull
s HH
100
90
80
70
60
50
40
30
20
10
mdash 1 I
X
bull Primary Design Point 2941 MPa at 750degC
4 Secondary Design Point 1765 MPa at 800degC
J T | ^Vgt M a x i m u r a allowable pressure |
^ ^ v ^ ^ | Anticipated operating pressure ^S ^^ ^sltiJ
1 1
1
600 650 700 750 800
Temperature (degC)
850 900
Figure 4-2 Maximum allowable internal pressure-metal temperature curve for the pressure vessel as per the ASME B313-2008 Process Piping code
75
Both ends of the pressure vessel were sealed using 316-SS Graylocreg connectors
(CRN 0B27905) each of which consisted of three components (i) accompanying
3-GR20 blind hubs (ii) a 2-12-3 clamping assembly and (iii) a polytetrafluroethylene
(PTFE)-coated GR20 sealing ring One 3-GR20 hub was welded to either end of the
IN-625 section with its complement serving as the closure to the pressure vessel The
2-12-3 clamping assembly brought both hub faces together as it was tightened causing
the GR20 sealing ring to elastically deform and conform to the shrinking cavity between
them A schematic of this metal-to-metal sealing arrangement is illustrated in Figure 4-3
and deemed an improvement over the carbon steel bolts used by MIT to retain their seal
Before Tightening After Tightening
Figure 4-3 Graylocreg connector prior to (left) and following (right) tightening Adapted from [87]
To assist in determining an appropriate length for the IN-625 section a thermal
analysis of the entire vessel was also carried out by Moore [84] of Pressure Vessel
Engineering Ltd using Finite Element Analysis (FEA) software The intention was to
use the superior high temperature properties of IN-625 to dissipate as much heat as
possible - via free convection and radiative heat transfer mechanisms - before interfacing
76
with the 316-SS hubs As a result the overall length of the pressure vessel including the
Graylocreg connectors was 17272 mm (680 in) with 14605 mm (575 in) of that length
constituted by the IN-625 section These dimensions in addition to those pertaining to
the cross-section are summarized below in Figure 4-4 Construction radiographic
inspection of the welds and finally hydrostatic pressure testing of the vessel were all
executed by Price-Schonstrom Inc in Walkerton Ontario allowing it to be registered as
a type H fitting with TSSA (CRN 0H140405)
A
i
2X0 375 IN (9 525 mm)THRU NPT 0395 IN (10033 mm) DEEP
Figure 4-4 Working drawing of the IN-625 pressure vessel [84]
-680 IN (1727 2 mm) - 575 IN (14605 mm
ltr
77
43 Gas Booster
Sacrificing precise control over flowrate in favour of minimizing costs high
pressure CO2 was generated using an SC Hydraulic Engineering Corp GBT-1530 gas
booster rather than a syringe pump This two stage-double acting gas booster required
only compressed air and gas supply sources to operate hence the outlet parameters of
the booster were governed by its own inherent gas amplification factor and the pressures
and flow capacities of these sources Provided by the manufacturer an approximate
correlation between the compressed air (PA) and gas supply source (Ps) pressures needed
to produce a particular static outlet stall pressure (Po) was
P0 = 30 bull PA + 2 bull Ps (42) [88]
Below Po though pressure perturbations were introduced into the outlet gas flow because
of the intrinsic reciprocating action of the gas booster Methods employed to mitigate
this problem are discussed as part of the conceptual layout of the test rig in Section 47
44 Furnace
The pressure vessel was centered within a Thermcraft Inc XST-6-0-24-3V furnace
whose split-tube design facilitated the initial loading and positioning of the vessel
Three independently controlled heated zones gave this furnace a total heated chamber
length of 6096 mm (240 in) and a cumulative power output of 6800 W zones 1 2 and
3 measured 1524 mm (60 in) 3048 mm (120 in) and 1524 mm (60 in) in length
respectively Figure 4-5 identifies the location of each heated zone and its corresponding
Platinel II thermocouple Temperature set points were inputted to and regulated by a
78
Thermcraft Inc 3-1-40-230-E15SP control system however were only indicative of the
air temperatures inside the heated chamber The basis of Section 52 was therefore to
find through trial and error the necessary set points of each heated zone that would give
- with an approximately uniform distribution - the desired temperature inside the vessel
Upon its reception the control system was also reconfigured to limit the maximum set
point of any heated zone to 800degC (in agreement with the maximum design temperature
of the pressure vessel)
1 11 ImdashI
- 3 0 38 IN (771 65 mm) OVERALL-30 0 IN (762 0 mm) SHELL
24 0 IN (609 6 mm) HEATED
(1524mm)^ v (1524mm)
^ rft-P 1 1 r f c
ZONE1 ZONE 2 im
ZONE 3
M
T TT-aij -arf
PLATINELII THERMOCOUPLE
Figure 4-5 Furnace dimensions and heated zone locations
45 Integrated Safety Features
Again due to the pressures and temperatures involved in operating this corrosion
test rig the implementation of measures to safeguard the user against serious injury or
even death was indisputable The resulting safety features consisted of several
preventative (passive) and protective (active) components some of which could be
interchanged to specifically tailor to each operating condition This section elaborates on
how these safety features influenced the design of the test rig
79
451 Passive Elements
The passive safety elements ensured that the integrity of the corrosion test rig
would not be compromised even under the most unexpected of conditions A conscience
effort was made throughout the design process that involved the selection of both tubing
and valves whose pressure ratings were still above 2941 MPa (the higher of the two burst
pressures) even at temperatures they would likely never encounter For example the
635 mm (025 in) OD tubing that was used extensively throughout the test rig had a wall
thickness of 089 mm (0035 in) allowing for safe operation at prolonged exposure up to
430degC The thicker walls also had the added effect of providing for some corrosion
allowance at normal operating temperatures For an added level of assurance and to
have the test rig registered as a whole with TSSA components containing pressures
above 20477 kPa (excluding the gas booster and those part of the compressed air system)
were required to have a CRN The CRN denoted that the designs and their specified
maximum pressure rating were in fact validated by a regulatory agency
452 Active Elements
Unlike their passive counterparts the active safety elements of the test rig were
intended to relieve pressure or block all inlet flow to the gas booster These elements - a
safety relief valve (SRV) solenoid valve relay circuit and rupture disk - comprised the
redundant overpressurization protection system represented schematically in Figure 4-6
The activation pressure of each component was purposely chosen such that each was
triggered in sequence rather than simultaneously with increasing pressure and in order
80
of increasing impact on system operation Accordingly the relief pressure (PR) was set
midway between the operating (POP) and burst (PB) pressures and in turn the relay
circuit activation pressure (PRC) was set midway between the relief and burst pressures
Table 4-1 summarizes the magnitudes of each activation pressure at both specified
operating points
Solenoid Valve Relay Circuit
P -P P =P + B R
Increasing Pressure Safety Relief Valve
(SRV)
P -P Tgt - p | X B l OP rR rOP r j
Increasing Pressure
Figure 4-6 Overpressurization protection flowchart
Table 4-1 Activation pressures to remedy an overpressurization
Operating Pressure
(MPa) 2500 1500
Activation Pressure
P R PRC P B
(MPa) 2721 1632
2831 1699
2941 1765
Flowsafe Inc F84-M safety relief valves (CRN 0G104985) the first of the two
pressure relieving devices used were sized according to American Petroleum Institute
(API) Recommended Practice 520 Part I [89] Even with their different set pressures an
orifice area of 194 mm2 (0003 in2) in each 316-SS valve was found to provide sufficient
flow capacity to atmosphere Conversely the 316-SS SFAZ series rupture disks and
their attendant 304-SS FS-2U holder were purchased from ZOOK Canada Inc
(CRN 0G84835CADD1) At the recommendation of ZOOK these scored forward-
81
acting disks were produced with a 0 manufacturing range so that the proposed
operating pressures would constitute 85 of their respective burst pressures This higher
burst tolerance despite being almost 170 the cost of a standard model was specified to
ensure that the rupture disk would in fact be the last relieving device to activate
In the event that the SRV failed closed the solenoid valve relay circuit was
designed to isolate the gas booster from its supply feeds ie stop the addition of further
CO2 to the corrosion test rig To achieve this the alarm signal output of a Graphtec Corp
GL820 midi logger was connected to the control side (12 VDc) of a normally-open relay
to serve as a circuit interrupter Likewise normally-closed solenoid valves - Ascoreg
8264 CyroLC02- and 8210 General Service-series (CRN 0C122395) - were connected
in parallel on the load side (120 VAC) of this relay and to both the CO2 and air supplies
Alarm trigger conditions (discussed in Section 47) were assigned to specific input
channels of the logger and if they were exceeded forced the alarm output to act as if it
were an open circuit subsequently the relay was de-energized and both solenoids were
closed Figure 4-7 depicts the circuit diagram for this solenoid valve relay
82
opd co2 5V DC
120 VAC
bullCD CZgt
CD Ground
gtf Air
12 V DC
ltZJ
Data Logger Alarm Output
Figure 4-7 Circuit diagram of solenoid valve relay
46 Specimen Boat
Test specimens were electrically isolated from the pressure vessel and suspended
inside it using a custom-built alumina specimen boat Rather than machine this
specimen boat entirely from a solid cylindrical rod it was assembled from four
components which required little to no material removal a grooved 222 mm (0875 in)
OD tube two stepped semi-circular end caps and a 32 mm (0125 in) diameter solid
support rod This boat - fabricated by Elan Technologytrade of Midway Georgia -
measured 2667 mm (105 in) in length and used the semi-circle void in each of its ends
to encourage CO2 flow Figure 4-8 shows this specimen boat following its assembly
along with the alumina spacers that will be used to separate adjacent specimens
83
Figure 4-8 Alumina specimen boat
47 Conceptual Layout and Assembly
After much deliberation the NRCan Bells Corners complex (BCC) was chosen
over Carleton to house this S-CO2 corrosion test rig their telemetrically-monitored CO2
bulk tank comprehensive leak detection system and dedicated technicians to assist both
with assembly and routine maintenance were all influencing factors in this decision As
provided by BOC Canada Ltd CO2 within this bulk tank had a minimum guaranteed
purity of 9985 with maximum impurity levels listed in Table 4-2 The final design of
this test rig was to utilize a once-through arrangement with static testing capabilities as
opposed to being a recirculating system While a recirculating system would be most
representative of the closed cycle S-CO2 Brayton cycle excessive contaminant in either
solid or gaseous form could potentially limit the life of the gas booster Figures 4-9 and
4-10 illustrate the complete process and instrumentation diagram (PampID) and physical
arrangement of this corrosion test rig its accompanying bill of materials (BOM) is found
in Appendix A
Figure 4-9 PampID for Carleton-NRCan high temperature S-CO2 corrosion test rig 00 -1^
85
Table 4-2 Maximum impurity content of BOC Canada Ltd standard grade bulk CO2
ppm (vol)
Inerts CxHy H20 0 2 NH3 CO CxIy NOx S02 COS H2S (volatile) (non-volatile)
1000 50 32 30 25 10 10 05 05
Figure 4-10 Carleton-NRCan high temperature S-C02 corrosion test rig
Carbon dioxide was supplied to the gas booster at 159 MPa after first passing
through the Ascoreg 8264 CyroLC02 solenoid valve and a 150 um particulate filter The
use of a three-way needle valve and check valve (located at the booster outlet) also
allowed for C02 to bypass the gas booster altogether and purge the test rig at this lower
pressure Similarly compressed instrument air flowed through a Norgren Excelonreg
86
B74G filter-regulator assembly and the Ascoreg 8210 General Service solenoid valve
before entering the booster Apart from the check valve Figure 4-11 shows where each
of these components is located in relation to the GBT-1530 gas booster To simplify
control over the outlet pressure of the gas booster only the pressure of the compressed air
feed could be adjusted Furthermore it was determined from Equation 42 that given the
maximum available CO2 and compressed air pressures the stall pressure of the gas
booster was limited to approximately 2592 MPa
Upon leaving the gas booster compressed CO2 was filtered through a 70 urn
particulate filter and stored in a 316-SS 300 mL buffer tank The buffer tank was one
part of a two-stage system aimed to remove the inevitable pressure pulsations from the
CO2 its complement was a GO-Regulator PR-57 series regulator Stored energy in the
CO2 would first serve as a rudimentary dampener to smooth out these pulsations before
entering the PR-57 regulator where the CO2 would then leave at essentially constant
pressure The addition of the buffer tank kept at a slightly higher pressure than the
intended operating pressure was to prolong the life of the regulators diaphragm
GO-Regulator had also recommended that ethylene propylene be substituted for the
standard Viton seals to prevent any chance of explosive decompression with S-CO2
Moreover an Endress+Hauser Cerabar S PMP71 transmitter was used in conjunction
with the PR-57 regulator to help in regulating the CO2 to the desired test pressure
87
Figure 4-11 Inlet connections to the GBT-1530 gas booster
88
Figures 4-12 and 4-13 depict the layout of various components downstream of the
GBT-1530 gas booster both at its immediate outlet and at the inlet to the pressure
vessel As each figure clearly shows all tubing leading from the outlet of the gas booster
to the inlet of the pressure vessel was wrapped with OMEGAreg HTC heating cords and
Aeroflexreg tube insulation to keep the CO2 in a supercritical rather than liquid state the
pressure vessel in turn was supported by adjustable laboratory jack stands which were
aimed to facilitate its initial positioning and possible future removal Two needle valves
also allowed this corrosion test rig to function as a static system by completely isolating
the pressure vessel Consequently both the FlowSafe F84-M SRV and ZOOK SFAZ
rupture disk had to be located between these valves so as not to remove their protective
role when operating at static conditions Once testing commences the specimen boat
will sit inside the pressure vessel and temperature will be measured on both sides of it
using OMEGAreg KQIN thermocouple probes
As a provision to accommodate higher flowrates 61 m (20 ft) of 3175 mm
(0125 in) OD 316-SS tubing was coiled and added at the outlet of the pressure vessel to
provide additional surface area for cooling - either by free convection or by submersing
the coil in a water bath Downstream of this cooling coil a 70 urn filter removed any
particulate entrained within the CO2 before reaching the TESCOMtrade CC-series metering
valve This particulate filter was situated between one of the static isolation valves and
another three-way valve so that it could be taken out and replaced without interfering
with a corrosion test Similar to what was done upstream of the pressure vessel all
89
pertinent valves and measuring instruments were mounted onto stainless steel plating to
make controlling the test rig as efficient as possible
Upstream isolation valve
7 (jrn f i l t e r
lt FROM GAS BOOSTER
Figure 4-12 At the outlet of the GBT-1530 gas booster
90
Figure 4-13 At the inlet to the pressure vessel
Pressure drop and hence flow control was achieved using the CC-series metering
valve with both temperature and pressure measured at its outlet to monitor against
freeze-ups and indirectly quantify higher flowrates Flowrates lower than 50 Lhr at
standard conditions were read off of a Swagelok rotameter which because of the precise
control afforded by the metering valve was converted into a passive flowmeter Spent
CO2 was finally exhausted to atmosphere after first passing through a simple gas scrubber
91
configuration - two 500 mL Erlenmeyer flasks arranged in series Figure 4-14 illustrates
how the corrosion test rig was configured downstream of the pressure vessel
Type-K thermocouples were used exclusively throughout this test rig and like the
pressure transducer had their output sampled and recorded by the Graphtec GL820
logger This logger as well as the solenoid valve relay circuit and OMRON DC power
supply were all mounted inside the electrical enclosure shown in Figure 4-15 In
addition to those located inside and downstream of the pressure vessel thermocouples
were also permanently adhered to its exterior to measure metal temperature Figure 4-16
depicts the relative locations of these thermocouples along the length of the pressure
vessel - thermocouples T-4 and T-10 were fixed to both Graylocreg blind hubs T-5 and
T-9 were attached to each weld joining the blind hub to the IN-625 section T-6 was
positioned at the midpoint inside the furnace and T-7 T-8 T-9 and T-10 collectively
gave a discrete thermal profile of the pressure vessel - outside the furnace - in the axial
direction
92
Figure 4-14 Downstream of the pressure vessel
-+c
J ^
Figure 4-15 Electrical enclosure
mi
rrmdash11 ^777777 BrW
NWV1
Figure 4-16 Thermocouple locations along the length of the pressure vessel
93
As part of the solenoid valve relay circuit discussed in Section 452 seven of the
fourteen (nineteen during commissioning) analog inputs that fed into the GL820 logger
were assigned upper threshold alarm triggers Only four unique trigger conditions (one
pressure- and three temperature-related) were actually defined though leaving some
input channels to serve in a duplicate or redundant capacity the magnitudes of two of
these alarm triggers were also dependent on which operating point was selected Table
4-3 identifies the values of each of the four alarm trigger conditions and which input
94
channel(s) they applied to The first and second alarm triggers listed in Table 4-3
represent the predetermined solenoid valve relay circuit activation pressures and the
design temperatures of the pressure vessel Similarly the remaining two trigger points
were conservative maximum limits for both the process temperature of the PMP71
transmitter and the exposure temperature of the thread sealant used in the Graylocreg blind
hubs - the actual maximum temperature ratings of each were 125degC and 288degC
respectively
Table 4-3 Assigned upper threshold alarm triggers
Alarm ID
1A
2A
3 4
Applicable Channel Inputs
PMP71 pressure transmitter
Internal temperature of the pressure vessel (2 signals) Metal temperature of the IN-625 section inside the furnace
Metal temperature of the PMP71 process connection Metal temperature of the left and right Gralyocreg blind hubs
Assigned Value
2831 MPa or 1699 MPa
750degC or 800degC 100degC 250degC
A Value depends on the particular operating point chosen - 250 MPa at 700degC or 150 MPa at 750degC
5 Commissioning
95
Following its assembly functional testing of the Carleton-NRCan high temperature
S-CO2 corrosion test rig was conducted to evaluate its performance against the original
design criteria Time constraints only allowed for comprehensive thermal profiling inside
the pressure vessel to be completed at 150 MPa nevertheless two furnace set points
established at 150 MPa were used to investigate what effect operating at a higher
pressure (eg 250 MPa) would have on heating the S-CO2 This section describes what
was observed during the initial start-up of this corrosion test rig and summarizes the
results of its commissioning process
51 Initial Start-up and Modifications
To characterize the temperature distribution of S-CO2 within the pressure vessel a
custom OMEGAreg profile probe was acquired with six thermocouples incorporated into a
381 mm (180 in) portion of its overall length Figure 5-1 illustrates how this profile
probe in addition to a secondary single-point OMEGAreg KQIN probe were arranged
relative to the heated zones of the furnace the thickness of the single-point probe has
been exaggerated to differentiate between the two Starting at the leftmost edge of
zone 2 temperature was measured at successive 762 mm (30 in) intervals across its
entire length temperature was also measured at the rightmost edge of zone 3
Initial functional testing was performed at 150 MPa and with CO2 leaving the test
rig at a constant flowrate of 20 Lhr at standard conditions Temperature in each heated
zone of the furnace was also increased at a linear rate of 200degChr to a final set point of
96
600degC to lessen the thermal shock that the pressure vessel would be subjected to
Figure 5-2 shows the temperature distribution both of the pressure vessel itself and the
S-CO2 inside it once a steady state was reached Data points used to generate Figure 5-2
and likewise all figures to follow were averaged from steady state data that was sampled
every 50 s for a total duration of two hours (ie a sample size of 1440 data points)
Overall the heating process was found to be quite inefficient with fluid
temperatures averaging approximately half the value of the furnace set points
Additionally duplicate temperature measurements at the tips of each probe (T-2 and
T-13) differed by approximately 25degC with the single-point probe measuring the lower
of the two Although difficult to confirm the radial positioning of each probe tip was
most likely asymmetrical the greater unsupported length of the profile probe would have
attributed to a larger deflection under its own weight causing this thermocouple to
actually be closer to the bottom of the pressure vessel Testing was stopped though when
the original PTFE-based thread sealant used to interface with the pressure vessel began
to discolour and melt to the Graylocreg hubs
762 mm (30 in) TYP
I 18
| j | M V77YX7Mlt7 77777
zoNEi ZONE 2 ZONE 3
Figure 5-1 Location of thermocouples within the pressure vessel (hatched)
97
500
400 -
300 U o u u 3 i-
I 200
100 -
n i
Radial positioning of these thermocouples was likely different
bull Weld
lt bull Graylocreg hub
bull 1 1
bull Metal Temperature
bull Fluid Temperature i
m
w bull bullbull
^ Weld
bull Graylocreg hub 4
0 025 05 075 1 Normalized Pressure Vessel Length
Figure 5-2 Initial temperature distribution at 150 MPa for furnace set points of 600degC
Similar to what was realized by Dunlevy [38] metallic reflectors were added inside
the bore of the pressure vessel in an attempt to concentrate heat within the confines of the
furnace Molybdenum (Mo) sheeting was cut into six 1905 mm (075 in) diameter
disks and each disk was perforated with four equidistance holes about its axis to
encourage flow As shown in Figure 5-3 reflector placement was symmetric about the
centre of the furnace with the first of three reflectors positioned 635 mm (25 in) from
the outermost edge of zones 1 and 3 subsequent reflectors were spaced 254 mm (10 in)
apart from one another moving towards the ends of the furnace Furthermore high
purity nickel wire was crimped onto both probe sheaths on either side of each Mo heat
reflector to ensure they remained fixed as the vessel was pressurized Figure 5-4 depicts
98
the arrangement of Mo reflectors on the profile probe sheath prior to being inserted into
the pressure vessel Following its reassembly a metallic-based thread sealant capable of
withstanding temperatures up to 288degC was used instead on the process connections with
the pressure vessel
635 mm (25 in) TYP
254 mm (10 in) TYP 13) (14) 05) (16) ( IT) T 18)
W77 VMA77Z y(JYSYi ^ ^ v))Mvy^ M M
ZONE 1 ( 2 ZONE 2 ZONE 3
Figure 5-3 Heat reflector positioning within the pressure vessel (hatched)
Figure 5-4 Heat reflectors attached to the profile probe sheath
99
At identical conditions (150 MPa with 600degC furnace set points) to the previous
functional test Figure 5-5 illustrates a marked increase - by as much as 150degC - in
S-CO2 temperature with the addition of these heat reflectors However the effectiveness
of the heat reflectors is perhaps best exemplified by the significant temperature difference
between adjacent thermocouples positioned within (T-17) and outside of (T-18) of their
boundaries The presence of the heat reflectors would also appear to minimize the
temperature disparity between T-15 and T-17 skewing the nearly symmetric bell-shaped
distribution that was observed before slightly right of centre Moreover temperatures
measured by T-2 and T-13 should have been in closer agreement with each other as the
heat reflectors were also acting to centre both probes within the bore however unlike the
earlier test in which T-2 was roughly 25 degC cooler T-2 was now 30degC wanner When the
pressure vessel was disassembled again the single-point probe was found to have a sharp
bend along its length which could have been incurred from misalignment during its
initial insertion Similarly Figure 5-6 depicts the change in metal temperature following
the addition of the heat reflectors As the causal effect of the increased fluid temperatures
observed in Figure 5-5 metal temperature within the furnace experienced the most
pronounced change - an increase of approximately 85degC While not as noteworthy the
heat reflectors also served some purpose in keeping the Graylocreg hubs cooler
Since the alumina specimen boat can only accommodate metal coupons in
2286 mm (90 in) of its overall length temperature need only be held constant over an
equivalent length inside the pressure vessel For each thermal profile conducted
hereafter furnace set points were adjusted to give an approximately uniform temperature
100
distribution across T-14 to T-17 inclusively Thus when the specimen boat is to be
inserted into the pressure vessel it will be centred 381 mm (15 in) to the right of the
midpoint of the furnace
O o
i-= s laquo u a
amp
T-2 M
4 T-2 bull
-500-
400mdash
300-
200-
100-
-0-
- i r~
^ ( 1 1
Significant decrease in S-C02
temperature outside the heat reflectors
bull Prior to Adding Heat Reflectors
bull Following the Addition of Heat Reflectors
-200 -150 -100 -50 0 50 100 150 200 250 300 350
Distance from Centre of Furnace (mm)
Figure 5-5 Effectiveness of the heat reflectors on raising fluid temperature at 150 MPa for furnace set points of 600degC
100
75
101
u o o S -
s laquo s -ltu a E
50
25
025 05 075
-25 Normalized Pressure Vessel Length
Figure 5-6 Change in metal temperature following the addition of the heat reflectors at 150 MPa for furnace set points of 600degC
52 Thermal Profiling at 150 MPa
Two separate profiling trials were carried out at 150 MPa to first establish furnace
set points that would give uniform temperature distributions at 550 600 650 and 700degC
(ie temperatures that could serve as the TIT for the S-CO2 Brayton cycle) and then
using the same series of set points to confirm the repeatability of the initial results This
validation trial was also used to refine the original furnace set points if needed and
further reduce the maximum temperature difference over the defined heated length
Similarly the highest possible S-CO2 temperature that would allow for a uniform
102
distribution was also determined however the furnace set points required to achieve this
were not validated like those at lower temperatures and were ultimately limited to the
design temperature (800degC) of the pressure vessel While this section focuses solely on
the internal temperature distribution of the pressure vessel specifically over the
2286 mm (90 in) length spanning between T-14 and T-17 complete thermal profiles (at
the aforementioned temperatures) are made available in Appendix B
Furnace set points that would produce the desired fluid temperatures were
determined by progressively increasing their values and monitoring what effect this had
on the overall temperature distribution within the pressure vessel Temperature was
increased at a linear rate of 200degChr regardless of the magnitude of the temperature rise
but only once pressure had stabilized at 150 MPa To allow the S-CO2 time to properly
acclimatize itself to any increase in temperature two hours - if the temperature increase
was equal to or greater than 15degC - had to have elapsed before the next change to a
specific furnace set point could be made temperature increases less than 15degC were only
given an hour Table 5-1 details the succession of furnace set points beginning at a
universal starting point of 580degC and clearly identifies the final set points needed to attain
each of the four internal temperatures As the overall temperature was increased the
difference between zone 1 and 3 set points (needed to counteract forced convection) was
found to decrease most likely as the effects of radiation heat transfer became more
significant From the outset of thermal profiling the following convention was also
adopted to summarize the set points of each heated zone in the furnace
[ZONE 1 I ZONE 2 | ZONE 3] (51)
Table 5-1 Heated zone set points to give uniform temperature distributions
Desired S-C02
Temperature
550degC
600degC
650degC
700degC
Heated Zone Set Point
1 2 3
CO 580
620
650
665
680
680
690
695
695
710
720
725
725
740
750
750
750
765 775 780 780 785 785 785
580
620
620
620
620
620
620
620
645
650
650
650
675
675
685
690
715
725 735 735 735 735 735 735
580
620
620
620
635
650
650
655
680
690
700
700
725
725
725
725
750
750 755 760 765 765 770 775
104
U o V s -3
bull bull
eS i a pound
i X i
i lt i I I E 1 1 I
4 i bull
n [bull] i i i i i i
_ J _ _ i l
4
l)J^ bull
u j i r i f c -i
crf a u u u mm
550-^h
5 0 0 -
4 5 0 - 1
X
Jk
gt - -
i 1
i
X 1 1
1 1 I t
bull 1
1
1 1
1 1
1 1
-200 -150 -100 -50 0 50 100 150 200
Distance from Centre of Furnace (mm)
bull [695degC | 620degC | 655degC] bull [725degC | 650degC | 700degC]
A[750degC | 690degC | 725degC] X[785degC | 735degC | 775degC]
Figure 5-7 Temperature distributions for 550 600 650 and 700degC using the established furnace set points
Figure 5-7 shows the expected temperature distributions over the usable length of
the specimen boat at 550 600 650 and 700degC Of these four temperatures the average
maximum temperature deviation between the respective peak and the lesser of the two
ends was approximately 147degC or 236 of the peak temperature Results of the
validation trial are plotted in Figures 5-8 through 5-11 and generally show less variation
with the original data set at higher temperatures However for each case uniformity of
temperature across the 2286 mm (90 in) length was marginally improved Table 5-2
summarizes the furnace set points and thermocouple readings that were used to generate
these plots as well as the maximum temperature differences that were observed
105
At both 550 and 600degC Figures 5-8 and 5-9 illustrate that specific furnace set
points actually had to be reduced by as much as 15degC to replicate the same temperature
distribution as before a small discrepancy in flowrate between the two trials was likely
the cause Although flowrate was visually confirmed to be 20 Lhr at standard
conditions for each trial a more accurate means of flow measurement (ie a coriolis
flowmeter) than what is currently in place would have substantiated this claim These
discrepancies in flowrate are less influential on heat transfer to the S-CO2 above 650degC
as the radiative heat transfer mechanism becomes more dominant Figures 5-10 and 5-11
show that the temperatures obtained as part of the validation trial were nearly identical to
those first measured in establishing furnace set points for 650 and 700degC In an effort to
flatten these initial temperature distributions even more individual furnace set points
were increased by 5degC and the maximum temperature difference at both 650 and 700degC
was reduced by roughly 05degC Overall the average maximum temperature difference
resulting from the validation trial was 131degC or 209 of the peak temperature
consequently it was decided that the slightly modified furnace set points obtained from
this trial would replace their original counterparts
u o i-
s s -
S
m
1
bull
-100 -50
560-
5 5 5 -
550
545
540-
535
530-
150 0 50 100
Distance from Centre of Furnace (mm)
bull [695degC | 625degC | 655degC] Initial Run B[6850C | 610degC | 645degC] Validation Run
200
Figure 5-8 Validation of the furnace set points to give 550degC at 150 MPa
U o
u
a E
E2
bull100
-605-
-600
-595
-590-4
-585
-580
t
-50 0 50 100
Distance from Centre of Furnace (mm)
150 200
bull [725degC | 650degC | 700degC] Initial Run l[725degC | 640degC | 690degC] Validation Run
Figure 5-9 Validation of the furnace set points to give 600degC at 150 MPa
-655-
U o
s-S
i-
P E
-65a-
-645
-640
-635 - -
630-
bull100 -50 0 50 100 150 200
Distance from Centre of Furnace (mm)
bull [750degC | 690degC | 725degC] Initial Run B[755degC | 695degC | 725degC] Validation Run
Figure 5-10 Validation of the furnace set points to give 650degC at 150 MPa
U o O) s -
s u
m
705-
700 - raquo -
695
690
685
680- 1 1 1
-100 -50 0 50 100 150
Distance from Centre of Furnace (mm)
bull [785degC | 735degC | 775degC] Initial Run bull [785degC | 735degC | 780degC] Validation Run
200
Figure 5-11 Validation of the furnace set points to give 700degC at 150 MPa
108
Table 5-2 Summary of the thermal profiling trials conducted at 150 MPa
Heated Zone Set Point
1 2 3
(degC) 695
685
725
725
750
755
785
785
800
620
610
650
640
690
695
735
735
750
655
645
700
690
725
725
775
780
800
Thermocouple Reading
T-14 T-15 T-16 T-17
(degC) 5366
5472
5827
5909
6363
6378
6857
6875 j
7082
5499
5591
5995
6020
6499
6500
6998
7003
7215
5457
5535
5970
5962
6444
6437
6939
6941
7155
5373
5467
5881
5897
6357
6362
6854
6865J
7082
AVERAGE
ATMAX
(degC) 133
123
168
123
142
138
144
138
133
138
ATMAX
TMAX
() 242
221
279
204
218
213
206
198
184
218
As an exploratory exercise the furnace set points of zones 1 and 3 were set to the
design temperature of the pressure vessel at 150 MPa (800degC) and zone 2 was adjusted
until a uniform temperature distribution was achieved Thus at [800degC | 750degC | 800degC]
Figure 5-12 shows that S-CO2 could be heated to approximately 721degC - only 29degC less
than the envisioned maximum testing capability of this facility - and maintained to
within 133degC over the usable length of the specimen boat Achieving a uniform fluid
temperature of 750degC is certainly plausible especially since the metal temperature at the
midpoint of the furnace was 7656degC However a greater number of thermocouples - as
a minimum one in each heated zone of the furnace - should be mounted to the pressure
vessel to ensure its safe operation as the set points are increased beyond 800degC In the
meantime a more optimal placement or greater number of heat reflectors within the bore
of the pressure vessel should be investigated to increase fluid temperature
109
U o
s-w a E
bull
-100 -50
725-
720-
715-
710-
705-
700- mdash i mdash
50 0 50 100 150
Distance from Centre of Furnace (mm)
200
Figure 5-12 Temperature distribution using furnace set points of [800degC | 750degC | 800degC] at 150 MPa
Although not shown explicitly in any of the previous plots the standard error
associated with each thermocouple is plusmn075 of its measured value at 7215degC (the
largest recorded temperature) this amounts to plusmn54degC Additionally fluctuations in
pressure at 150 MPa are largely attributed to the duty cycle of the furnace and can be
controlled to approximately plusmn02 MPa not including the maximum plusmn002 MPa reference
accuracy of the transmitter Figure 5-13 shows a representative sampling of pressure
over a 10 hour window at 650degC with the average maximum and minimum recorded
pressures being 1497 MPa 1516 MPa and 1482 MPa respectively For the same 10
hour window Figure 5-14 illustrates the variation in both fluid temperature across zone 2
(T-2 T-13 through T-17) and metal temperature inside the furnace boundary (T-6)
110
0gt i -S se
200
190
180 +
170
160 --
150
140
130
120 --
110
100
raquomraquomdashnraquomdash mmmmmtmmi M M M M M mmmmmdmmm
PAVG 1497 MPa PMAX 1516 MPa
PMIN 1482 MPa
0 2 4 6 8
Time (hr)
Figure 5-13 Pressure variations at 150 MPa over a 10 hour period at 650degC
10
725
700
U o
675 --
650
g 625 E
H 600
5 7 5 -bull
550
T-6
T-15 T-16 T-17 T-14
4gt
(J) T-2 T-13 W 14) (15) fl6 ~ltyen =F=FH
ZONE 1 ( 2
0 8 2 4 6
Time (hr)
Figure 5-14 Temperature variations at 650degC over a 10 hour period at 150 MPa
10
I l l
53 Pressure Effects on Performance
Two additional thermal profiling trials were performed for 550 and 600degC but at
250 MPa to assess what effect operating at a higher pressure would have on the heating
characteristics of this corrosion test rig Intuitively an increase in pressure and hence an
increase in density should result in a lower fluid temperature for fixed furnace set points
just how much lower was unknown As density increases conductive heat transfer
becomes more efficient [90] through the S-CO2 and heat loss through the walls of the
pressure vessel is expected to be greater Figure 5-15 in fact confirms this assumption
illustrating an increase in metal temperature outside the furnace for furnace set points of
[685degC I 610degC I 645degC] and [725degC | 640degC | 690degC] Accordingly Figures 5-16 and
5-17 both show an approximate 40degC reduction in fluid temperature at 250 MPa
Only after this pressure investigation was completed was it realized that the using
the same normalized flowrate at both pressures (20 Lhr) would have produced fluid
velocities at 250 MPa that were approximately half of what they were at 150 MPa
However the improved conduction mechanism at 250 MPa seems to have a more
pronounced effect on temperature distribution than velocity shifting the entire profile to
the right ie the maximum temperature is observed at T-16 rather than T-15 Despite
this noted shift in the S-CO2 temperature distribution Figure 5-18 suggests that the
thermal time constant of this test rig is independent of its operating pressure Increasing
at a linear rate of 200degChr from room temperature to furnace set points of
[685degC I 610degC I 645degC] the time needed for T-15 to reach a steady state is nearly
identical at both 150 and 250 MPa
112
U o w u a V s -
o -=s -^ os s -
Q
E
50
40 -bull
30
20
10
-10 --
-20
II
0 0
bull [685degC | 610degC | 645degC] Set Point
bull [725degC | 640degC | 690degC] Set Point
bull
1
bull i
1 1
25 05 075 i i
f i
Normalized Pressure Vessel Length
Figure 5-15 Differences in metal temperature at 250 MPa from 150 MPa for equivalent furnace set points
U o Qi i-S ca s-o
a
bull -100
bull560-
550
540-
530
520-
510-
500
490 H
480
bull 150 MPa
bull 250 MPa
-50 0 50 100
Distance from Centre of Furnace (mm)
150 200
Figure 5-16 Temperature distributions using fixed furnace set points of [685degC | 610degC | 645degC] at 150 and 250 MPa
113
U o ltu s -S laquo V D pound
bull100
-610-
-600 J
-590-
-580-
-570-
-560-
-550-
-540 H
-530
-520
bull 15 0MPa
bull 250 MPa
-50 0 50 100
Distance from Centre of Furnace (mm)
150 200
Figure 5-17 Temperature distributions using fixed furnace set points of [725degC | 640degC | 690degC] at 150 and 250 MPa
600
500
degi 400 u
1 300 u V Q
I 200
100 -
150 MPa^^- I -
A ^ i ^ 2 5 0 MPa
1
Time (hr)
Figure 5-18 Thermal response of T-15 from room temperature to fixed furnace set points of [685degC | 610degC | 645degC] at 150 and 250 MPa
114
6 Summary and Conclusions
Representing the first facility of its kind in Canada the Carleton-NRCan S-CO2
corrosion test rig was developed to satisfy two anticipated operating points (i) 700degC at
250 MPa or (ii) 750degC at 150 MPa These operating points and the ability to
accommodate test specimens measuring 127 mm (05 in) in diameter give the Carleton-
NRCan facility testing capabilities comparable to those at MIT and UW-Madison using a
relatively modest budget On a global scale the Carleton-NRCan corrosion test rig will
undoubtedly contribute to the growing demand to evaluate the corrosion behaviour of
various structural materials in high temperature S-CO2 A better understanding of such
corrosion mechanisms will assist in selecting or potentially developing alloys that will
offer long-term reliability to the S-CO2 Brayton cycle The major conclusions that
resulted from this thesis include
1 The initial start-up of this test rig revealed the fluid temperature within the
confines of the furnace to be approximately half that of the furnace set points
Consequently the heating efficiency of the furnace was improved by adding
three equally-spaced molybdenum heat reflectors on opposite sides of the
furnace but inside the bore of the pressure vessel to mitigate the heat loss along
its length
2 Furnace set points that would yield a near-uniform temperature distribution
across the usable length of the specimen boat were established and validated at
150 MPa for 550 600 650 and 700degC similarly limiting the maximum of any
of furnace set points to 800degC (the design temperature of the pressure vessel) a
115
uniform temperature was 721degC was attained Of the nine trials conducted at
150 MPa temperature and pressure variations could be controlled to within 123
to 168degC and plusmn02 MPa respectively once a steady state had been reached
3 Preliminary functional testing at 250 MPa indicated an approximate 40degC
decrease in average S-CO2 temperature from 150 MPa for equivalent furnace
set points
61 Future Work
Given that this corrosion test rig is now operational commissioning needs to be
completed at 250 MPa to ascertain what maximum S-CO2 temperature can be uniformly
achieved within the pressure vessel Once this maximum temperature is defined furnace
set points that will give uniform distributions at lower temperatures - presumably 500
550 600 and 650degC - will need to be determined and validated as was done at
150 MPa Likewise the commissioning envelope can be further expanded to include
100 MPa and 200 MPa this will ultimately provide a catalogue of furnace set points to
use for any conceivable combination of test conditions
A thorough investigation should also be carried out to confirm if the current
placement and number of heat reflectors inside the bore of the pressure vessel is indeed
the optimal arrangement Affixing the heat reflectors to the sheaths of each thermocouple
probe was found to have the unwanted effect of shifting the maximum temperature inside
the pressure vessel slightly right of its centre One option to remedy this effect would be
to provide a fluid path into and out of the pressure vessel that is not directly influenced by
116
the presence of the heat reflectors The 316-SS tubing that surrounds each thermocouple
probe prior to interfacing with the pressure vessel could be extended inside the pressure
vessel and the heat reflectors attached to this tubing instead Another option to increase
the heating efficiency of the furnace is to wrap the surface of the pressure vessel -
immediately at its boundary with the furnace - with insulation This would undoubtedly
require that another detailed FEA be performed to verify that (i) sufficient length of the
IN-625 is still exposed to dissipate heat and (ii) thermal stresses are not too severe
Ideally the commissioning process would have been conducted with the specimen
boat in-situ to give the most representative conditions of an actual corrosion test
However excess weld slag from joining the Graylocreg hubs to the IN-625 section
prevented the specimen boat from actually being inserted into the pressure vessel This
problem needs to be addressed and resolved before a more detailed thermal
characterization can be executed but most importantly before corrosion testing can
begin Price-Schonstrom Inc has indicated that this work will be done at their expense
but leaves the test rig inoperable while it is carried out Once this work is completed
though a preliminary corrosion test at 650degC and 150 MPa for 500 hours will be
initiated five stainless steels - 15-5 17-7 316-SS 416-SS and 420-SS - and one nickel-
base superalloy - IN-738LC - have been acquired for this very purpose
Corrosion testing that will inevitably result from this facility should distinguish
what effect pressure has on the corrosion response of suitable construction materials -
nickel-base superalloys - in S-CO2 even more so than what was done by Dunlevy [38]
The corrosion mechanism of these same materials should also be investigated at several
117
temperatures to determine what if any effect the dissociation of CO2 to CO above 700degC
will have on the corrosion rate Lastly each corrosion trial that is performed should be
done so at durations (ie 3000 hours) that will either confirm or refute the long-term
stability of the various oxide layers However to successfully achieve all of the
abovementioned would require several test rigs to be operated concurrently or a
compromise be made between the number of test points evaluated and the duration of
each test
118
References
[I] International Energy Agency World Energy Outlook R Priddle Ed Paris France 2009
[2] T Yokoyama Japanese RampD on CO2 Capture in Proc of the 6th International Conference of Greenhouse Gas Control Technologies vol I Kyoto Japan 1-4 Oct 2002 pp 13-18
[3] A Technology Roadmap for Generation IV Nuclear Energy Systems US DOE Nuclear Energy Research Advisory Committee and the Generation-IV International Forum GIF-002-00 Dec 2002
[4] GIF RampD Outlook for Generation IV Nuclear Energy Systems Generation IV International Forum Aug 2009
[5] J Lillington The Future of Nuclear Power Oxford UK Elsevier Ltd 2004
[6] V Dostal A Supercritical Carbon Dioxide Cycle for Next Generation Nuclear Reactors Massachusetts Institute of Technology Cambridge MA PhD dissertation Jan 2004
[7] T Schulenberg H Wider MA Fiitterer Electricity Production in Nuclear Power Plants - Rankine vs Brayton Cycles in ANSENS International Winter Meeting (GLOBAL 2003) New Orleans LA 16-20 Nov 2003
[8] Y Kato T Nitawaki Y Muto Medium Temperature Carbon Dioxide Gas Turbine Reactor Nuclear Engineering and Design vol 230 no 1-3 pp 195-207 2004
[9] ML Corradini Transport Phenomena in Supercritical Fluids in GENIV Reactor Designs in Proc of the 12th International Meeting on Nuclear Reactor Thermal Hydraulics (NURETH-12) Pittsburgh PA 30 Sept-4 Oct 2007
[10] A Moisseytsev JJ Sienicki Extension of the Supercritical Carbon Dioxide Brayton Cycle for Application to the Very High Temperature Reactor in Proc of the International Congress on Advances in Nuclear Power Plants (ICAPP 10) San Diego CA 13-17 June 2010
[II] CH Oh et al Development of a Supercritical Carbon Dioxide Brayton Cycle Improving VHTR Efficiency and Testing Material Compatibility Idaho National Laboratory Idaho Falls ID INLEXT-06-01271 Mar 2006
119
[12] CS Turchi Supercritical CO2 for Application in Concentrating Solar Power Systems in Proc of Supercritical CO2 Power Cycle Symp 2009 Troy NY 29-30 Apr 2009
[13] DJ Chapman DA Arias An Assessment of the Supercritical Carbon Dioxide Cycle for Use in Solar Parabolic Trough Power Plant in Proc of Supercritical C02 Power Cycle Symp 2009 Troy NY 29-30 Apr 2009
[14] GA Johnson M McDowell Issues Associated with Coupling Supercritical CO2 Power Cycles to Nuclear Solar and Fossil Fuel Heat Sources in Proc of Supercritical C02 Power Cycle Symp Troy NY 29-30 Apr 2009
[15] National Institute of Standards and Technology (NIST) (2010 Sept) Carbon Dioxide Gas Phase Thermochemistry Data [Online] httpwebbooknistgovcgi cbookcgiID=C 1243 89ampUnits=SIampMask=4Thermo-Phase
[16] MA Jacobs Measurement and Modeling of Thermodynamic Properties for the Processing of Polymers in Supercritical Fluids Technische Universiteit Eindhoven Eindhoven Netherlands PhD dissertation Sept 2004
[17] National Institute of Standards and Technology (NIST) (2010 September) Helium Gas Phase Thermochemistry Data [Online] httpwebbooknistgovcgi cbookcgiID=C7440597ampUnits-SIampMask=4Thermo-Phase
[18] V Dostal P Hejzlar MJ Driscoll High-Performance Supercritical Carbon Dioxide Cycle for Next-Generation Nuclear Reactors Nuclear Technology vol 154 no 3 pp 265-282 June 2006
[19] V Dostal P Hejzlar MJ Driscoll The Supercritical Carbon Dioxide Power Cycle Comparison to Other Advanced Cycles Nuclear Technology vol 154 no 3 pp 283-301 June 2006
[20] J Sarkar Second Law Analysis of Supercritical CO2 Recompression Cycle Energy vol 34 no 10 pp 1172-1178 September 2009
[21] J Ashcroft K Kimball M Corcoran Overview of Naval Reactors Program Development of the Supercritical Carbon Dioxide Brayton System in Supercritical COz Power Cycle Symposium 2009 Troy NY USA 2009
[22] V Dostal M Kulhanek Research on the Supercritical Carbon Dioxide Cycles in the Czech Republic in Supercritical CO2 Power Cycle Symposium 2009 Troy NY USA 2009
120
[23] FW Schremp GR Roberson Effect of Supercritical Carbon Dioxide (CO2) on Construction Materials Society of Petroleum Engineers Journal vol 15 no 3 pp 227-233 June 1975
[24] EM Russick et al Corrosive Effects of Supercritical Carbon Dioxide and Cosolvents on Metals The Journal of Supercritical Fluids vol 9 no 1 pp 43-50 Mar 1996
[25] WA Propp et al Corrosion in Supercritical Fluids Idaho National Laboratory Idaho Falls ID INEL-960180 May 1996
[26] C Tyzack HC Cowen The Corrosion of Reactor Materials in Carbon Dioxide Atomic Energy Review vol 14 no 2 pp 263-324 1976
[27] RA Brierley Studies of the Oxidation of 9 and 12 Cr Steels in High Temperature High Pressure CO2 in Proc of the British Nuclear Energy Society International Conference at Reading University Berkshire UK 23-24 Sept 1974 pp 165-179
[28] PC Rowlands et al Oxidation of 9 Cr Steels in High Pressure High Temperature CO2 in Proc of the British Nuclear Energy Society International Conference at Reading University Berkshire UK 23-24 Sept 1974 pp 193-207
[29] PL Harrison et al The Oxidation of 9Cr IMo Steels in Carbon Dioxide - A Discussion of Possible Mechanisms in Proc of the British Nuclear Energy Society International Conference at Reading University Berkshire UK 23-24 Sept 1974 pp 220-233
[30] MGC Cox B McEnaney VD Scott Structure and Growth of Oxide on Iron-Chromium Alloys in Proc of the British Nuclear Energy Society International Conference at Reading University Berkshire UK 23-24 Sept 1974 pp 247-256
[31] PL Surman et a l Methods of Controlling the Oxidation of 9CrlMo Steel in High Temperature CO2 in Proc of the British Nuclear Energy Society International Conference at Reading University Berkshire UK 23-24 Sept 1974 pp257-271
[32] JCP Garrett et al Some Factors in the Oxidation of Austenitic Stainless Steels in Proc of the British Nuclear Energy Society International Conference at Reading University Berkshire UK 23-24 Sept 1974 pp 298-310
121
[33] T Furukawa Y Inagaki M Aritomi Corrosion Behaviour of FBR Structural Materials in High Temperature Supercritical Carbon Dioxide Journal of Power and Energy Systems vol 4 no 1 pp 252-261 2010
[34] JP Gibbs Corrosion of Various Engineering Alloys in Supercritical Carbon Dioxide Massachusetts Institute of Technology Cambridge MA MS Thesis June 2010
[35] JY Lim et al Corrosion of Materials in Supercritical Carbon Dioxide Environments in Proc of NACE International Corrosion 2008 New Orleans LA 16-20 Mar 2008
[36] K Sridharan et al Corrosion of Candidate Alloys in Supercritical Carbon Dioxide in Proc of Supercritical CO2 Power Cycle Symp Troy NY 29-30 Apr 2009
[37] F Rouillard F Charton G Moine Corrosion Behaviour of Different Metallic Materials in Supercritical CO2 at 550degC and 250 bars in Proc of Supercritical C02 Power Cycle Symp Troy NY 29-30 Apr 2009
[38] MW Dunlevy An Exploration of the Effect of Temperature on Different Alloys in a Supercritical Carbon Dioxide Environment Massachusetts Institute of Technology Cambridge MA MS Thesis Sept 2009
[39] M Donachie Jr S Donachie Superalloys A Technical Guide 2nd ed Materials Park OH ASM International 2002
[40] RC Reed The Superalloys Fundamentals and Applications New York NY USA Cambridge University Press 2006
[41] CT Sims NS Stoloff WC Hagel Superalloys II New York NY USA Wiley-Interscience 1987
[42] M Durand-Charre The Microstructure of Superalloys Amsterdam The Netherlands Gordon and Breach Science Publishers 1997
[43] TM Pollock S Tin Nickel-Based Superalloys for Advanced Turbine Engines Chemistry Microstructure and Properties Journal of Propulsion and Power vol 22 no 2 pp 361-374 March-April 2006
[44] JR Davis Nickel Cobalt and Their Alloys Materials Park OH ASM International 2000
122
[45] GY Lai High-Temperature Corrosion and Materials Applications Materials Park OH ASM International 2007
[46] TJA Richardson Ed Shreirs Corrosion 4th ed Oxford UK Elsevier Ltd 2010 vol I
[47] N Birks GH Meier FS Pettit Introduction to the High-Temperature Oxidation of Metals 2nd ed Cambridge UK Cambridge University Press 2006
[48] P Kofstad High Temperature Corrosion London and New York Elsevier Applied Science Publishers Ltd 1988
[49] O Toft S0rensen Ed Nonstoichiometric Oxides London UK Academic Press Inc 1981
[50] R Prescott MJ Graham The Formation of Aluminium Oxide Scales on High-Temperature Alloys Oxidation of Metals vol 38 no 34 pp 233-254 1992
[51] GB Gibbs RE Pendlebury MR Wootton Protective and Breakaway Oxidation of Mild Steel in CO2 in Proc of the British Nuclear Energy Society International Conference at Reading University Berkshire UK 23-24 Sept 1974 pp 59-72
[52] AM Pritchard et al Some Investigations into the Mechanism of Breakaway Oxidation of Three Mild Steels in High Pressure C0 2 at 500degC in Proc of the British Nuclear Energy Society International Conference at Reading University Berkshire UK 23-24 Sept 1974 pp 73-84
[53] DJ Young High Temperature Oxidation and Corrosion of Metals Oxford UK Elsevier Ltd 2008
[54] HJ Grabke I Wolf Carburization and Oxidation Materials Science and Engineering vol 87 pp 23-33 Mar 1987
[55] M Schutze HJ Grabke Ed Corrosion by Carbon and Nitrogen - Metal Dusting Carburization and Nitridation Cambridge UK Woodland Publishing Ltd 2007
[56] P Szakalos M Lundberg R Pettersson Metal Dusting on an Alumina-forming Ni-base Alloy Corrosion Science vol 48 no 7 pp 1679-1695 July 2006
[57] SR Shatynski The Thermochemistry of Transition Metal Carbides Oxidation of Metals vol 13 no 2 pp 105-118 Apr 1979
123
[58] D Farkas Corrosion of Nickel-Base Superalloys in Simultaneous Carburizing and Oxidizing Environments in Proc of Materials in Nuclear Energy Huntsville ON 29 Sept-2 Oct 1982 pp 227-233
[59] M Shindo H Nakajima Effects of Carburization and Aging on the Tensile Properties of an Experimental Ni-Cr-W Superalloy Journal of Nuclear Materials vol 144 no 1-2 pp 20-28 Jan 1987
[60] J Zhang DJ Young Kinetics and Mechanisms of Nickel Metal Dusting I Kinetics and Morphology Corrosion Science vol 49 no 3 pp 1496-1512 Mar 2007
[61] GW Stachowiak AW Batchelor Engineering Tribology Oxford UK Elsevier Ltd 2005
[62] AW Batchelor LN Lam M Chandrasekaran Materials Degradation and its Control by Surface Engineering 2nd ed London UK Imperial College Press 2002
[63] I Kleis P Kulu Solid Particle Erosion Occurrence Prediction and Control London UK Springer Ltd 2008
[64] DM Rishel FS Pettit N Birks Some Principal Mechanisms in the Simultaneous Erosion and Corrosion Attack of Metals at High Temperatures Materials Science and Engineering vol 143 no 1-2 pp 197-211 Sept 1991
[65] R Baboian Ed Corrosion Tests and Standards Application and Interpretation 2nd ed West Conshohocken PA ASTM International 2005
[66] DB Meadowcroft HJ Grabke Ed Guidelines for Methods of Testing and Research in High Temperature Corrosion London UK The Institute of Materials 1995
[67] JR Nicholls Laboratory Studies of Erosion-Corrosion Processes Under Oxidising and OxidisingSulphidising Conditions Materials at High Temperatures vol 14 no 3 pp 289-306 1997
[68] N Hayashi et al Development of a New Testing Method by Centrifugal Erosion Tester at Elevated Temperature Wear vol 258 no 1-4 pp 443-457 Jan 2005
[69] FH Stott et al The Erosion-Corrosion of Alloys Under Oxidizing-Sulphidizing Conditions at High Temperature Wear vol 186-187 no 1 pp 291-298 July 1995
124
[70] AV Levy Solid Particle Erosion and Erosion-Corrosion of Materials Materials Park OH ASM International 1995
[71] WF Adler Erosion Prevention and Useful Application Baltimore MD ASTM 1979
[72] AV Levy J Yan J Patterson Elevated Temperature Erosion of Steels Wear vol 108 no 1 pp 43-60 Mar 1986
[73] R Flitney Seals and Sealing Handbook 5th ed Oxford UK Elsevier Ltd 2007
[74] R Viswanathan Boiler Materials for USC Plant in 17th Annual NETL Conf on Fossil Energy Materials 22-24 Apr 2003
[75] Y Kato Overview of Supercritical CO2 Cycle Studies at TokyoTech in Proc of MIT-TokyoTech Symp on Innovative Nuclear Energy Systems Cambridge MA 2-4 Nov 2005
[76] P Hejzlar et al Supercritical CO2 Brayton Cycle for Medium Power Applications Massachusetts Institute of Technology Cambridge MA MIT-ANP-PR-117 July 2007
[77] INL Portal (Dec 2010) Fiscal Year 2010 Nuclear Energy University Program Research and Development Awards [Online] httpsinlportalinlgovportal serverptgatewayPTARGS_0_2_61553_0_0_1810-872_Sridharan_lmp_5-6-10pdf
[78] F Rouillard Private communication Mar 2011
[79] TJA Richardson Ed Shreirs Corrosion 4th ed Oxford UK Elsevier Ltd 2010 vol II
[80] BA Sexton RStC Smart DJ OConnor Ed Surface Analysis Methods in Materials Science 2nd ed Heidelberg Germany Springer 2003
[81] JE Antill JB Warburton Oxidation of Nickel by Carbon Dioxide Journal of the Electrochemical Society vol 114 no 12 pp 1215-1221 Dec 1967
[82] US DOE (Mar 2011) Oxide Dispersion-Strengthened Alloys - Fossil Energy [Online] httpfossilenergygovinteraationalPublicationsDECC_task_08_US_2pagepdf
[83] C Moore Private Communication Mar 2011
125
[84] C Moore PVECalc-3786 unpublished
[85] A Schuegraf Preliminary Heating Characteristics of IN-625 Pressure Vessel unpublished
[86] JR Farr MH Jawad Guidebook for the Design ofASME Section VIII Pressure Vessels 2nd ed New York NY ASME Press 2001
[87] (Mar 2011) Oceaneering - Graylocreg Products [Online] http wwwoceaneeringcomoceandocumentsbrochuressubseaproductsGRLC20-20The20Ultimate20Connectorpdf
[88] SC Hydraulic Engineering Corporation (Mar 2010) GB Gas Boosters and Systems - Rev 10-15-06 [Online] httpwwwschydrauliccomdocuments GasBoosterREVl 0-15-06pdf
[89] American Petroleum Institute Sizing Selection and Installation of Pressure-Relieving Devices in Refineries Part I Washington DC API Publishing Services Jan 2000
[90] JP Holman Heat Transfer 9th ed New York NY McGraw-Hill 2002
APPENDIX A Bill of Materials
ID
V-l
V-2
V-3
U-l
V-4
FR-l
V-5
BP-1
V-6
U-2 U-3
PV-1
R-l
V-7 V-9
V-8
BD-1
F-l
PV-2
V-10
V-l l
V-12
COMPONENT DESCRIPTION
14 in tube fitting ball valve
18 in NPT normally-closed solenoid valve
14 in tube fitting three-way ball valve
Tee-type 150 urn particulate filter
12 in FNPT ball valve
34 in FNPT filter-regulator
34 in NPT normally-closed solenoid valve
Double acting two-stage gas booster pump
14 in check valve 10 psig cracking pressure
Tee-type 70 um particulate filter
14 in FNPT 300 mL sample cylinder
0 to 4000 psig SS regulator 14 in MNPT ports
14 in tube fitting high-pressure ball valve
F84-M safety valve 2370 psig set pressure
F84-M safety valve 3590 psig set pressure
34 in FNPT SFAZ-UT burst disk holder
12 in SFAZ-002 rupture disk 2560 psig burst pressure
12 in SFAZ-002 rupture disk 4266 psig burst pressure
Three-zone 1100degC split tube furnace
Three-zone furnace controller
10 in ID X 125 in wall IN-625 pressure vessel
316-SS machined blind hub
316-SS Graylocreg clamp assembly
17-4 PHSS sealing ring
14 in tube fitting X 14 in tube fitting X 14 in FNPT three-way high-pressure ball valve
18 in NPT metering valve 000005 max C v
14 in FNPT variable area flowmeter 05 to 50 std Lhr
PART NO
SS-43S4
8264G009
SS-43GXS4
SS-4TF-15
465499
B74G-6AK-QD3-RMG-FR
8210G95
GBT-1530
SS-CHS4-10
SS-4TF-7
316L-50DF4-300-PD
PR57-1F11Q2N14F
SS-83PS4
01-2183L-103SL
FS2U
UD-SFAZ-UT-00-0013-02
XST-6-0-24-3V
3-1-40-230-E15SP
3-GR20
2-12-3
GR20
SS-83XPS4
CC-A16A21APE
VAF-G1-01M-1-0
QTY
2
2
2
1
4 each
1
1
1
2
2
3
1
1
1
FITTINGS INSTRUMENTATION AND MISCELLANEOUS COMPONENTS
ID
P-01
P-03 P-04
P-05
P-06
T-01T-03 T-04 T-05 T-07 T 08 T-09 T-10
T-02 T-l l
T-06
T-12T-13
COMPONENT DESCRIPTION
14 in tube fitting X 14 in tube fitting X 14 in FNPTTee
14 in MNPTplug
14 in tube fitting X 14 in MNPT straight
34 in FNPT full flow quick-connect body
34 in FNPT full flow quick-connect stem
38 in thermoplastic hose 38 in SS MNPT
14 in tube fitting Tee
14 in tube fitting X 14 in FNPT elbow
14 in tube fitting elbow
14 in MNPT X 12 in tube adapter straight
14 in MNPT X 34 in MNPT reducer
12 in tube fitting X 34 in MNPT straight
14 in tube fitting cross
14 in tube adapter X 12 in FNPT straight
14 in tube adapter X 18 in tube fitting straight bored through
14 in tube adapter X 18 in tube fitting straight
14 in tube fitting X 18 in MNPT straight
0 to 300 psig gauge 50 mm face 14 in MNPT
0 to 6000 psig gauge 2 5 m face 14 in MNPT
0 to 6000 psig transmitter 12 in MNPT
0 to 5 psig gauge 2 5 in face 14 in MNPT
Self-adhesive K-type thermocouple
K-type single-point thermocouple probe IN-600 18 in diameter 41 in length sheath
K-type multi-point profile probe IN-600 18 m diameter 53 in length sheath
thermocouples 0 3 6 9 12 and 18 in from tip
K-type IN-600 over-braided thermocouple
K-type single-point thermocouple probe 304-SS 18 in diameter 3 in length sheath
18 in OD X 0 028 in wall SS-316316L tubing
14 m O D X 0 035in wall SS-316316L tubing
12 in O D X 0 065in wall SS-316316L tubing
14 in OD X 116 in wall vinyl tubing
12 0 ft heating cord 250 W output
PART NO
SS-400-3-4TTF
SS-4-P
SS-400-1-4
SS-QF12-B-12PF
SS-QF12-S-12PF
SS-7R6-PM6-PM6-30
SS-400-3
SS-400-8-4
SS-400-9
SS-8-TA-1-4
SS-12-HRN-4
SS-810-1-12
SS-400-4
SS-4-TA-7-8
SS-200-R-4BT
SS-200-R-4
SS-400-1-2
PGI-50M-PG300-CAOX-BG
G058113
PMP71 -WAC1W21RD AAA
33075
SA1-K-SRTC
KQIN-18U-41
EIPP6012
XCIB-K-2-1-3
KTSS-18G-3
SS-T2-S-028
SS-T4-S-035
SS-T8-S-065
LT-2-4
HTC-120
QTY
6
2
12
1
1
1
4
2
1
1
1
1
1
1
4
2
2
1
2
1
1
8
2
1
1
2
20 ft
50 ft
20 ft
10 ft
2
FITTINGS INSTRUMENTATION AND MISCELLANEOUS COMPONENTS (CONTD)
ID COMPONENT DESCRIPTION
Portable temperature controller 10 to 79degC range
38 in ID X 18 in wall elastomeric insulation
Adjustable height support stand 150 lb capacity
Alumina specimen boat assembly
Isolated input multi-channel data logger
24 VDC 600 W power supply
Hinged electrical enclosure
500 mL Erlenmeyer flask
Size 6 two-hole rubber stopper
PART NO
CN-TOT-A-175JF-120V
M06010
9967T45
GL820
S8VS-06024
R201206
FLA204
DPSSTO3032
QTY
2
24 ft
2
1
1
1
1
2
2
APPENDIX B Representative Thermal Profiles of the Pressure Vessel
700
600
U 500 --
pound 400
300 --S3 i -
a = pound 200
100
0
1 1
j bull_ bull bull p bull bull
1 1
J
1
i
bullMetal Temperature
bullFluid Temperature
-mdash bull l bull bull
1
0 025 05 075
Normalized Pressure Vessel Length
Figure B-1 Temperature distribution at 150 MPa for [685degC | 610degC | 645degC]
700
600 -
u o
S + S3 i-
o s 3
500
400
300
200
100 -
0
4 1 j|laquoPB
bullMetal Temperature
bull Fluid Temperature
bull bull
__ j j i
T - 1
- - - - -
lt bull
0 025 05 075
Normalized Pressure Vessel Length
Figure B-2 Temperature distribution at 150 MPa for [725degC | 640degC | 690degC]
800
700
G 600
1 5 0 deg 1 400
I 300 s 200
100
0
1 1 1 1 1 1
J ^
bull bull bull bull bull
bull
bull Metal Temperature
bull Fluid Temperature i
bull bull
I J [ bulllt
i i i
0 025 05 075
Normalized Pressure Vessel Length
Figure B-3 Temperature distribution at 150 MPa for [755degC | 695degC | 725degC]
U o
1
3
800
700
600
500
400 -f
S- 300
pound 200 plusmn
100
0
4 1 r bullbullbull
bullMetal Temperature
bull Fluid Temperature
bull bull bull
bull i i i bull
i i i
0 025 05 075
Normalized Pressure Vessel Length
Figure B-4 Temperature distribution at 150 MPa for [785degC | 735degC | 780degC]
131
U o o u 3 S3 s-V a E
900
800
700
600
500
400
300
200
100
0
1 bull 1 mdash 1 1 1 1
T _ _ _ bull
bullMetal Temperature
bullFluid Temperature 1
bull bull I
bull J i Lmdashbull_
bull i bull w 1 1 1
- i i i
0 025 05 075
Normalized Pressure Vessel Length
Figure B-5 Temperature distribution at 150 MPa for [800degC | 750degC | 800degC]
700
600
U 500
3 -n cs
a S pound
400
300
200
100 -
0
i
-
J laquobull MMm T-2 bent out of
- - centre and moved closer to wall
bullMetal Temperature
bullFluid Temperature
bull i i i i
bull bull __ T ____ r ^
bull _ 1 + |
bull i l l i i i i i i
i i i i i i
1 1 1
0 025 05 075
Normalized Pressure Vessel Length
Figure B-6 Temperature distribution at 250 MPa for [685degC | 610degC | 645degC]
700
600
500
400
300
200
100
0
1 1
bull
1 1
bull bull
T-2 bent out of - - centre and moved
closer to wall
i
bullMetal Temperature
bullFluid Temperature
bull i i i i i i
bull i bull i i i ^
i i i i i i i i i i i i
025 05 075
Normalized Pressure Vessel Length
Figure B-7 Temperature distribution at 250 MPa for [725degC | 640degC | 690degC]

11 Library and Archives Canada
Published Heritage Branch
395 Wellington Street OttawaONK1A0N4 Canada
Bibliotheque et Archives Canada
Direction du Patrimoine de Iedition
395 rue Wellington OttawaONK1A0N4 Canada
Your file Votre reference ISBN 978-0-494-83048-2 Our file Notre r6f6rence ISBN 978-0-494-83048-2
NOTICE AVIS
The author has granted a nonshyexclusive license allowing Library and Archives Canada to reproduce publish archive preserve conserve communicate to the public by telecommunication or on the Internet loan distribute and sell theses worldwide for commercial or nonshycommercial purposes in microform paper electronic andor any other formats
Lauteur a accorde une licence non exclusive permettant a la Bibliotheque et Archives Canada de reproduire publier archiver sauvegarder conserver transmettre au public par telecommunication ou par Ilnternet preter distribuer et vendre des theses partout dans le monde a des fins commerciales ou autres sur support microforme papier electronique etou autres formats
The author retains copyright ownership and moral rights in this thesis Neither the thesis nor substantial extracts from it may be printed or otherwise reproduced without the authors permission
Lauteur conserve la propriete du droit dauteur et des droits moraux qui protege cette these Ni la these ni des extraits substantiels de celle-ci ne doivent etre imprimes ou autrement reproduits sans son autorisation
In compliance with the Canadian Privacy Act some supporting forms may have been removed from this thesis
Conformement a la loi canadienne sur la protection de la vie privee quelques formulaires secondaires ont ete enleves de cette these
While these forms may be included in the document page count their removal does not represent any loss of content from the thesis
Bien que ces formulaires aient inclus dans la pagination il ny aura aucun contenu manquant
11
Canada
ii
Abstract
The supercritical carbon dioxide (S-CO2) Brayton cycle represents a highly
efficient means of power conversion however owing to its novelty material
compatibility with CO2 at the operating conditions dictated by this cycle is still relatively
unknown As part of a collaborative research effort a high temperature S-CO2 corrosion
test rig was designed and assembled for use up to 750degC at 150 MPa or 700degC at
250 MPa Functional testing was carried out at 150 MPa to determine and validate the
necessary furnace set points that would give near uniform temperature distributions of
550 600 650 700 and 721degC Temperature variation across the usable length of the
specimen boat was maintained to within a 123 to 168degC window for all nine trials
conducted Preliminary commissioning at 250 MPa also indicated that fluid
temperatures were almost 40degC lower than those measured at 150 MPa using equivalent
furnace set points
iii
Acknowledgements
First and foremost I would like to thank my advisor Dr Henry Saari for his
continuous support both morally and financially throughout the duration of this project
despite numerous setbacks and challenges his thoughtful guidance and direction was
greatly appreciated
I would also like to express my gratitude to CanmetENERGY of Natural Resources
Canada for the funding provided Also many thanks to all those from the Zero
Emissions Technology (ZET) group at the Ottawa Research Centre in Bells Corners that
were involved in some capacity throughout the project Chris Gareau and Dave Faguy
deserve my sincere appreciation for their patience diligence and assistance with the
overall assembly of the test rig As well both Dr Kourosh Zanganeh and Carlos
Salvador are worthy of acknowledgement for their help integrating this project into the
existing infrastructure of the Vertical Combustor (VC) building
Finally I wish to thank my parents family and friends for their encouragement in
addition to Kyla for her help in editing this thesis
IV
Table of Contents
Abstract ii
Acknowledgements iii
List of Tables vi
List of Figures vii
List of Appendices xii
1 Introduction 1
11 Demand for Advanced Power Conversion Cycles 1
12 S-C02 Brayton Cycle 3
13 High Temperature S-CO2 Corrosion 7
14 Objective and Organization of Thesis 9
2 Literature Review - High Temperature S-C02 Corrosion Testing 10
21 A Primer on High Temperature Materials 10
22 Modes of High Temperature Corrosion 16
221 Oxidation 17
2211 Thermodynamics 18
2212 Kinetics of Oxide Formation and Growth 21
2213 Desired High Temperature Oxide Scales 25
222 Carbonaceous Gas Reactions 28
2221 Carburization (ac lt 1) 28
2222 Metal Dusting (ac gt 1) 32
2223 Protection Against Carbon Attack 33
223 Erosion-Corrosion 34
2231 Mechanisms of Erosion 34
2232 High Temperature Corrosion Interaction 37
23 High Temperature Corrosion Testing 39
231 Erosion-Corrosion Rig Testing 40
2311 Rotating-Type Rigs 41
2312 Blast-Type Rigs 43
232 Autoclave Testing 45
2321 S-CO2 Corrosion Test Rigs 48
V
24 Methods of Corrosion Analysis 58
241 Gravimetric Analysis 58
242 Microscopic and Spectroscopic Analyses 59
25 Metallic Corrosion in High Temperature CO2 Environments 60
251 Subcritical Pressure 61
252 Supercritical Pressure 64
26 Summary 69
3 Thesis Objectives and Outline 70 4 Design of the Carleton-NRCan S-CO2 Corrosion Test Rig 71
41 Design Criteria 71
42 Pressure Vessel 72
43 Gas Booster 77
44 Furnace 77
45 Integrated Safety Features 78
451 Passive Elements 79
452 Active Elements 79
46 Specimen Boat 82
47 Conceptual Layout and Assembly 83
5 Commissioning 95 51 Initial Start-up and Modifications 95
52 Thermal Profiling at 150 MPa 101
53 Pressure Effects on Performance I l l
6 Summary and Conclusions 114 61 Future Work 115
References 118
VI
List of Tables
Table 2-1 Compositions of some common nickel-base superalloys [4043] 11
Table 2-2 The roles of selected alloying elements in nickel-base superalloys [3940] 12
Table 2-3 Test conditions used for high temperature S-CO2 corrosion studies 65
Table 4-1 Activation pressures to remedy an overpressurization 80
Table 4-2 Maximum impurity content of BOC Canada Ltd standard grade bulk
C02 85
Table 4-3 Assigned upper threshold alarm triggers 94
Table 5 -1 Heated zone set points to give uniform temperature distributions 103
Table 5-2 Summary of the thermal profiling trials conducted at 150 MPa 108
Vll
List of Figures
Figure 1-1 Global electricity generation by fuel type [1] 2
Figure 1-2 CO2 phase diagrams for the (a) pressure-temperature plane and (b)
density-pressure plane [16] 4
Figure 1-3 Marked differences in turbine size among the advanced power cycles [6] 5
Figure 1-4 T-s diagram for the S-CO2 recompression cycle Adapted from [6] 6
Figure 1-5 An efficiency comparison of the S-CO2 helium Brayton and supercritical Rankine cycles between 350 and 950degC Reproduced from [6] 7
Figure 2-1 The relationship between creep-rupture life and y volume fraction [40] 13
Figure 2-2 Creep-rupture strength as a function of combined Al and Ti content [39]13
Figure 2-3 Possible morphologies of grain boundary carbides (a) favourable discrete globular type [39] (b) unfavourable continuous film [44] and (c) unfavourable discontinuous cellular type [44] 14
Figure 2-4 Evolution of cast turbine blade grain structure equiaxed polycrystalline (left) columnar grain directionally solidified (centre) and single crystal directionally solidified (right) [39] 16
Figure 2-5 Ellingham diagram for the oxidation of selected metals [47] 20
Figure 2-6 Lattice defects typical of (a) n-type and (b) p-type oxides Interstitial species represent excesses and sub-lattice vacancies represent deficiencies Adapted from [47] 21
Figure 2-7 Evolution of a metallic oxide layer at high temperature (a) metal-oxidant reaction at the metal surface (b) nucleation of a thin oxide film (c) oxide film growth controlled by diffusion (d) possible emergence of oxide layer defects and separation from the metal substrate and (e) subsequent loss of protectiveness Reproduced from [46] 22
Figure 2-8 Common oxidation rate laws with the associated protective (P) temporarily protective (TP) or non-protective (NP) behaviour noted in parentheses 24
Vlll
Figure 2-9 Parabolic oxidation rate constants for metals pertinent to superalloy composition as a function of temperature Reproduced from [46] 26
Figure 2-10 Oxide scale development on a Ni-Cr-Al alloy (a) nickel-rich oxides appear first at the alloy-gas interface (b) lower oxygen activity beneath the external scale promotes discontinuous amp2O3 and AI2O3 formation (c) continuous Cr203 and (d) finally AI2O3 subscales result with the progression of time Reproduced from [47] 27
Figure 2-11 Ellingham diagram for transition metal carbides [57] 29
Figure 2-12 Stability diagram for the Cr-O-C system at 620degC Reproduced from [45] 31
Figure 2-13 Effect of carburization on room temperature mechanical properties of nickel-base superalloys [59] 31
Figure 2-14 Metal dusting mechanism of a Cr203-forming nickel-base alloy (a) carbon diffusion into the substrate initiated at Cr203 scale defect (b) formation of internal carbides (M7C3 and M23C6) and local carbon-supersaturation of substrate (c) graphite nucleation and inward growth and (d) outgrowth of coke corrosion product Reproduced from [55] 33
Figure 2-15 Erosion mechanisms for ductile and brittle materials (a) low angle surface abrasion (b) high angle low velocity surface fatigue (c) excessive plastic deformation at high angle medium velocity (d) surface melting due to high velocity impact and (e) brittle fracture Adapted from [61] 35
Figure 2-16 Effect of particle impact angle on the erosion rate of ductile and brittle
materials 37
Figure 2-17 Erosion-corrosion interaction regimes Adapted from [64] 39
Figure 2-18 Whirling arm erosion-corrosion test rig [69] 42
Figure 2-19 Centrifugal erosion-corrosion test rig [68] 42
Figure 2-20 Gas jet erosion-corrosion test rig [72] 44
Figure 2-21 Wind tunnel-type erosion-corrosion test rig [67] 45
Figure 2-22 Effect of internal pressure on the minimum required wall thickness for a pressure vessel of circular cross-section 46
Figure 2-23 Stress-temperature curves for high temperature boiler materials [74] 47
ix
Figure 2-24 Chevron Oil Field Research Company S-CO2 corrosion test rig [23] 49
Figure 2-25 Sandia National Laboratories S-CO2 corrosion test rig [24] 50
Figure 2-26 INL single specimen S-CO2 corrosion test rig Adapted from [11] 52
Figure 2-27 INL multi-specimen S-CO2 corrosion test rig Adapted from [11] 52
Figure 2-28 Tokyo Institute of Technology S-CO2 corrosion test rig Adapted from
[33] 55
Figure 2-29 MIT low pressure S-CO2 corrosion test rig Reproduced from [38] 55
Figure 2-30 MIT high pressure S-CO2 corrosion test rig Reproduced from [38] 56
Figure 2-31 UW-Madison S-C02 corrosion test rig Adapted from [36] 57
Figure 2-32 CEA S-C02 corrosion test rig [78] 57
Figure 2-33 Surface interaction with an incident electron beam [47] 60 Figure 2-34 Multi-layered oxide (Fe304 | SiCgt2 | FeCr204) that formed on a ferritic
stainless steel following 1060 hour exposure to CO2 at 520degC and 40MPa[31] 61
Figure 2-35 Post-breakaway oxidation rate as a function of temperature [27] 62
Figure 2-36 Intergranular attack of IN-617 following 175 hour exposure to CO2 at 1000degCand70MPa[ll] 63
Figure 2-37 Characterization of 410J3-SS oxide structure following 1000 hour exposure to S-CO2 at 600degC and 200 MPa [33] 65
Figure 2-38 Cumulative mass gains of various alloys following a 3000 hour exposure to S-CO2 at 650degC and 207 MPa at UW-Madison Reproduced from [36] 67
Figure 2-39 Cumulative mass gains of nickel-base superalloys following exposure to S-CO2 at various test conditions [38] 68
Figure 4-1 Stress-temperature curves for pressure vessel material candidates Generated with ASME data provided by Moore [83] 73
Figure 4-2 Maximum allowable internal pressure-metal temperature curve for the pressure vessel as per the ASME B313-2008 Process Piping code 74
X
Figure 4-3 Graylocreg connector prior to (left) and following (right) tightening
Adapted from [87] 75
Figure 4-4 Working drawing of the IN-625 pressure vessel [84] 76
Figure 4-5 Furnace dimensions and heated zone locations 78
Figure 4-6 Overpressurization protection flowchart 80
Figure 4-7 Circuit diagram of solenoid valve relay 82
Figure 4-8 Alumina specimen boat 83
Figure 4-9 PampID for Carleton-NRCan high temperature S-CO2 corrosion test rig 84
Figure 4-10 Carleton-NRCan high temperature S-CO2 corrosion test rig 85
Figure 4-11 Inlet connections to the GBT-1530 gas booster 87
Figure 4-12 At the outlet of the GBT-1530 gas booster 89
Figure 4-13 At the inlet to the pressure vessel 90
Figure 4-14 Downstream of the pressure vessel 92
Figure 4-15 Electrical enclosure 93
Figure 4-16 Thermocouple locations along the length of the pressure vessel 93
Figure 5-1 Location of thermocouples within the pressure vessel (hatched) 96
Figure 5-2 Initial temperature distribution at 150 MPa for furnace set points of
600degC 97
Figure 5-3 Heat reflector positioning within the pressure vessel (hatched) 98
Figure 5-4 Heat reflectors attached to the profile probe sheath 98
Figure 5-5 Effectiveness of the heat reflectors on raising fluid temperature at 150 MPa for furnace set points of 600degC 100
Figure 5-6 Change in metal temperature following the addition of the heat reflectors at 150 MPa for furnace set points of 600degC 101
Figure 5-7 Temperature distributions for 550 600 650 and 700degC using the established furnace set points 104
xi
Figure 5-8 Validation of the furnace set points to give 550degC at 150 MPa 106
Figure 5-9 Validation of the furnace set points to give 600degC at 150 MPa 106
Figure 5-10 Validation of the furnace set points to give 650degC at 150 MPa 107
Figure 5-11 Validation of the furnace set points to give 700degC at 150 MPa 107
Figure 5-12 Temperature distribution using furnace set points of
[800degC | 750degC | 800degC] at 150 MPa 109
Figure 5-13 Pressure variations at 150 MPa over a 10 hour period at 650degC 110
Figure 5-14 Temperature variations at 650degC over a 10 hour period at 150 MPa 110
Figure 5-15 Differences in metal temperature at 250 MPa from 150 MPa for equivalent furnace set points 112
Figure 5-16 Temperature distributions using fixed furnace set points of [685degC | 610degC | 645degC] at 150 and 250 MPa 112
Figure 5-17 Temperature distributions using fixed furnace set points of [725degC | 640degC | 690degC] at 150 and 250 MPa 113
Figure 5-18 Thermal response of T-15 from room temperature to fixed furnace set points of [685degC | 610degC | 645degC] at 150 and 250 MPa 113
xii
List of Appendices
APPENDIX A Bill of Materials 126
APPENDIX B Representative Thermal Profiles of the Pressure Vessel 129
Introduction
1
11 Demand for Advanced Power Conversion Cycles
The International Energy Agency (IEA) estimates that the global electricity demand
will increase 76 between 2007 and 2030 This marked growth is a direct result of the
continued development and maturation of non-Organization for Economic Co-operation
and Development (OECD) economies Assuming albeit highly unlikely that no changes
are made to existing governmental energy policies Figure 1-1 shows that fossil fuels will
supplement the majority of this increase in electricity generation [1] The combustion of
fossil fuels however has an adverse effect on the environment and potentially the
climate because of the emissions that are produced At the very least efficiency gains
must be made to the design and operation of fossil fuel-based electrical power plants
either by increasing their operating conditions or utilizing improved combustion
technologies The capture and sequestration of carbon emissions would also lessen the
environmental impact of fossil fuel combustion but not remove it entirely Current
carbon dioxide (CO2) capture processes though are energy-intensive and may actually
decrease the electrical output of a power plant once implemented [2] Reducing the role
of fossil fuels in the energy production aggregate represents a more complete solution to
an environmentally-conscience energy source Nuclear energy has the potential to offset
this reduced role
With the intent of achieving the mainstream use of nuclear energy the Generation-
IV International Forum (GIF) was established to facilitate research and development
efforts of future nuclear energy systems Six reactor designs were chosen by the GIF that
2
were deemed to offer the most promise in areas such as sustainability economic
competitiveness safety and proliferation resistance and physical protection In addition
the supercritical Rankine steam cycle helium Brayton cycle and supercritical carbon
dioxide (S-CO2) Brayton cycle were selected as the electric power conversion systems to
complement the Generation-IV reactors [3-5] The inherent advantages of the S-CO2
Brayton cycle in comparison to the other cycles mentioned will be briefly discussed in
the section to follow
2007 2015
bull 2030
Hydro ^ ^ ^ ^ ^ ^ ^ ^ ^ ^ ^ _
t - Gas ^ ^ ^ ^ ^ ^ ^ ^ ^ ^ ^ ^ ^ ^ ^ ^ ^ ^ _
Coal ^ ^ ^ ^ ^ ^ ^ ^ ^ ^ ^ ^ ^ ^ ^ ^ ^ ^ ^ ^ ^ ^ ^ ^ ^ ^ ^ ^ ^ ^ ^ ^ ^ ^ ^ ^ ^ ^ - ^ 1 1 1 1
0 4 000 BOM 12 000 16 WO
TWh
Figure 1-1 Global electricity generation by fuel type [1]
The S-CO2 cycle was originally envisioned to be used as the power conversion
system in both the lead-cooled fast reactor (LFR) and sodium-cooled fast reactor (SFR)
because of their intermediate (550degC) core outlet temperature More recent developments
[46-11] have also suggested the favourable application of this cycle to other advanced
reactor concepts in particular the gas-cooled fast reactor (GFR) molten salt reactor
(MSR) and very high temperature reactor (VHTR) Outside the nuclear field the S-CO2
cycle is being actively researched as an alternative to the traditional steam and organic
Oil
Btomass
Other renewable
Nuclear
3
Rankine cycles used in concentrated solar [1213] and nuclear ship propulsion [6]
systems In fossil fuel-based cogeneration installations the S-CO2 cycle is also being
considered as a possible bottoming cycle option for waste heat recovery [14]
12 S-CO2 Brayton Cycle
The S-CO2 cycle is intended to operate as a closed system and exclusively above
the critical point of C02 ie above 3103degC (30418 K) and 738 MPa (738 bar) [15]
Carbon dioxide phase diagrams are shown in Figure 1-2 for both the pressure-
temperature and density-pressure planes Above the critical point liquid and gaseous
phases become indistinguishable - represented in Figure l-2a by dashed phase
boundaries - and CO2 exists as a homogenous supercritical fluid phase At temperatures
and pressures far exceeding those that define the critical point S-CO2 fluid behaviour
approximates that of an ideal gas Only near the critical point do fluid properties such as
density viscosity and specific heat capacity exhibit large gradients with small changes
in temperature [616] Figure l-2b illustrates how significant this temperature sensitivity
is on the density and hence the compressibility of S-CO2
Exploiting the low compressibility of CO2 in the vicinity of its critical point is
what gives the S-CO2 cycle a distinct advantage over the ideal gas helium Brayton cycle
the extremely low critical point of helium (-26795degC) [17] makes it impracticable to
benefit from these same real gas properties Consequently the S-CO2 cycle uses only
30 of its total turbine work for compression as opposed to the 45 needed by the
helium cycle This reduced compressor work eliminates the need for intercooling
4
decreasing the overall plant footprint complexity and cost [6818-22] Figure 1-3
depicts the extremely compact turbomachinery of the S-CO2 cycle in relation to the
helium Brayton and supercritical Rankine steam cycles
10000
1000
3 w
Q
(a) 200 250 300 350
temperature (K)
400
1000
30 50 70 90 110 130 150 170
(b) pressure (bar
Figure 1-2 CO2 phase diagrams for the (a) pressure-temperature plane and (b) density-pressure plane [16]
bull Steam Turbine 55 stages 250 M W
Mitsubishi Heavy Industries Ltd Japan (with casing)
Helium Turbine 17 stages 333 M W (167 MW e ) XL Yan LM Lidsky (MIT) (without casing)
S-C0 2 Turb ine 4 stages 450 M W (300 MW e ) (without casing and with compressors of comparable size)
Figure 1-3 Marked differences in turbine size among the advanced power cycles [6]
The proposed turbine inlet conditions for the S-C02 and helium Brayton cycles
differ considerably as well Using a thermal efficiency of 45 as a benchmark between
cycles the S-CO2 recompression cycle (the most efficient of all the layouts investigated)
needs only 550degC and 200 MPa to attain this level compared to the 750degC (closer to
800degC if all losses are considered) and 80 MPa required by the helium Brayton cycle [6]
Figure 1-4 provides a temperature-entropy (T-s) diagram for the S-CO2 recompression
cycle illustrating how heat rejection is minimized (or efficiency is improved) with the
addition of another compressor before the pre-cooler The higher operating temperature
of the helium cycle imposes a significant demand on both component cooling and
material requirements [6-81819] In terms of material strength and creep resistance the
higher operating pressure of the S-CO2 recompression cycle is less problematic at the
5 m
6
lower turbine inlet temperature (TIT) Furthermore a higher operating pressure reduces
the detrimental effects that fractional pressure drops have on cycle efficiency Thermal
efficiencies for the supercritical Rankine cycle and both Brayton cycles are plotted in
Figure 1-5 for TITs between 350 and 950degC inclusively For TITs above 550degC the
S-CO2 recompression cycle is the most advantageous of the three cycles considered this
is promising for even greater efficiency gains once confidence is acquired at lower the
initial operating temperature Although the Rankine cycle appears to have superiority
over the S-CO2 recompression cycle at lower temperatures the added plant complexity
and auxiliaries required to do so lead to a higher capital investment [6-819]
6 0 0 i bull bull j bull bull bull 1
13 15 17 19 21 23 25 27
Entropy (kJkgK)
Figure 1-4 T-s diagram for the S-CO2 recompression cycle Adapted from [6]
7
10 bull - Supercritical C02 Brayton cycle
bullmdashHelium Brayton cycle
4mdash Supercritical Rankine steam cycle
350 450 550 650 750 Turbine Inlet Temperature (degC)
850 950
Figure 1-5 An efficiency comparison of the S-CO2 helium Brayton and supercritical Rankine cycles between 350 and 950degC Reproduced from [6]
13 High Temperature S-CO2 Corrosion
While the S-CO2 Brayton cycle offers merit in achieving high thermal efficiencies
the novelty of this cycle poses a unique challenge relating to material selection - the
compatibility of materials with CO2 at the temperature and pressure combination dictated
by the S-CO2 recompression cycle is relatively unknown For the most part CO2
corrosion studies originating from the oil and gas industry involve carbon steels and gas
compositions (high sulphur and water content) [23] that are likely never to be used or
encountered within a S-CO2 cycle Moreover the small fraction of corrosion tests
conducted at supercritical conditions with relatively pure CO2 and prior to the
8
realization of the S-CO2 cycle were done so at rather low temperatures (54 to 238degC)
[2425] Experience with the British Magnox and advanced gas reactor (AGR) program
can provide more relevant insight into material interaction with high temperature CO2 but
only at subcritical pressures - the maximum being about 53 MPa Apart from some
reactor-specific alloys [26] corrosion data obtained as a result of this nuclear program
was primarily for mild and stainless steels [27-32]
The ability to conduct accelerated laboratory corrosion testing in a high
temperature S-CO2 environment is warranted yet still only possible at a small number of
institutions worldwide Preliminary results published by these institutions correlate well
with what was observed in the AGR program despite the differences in pressure
Regarding corrosion resistance austenitic stainless steels still outperform their ferritic
counterparts mainly because of greater chromium (Cr) content [33-37] Repeated testing
at supercritical conditions is required to determine what effect if any pressure has on the
formation and protectiveness of oxide layers Although these S-CO2 studies focused
predominantly on the corrosion behaviour of steels the nickel-base superalloys that were
tested also demonstrated excellent corrosion resistance [343638] Corrosion data
relating to this family of superalloys however needs to be expanded as they represent the
logical material choice for the S-CO2 turbomachinery and heat exchangers Additionally
the duration of future S-CO2 corrosion tests will also need to increase to properly
characterize the corrosion mechanisms involved and assess the long-term stability of
oxide layers
9
14 Objective and Organization of Thesis
In a collaborative effort between Carleton University and CanmetENERGY of
Natural Resources Canada (NRCan) the development and optimization of a 100 MWe
S-CO2 advanced Brayton cycle has been initiated As part of the overall scope of this
project a long-term S-CO2 corrosion study is required to evaluate the corrosion
behaviour of selected structural materials The main objective of this thesis is therefore
to design construct and commission a S-CO2 corrosion test loop that will be used to
conduct this study
In the subsequent chapter an introduction to high temperature corrosion
mechanisms and testing methods is presented at the outset to accompany a review of past
and current high temperature CO2 corrosion studies The specific objectives of this thesis
are outlined in Chapter 3 Chapter 4 describes the design and assembly of the S-CO2
corrosion test loop while its commissioning is detailed in Chapter 5 Finally Chapter 6
summarizes the work carried out for this project draws upon the major conclusions and
lays out recommendations for future work
10
2 Literature Review - High Temperature S-C02 Corrosion Testing
This chapter provides a detailed review of high temperature metal corrosion in a
S-CO2 environment An overview of high temperature materials exclusively the nickel-
base class of superalloys is first presented Following this the thermodynamic and
kinetic principles of high temperature corrosion are explained While several modes of
high temperature corrosion are recognized only those that seem apt for a carbon-rich
atmosphere and closed-cycle gas turbine application will be discussed High temperature
corrosion tests are then described in addition to the methods used to both quantify and
evaluate the extent of corrosion Finally a survey detailing metallic interaction with a
CCgt2-rich environment concludes this chapter This survey begins with high temperature
corrosion investigations conducted at subcritical CO2 pressures and ends with the most
recent corrosion studies related to the S-CO2 Brayton cycle
21 A Primer on High Temperature Materials
High temperature materials more commonly referred to as superalloys consist of
nickel- nickel-iron- and cobalt-base alloy systems At service temperatures above
540degC superalloys possess high creep-rupture strength and exhibit a considerable
resistance to thermo-mechanical fatigue oxidation and corrosion [39-42] This primer
however will focus only on the metallurgical aspects (namely the composition
microstructures processing methods and surface protection) of nickel-base superalloys
due to their prevalence in current gas turbine applications The reader is directed to work
by Donachie [39] for a more comprehensive discussion of all the superalloy classes
11
Nominal compositions of some representative nickel-base superalloys are given in
Table 2-1 The controlled alloying elements - possibly as many as fourteen - that
comprise the listed superalloys have a major influence on the phase structures that form
as well as the mechanical properties and environmental protection that they impart
Thus each element can be classified as having one or more of the following roles within
the nickel-base superalloy matrix strengthener intermetallic precipitate former carbide
former grain boundary strengthener or surface stabilizer [3940] Table 2-2 summarizes
the specific roles of the various alloying elements
Table 2-1 Compositions of some common nickel-base superalloys [4043]
Alloy
Waspaloy Udimet 720
Mar-M246 IN-713LC
IN-792
PWA 1480 CMSX-2
PWA 1484 CMSX-4
CMSX-10
TMS-162
Cr
195 179
83 120
124
100 80
50 65
20
29
Co
135 147
100 -
92
Nominal Composition (wt
Mo W Ta Re Ru
Wrought Superalloys
43 -
30 13 - - -
Conventionally Cast Alloys
07 100 30 45 - -
Directionally Solidified Alloy
19 39 42
bal Ni)
Nb
-
-
-
20
-
First-Generation Single-Crystal Alloys
50 50
40 120 06 80 60
-
-
Second-Generation Single-Crystal Alloys
100 96
20 60 90 30 -06 64 65 30 -
-
-
Third-Generation Single-Crystal Alloy
30 04 50 80 60 - -
Fourth-Generation Single-Crystal Alloy
58 39 58 56 49 60
Al
13 25
55 59
35
50 56
56 56
57
58
Ti
30 50
10 06
39
15 10
-
10
02
-
Hf
-
~
150 -
-
-
-
010 010
003
009
c
008 004
014 016
007
-
-
-
-
-
-
12
Table 2-2 The roles of selected alloying elements in nickel-base superalloys [3940]
Alloying Element Purpose
Cr Co Mo W Fe Re Ta Nb Al Ti Hf C B Zr
Matrix Strengthener X X X X X X
Intermetallic v
Precipitate Former
Carbide Former X X X X
Grain Boundary Strengthener
Surface Stabilizer X
Nickel-base superalloys consist of a face-centred cubic (FCC) gamma (austenitic)
matrix together with several secondary phases The coherent intermetallic gamma prime
(y) phase and the carbides are for the scope of this review considered to be the most
relevant secondary phases The y-phase constitutes the ordered Ni3(AlTi) compounds
that nucleate within the austenitic matrix from an initial solution heat treatment and
evolve with subsequent aging heat treatment(s) The presence of the y-phase distorts the
austenitic matrix so as to impede the movement of dislocations and hence conferring
strength to the superalloy the volume fraction particle size and morphology of the
y-phase all dictate to what extent this strengthening mechanism occurs [394042] All
three factors are controlled by the aluminium and titanium contents of the superalloy and
the heat treatments it has been subjected to [39] Figure 2-1 illustrates the creep-rupture
behaviour of a nickel-base superalloy as a function of its y volume fraction Beyond an
optimum volume fraction of approximately 70 further increases in y volume fraction
X X X
X X X
X X X X
X
13
actually reduce creep-rupture life [40] Similarly Figure 2-2 shows an increase in creep-
rupture strength with greater aluminium and titanium contents
10 000 E 1 1 1 1 1 1 r
1000 r
100 r
ogt 0) 3 10 r
0
o bullj p
01
001
A - - -a J I L
- bull - T M S - 7 5 9 0 0 C -laquo -TMS-75 1100 o C -lt^--TMS-82+900degC -iSr-TMS-824-1100C I
0 20 40 60 80 100
Designed amount of y volume fraction ()
Figure 2-1 The relationship between creep-rupture life and y volume fraction [40]
tn
OU
50
40
m
20
10
0
bull
^ gt
bull V
_ v
i i i j
bull
bull
-
bull Wrought bull Cast
_ i 1 J Utrade
- 345
amp 276
- 207 c o o
138
- 67
0 1 2 3 4 5 6 7 8 9 10
Al + Ti content w i
Figure 2-2 Creep-rupture strength as a function of combined Al and Ti content [39]
14
(a) (b) (c)
Figure 2-3 Possible morphologies of grain boundary carbides (a) favourable discrete globular type [39] (b) unfavourable continuous film [44] and
(c) unfavourable discontinuous cellular type [44]
Carbide species that readily form in these superalloys either at grain boundaries or
within the grains include MC M23C6 MeC and M7C3 where M denotes a refractory
metal atom The carbon content of the superalloy as well as the temperature and duration
of its thermal exposure (be it via heat treatment or through service) affect what carbide
type will form Grain boundary carbides specifically their morphology have a
significant effect on creep-rupture behaviour Discrete globular M23C6 carbides prevent
premature failure by inhibiting grain boundary sliding and allowing adjacent grains to
retain enough ductility to accommodate this redistribution of stress Carbides that
precipitate as continuous films or discontinuous cellular formations however are
detrimental to creep-rupture life [394143] These distinct grain boundary carbide
morphologies are shown above in Figure 2-3 Other functions that carbides have in
nickel-base superalloys are to provide secondary strengthening to the austenitic matrix
and bind to impurity elements that would otherwise degrade mechanical properties [39]
15
Nickel-base superalloys are processed in both wrought and cast forms notable
differences in the size morphology and orientation of the grains exist between the two
processing methods [41] Wrought superalloys typically possess excellent tensile
strength and low-cycle-fatigue (LCF) resistance on account of their finer-sized grains
Conversely the coarser grain sizes of cast superalloys enhance high temperature creep-
rupture properties [39404243] Further benefits to creep-rupture properties are possible
if directionally solidified (DS) casting techniques are employed At elevated
temperature metal fracture occurs intergranularly - often initiated at grain boundaries
oriented perpendicular to the direction of applied loading [39] With control over grain
orientation through DS casting transverse grain boundaries can be removed from the
superalloy to extend creep-rupture life Depicted in Figure 2-4 the logical progression of
turbine blade microstructures - from polycrystalline (PC) to columnar grain directionally
solidified (CGDS) and finally single crystal directionally solidified (SCDS) - reiterates
the improved high temperature performance that was realized first with the elimination of
transverse grain boundaries and then grain boundaries altogether
To protect against material degradation nickel-base superalloys are intentionally
alloyed with elements that form thermodynamically-stable oxides - primarily chromia
(Cr203) and alumina (AI2O3) [41] These oxides develop into continuous adherent
surface films which act to isolate the superalloy from its surrounding environment
Compared to an applied diffusion overlay or thermal barrier coating system the C^Ch
and AI2O3 oxide layers are also regenerative in nature that is even with spallation these
oxide layers are ultimately restored by consuming additional alloying species from the
16
austenitic matrix This regenerative ability however can be damaging to mechanical
properties as both chromium and aluminium contribute to strengthening mechanisms of
the nickel-base superalloy Overlay and thermal barrier coatings do offer the added
benefits of being specially tailored to suit a particular service environment and
significantly reducing metal temperatures respectively [3940] The premise behind
oxidation is explained in greater detail in the succeeding section
Figure 2-4 Evolution of cast turbine blade grain structure equiaxed polycrystalline (left) columnar grain directionally solidified (centre)
and single crystal directionally solidified (right) [39]
22 Modes of High Temperature Corrosion
High temperature (above 500degC) corrosion can be regarded as the non-galvanic
electrochemical reaction between a metal and non-metal whose interfacial anode and
cathode are separated by a layer or film of reaction product [4546] While oxidation is
the most prevalent mode of high temperature corrosion other modes - such as
nitridation carburization and metal dusting halogenation sulfidation erosion-corrosion
17
and molten salt deposition - are also possible depending on the atmospheric composition
that the metal is exposed to For the context of this review however only the principles
of oxidation carburization and metal dusting and erosion-corrosion will be considered
Exclusion of the remaining high temperature corrosion modes follows from the logic that
although contaminant species will inevitably exist within the S-CO2 fluid their trace
levels are unlikely to be the controlling corrosion mechanism(s) This section
summarizes the detailed high temperature corrosion reviews conducted by Lai [45]
Shreir [46] Birks Meier and Pettit [47] and Kofstad [48]
221 Oxidation
Oxidation is potentially the most beneficial form of high temperature corrosion
because if properly exploited the ensuing oxide layer or scale serves as an effective
barrier to subsequent metal attack However if this same oxide layer proves to be
thermodynamically unstable or prone to cracking porosity and spallation the protection
it provides may be compromised or absent altogether [4647] Perhaps of even greater
interest is that environments that are otherwise devoid of molecular oxygen (O2) and
therefore have extremely low oxygen activities such as one composed primarily of CO2
can still support oxidation This section provides an understanding behind the basic
thermodynamics responsible for whether an oxide layer will form and if so the kinetics
that determine at what rate it will evolve To complement these oxidation fundamentals
the selective oxidation of high temperature materials specifically Cr2Cgt3- and AI2O3-
forming nickel-base superalloys will conclude this discussion
18
2211 Thermodynamics
The synthesis of a metallic oxide (MxOy) from a metal (M) and a single gaseous
oxidant O2 for simplicity can be represented by a reaction of the general form
2x 2 mdash M(s) + 0 2 (g) laquo -MOy (s) (21) [46]
Whether or not this reaction indeed tends to be product-favouring that is proceeds
from left to right is indicated by its change in Gibbs free energy (AG) By definition AG
characterizes the algebraic sum of the first and second laws of thermodynamics for an
isothermal (constant temperature) and isobaric (constant pressure) process Thus the
Gibbs free energy change of Equation 21 at absolute temperature T is expressed as
a2y AG = AGdeg + RUT bull In tradefy (22) [46]
aM - a o 2 J
where AGdeg is the standard-state Gibbs free energy of formation Ru is the universal gas
constant and a is the chemical activity of the indicated species
Commonly the metal and oxide activities are taken as unity under the assumption
that both are pure solids and therefore due to their small molar volumes are insensitive
to pressure Furthermore if the oxidant behaves as an ideal gas its activity can be
assumed equivalent to its partial pressure P0Xidant in the given atmosphere but normalized
to standard pressure [454648] However for significant deviations from ideal gas
behaviour such as in the supercritical regime fugacity must be used in lieu of partial
pressure to accurately quantify gas concentrations Incorporating these simplifications at
equilibrium (AG = 0) Equation 22 can be rearranged to give the dissociation pressure of
19
the oxide Po^S o r the ambient oxygen partial pressure above which oxidation of the
metal is possible
Over a desired temperature range a convenient means to assess the relative
thermodynamic stabilities of various oxides and similarly the products of other
metalnon-metal reactions is with the use of an Ellingham diagram [45-48] An
Ellingham diagram in its simplest form plots AGdeg per mole of oxidant consumed as a
function of temperature Apart from the noble metals and away from extreme
temperature metals are naturally disposed to oxide formation [46] and Equation 21
consequently proceeds from left to right Increasingly negative values of AGdeg -
tantamount to moving from the top to bottom of the diagram - are indicative of the
difficulty in which an oxide can be reduced [45-48] ie its thermodynamic stability
Regarding alloys the Ellingham diagram provides initial insight into which constituent
elements oxidation will predominate and thus which phase diagram to use to describe
the variation in oxide structure [47] Figure 2-5 shows both Cr2Cgt3 and AI2O3 curves to
fall below that of nickel(II) oxide (NiO) explaining why in nickel-base superalloys a NiO
oxide layer is not favoured at least not for the long term Also noteworthy of Figure 2-5
are the partial pressure nomograms or ancillary scales surrounding the Ellingham
diagram These nomograms give the dissociation pressure of the oxide either directly by
P0 2 or indirectly via the equilibrium ratio of carbon monoxide (CO) to CO2 for the
following reaction
20
C 0 2 ( g ) ~ C O ( g ) + - 0 2 ( g ) (24)
What can be concluded from either nomogram is that the formation of Cr2Cgt3 and AI2O3
are very difficult to prevent [46] - at 550degC Cr203 and the more thermodynamically
stable AI2O3 need PQ2 of only 1038 atm and 1060atm respectively to form
PcoPco2 10- io^ s io- 0 io-9 io-8 io-7 10-8 10-5 10-4
o o E
laquolaquogt
c
II
lt3 -3
I J
o
OK
u
- 1 0 0
- 2 0 0
-300
-400
-500
-600
-700
-800
-900
1000
1100
1200 c
laquo bull
^
9 S J
^
O j
fTTsM2deg
4ampU+
-|3flts
of ^r^^
^
5^
H
j j S amp S ^ ^
=hltdeg
degA 2^
^
^^
i 2 r
yf
on
M
M
c
i deg -
oj
M
temperature degC
200 400
Pa DP( o2
3^2
M |MJ
y gt ^ i
M
lt ^ fit
J S gt
tf8deg2
^e 0
r2gtf w
B(
cU
M
[hj
bdquodegraquo-
lt 7 o r f ^ M
M mdash c o = cos
M
3
B
1M
wi Melting point or metal
m Melting point ot oxide
600 800 1000 1200 1400 1600 mo-m o-K w^ i o - 4 2 i o - M
1 0 - 1 mdash
t o - 2 -
1 0 - 3 mdash
10 - 4 -mdash
l O 6 - ^
1 0 - ^
1 0 1 ^
io - i ^
10 1 ^
10-
10
1 0
1024
io-2 b
N io-2deg
1 0 M
S I O -
1 0 4
1Q-1
1 0
10
10
10
101
Figure 2-5 Ellingham diagram for the oxidation of selected metals [47]
21
2212 Kinetics of Oxide Formation and Growth
The mechanisms and rates of oxide evolution are as equally important as the
underlying thermodynamics in terms of the level of protection that an oxide layer will
impart to its substrate At elevated temperature metallic oxides can typically be
classified as non-stoichiometric ionic compounds meaning that their metal-to-oxygen
atom ratio differs slightly from what their chemical formula would imply Point defects -
vacancies on cationic (Mn+) and anionic (O2) sub-lattices and ions occupying interstitial
positions - allow for such deviations from stoichiometric composition and in conjunction
with electronic defects preserve the overall electrical neutrality of the oxide [4647]
Free electrons and electron holes (higher valency cations) constitute these electronic
defects and give the metallic oxide either a negative-type (n-type) for the former or a
positive-type (p-type) for the latter semiconductive behaviour [49] Figure 2-6
distinguishes between the two semiconductor types showing either a metal excess or
oxygen deficit for an n-type oxide (Figure 2-6a) and a metal deficit or oxygen excess for
a p-type oxide (Figure 2-6b)
M2+ O2
e O2 M2+
M2+
M2+ O2
e O2- M2+
e M2+ O2
M2+
O2
M2+
O2
M2+
O2 M2+
M2+
M2+ O2
bull M 2 +
M2+ O2
M+
O2 M2+
M2+ O2
O2 M3+
M2+ O2
o2-O2- M2+
M3+ O2
M2+
O2
M2+
O2
M2+
O2 M3+
bull o2
O2 M2+
M3+ O2
M+
O2 M2+
(a) (b)
Figure 2-6 Lattice defects typical of (a) n-type and (b) p-type oxides Interstitial species represent excesses and sub-lattice vacancies represent deficiencies
Adapted from [47]
22
Together the crystalline and electronic defects previously described are for the
most part responsible for oxide growth via diffusion a phase boundary process such as
the dissociation and adsorption of a molecular oxidant establishes the other principal
growth mechanism [48] Depending on the mechanism and ambient temperature
oxidation kinetics may conform to one or some combination of the linear parabolic and
logarithmic rate laws and can be easily measured by a change in mass per unit area f mdashJ
[45-48] A simplified representation of high temperature oxidation in which the rate
controlling step transitions first from a phase boundary process to ionic and electronic
diffusion through the growing oxide layer is illustrated below in Figure 2-7
o2(g) O 0 O 0 0
o2(g)
Metal
i- r-r
Metal
0 oT
Metal To m e
o T o Metal
MOx(g) 02(g)
f yfi^f ol To
Metal
(a) (b) (c) (d) (e)
Figure 2-7 Evolution of a metallic oxide layer at high temperature (a) metal-oxidant reaction at the metal surface (b) nucleation of a thin oxide film (c) oxide film growth controlled by diffusion (d) possible emergence of oxide layer defects and separation
from the metal substrate and (e) subsequent loss of protectiveness Reproduced from [46]
Initially (Figure 2-7a) O2 molecules collide with and are adsorbed on the metal
surface Islands of oxide then rapidly develop (Figure 2-7b) in accordance with Equation
21 and spread laterally over the metal until a continuous thin layer forms Chemical and
electrical potential gradients are established across this layer and in conjunction with the
intrinsic crystalline defects of the oxide promote the diffusion of ions and electrons
23
through it (Figure 2-7c) As a result the thickness of this oxide layer increases with its
direction of growth - either inward from the metal-oxide interface or outward from the
oxide-gas interface - contingent on whether anion or cation migration is favoured
[4648] A complete understanding behind oxide transport properties is beyond the scope
of this review but can be found in either Shreir [46] Birks et al [47] or Toft Sorensen
[49] Micro voids and cracks may begin to appear within the oxide layer (Figure 2-7d) as
a means to alleviate or redistribute stresses induced during growth or from thermal
exposure If these cracks propagate completely through its thickness (breakaway
oxidation) or the oxide is easily vaporized virgin metal is once again exposed leading to
further metal attack (Figure 2-7e) [4648]
The preceding oxidation process exemplifies linear (during initial formation and
potentially again if the oxide layer fails) and parabolic (when solid-state diffusion
predominates) rate behaviour with both rate equations and their combination along with
the logarithmic rate equation plotted in Figure 2-8 Of these three elementary rate
equations only the linear reaction rate remains constant with time and thus independent
of oxide thickness [45] Oxide growth or loss (eg volatilization) consistent with linear
behaviour is likely related to a phase boundary process [46] and may be represented by
where kz and t denote the linear rate constant and time respectively
Protective barriers form when oxidation kinetics follow either a parabolic
^)-kpt + C (26)
24
or logarithmic time dependence
(^-) = klog-log(t + t0)+A (27)
where kp kiog C t0 and A all represent constants In each case reaction rates tend to
decrease and stabilize with the progression of time The logarithmic rate equation
however is usually only applicable to the low temperature (lt 400degC) oxidation of metals
and is often difficult to substantiate with a single growth mechanism [47]
ro O
E
Time
Figure 2-8 Common oxidation rate laws with the associated protective (P) temporarily protective (TP) or non-protective (NP) behaviour noted in parentheses
Using the applicable molar volume molar mass and composition of the oxide
together with the measured change in specimen mass the ordinate of Figure 2-8 can be
just as easily transformed into either the oxide thickness or the depth of metal
penetration In fact the volumetric ratio of oxide produced to metal consumed - termed
the Pilling-Bedworth ratio (PBR) - serves as a preliminary assessor of the protectiveness
of a given oxide layer A PBR less than unity is generally indicative of a porous oxide
layer or one that fails to fully cover the metal surface Conversely a compact and
Parabolic (P)
Logarithmic (P)
25
protective oxide layer is assumed to form when the PBR exceeds unity although an
accumulation of compressive growth stresses could lead to unwanted cracking and
spallation [46-48] Other factors however such as the oxide-substrate adherence must
ultimately be considered when quantifying the protection of an oxide layer
2213 Desired High Temperature Oxide Scales
Up to 900degC the attractiveness of both Cr203 and AI2O3 oxide scales is not only
attributed to their thermodynamic stability but also to their slow growth rates and low
coefficients of thermal expansion [46-48] Chromia however becomes increasingly
susceptible to oxidation above 900degC and at high P 0 2 resulting in the formation of
volatile chromium trioxide (CrOs)
Cr 2 0 3 (s) + ^02 (g) -raquo 2Cr03 (g) (28)
A competing effort between the evaporation of Cr03 and ionic diffusion through the
thinner Cr203 oxide layer leads to an overall increase in oxidation rate [4647]
Figure 2-9 summarizes the parabolic oxidation rate constants of amp2O3 and AI2O3 in
addition to the base metals that form the three superalloy classes as a function of
temperature For the hatched region defining the oxidation kinetics of amp2O3 a sharp
increase in slope of its lower bound marks the abovementioned effect of Cr03 formation
While amp2O3 may lack the extreme thermal stability of AI2O3 it does have a
rhombohedral crystal structure identical to that of (X-AI2O3 the most stable polymorph of
AI2O3 All other metastable or transition phases y- 5- and 0-AI2O3 being the most
common eventually transform to (X-AI2O3 when heated above a critical temperature The
26
magnitude of this temperature and also the rate of phase transformation are largely
influenced by the base metal of an alloy alloying additions such as the rare earths (RE)
Cr and Ti and the presence of an isotypic phase [50] In a binary alloy system
consisting of a nickel base and either chromium or aluminium as the solute element
considerable solute content - at least 18 wt Cr or 17 wt Al - is required to preclude
internal oxidation and the formation of complex less protective spinel Ni(CrAl)204
oxides When both elements are combined to form an alloy of Ni-Cr-Al composition
protective AI2O3 oxide scales can be achieved with Al contents as low as 5 wt due in
part to the gettering effect of chromium [4647] Figure 2-10 characterizes the transient
to steady-state oxidation of a Ni-Cr-Al alloy with time
10 5
T(degC) 1200 1100 1000 900 800 700 600
9 10
104T(K1)
Figure 2-9 Parabolic oxidation rate constants for metals pertinent to superalloy composition as a function of temperature Reproduced from [46]
(a)
(b)
(c)
S NiO S NiO S
Alloy
S | N I O | S gt J I O | S
Alloy
NiO
O0O0O0O0O0O0O
A l l Al ldegy TCr
0 2
(d)
bull Cr20
NiO
Alloy | Al
2 ^ 3 o AI2O3 Ni(CrAI)204
27
Figure 2-10 Oxide scale development on a Ni-Cr-Al alloy (a) nickel-rich oxides appear first at the alloy-gas interface (b) lower oxygen activity beneath the external scale
promotes discontinuous Cr203 and AI2O3 formation (c) continuous Cr203 and (d) finally AI2O3 subscales result with the progression of time Reproduced from [47]
The abundance of nickel in the alloy initially encourages the formation of oxides
that are predominantly nickel-based - NiO and Ni(CrAl)204 - at the alloy-gas interface
(Figure 2-10a) Internal isolated pockets of Q2O3 and AI2O3 develop below this nickel-
based external scale (Figure 2-10b) on account of their thermodynamic stability at lower
oxygen activities With sufficient Cr content a continuous Q2O3 subscale ensues
(Figure 2-10c) further decreasing oxygen activity within the alloy and blocking previous
diffusion paths to the surface Given enough time AI2O3 becomes continuous underneath
this duplex scale (Figure 2-10d) and protects the alloy from subsequent oxidation [47]
28
222 Carbonaceous Gas Reactions
When carbon also comprises the oxidant (eg CO2) the high temperature metal-
gas interaction becomes slightly more complex than it would be with O2 alone In
addition to a metallic oxide CO is also formed as a product of the oxidation reaction
For a CO2 atmosphere with trace levels of CO H2 and H2O Gibbs et al [51] and
Pritchard et al [52] have suggested that carbon activity (ac) is controlled by the
disproportionation of CO as per the Boudouard reaction
2CO(g) ~ C (s) + C0 2 (g) (29)
or via the synthesis gas reaction
CO(g) + H2 (g) ~ C (s) + H20(g) (210)
Carbon (C) ingress into an alloy can affect oxide scale formation morphology and
adhesion because of the precipitation of carbides (carburization) [5354] as well as
disintegrate the alloy entirely (metal dusting) if the local ac is high enough [5556] This
section summarizes carburization (ac lt 1) and metal dusting (ac gt 1) mechanisms as
applicable to nickel-base superalloys in addition to what is done to protect against carbon
attack
2221 Carburization (ac lt 1)
Binary metallic carbides (MxCy) are just as easily formed as oxides assuming that
the ambient carbon activity supports the metal-carbon reaction [4557] With the same
thermodynamic concepts outlined in Section 2211 also applicable to carbide formation
an Ellingham diagram can be constructed to represent the comparative temperature-
dependent stabilities of assorted carbides Such a diagram is shown in Figure 2
metallic carbides specific to nickel-base superalloy compositions
copy p 150 cOj t t
Cor boo activity
tobe 40-00
Figure 2-11 Ellingham diagram for transition metal carbides [57]
30
In the absence of a protective oxide layer nickel and by extension its alloys are
catalytic to the carbon-producing reactions described by Equations 29 and 210 [53]
Thus carbon atoms adsorb on the exposed surface and facilitated by the disinclination of
nickel carbide (NisC) to precipitate (AG gt 0) diffuse into the nickel matrix The ensuing
metal-carbon reaction produces internal Cr and to a lesser extent other refractory
carbides that nucleate both at grain boundaries and within the grains themselves [5458]
Chromium-based carbides (Q23C6 Cr7C3 and Cr3C2) however can be particularly
harmful to an alloy that relies on the formation of a C^Ch scale for protection against
metal attack these carbides consume Cr from the nickel matrix that would otherwise be
used to form the protective oxide layer [45] A stability diagram for a Cr-O-C system at
620degC is depicted in Figure 2-12 and shows that carbide formation only becomes
preferential with extremely low oxygen partial pressures ie PQ2 lt 10 atm
Carbide morphology - controlled by the gaseous carbon activity exposure
temperature and alloy composition - obviously has a direct bearing on how carburization
will affect mechanical properties at service conditions [5354] Creep-rupture life for
example may be slightly improved with the precipitation of finely dispersed carbides
(low temperature and ac) or severely impaired by the formation of continuous carbide
films at the grain boundaries (high temperature and ac) [45] The effect of carburization
on room temperature mechanical properties however is almost always deleterious
regardless of carbide morphology [59] Figure 2-13 reveals significant decreases in both
tensile strength and ductility with increasing carbon content for two nickel-base
superalloys at room temperature pre-carburization data is included for contrast
-14 -12 -10
Log PCo2Pco
- 6 - 4 - 2 0 2 4 6 10 12 U
0
-2
-4
o -6 TO
-10
-12
-14
-16
I I I I I
Cr3C2(s)
Cr7C3(s)
_ Cr23C6(s)
-
Cr(s)
i i i
i i i i
Cl~ 1 -bull)
i i i
i i i i
Cr203(s)
i i i
i
-
-
-
i i
0
-2
-4
-6
-8
-10
-12
-14
-16
o o p_
O O
Q U) o
_ l
-50 -45 -40 -35 -30 -25 -20 - 1 5 - 1 0 - 5 0 5
Log Po2 (atm)
ure 2-12 Stability diagram for the Cr-O-C system at 620degC Reproduced from [45]
en c
pound
Si gt-5
a
pound
1000
soo
600
iOO
60
40
20
0
- mdash | mdash mdash mdash r
Ni-Cr-W
coarse
mdash-fmdashI 1 h - r Romge of data for solution -
bull ^ treated specimens and for spea---
J mens aged at i 950C
- J mdash J j mdash j -
HastelloyXR
I I I I I
Q-ltltin Oi 08 0 04 08
Carbon Content
Figure 2-13 Effect of carburization on room temperature mechanical properties of nickel-base superalloys [59]
32
2222 Metal Dusting (ac gt 1)
Metal dusting or catastrophic carburization occurs when susceptible materials -
coincidentally the base metals of superalloys - are exposed to gaseous carbon activities
greater than unity at temperatures between 400 and 800degC [4555] Graphite nucleation
and growth on or within these alloys is favoured because of the carbon-supersaturated
environment and inevitably leads to their destruction The subsequent corrosion product
(termed coke) consists of disintegrated metal and graphitic carbon in addition to oxides
and carbides depending on the alloy composition [5355] Figure 2-14 provides a
schematic representation of the metal dusting phenomenon for a C^Oyforming nickel-
base alloy
Carbon dissolution into a nickel-base alloy (Figure 2-14a) initiates at a defect or
void in its protective C^Ch oxide layer and accordingly a zone of finely dispersed
internal carbides (M7C3 and M23C6) develops beneath it (Figure 2-14b) Until now metal
dusting and carburization mechanisms are identical What differentiates the two beyond
this point is that the higher ac associated with metal dusting allows this carbide zone to
become supersaturated with carbon over time Graphite nucleates on the still-exposed
substrate surface assuming the oxide layer was unable to properly heal and grows
inward into the carbon-rich zone and dendritically along surrounding grain boundaries
(Figure 2-14c) Moreover metal grains encapsulated by graphite tend to separate from
the bulk metal because of the compressive stresses attributed to an expansion in volume
The outward growth of coke (Figure 2-14d) results in the uptake of metal carbides and
oxides from the substrate leaving behind hemispherical pits when it breaks away [5560]
33
Cr20 j M7C3 Internal carbides
Figure 2-14 Metal dusting mechanism of a Cr203-forming nickel-base alloy (a) carbon diffusion into the substrate initiated at C^C^ scale defect (b) formation of internal
carbides (M7C3 and M23C6) and local carbon-supersaturation of substrate (c) graphite nucleation and inward growth and (d) outgrowth of coke corrosion product
Reproduced from [55]
2223 Protection Against Carbon Attack
Carbon attack is prevented or at the very least hindered by the application or
formation of a barrier impervious to carbon diffusion such as a coating system or oxide
scale [58] or the introduction of gaseous hydrogen sulphide (H2S) [4555] into the
process environment The low carbon solubility in C^Cb and AI2O3 scales as well as Cr-
and Al-based coatings makes them ideal candidates for carbon barriers assuming that
they remain adherent to the substrate and free of porosity Protection imparted by
34
sulphur is slightly different from the former mechanism given that sulphur atoms adsorb
on the alloy surface and interfere with carbon-releasing reactions directly rather than
establish a protective barrier [4555] Too high a sulphur content in the process
environment though can also be harmful and lead to degradation by sulphidation
223 Erosion-Corrosion
Since most practical gaseous environments contain suspended particles erosion-
corrosion can be regarded as the most realistic of all the high temperature corrosion
modes Under that same rationale however the simultaneous surface degradation by both
mechanical and chemical means gives erosion-corrosion the potential to be one of the
most aggressive modes as well [45] Erosion for the context of this discussion applies
only to surface degradation by solid particle impingement and not by tribological
(friction) wear or cavitation This section first gives a brief overview on the mechanisms
of erosion and concludes with a description of the established erosion-corrosion regimes
2231 Mechanisms of Erosion
Erosion mechanisms broadly correspond to either the ability (ductile response) or
inability (brittle response) of a surface to absorb and dissipate the kinetic energy of an
impinging particle [61-63] At high temperature metals will most always exhibit a
ductile response a stark contrast to the brittle nature of such corrosion products as oxide
scales and coke deposits Figure 2-15 shows erosion mechanisms for both ductile and
brittle materials in response to a particle impact The ductile mechanism can be further
35
expanded to illustrate what effect impact angle (the angle measured from the surface to
the particles trajectory) and particle velocity have on surface degradation Other
contributing factors to the erosion rate of a material include the size shape hardness and
mass flux of the erodent [61]
DUCTILE RESPONSE
(a)
Low angle
BRITTLE RESPONSE
(c) High medi
angle ^ um speed V jWmdashgt Flake
formation
(d)
High ang leM- high speed
Melting J~ r ^ p
o O
Figure 2-15 Erosion mechanisms for ductile and brittle materials (a) low angle surface abrasion (b) high angle low velocity surface fatigue (c) excessive plastic deformation at
high angle medium velocity (d) surface melting due to high velocity impact and (e) brittle fracture Adapted from [61]
36
At low impact angles and above a threshold particle velocity the erodent cuts into
the surface of a ductile material (Figure 2-15a) of lesser or equal hardness Surface
gouging and subsequent material loss only intensify as particle velocity is increased
although this relationship between erosion rate and velocity is not shown explicitly in
Figure 2-15 As the impact angle approaches 90 degrees surface damage attributed to
particle impingement transitions from channels or grooves to impact craters At low
velocity but high impact angle plastic deformation is minimal yet the repetitive
bombardment of erodent produces highly localized surface fractures and ultimately leads
to fatigue (Figure 2-15b) Plastic deformation becomes increasingly exaggerated (Figure
2-15c) as does surface melting and re-solidification (Figure 2-15d) with even greater
particle velocities [61] However unlike the ductile mechanism of erosion the brittle
response to particle impact is characterized by negligible plastic deformation the
coalescence of subsurface cracks and subsequent spallation (Figure 2-15e) are
responsible for material removal [63]
Ductile and brittle erosion responses are typified in Figure 2-16 as a function of
impact angle The erosion rate of a ductile material reaches a maximum when surface
cutting predominates (ie an impact angle between 20 and 30 degrees) and decreases
rapidly as the particle trajectory becomes normal to the surface Conversely for a brittle
material the maximum erosion rate occurs when the particle impacts the surface at
90 degrees [6263] Furthermore overall erosion resistance is specific to the material and
not to the controlling erosion mechanism ie AI2O3 (brittle) is superior to both annealed
aluminum (ductile) and graphite (brittle) in terms of erosion resistance [61]
37
LU h -lt DC
O CD O DC LU
IMPACT ANGLE ((3)
Figure 2-16 Effect of particle impact angle on the erosion rate of ductile and brittle materials
2232 High Temperature Corrosion Interaction
Depending on the relative intensities of erosion and corrosion their combined
effect on surface degradation can be categorized into one of four regimes These regimes
are represented schematically in Figure 2-17 and listed in order of increasing erosion rate
or decreasing corrosion rate include pure corrosion erosion-enhanced corrosion
oxidation-affected erosion and pure erosion For each regime (excluding pure erosion)
diffusion-controlled oxidation is assumed to be the dominant corrosion process [64]
The pure corrosion regime as its name would imply is unaffected by the presence
of an erodent Only in the erosion-enhanced regime does the synergistic effect of erosive
and corrosive processes on surface attack first become obvious Moreover this regime
itself encompasses three unique modes - termed types I II and III - of erosion-corrosion
DUCTILE RESPONSE
38
interaction For type I erosion-enhanced corrosion erosive thinning of the oxide scale
leads to an overall increase in oxidation rate However an eventual balance between
erosion and oxidation rates is established and the scale thickness remains constant In
some instances scale thickness may actually increase because of particle impingement a
feature typical of type II erosion-enhanced corrosion Rishel et al [64] has postulated
this behaviour to be a result of one or both of the following mechanisms (i) elements
(eg Al) that would otherwise selectively oxidize and form slow growing protective
oxides scales (eg AI2O3) are removed from the matrix by the erodent or (ii) the number
of short-circuit diffusion pathways in the oxide scale are increased by impact-induced
cracking Lastly type III erosion-enhanced corrosion can be viewed upon as an
extension of type I except that both the intensity and irregularity (either in particle size or
impact frequency) of erosion have increased the oxide scale becomes incoherent
allowing the erodent to now deform the substrate [64]
When erosion prevails over corrosion to become the dominant mode of surface
degradation the oxidation-affected erosion regime is befitting to describe the erosion-
corrosion interaction Successive particle impacts occur and remove material much faster
than the oxide scale can grow laterally over the exposed substrate Consequently a
complex conglomerate of corrosion product erodent and metal develops in lieu of the
oxide scale The final erosion-corrosion regime - the pure erosion regime - occurs in the
absence of an oxidant or at temperatures too low to facilitate scale formation [4764]
Metal recession therefore proceeds according to the ductile erosion response presented in
Section 2231
39
E R O S 1
O N
R A T E
C 0 R R O S 1
o N
R A T E
NO CORR
METAL
SPALLS
A
METAL
COMPOSITE LAYER
METAL
METAL
EROSION OF OXIDE
ONLY
TYPE II
EROSION ENHANCED
CORROSION
TYPE I
TYPE II
OXIDATION AFFECTED EROSION
I
EROSION OF METAL ONLY
Figure 2-17 Erosion-corrosion interaction regimes Adapted from [64]
23 High Temperature Corrosion Testing
Ideally high temperature corrosion testing would be carried out in the intended
service environment to give the most meaningful material response However when
such a task proves impractical frequently because of the costs or safety implications
involved laboratory corrosion test rigs serve as effective alternatives in which to
approximate service conditions [65] Additionally the control afforded by laboratory test
40
rigs over such process variables as temperature pressure flowrate environmental
composition exposure time and entrained particulate allows for a methodological
approach in determining how each will influence corrosion behaviour Very rarely
though if ever are the quantitative results (eg corrosion rates) obtained through
laboratory testing directly exchangeable with the real-world application instead these
results help to rank and identify suitable candidate materials [6566] This section will
discuss laboratory corrosion test rigs as related to high temperature (purposely gas
turbine) applications and summarize the autoclave-based S-CO2 corrosion systems that
have been built to date
231 Erosion-Corrosion Rig Testing
Erosion-corrosion test rigs capable of producing intermediate to high velocity
particle impacts at elevated temperature can be classified into one of two groups the
rotating-type or the blast-type [67] These groups coincide with how contact between the
specimen(s) and erodent (typically silicon dioxide AI2O3 or ash) is initiated - either
indirectly from the rotary action of a motor or from particles entrained within the gas
itself [6768] Despite their obvious differences in operation the main components
comprising each type of erosion-corrosion test rig are essentially the same a unit to hold
erodent either in the form of a hopper or fluidized bed and subsequent system to collect
it a gas-particle mixer and a test chamber which is usually enclosed by a furnace
41
2311 Rotating-Type Rigs
The rotating-type class of erosion-corrosion test rigs whose negligible gas
velocities make them apposite to testing in harsh gas compositions include the whirling
arm [69] and centrifugal designs [68] Both designs can also accommodate multiple
specimens simultaneously allowing for time-efficient testing of different materials under
identical conditions or one material at various impingement angles
Even when compared to its centrifugal counterpart the whirling arm test rig is
unique because the erodent in addition to the corrosive gas remains effectively static
relative to a stationary reference frame Specimens are mounted to an arm or holder
which in turn is rotated though a fluidized bed or stream to encourage particle
interaction [67] Accordingly the particle impact velocity (limited to approximately
30 ms) becomes a function of the rotational speed of the arm and at what radial distance
the specimens are mounted from its axis of rotation [69] A process flow diagram of a
whirling arm test rig used in high-sulphur low-oxygen environments is shown in
Figure 2-18 although other gaseous compositions could be easily interchanged
Centrifugal erosion-corrosion rigs as depicted in Figure 2-19 use a centrally-
located rotating nozzle to eject erodent at specimens Specimens are positioned to
encircle the perforated base of the nozzle and particle impact velocity analogous to the
rotating arm design is governed by its rotational speed [68] Impact velocities and
loading rates of up to 200 ms and 06 kgm2s respectively are possible with the
centrifugal rig but quantifying the total mass of erodent that has impacted with the
specimens becomes convoluted if various impingement angles are tested at once [67]
42
H gt
r Waste gas
Fluid izsd
V Direction of gas flow
bull J Nitrogen
Figure 2-18 Whirling arm erosion-corrosion test rig [69]
Pariide feed nozzle
Rotating (g) Vjirsction
Partltd9 - ~~Zygt Rotating nozzle
Test p i e c a - ^ s ^ f ^ F Heater -
Particle flying dradion
Partcte Particles _ feed nozzle Rotating
l ~J~- - noHte
Heater (insWe)
Test piece (20x50)
Figure 2-19 Centrifugal erosion-corrosion test rig [68]
43
2312 Blast-Type Rigs
Erosion-corrosion test rigs utilizing pressurized gas to accelerate the erodent
represent the most common configuration used at research institutions and in industry due
to their simple construction and inexpensive operation [67] Regardless of their
prevalence gas jet and high velocity rigs are not capable of the same degree of particle
velocity uniformity that can be achieved with the rotating-type designs
For the gas jet blast-type test rig the erodent is introduced to a pressurized reactive
gas accelerated via aerodynamic drag force through a convergent nozzle and accelerator
tube and directed at a single specimen or stage of specimens [7071] A schematic
representation of such a rig is provided in Figure 2-20 Contrary to the rotating-type rigs
particle velocity - typically limited to 40 ms [67] - is dictated by the pressure
differential established between the gas carrier and the test chamber as well as the length
and diameter of the accelerator tube to a lesser extent both particle size and shape in
addition to the temperature at the accelerator tube outlet also influence particle velocity
[71] The reactive gas stream may also be supplied from the exhaust of a combustor
(referred to as a burner rig in this arrangement) with erodent injected into the attendant
air or fuel supply prior to combustion or into the exhaust gas stream following
combustion [67] Likewise burner rigs are imperative to the study of hot corrosion
mechanisms and understanding the deposition behaviour of molten salts
High velocity high temperature wind tunnels draw many parallels to the gas jet
blast-type test rigs but on a much larger scale Erodent is typically injected far upstream
of the test specimen(s) and accelerated by the high velocity gas in a constant area duct
44
The outcome is an erodent-laden gas stream spanning the entire cross-section of the duct
which acts to preserve the aerodynamic characteristics of the fluid field [71] ie the
erosion-corrosion interaction is more representative of what would be seen in service as
opposed to that induced by a localized gas jet Compared to high velocity burner rigs the
wind tunnel configuration can achieve comparable particle velocities (approximately
300 ms) at similar test temperatures (1100degC) but only at a fraction of the operating cost
[67] Figure 2-21 illustrates a wind tunnel erosion-corrosion test rig whose gas stream is
supplied by the exhaust of a can combustor
Particle inflow
MmifM chamber heater
G as laquoHef
Specimen Wdr
Mixing chamber
Nozzle Uoxlk heater Speamen chamber
irnen
Specimen chamber tartar
Copplaquof electrode
Figure 2-20 Gas jet erosion-corrosion test rig [72]
45
( A I R SUPPLY ( I )
XL FUEL
PARTICLE mdash 4 INJECTQS
bullbull PROPANE IGNITER laquo COMBUSTOS (C)
STCAK
ACCELEF-ATION TUNNEL ( F)
^ EXHAUST
J-
SECONDARY a AIR
PARTICLE FEEOtR
( A )
EXHAUST TANK (H)
Figure 2-21 Wind tunnel-type erosion-corrosion test rig [67]
232 Autoclave Testing
High temperature autoclave test systems emphasize the chemical rather than the
mechanical response to the simulated service environment and therefore have no cause
to accelerate erodent and generate high velocity impingements Whether these systems
are intended to be operated under static once-through or recirculating conditions each
will employ some form of a metallic usually cylindrical pressure vessel [65] either to
hold test specimens or to function as one (in the case of a pipe) Here the inclusion of a
pressure vessel permits corrosion studies to be conducted well above standard pressure
something that most erosion-corrosion test rigs are not capable of Exactly what
46
combination of internal pressure and temperature the vessel can safely be subjected to is
determined by its cross-sectional dimensions and construction material
Pressure vessels used in autoclave corrosion test systems tend to limit their capacity
to between 05 and 50 L to minimize the associated material costs [65] Figure 2-22
shows the general relationship between the internal pressure (P) of a pressure vessel and
the minimum required wall thickness (t) to contain it normalized to the maximum
allowable material stress (omax) and internal radius (rj) respectively Regardless of
whether the internal or external radius of the vessel is fixed wall thickness increases
exponentially in response to increasing internal pressure for the former the vessel can
become quite cumbersome as its pressure approaches amax whereas for the latter internal
volume is significantly reduced Often the overall length of the pressure vessel is
extended to maintain a workable internal volume yet still preserve a sensible external
diameter [65]
0 025 05 075 1
POmax
Figure 2-22 Effect of internal pressure on the minimum required wall thickness for a pressure vessel of circular cross-section
47
Caution should be exercised when selecting the pressure vessel material(s) if the
metal temperature is likely to exceed 550degC Figure 2-23 provides maximum allowable
stress versus temperature curves for alloys used in current fossil boilers and those
expected to be integral to emerging ultra-supercritical water power plants ie materials
which must retain their mechanical properties (eg creep-rupture strength and fracture
toughness) at intermediate to high temperatures while at the same time resist corrosive
attack As expected nickel-based alloys outperform both ferritic and austenitic stainless
steels at these service temperatures and are fit to serve as either the shell or seal material
for a pressure vessel By contrast non-metallic seal materials such as elastomers and
plastics are generally ill-suited for high pressure applications and also degrade rapidly
between 150 and 250degC [73] Particularly aggressive test environments may even
warrant the application of a compatible ceramic liner to the bore of the pressure vessel
[65]
800 900 1000 1100 1200 1300 1400 1500 1600 1700 Temperature (dF)
Figure 2-23 Stress-temperature curves for high temperature boiler materials [74]
48
2321 S-C02 Corrosion Test Rigs
The majority of S-CO2 corrosion test rigs (and exclusively those with high
temperature capabilities) have just recently emerged with the advent of S-CO2 Brayton
cycles earlier corrosion test rigs evolved when S-CO2 was being considered for oil
recovery endeavours [23] and as an industrial solvent [24] All S-CO2 test rigs however
at least those published in open literature have been based on the autoclave design (either
at static or low flowing conditions) and exist or once existed at the following institutions
the Chevron Oil Field Research Company [23] Sandia National Laboratories [24] Idaho
National Laboratory (INL) [11] Tokyo Institute of Technology [3375] Massachusetts
Institute of Technology (MIT) [34353876] University of Wisconsin-Madison
(UW-Madison) [36] and the Commissariat a lEnergie Atomique (CEA) [37] Only
Sridharan of UW-Madison has initiated the development of a test loop to investigate
flow-assisted corrosion mechanisms in high temperature S-CO2 environments [77] This
section will review the S-CO2 corrosion facilities listed above in chronological order
One of the earliest references to a test rig dedicated to studying material
compatibility with S-CO2 originated at the Chevron Oil Field Research Company shortly
before 1972 [23] A novel enhanced oil recovery effort at the time Chevron proposed to
inject high pressure CO2 (165 MPa) into spent wells to restore reservoir pressure hence
the construction of a laboratory corrosion test rig was necessitated to replicate the
conditions that would be encountered within these CO2 pipelines As depicted in Figure
2-24 the Chevron test rig consisted of three pressure vessels - large enough to
accommodate test specimens 3048 mm (120 in) in diameter - which were arranged to
49
form two independent recirculating test loops Together an air-driven gas booster pump
and nitrogen-charged accumulator delivered dry CO2 (at 139 MPa) to both loops where
it was heated and then circulated at fluid velocities of 762 to 1016 mmmin (300 to 400
inmin) Provisions in the overall design also allowed for impurity species such as water
and H2S to be easily incorporated into the S-CO2 if so desired Each test loop however
was limited to just 173 MPa - in fact safety relief valves and rupture discs would
activate at 153 and 160 MPa respectively to protect against inadvertent over-
pressurization - and could only reach a maximum temperature of 54degC
v l VIB ~ FUU-FIOW 8ALI VALVES SWF laquo 1MB PSi v3 VSI = SOFT SEATING VALVES W 6006 11
V91 4 SKUt QFf VALVt FOB AIR SWP ISO PSi
Figure 2-24 Chevron Oil Field Research Company S-CO2 corrosion test rig [23]
In 1994 Sandia National Laboratories designed and assembled a static
S-CO2 corrosion test rig to complement research related to using S-CO2 as an industrial
solvent [24] A process flow diagram of the Sandia design is shown in Figure 2-25
Compression to the desired CO2 test pressure (242 MPa) was achieved using a two-
50
stage gas booster pump arrangement to prevent or at the very least minimize problems
(pump hesitation and surging) associated with a low CO2 supply pressure Specimens
were suspended from a glass support stand inside an 18 L sample vessel which because
of the temperature-controlled water bath used to heat it was inherently limited to
temperatures under 100degC (ie the boiling point of water at standard pressure) Upon
depressurization of the sample vessel to atmosphere a 10 L recovery vessel acted as an
intermediary to collect co-solvent (eg water and other alcohols) that would condense as
the solubility in CO2 decreased with pressure The entire corrosion test system -
including both sample and recovery vessels as well as the tubing and fittings - was
fabricated from 316-grade stainless steel (316-SS) and ultimately restricted to test
pressures below 346 MPa
Desiccant Molecular Sieve
M
k 4 Pump
co2
Check Valve
Vent to fume hood
Temp controlled sample vessel
Recovery vessel
Figure 2-25 Sandia National Laboratories S-C02 corrosion test rig [24]
Between 2002 and 2005 the INL conducted an extensive research initiative to
develop a S-CO2 Brayton cycle that could be applied to the VHTR [11] Two test rigs
were created as part of this initiative that would mark the beginning of a series of high
temperature S-CO2 corrosion test rigs The first corrosion test rig while somewhat
51
unconventional in its configuration used water-cooled connections to convert a tubular
test specimen into a functioning segment of high pressure pipe Figure 2-26 shows a
schematic of this initial design with the test specimen supplied with CO2 from a high
precision syringe pump and surrounded by a resistance tube furnace In using the water-
cooled connections the ends of the specimen were kept at a considerably lower
temperature than its center adding axial-varying thermal stresses to the mechanical
stresses already induced at the bore Test conditions (ie pressure and temperature) were
specific to the specimen material even though this once-through test rig was capable of
delivering CO2 at 210 MPa and 25 mLmin and heating it to 1100plusmn5degC prior to
throttling to atmosphere
The second corrosion test rig built by the INL was in fact just an adaptation of their
initial design replacing the single tubular test specimen with five thick-walled 304-
grade stainless steel (304-SS) pipes Each pipe measured 12 m (472 in) in length had
an internal diameter (ID) of 11 mm (043 in) and used a wall thickness that could
withstand an internal pressure of 70 MPa at 1000degC for 10000 hours Multiple
specimens could be inserted into these pipes and tested simultaneously although the use
of 304-SS at elevated temperature left them prone to creep and in one instance resulted in
a rupture Figure 2-27 illustrates the layout of this corrosion test rig complete with a gas
sampling system (a mass spectrometer as well as O2 and COCO2 meters) and confirms
its likeness to its predecessor Both corrosion test rigs have since been decommissioned
following the conclusion of this S-CO2 initiative
52
To Vent
C02
Control Valve
bull Q
Back Pressure Regulator
TC Pump
o A A A A A A A A A A t -CXmdashraquobull Relief Valve
Prc-heater
Resistance Furnace
Heater
A A A
Water cooled seals attached to ends of test tube
V V s Vent to Atmosphere
Figure 2-26 INL single specimen S-CO2 corrosion test rig Adapted from [11]
Pressure Relief Valve
Preheat Tube RfC] Furnace
Cooling Water ( p) fp
It
ffffl pound Filter
(mdash1X1--Xh-
f
DP
Tube Heater
rwww^ mdashIXt-
V4 Header I I High Pressure Pump Test Sections
Corrosion Section 1000degC
T ) ( P
Yi Header
copy Vent 1 Rotameter bull
0 reg
O Meter
LrmdashImdashJ -1X1mdashI
Mass Spec
C0 2
Meter
C02 C02
Figure 2-27 INL multi-specimen S-CO2 corrosion test rig Adapted from [11]
53
Almost concurrent with the INL initiative the Tokyo Institute of Technology in
collaboration with the Japanese Atomic Energy Agency (JAEA) began the first stage of a
very similar advanced energy system project in 2003 The main objective of this project
was to verify the performance and system design of a S-CO2 Brayton cycle for use with a
fast breeder reactor (FBR) [75] In addition to the compressor and heat recovery test
loops that resulted a high temperature S-CO2 corrosion test rig was also developed to
investigate the corrosion resistance of 316-SS and 12-chromium steels This corrosion
test rig largely mirrored the multi-specimen design produced by the INL but as depicted
in Figure 2-28 was modified to function as a recirculating system Two gas booster
pumps pressurized a buffer tank to 220 MPa where CO2 was regulated to 200 MPa and
sent to the five corrosion test sections at 12 kghr Spent CO2 was then cooled from a
maximum test temperature of 600degC reduced to 40 MPa and returned to the booster
pumps Test sections in the furnace though measured only 127 mm (05 in) in outer
diameter limiting the cross-sectional size of specimens that they could accept to just
under 4 mm (016 in)
In 2007 researchers at MIT constructed two single vessel S-C02 corrosion test
rigs to expand upon the high temperature corrosion data assembled by both the INL and
Tokyo Institute of Technology [38] As Figures 2-29 and 2-30 would suggest the
general configuration of each test rig was the same apart from the size of and flow path
through their respective pressure vessels a gas booster pump supplied an Inconel-625
(IN-625) pressure vessel with high pressure CO2 where it was heated by a split-tube
furnace and later exhausted to atmosphere at 10 Lhr through a gas bubbler Residual
54
gas analyzers (RGA) integrated into each test rig allowed gas compositions to be
compared both prior to entering and after exiting the pressure vessel although no
discernible difference between the two streams was ever noted
The smaller of the two pressure vessels (Figure 2-29) had an ID of 127 mm
(05 in) measured 3048 mm (120 in) in overall length (1016 mm or 40 in of which
was heated) and was limited on account of the compression ratio of its gas booster
pump to a maximum operating pressure of 125 MPa at 650degC With only one opening
in its shell gas entry and egress was accomplished using 16 mm (00625 in) and 64 mm
(025 in) tubing arranged in such a way that the annulus surrounding the smaller inner
tube delivered fresh CO2 to the vessel while the inner tube itself provided a pathway to
atmosphere Conversely the larger pressure vessel (Figure 2-30) had an ID of 254 mm
(120 in) and measured 152 m (600 in) in length 061 m (240 in) of which was heated
by a three-zone 50 kW furnace While this vessel could according to American Society
of Mechanical Engineers (ASME) standards safely operate at any combination of
pressure and metal temperature up to 270 MPa and 750degC respectively corrosion
studies following its initial commissioning were restricted to below 220 MPa and 700degC
Furthermore both vessels used carbon steel bolts to hold conical IN-625 end seals in
place requiring additional thermal management (internal heat reflectors and heat sinks)
to ensure that the bolts remained below their tempering temperature
W Water bath PH Pre heater RP Rotary pump
BT Buffer tank DP Dew-point hygrometer FM Flowmeter DPG Differential press gauge O2 Oxygen analyzer
Test Sections
Figure 2-28 Tokyo Institute of Technology S-CO2 corrosion test rig Adapted from [33]
Heat Fin Internal Thermocouple
Gas Booster Pump
Compressed Air Supply
RGA
Sample External Train Thermocouple
Gas Bubbler
C0 2 Supply
Figure 2-29 MIT low pressure S-CO2 corrosion test rig Reproduced from [38]
Furnace
56
Helt Sink
CO2 S u p p k
Bleed V a k e
Internal fcternal Thermocouple Thermocouple
Gas Bubbler
Figure 2-30 MIT high pressure S-CO2 corrosion test rig Reproduced from [38]
No later than 2009 the UW-Madison built its own S-CO2 corrosion test rig joining
the likes of the INL Tokyo Institute of Technology and MIT to assess materials that
could be used in S-CO2 power conversion systems [36] As shown in Figure 2-31 this
once-through test system used a syringe pump to deliver CO2 at 00 to 50 gmin to an
IN-625 pressure vessel The pressure vessel which was wrapped with three resistive
heating cords instead of seated within a tube furnace was designed to contain a
maximum test pressure of 269 MPa at 650degC Unlike the previous high temperature
S-CO2 corrosion test rigs though operation of this system was controlled entirely through
a computer
57
ItslSeaMech f~ ) D u m l X l h e I h c t t l m C l tnllmHlk ltbull Cm L SI
Tliroltlc 0 2 miuui liller ]i cj S Ilea Sim ltt t^~^~^ bull l o uit
Inkl m o ilvt
Ik Ule Pres^ I lani
lnla0 2 miLron hlkr
Bottle I
Bottle 2
1 lcnnl IILULI-2
DORtsistnc Ikat
Ettrnil lit utr ] lElt iml Ikilu
Figure 2-31 UW-Madison S-CO2 corrosion test rig Adapted from [36]
The most recent high temperature S-CO2 corrosion test rig was fabricated by the
CEA to support ongoing French research dedicated to the SFR [37] Specimens were
placed in a 10 L 316L-SS agitated pressure vessel that could withstand 250 MPa at
550degC Figure 2-32 provides a schematic of this very modest static test rig whose only
recorded variable was the temperature within the vessel
Thermocouple
Agitated Reactor
Figure 2-32 CEA S-C02 corrosion test rig [78]
58
24 Methods of Corrosion Analysis
Numerous analytical techniques can be employed both to measure the growth rate
of the corrosion product as well as to characterize its structure and composition While
electrochemical methods are viable at high temperatures a change in specimen mass is
frequently used instead to assess reaction kinetics [66] Additionally the limitations
presented by optical microscopy such as the maximum attainable resolution and inability
to generate elemental maps are overcome with electron microscopy and electron- or ion-
based spectroscopy [79] This section will therefore outline aspects relating to
gravimetric analysis as well as spatially resolved and surface analysis techniques
241 Gravimetric Analysis
Gravimetric analysis can be performed either in-situ or ex-situ of the corrosion test
environment with obvious advantages to each approach In-situ mass gain
measurements provide the most accurate representation of reaction kinetics but
unsurprisingly are expensive and usually less applicable to longer exposure times and at
higher pressures [475366] A single specimen is suspended from a delicate silica fibre
or platinum wire which in turn is attached to a continuous-recording microbalance
Moreover an inert shielding gas of equal or slightly greater pressure than the test
chamber must be used to protect the microbalance against corrosion [4753] In contrast
ex-situ measurements require minimal premeditative effort to carry out and allow
multiple specimens to be tested simultaneously Since specimens must be removed from
the test chamber to be weighed mass gain data is discontinuous and possibly erroneous if
59
the thermal shock imposed on the specimens affects the stability of their corrosion
product [66]
242 Microscopic and Spectroscopic Analyses
Lateral resolutions as low as 10 nm can be achieved with a scanning electron
microscope (SEM) which uses a thermally-generated electron beam under vacuum to
raster scan the surface of the specimen [79] Figure 2-33 depicts the resultant electron
and radiation emissions following the interaction of this incident electron beam with the
surface Typically backscattered and secondary electrons energies are detected
amplified and used in conjunction with a cathode ray tube to produce a topographical or
cross-sectional image of the specimen [7980] These images can then be used to
examine the morphology and total thickness of the oxide layer in addition to the mode
(eg uniform or intergranular) of corrosive attack
Fitted with the appropriate detectors the SEM can also perform Auger electron
spectroscopy (AES) or X-ray photoelectron spectroscopy (XPS) concurrent to the
imaging process Both of these spectroscopic analyses have very limited depth resolution
or penetration but can provide invaluable compositional information (ie the oxidation
state of detected elements) of what is being viewed Secondary ion mass spectroscopy
(SIMS) is often used when a more precise surface characterization of the corrosion
product is required Ion sputtering replaces the electron beam and elemental mass
concentrations are determined either on the surface or as a function of profile depth
[4780]
Incident electron beam
Backscattered electrons
Secondary electrons
Characteristic X-rays
Auger electrons
Diffracted electrons
Inelastically scattered electrons
Transmitted electrons
60
Figure 2-33 Surface interaction with an incident electron beam [47]
25 Metallic Corrosion in High Temperature CO2 Environments
Prior to the realization of the S-CO2 Brayton cycle the British AGR program was
essentially the only motivating force for high temperature CO2 corrosion testing
Fittingly this testing was aimed to investigate the corrosion resistance of proposed
superheater and fuel cladding materials - ferritic and austenitic stainless steels - at CO2
pressures up to 53 MPa While these tests helped to qualify the oxidation kinetics of
steels in high temperature CO2 they could not substantiate whether similar behaviour
would be observed at higher (supercritical) pressures and with nickel-base superalloys
such was the basis for the S-CO2 corrosion test facilities presented in Section 2321
This section will briefly review high temperature CO2 corrosion studies conducted at
both at subcritical and supercritical pressures
61
251 Subcritical Pressure
Corrosion studies carried out as part of the AGR nuclear program affirmed that the
chromium content of an alloy was perhaps the most influential factor in determining its
resistance to CO2 attack Ferritic and austenitic steels were exposed to CO2 up to 700degC
and 53 MPa and the morphology kinetics and composition of the resultant oxide
layer(s) were examined For chromium content characteristic of ferritic stainless steels
(ie below 12) a Cr-partitioned duplex oxide layer formed consisting of a magnetite
(F6304) outer layer and chromite spinel (FeC^CU) substratum [27-31] This duplex oxide
structure is shown in Figure 2-34 The growth mechanism of the FeC^Cv substratum -
the rate controlling oxidation process [29] - was a result of the inward diffusion of the
oxidant opposite to the outward diffusion of Fe needed to sustain to the Fe3Cgt4 layer
However as Figure 2-35 indicates these steels became increasingly susceptible to
breakaway oxidation above 550degC (823 K) following a period of protective and then
transitive behaviour the incubation time to the onset of breakaway oxidation decreased
predominately with increasing temperature although surface finish specimen geometry
prior cold working and silicon content also had some effect [2728]
F e 3 0 4
FeCr SPINEL
INTERNAL OXIDATION ZONE
10 y
Figure 2-34 Multi-layered oxide (FesCM | SiCgt2 | FeCfoO-O that formed on a ferritic stainless steel following 1060 hour exposure to C02 at 520degC and 40 MPa [31]
62
0 1 I 1 1 1 1 1 SIS 873 SS3 773 713 673
TEHPCKATURI (K)
Figure 2-35 Post-breakaway oxidation rate as a function of temperature [27]
Breakaway oxidation was attributed to the underlying metal becoming saturated
with carbon to the point that oxide grains were encapsulated by carbides or graphite and
as a result removed any adherence between the oxide and metal [29] Furthermore the
vacancies left in the ferritic matrix by chromium depletion created new short-circuit
diffusion pathways to the oxide-gas interface increasing the overall oxidation rate
Higher levels of CO in the ambient atmosphere were also found to be conducive to
breakaway oxidation because of the increase in carbon activity and hence tendency for
carburization [28] With chromium content above 18 austenitic stainless steels were
disposed to form continuous Q2O3 oxide layers in addition to the aforementioned
63
duplex oxide structure Unlike their ferritic counterparts though these steels were
unreceptive to breakaway oxidation and their higher chromium content conferred a self-
healing feature to the oxide if damaged [32]
While limited in number similar corrosion studies were also conducted using pure
nickel [81] and nickel-base superalloys [26] As expected pure nickel performed poorly
between 700 and 1100degC relative to the superalloys due to its inability to form Cr- or
Al-based oxide layers At lower temperatures the corrosion resistance of nickel-base
superalloys in CO2 was comparable to that of austenitic stainless steels although the
former seemed to be more affected by internal oxidation Nevertheless Hastelloy X
appeared at the time to be the most stable of all the superalloys in CO2 albeit this was
prior to 1976 [26] Recent work has also shown IN-617 to have a propensity for
intergranular attack in CO2 but only at extreme temperature ie 1000degC [11]
Figure 2-36 illustrates the ingress of corrosion product into the base metal after 175 hours
of testing suggesting that long-term material stability may eventually be compromised
Intercranular attack
2 5jnm Base metal
Figure 2-36 Intergranular attack of IN-617 following 175 hour exposure to C0 2 at 1000degC and 70 MPa [11]
64
252 Supercritical Pressure
While testing in the high temperature S-CO2 regime is still in its infancy early
results would suggest that the larger pressures have a relatively minor influence on
corrosion behaviour Hejzlar et al [76] liken this to the fact that the density of CO2 -
which determines the solubility and dissociation of both corrosive species and subsequent
corrosion products - does not markedly increase with pressure at temperatures so far
above its critical point (3103degC and 738 MPa) Additionally austenitic steels - 304-SS
and 316-SS - tested at temperatures nearer the critical point of CO2 where density is the
greatest showed no discernable evidence of corrosion even with significant impurity
(water methanol or sulphur) content added [23-25] Table 2-3 summarizes the various
test conditions (eg pressure temperature and duration) used by researchers with the
high temperature S-CO2 corrosion facilities described in Section 2321
Much of what was learnt from the AGR program regarding the surface response of
ferritic and austenitic stainless steels to CO2 exposure is equally applicable at
supercritical pressures Ferritic stainless steels - 410J3-SS F91 HCM12A HT-9 and
T91 - exhibited the same breakaway oxidation behaviour due to their inability to form a
continuous Cr2Cgt3 layer and susceptibility to carburization [33-37] Apart from the silica
inner layer Figure 2-37 shows a near identical FeaCVchromite spinel duplex oxide
morphology to that which was depicted in Figure 2-34 In fact S-CO2 corrosion tests
that included ferritic stainless steels were intentionally limited to below 500 hours to
minimize the extent of spallation and avoid potential cross-contamination with other
specimens
65
Table 2-3 Test conditions used for high temperature S-CO2 corrosion studies
Researcher
Oh et al
Furukawa et al
Li et al
Dunlevy
Gibbs
Lim et al
Sridharan et al
Rouillard et al
Institution
INL
Tokyo Institute of Technology and JAEA
MIT
UW-Madison
CEA
Test Conditions Pressure (MPa) 70100
200
128 200
125
200
125
120
220
207 250
Temperature (degC) 1000
400
500
550
600
660
714 650
750
610
650
650
550
Duration (hrs) 500
1991
230
500
1000
3000
230 1032
194
3000
310
Ref
[11]
[33]
[76]
[38]
[34]
[35]
[36]
[37]
Base metal
J 100pm
Figure 2-37 Characterization of 410J3-SS oxide structure following 1000 hour exposure to S-CO2 at 600degC and 200 MPa [33]
66
Excluding 316316L-SS austenitic stainless steels - 310-SS 800800H and
AL-6XN - had mass gains that were indistinguishable from most of the nickel-base
superalloys examined [3436] Figure 2-38 plots the cumulative mass gains for these
steels as well as the other alloys tested at UW-Madison The poor corrosion performance
of 316316L-SS above 650degC while not as severe as what was observed with the ferritic
stainless steels was again ascribed to oxidant eventually permeating through the duplex
oxide layer and reacting with the chromium-depleted austenite matrix Seemingly
counterintuitive the corrosion rate of 316316L-SS was also found to decrease with
increasing temperature - from 011 mgcm -day at 650degC to 006 mgcm -day at 750degC
[38] At higher temperatures the lattice diffusivity of chromium within this alloy was
believed to increase allowing for the formation of an underlying chromite spinel layer to
occur much sooner [76]
Ten nickel-base superalloys constitute the preliminary high temperature S-CO2
corrosion database that has been openly established for this class of high-performance
material IN-625 IN-690 IN-693 IN-718 IN-725 IN-740 IN-740+ Haynes 230
MA754 and PE-16 With sufficient chromium content to promote the growth of a thin
external Cr203 layer all of these superalloys displayed excellent corrosion resistance and
consistency amongst one another [343638] The slight differences in mass gain that
were noted correlated directly to the Al content of the alloy - the growth of a NiAl204
substratum or continuous AI2O3 external layer both served as a more effective barrier to
the outward diffusion of cations than a C^Ch oxide layer could alone
ltJ
200
180
160
140
120
bull | 100 O pound 080 ox
1 pound 060 040
020
000 rTJll
-n
P 500 Hours bull 1000 Hours
D1500 Hours D 2000 Hours
bull 2500 Hours H 3000 Hours
67
[ r f m T l rITB riTB rf i i rrfTM PM2000 316 s s 310 SS AL-6XN 800H HAYNES ALLOY 625 PE16IN-
230 CM-639P
Figure 2-38 Cumulative mass gains of various alloys following a 3000 hour exposure to S-C02 at 650degC and 207 MPa at UW-Madison Reproduced from [36]
Figure 2-39 shows the cumulative mass gains for the various nickel-base
superalloys tested at MIT by Dunlevy [38] For select materials (IN-718 and LN-725)
samples were also cut parallel to the rolling direction of the supply stock under the
assumption that exposed end grains (EG) would facilitate the uptake of oxidant and result
in increased corrosion rates however the formation of a protective oxide layer was likely
so quick that these short-circuit diffusion pathways were covered over almost
immediately Similarly no connection between pressure and corrosion behaviour was
firmly established - in some instances the increase in pressure at higher temperature
appeared to suppress oxidation but the variance in test data at 650degC was too large to
corroborate this Protrusions from the external oxide layer indicated that transitional
68
elements in the alloy (Nb Ti and Zr) in addition to Cr were also diffusing to the surface
and forming carbides While these carbide precipitates had no bearing on the stability of
the oxides in this study Dunlevy [38] suggested that they could serve as eventual sites for
crack initiation within the oxide layer
O016
0014
bullS 0012
i 0010 3) ~ 0008 E () 0006
O) 0004
0002
0000
bull LA2 Cumulative 0-500 Hour T=650 C P=125 MPa
bull LA1 Cumulative 0-500 Hour T=714 C P=20 MPa
I I I III III I I Inconel Inconel Inconel Inconel Inconel Inconel Inconel Inconel
690 693 718 (EG) 718 725 (EG) 725 740 740+
Figure 2-39 Cumulative mass gains of nickel-base superalloys following exposure to S-CO2 at various test conditions [38]
Lastly iron-base oxide-dispersion strengthened (ODS) alloys and particularly
those with high Al content (MA957 and PM2000) demonstrated superior corrosion
resistance to even that of the nickel-base superalloys an adherent but wavy AI2O3 layer
formed on the surface of these alloys [34-36] While they seem like a logical choice for
the structural materials of a S-CO2 Brayton cycle ODS alloys are currently expensive to
process and unfavourable to conventional welding techniques [82] Until these issues are
resolved nickel-base superalloys represent the best alternative
69
26 Summary
The foregoing sections emphasize just how complex and potentially disastrous
material interaction with a high temperature CO2 environment can be Moreover the
reader should now have an appreciation for the current state of corrosion research related
to the S-CO2 Brayton cycle and why the development of a dedicated S-CO2 corrosion
testing facility is justified Summarized below are the key points that should be taken
from this literature review
1 Multi-step chemical processes allow for the release of O and C atoms from a
carbon-rich oxidant to initiate and sustain oxidation carburization and
potentially metal dusting corrosion mechanisms
2 While limited in number all the S-CO2 corrosion facilities that have been built
to date utilize a metallic pressure vessel to either contain test specimens or to
function as one Static once-through and recirculating configurations have
been used
3 Preliminary results from high temperature S-CO2 corrosion studies correlate
well with what was observed at subcritical pressure as part of the British AGR
nuclear program ie the ability to form a continuous adherent Cr203 oxide
layer is an effective but not the best means to protect against CO2 attack
4 Corrosion rates of nickel-base superalloys and ODS alloys that were able to
form AhC^-based oxide layers are the lowest of any of the materials studied in
high temperature S-CO2 environments
70
3 Thesis Objectives and Outline
This thesis contributes to one of the deliverables identified in an ongoing research
partnership between Carleton University and CanmetENERGY of NRCan involving the
design of a 100 MWe S-CO2 advanced Brayton cycle As was noted in the literature
review S-CO2 corrosion data exists only for a limited number of materials and at specific
pressure and temperature combinations - none of which are expected to be identical to
the operating conditions of the cycle that results Thus to properly fulfil this deliverable
and support the selection of suitable materials under relevant test conditions a dedicated
S-CO2 corrosion test facility is required Consequently the main objectives of this thesis
include
1 The comprehensive design and assembly of a high temperature S-CO2 corrosion
test rig from the definition of its test conditions to the layout selection and
procurement of its components
2 Commissioning this test rig through calibration trials and baseline operation to
fully understand and optimize its operation
These objectives purposely coincide with what is necessary to see the development of
such a corrosion test rig to completion In the two chapters to follow both objectives will
be discussed in greater detail
71
4 Design of the Carleton-NRCan S-CO2 Corrosion Test Rig
From the outset of its design the Carleton-NRCan S-CO2 corrosion test rig was to
offer a testing envelope that at the very least matched the pressure and temperature
capabilities established at MIT and UW-Madison While safety considerations would
ultimately influence the final design of this test rig low implementation costs and a high
level of usability were also regarded as important design criteria This section first states
the requirements of the Carleton-NRCan S-CO2 corrosion test rig and details such
fundamental components as the pressure vessel pump furnace integrated safety features
and specimen boat The rationale behind how these and other auxiliary components were
arranged to form this test rig is then elucidated
41 Design Criteria
Summarized below in bullet form are the compulsory design requirements of the
Carleton-NRCan S-CO2 corrosion test rig
bull A primary operating point of 250 MPa at 700degC with potential to test as high as
750degC but only at 150 MPa
bull The capability to sustain a continuous CO2 flowrate of at least 10 Lhr (at
standard conditions) and allow for intermittent static periods
bull Near-autonomous operation during testing
bull A pressure vessel that could readily accommodate test specimens with a
maximum cross-sectional diameter of 127 mm (05 in) and do so without
restricting flow
72
bull The use of CO2 whose purity is close to or above 999
bull A method of specimen support that itself would be unreceptive to corrosion and
relatively inert so as to not serve as a catalyst for any chemical reaction
bull The incorporation of both passive and active safety systems to protect against
and quickly remedy any inadvertent overpressurization or thermal runaway
bull All applicable components to be registered with the Technical Standards and
Safety Authority (TSSA) in Ontario as pressure-retaining devices
42 Pressure Vessel
The proposed operating conditions of this test rig removed the applicability of any
commonly available pressure vessel and demanded that one be custom designed and
fabricated from a suitable high temperature material Figure 4-1 shows maximum
allowable stress versus temperature curves of three nickel-base superalloys - IN-617
IN-625 and Haynes 230 - initially considered for the construction material of the
pressure vessel for comparison 316-SS is also included to exhibit its rapid deterioration
of mechanical properties above 550degC Despite all three candidate nickel-base
superalloys having comparable strengths above 700degC IN-625 was selected as the
pressure vessel body material because of its recent (but favourable) service experience at
MIT [3438] and UW-Madison [36] with high temperature S-C02 Much like those used
in prior S-CO2 corrosion test rigs this pressure vessel was to be tubular in shape
however an ID larger than 127 mm (05 in) suggested that round bar stock would need
to be bored through to give the minimum required wall thickness
73
225 i 1 1 1
0 -I 1 1 1 1 1 1 1 bullmdashi
0 100 200 300 400 500 600 700 800 900
Temperature (degC)
Figure 4-1 Stress-temperature curves for pressure vessel material candidates Generated with ASME data provided by Moore [83]
Initial sizing calculations were performed in accordance to the ASME
B313-2008 Process Piping standard and later verified by Moore [84] at Pressure Vessel
Engineering Ltd of Waterloo Ontario for Canadian Registration Number (CRN)
designation Given the two proposed operating conditions design points of 2941 MPa at
750degC and 1765 MPa at 800degC were chosen for the pressure vessel with its final cross-
sectional geometry based on whichever condition represented the limiting case For each
point the design pressure was equated to the burst pressure of the rupture disks
similarly design temperatures were made 50degC higher than their respective operating
temperatures - as determined from simulations conducted by Schuegraf [85] - to account
for the higher furnace set points that would be needed to offset heating losses Moreover
considering the very nature of this facility a conservative corrosion allowance of
74
635 mm (025 in) was also applied to the bore of the vessel Failure of the pressure
vessel would inevitably be dictated by its circumferential stress and thus the minimum
required wall thickness (tmjn) was calculated from
tmin = 0 + CA) (T + P
+ CA (41) [86]
where CA and omax denote the specified corrosion allowance and temperature-dependent
yield stress respectively With a fixed ID of 254 mm (10 in) an OD of 889 mm
(35 in) was found to provide an acceptable wall thickness for both operating conditions
Figure 4-2 depicts the anticipated operating pressure and the maximum internal pressure
this vessel can withstand at metal temperatures ranging from 650 to 875degC inclusively
~ s R
OH
pound s SB SB
~ a laquo s 01
bull
s HH
100
90
80
70
60
50
40
30
20
10
mdash 1 I
X
bull Primary Design Point 2941 MPa at 750degC
4 Secondary Design Point 1765 MPa at 800degC
J T | ^Vgt M a x i m u r a allowable pressure |
^ ^ v ^ ^ | Anticipated operating pressure ^S ^^ ^sltiJ
1 1
1
600 650 700 750 800
Temperature (degC)
850 900
Figure 4-2 Maximum allowable internal pressure-metal temperature curve for the pressure vessel as per the ASME B313-2008 Process Piping code
75
Both ends of the pressure vessel were sealed using 316-SS Graylocreg connectors
(CRN 0B27905) each of which consisted of three components (i) accompanying
3-GR20 blind hubs (ii) a 2-12-3 clamping assembly and (iii) a polytetrafluroethylene
(PTFE)-coated GR20 sealing ring One 3-GR20 hub was welded to either end of the
IN-625 section with its complement serving as the closure to the pressure vessel The
2-12-3 clamping assembly brought both hub faces together as it was tightened causing
the GR20 sealing ring to elastically deform and conform to the shrinking cavity between
them A schematic of this metal-to-metal sealing arrangement is illustrated in Figure 4-3
and deemed an improvement over the carbon steel bolts used by MIT to retain their seal
Before Tightening After Tightening
Figure 4-3 Graylocreg connector prior to (left) and following (right) tightening Adapted from [87]
To assist in determining an appropriate length for the IN-625 section a thermal
analysis of the entire vessel was also carried out by Moore [84] of Pressure Vessel
Engineering Ltd using Finite Element Analysis (FEA) software The intention was to
use the superior high temperature properties of IN-625 to dissipate as much heat as
possible - via free convection and radiative heat transfer mechanisms - before interfacing
76
with the 316-SS hubs As a result the overall length of the pressure vessel including the
Graylocreg connectors was 17272 mm (680 in) with 14605 mm (575 in) of that length
constituted by the IN-625 section These dimensions in addition to those pertaining to
the cross-section are summarized below in Figure 4-4 Construction radiographic
inspection of the welds and finally hydrostatic pressure testing of the vessel were all
executed by Price-Schonstrom Inc in Walkerton Ontario allowing it to be registered as
a type H fitting with TSSA (CRN 0H140405)
A
i
2X0 375 IN (9 525 mm)THRU NPT 0395 IN (10033 mm) DEEP
Figure 4-4 Working drawing of the IN-625 pressure vessel [84]
-680 IN (1727 2 mm) - 575 IN (14605 mm
ltr
77
43 Gas Booster
Sacrificing precise control over flowrate in favour of minimizing costs high
pressure CO2 was generated using an SC Hydraulic Engineering Corp GBT-1530 gas
booster rather than a syringe pump This two stage-double acting gas booster required
only compressed air and gas supply sources to operate hence the outlet parameters of
the booster were governed by its own inherent gas amplification factor and the pressures
and flow capacities of these sources Provided by the manufacturer an approximate
correlation between the compressed air (PA) and gas supply source (Ps) pressures needed
to produce a particular static outlet stall pressure (Po) was
P0 = 30 bull PA + 2 bull Ps (42) [88]
Below Po though pressure perturbations were introduced into the outlet gas flow because
of the intrinsic reciprocating action of the gas booster Methods employed to mitigate
this problem are discussed as part of the conceptual layout of the test rig in Section 47
44 Furnace
The pressure vessel was centered within a Thermcraft Inc XST-6-0-24-3V furnace
whose split-tube design facilitated the initial loading and positioning of the vessel
Three independently controlled heated zones gave this furnace a total heated chamber
length of 6096 mm (240 in) and a cumulative power output of 6800 W zones 1 2 and
3 measured 1524 mm (60 in) 3048 mm (120 in) and 1524 mm (60 in) in length
respectively Figure 4-5 identifies the location of each heated zone and its corresponding
Platinel II thermocouple Temperature set points were inputted to and regulated by a
78
Thermcraft Inc 3-1-40-230-E15SP control system however were only indicative of the
air temperatures inside the heated chamber The basis of Section 52 was therefore to
find through trial and error the necessary set points of each heated zone that would give
- with an approximately uniform distribution - the desired temperature inside the vessel
Upon its reception the control system was also reconfigured to limit the maximum set
point of any heated zone to 800degC (in agreement with the maximum design temperature
of the pressure vessel)
1 11 ImdashI
- 3 0 38 IN (771 65 mm) OVERALL-30 0 IN (762 0 mm) SHELL
24 0 IN (609 6 mm) HEATED
(1524mm)^ v (1524mm)
^ rft-P 1 1 r f c
ZONE1 ZONE 2 im
ZONE 3
M
T TT-aij -arf
PLATINELII THERMOCOUPLE
Figure 4-5 Furnace dimensions and heated zone locations
45 Integrated Safety Features
Again due to the pressures and temperatures involved in operating this corrosion
test rig the implementation of measures to safeguard the user against serious injury or
even death was indisputable The resulting safety features consisted of several
preventative (passive) and protective (active) components some of which could be
interchanged to specifically tailor to each operating condition This section elaborates on
how these safety features influenced the design of the test rig
79
451 Passive Elements
The passive safety elements ensured that the integrity of the corrosion test rig
would not be compromised even under the most unexpected of conditions A conscience
effort was made throughout the design process that involved the selection of both tubing
and valves whose pressure ratings were still above 2941 MPa (the higher of the two burst
pressures) even at temperatures they would likely never encounter For example the
635 mm (025 in) OD tubing that was used extensively throughout the test rig had a wall
thickness of 089 mm (0035 in) allowing for safe operation at prolonged exposure up to
430degC The thicker walls also had the added effect of providing for some corrosion
allowance at normal operating temperatures For an added level of assurance and to
have the test rig registered as a whole with TSSA components containing pressures
above 20477 kPa (excluding the gas booster and those part of the compressed air system)
were required to have a CRN The CRN denoted that the designs and their specified
maximum pressure rating were in fact validated by a regulatory agency
452 Active Elements
Unlike their passive counterparts the active safety elements of the test rig were
intended to relieve pressure or block all inlet flow to the gas booster These elements - a
safety relief valve (SRV) solenoid valve relay circuit and rupture disk - comprised the
redundant overpressurization protection system represented schematically in Figure 4-6
The activation pressure of each component was purposely chosen such that each was
triggered in sequence rather than simultaneously with increasing pressure and in order
80
of increasing impact on system operation Accordingly the relief pressure (PR) was set
midway between the operating (POP) and burst (PB) pressures and in turn the relay
circuit activation pressure (PRC) was set midway between the relief and burst pressures
Table 4-1 summarizes the magnitudes of each activation pressure at both specified
operating points
Solenoid Valve Relay Circuit
P -P P =P + B R
Increasing Pressure Safety Relief Valve
(SRV)
P -P Tgt - p | X B l OP rR rOP r j
Increasing Pressure
Figure 4-6 Overpressurization protection flowchart
Table 4-1 Activation pressures to remedy an overpressurization
Operating Pressure
(MPa) 2500 1500
Activation Pressure
P R PRC P B
(MPa) 2721 1632
2831 1699
2941 1765
Flowsafe Inc F84-M safety relief valves (CRN 0G104985) the first of the two
pressure relieving devices used were sized according to American Petroleum Institute
(API) Recommended Practice 520 Part I [89] Even with their different set pressures an
orifice area of 194 mm2 (0003 in2) in each 316-SS valve was found to provide sufficient
flow capacity to atmosphere Conversely the 316-SS SFAZ series rupture disks and
their attendant 304-SS FS-2U holder were purchased from ZOOK Canada Inc
(CRN 0G84835CADD1) At the recommendation of ZOOK these scored forward-
81
acting disks were produced with a 0 manufacturing range so that the proposed
operating pressures would constitute 85 of their respective burst pressures This higher
burst tolerance despite being almost 170 the cost of a standard model was specified to
ensure that the rupture disk would in fact be the last relieving device to activate
In the event that the SRV failed closed the solenoid valve relay circuit was
designed to isolate the gas booster from its supply feeds ie stop the addition of further
CO2 to the corrosion test rig To achieve this the alarm signal output of a Graphtec Corp
GL820 midi logger was connected to the control side (12 VDc) of a normally-open relay
to serve as a circuit interrupter Likewise normally-closed solenoid valves - Ascoreg
8264 CyroLC02- and 8210 General Service-series (CRN 0C122395) - were connected
in parallel on the load side (120 VAC) of this relay and to both the CO2 and air supplies
Alarm trigger conditions (discussed in Section 47) were assigned to specific input
channels of the logger and if they were exceeded forced the alarm output to act as if it
were an open circuit subsequently the relay was de-energized and both solenoids were
closed Figure 4-7 depicts the circuit diagram for this solenoid valve relay
82
opd co2 5V DC
120 VAC
bullCD CZgt
CD Ground
gtf Air
12 V DC
ltZJ
Data Logger Alarm Output
Figure 4-7 Circuit diagram of solenoid valve relay
46 Specimen Boat
Test specimens were electrically isolated from the pressure vessel and suspended
inside it using a custom-built alumina specimen boat Rather than machine this
specimen boat entirely from a solid cylindrical rod it was assembled from four
components which required little to no material removal a grooved 222 mm (0875 in)
OD tube two stepped semi-circular end caps and a 32 mm (0125 in) diameter solid
support rod This boat - fabricated by Elan Technologytrade of Midway Georgia -
measured 2667 mm (105 in) in length and used the semi-circle void in each of its ends
to encourage CO2 flow Figure 4-8 shows this specimen boat following its assembly
along with the alumina spacers that will be used to separate adjacent specimens
83
Figure 4-8 Alumina specimen boat
47 Conceptual Layout and Assembly
After much deliberation the NRCan Bells Corners complex (BCC) was chosen
over Carleton to house this S-CO2 corrosion test rig their telemetrically-monitored CO2
bulk tank comprehensive leak detection system and dedicated technicians to assist both
with assembly and routine maintenance were all influencing factors in this decision As
provided by BOC Canada Ltd CO2 within this bulk tank had a minimum guaranteed
purity of 9985 with maximum impurity levels listed in Table 4-2 The final design of
this test rig was to utilize a once-through arrangement with static testing capabilities as
opposed to being a recirculating system While a recirculating system would be most
representative of the closed cycle S-CO2 Brayton cycle excessive contaminant in either
solid or gaseous form could potentially limit the life of the gas booster Figures 4-9 and
4-10 illustrate the complete process and instrumentation diagram (PampID) and physical
arrangement of this corrosion test rig its accompanying bill of materials (BOM) is found
in Appendix A
Figure 4-9 PampID for Carleton-NRCan high temperature S-CO2 corrosion test rig 00 -1^
85
Table 4-2 Maximum impurity content of BOC Canada Ltd standard grade bulk CO2
ppm (vol)
Inerts CxHy H20 0 2 NH3 CO CxIy NOx S02 COS H2S (volatile) (non-volatile)
1000 50 32 30 25 10 10 05 05
Figure 4-10 Carleton-NRCan high temperature S-C02 corrosion test rig
Carbon dioxide was supplied to the gas booster at 159 MPa after first passing
through the Ascoreg 8264 CyroLC02 solenoid valve and a 150 um particulate filter The
use of a three-way needle valve and check valve (located at the booster outlet) also
allowed for C02 to bypass the gas booster altogether and purge the test rig at this lower
pressure Similarly compressed instrument air flowed through a Norgren Excelonreg
86
B74G filter-regulator assembly and the Ascoreg 8210 General Service solenoid valve
before entering the booster Apart from the check valve Figure 4-11 shows where each
of these components is located in relation to the GBT-1530 gas booster To simplify
control over the outlet pressure of the gas booster only the pressure of the compressed air
feed could be adjusted Furthermore it was determined from Equation 42 that given the
maximum available CO2 and compressed air pressures the stall pressure of the gas
booster was limited to approximately 2592 MPa
Upon leaving the gas booster compressed CO2 was filtered through a 70 urn
particulate filter and stored in a 316-SS 300 mL buffer tank The buffer tank was one
part of a two-stage system aimed to remove the inevitable pressure pulsations from the
CO2 its complement was a GO-Regulator PR-57 series regulator Stored energy in the
CO2 would first serve as a rudimentary dampener to smooth out these pulsations before
entering the PR-57 regulator where the CO2 would then leave at essentially constant
pressure The addition of the buffer tank kept at a slightly higher pressure than the
intended operating pressure was to prolong the life of the regulators diaphragm
GO-Regulator had also recommended that ethylene propylene be substituted for the
standard Viton seals to prevent any chance of explosive decompression with S-CO2
Moreover an Endress+Hauser Cerabar S PMP71 transmitter was used in conjunction
with the PR-57 regulator to help in regulating the CO2 to the desired test pressure
87
Figure 4-11 Inlet connections to the GBT-1530 gas booster
88
Figures 4-12 and 4-13 depict the layout of various components downstream of the
GBT-1530 gas booster both at its immediate outlet and at the inlet to the pressure
vessel As each figure clearly shows all tubing leading from the outlet of the gas booster
to the inlet of the pressure vessel was wrapped with OMEGAreg HTC heating cords and
Aeroflexreg tube insulation to keep the CO2 in a supercritical rather than liquid state the
pressure vessel in turn was supported by adjustable laboratory jack stands which were
aimed to facilitate its initial positioning and possible future removal Two needle valves
also allowed this corrosion test rig to function as a static system by completely isolating
the pressure vessel Consequently both the FlowSafe F84-M SRV and ZOOK SFAZ
rupture disk had to be located between these valves so as not to remove their protective
role when operating at static conditions Once testing commences the specimen boat
will sit inside the pressure vessel and temperature will be measured on both sides of it
using OMEGAreg KQIN thermocouple probes
As a provision to accommodate higher flowrates 61 m (20 ft) of 3175 mm
(0125 in) OD 316-SS tubing was coiled and added at the outlet of the pressure vessel to
provide additional surface area for cooling - either by free convection or by submersing
the coil in a water bath Downstream of this cooling coil a 70 urn filter removed any
particulate entrained within the CO2 before reaching the TESCOMtrade CC-series metering
valve This particulate filter was situated between one of the static isolation valves and
another three-way valve so that it could be taken out and replaced without interfering
with a corrosion test Similar to what was done upstream of the pressure vessel all
89
pertinent valves and measuring instruments were mounted onto stainless steel plating to
make controlling the test rig as efficient as possible
Upstream isolation valve
7 (jrn f i l t e r
lt FROM GAS BOOSTER
Figure 4-12 At the outlet of the GBT-1530 gas booster
90
Figure 4-13 At the inlet to the pressure vessel
Pressure drop and hence flow control was achieved using the CC-series metering
valve with both temperature and pressure measured at its outlet to monitor against
freeze-ups and indirectly quantify higher flowrates Flowrates lower than 50 Lhr at
standard conditions were read off of a Swagelok rotameter which because of the precise
control afforded by the metering valve was converted into a passive flowmeter Spent
CO2 was finally exhausted to atmosphere after first passing through a simple gas scrubber
91
configuration - two 500 mL Erlenmeyer flasks arranged in series Figure 4-14 illustrates
how the corrosion test rig was configured downstream of the pressure vessel
Type-K thermocouples were used exclusively throughout this test rig and like the
pressure transducer had their output sampled and recorded by the Graphtec GL820
logger This logger as well as the solenoid valve relay circuit and OMRON DC power
supply were all mounted inside the electrical enclosure shown in Figure 4-15 In
addition to those located inside and downstream of the pressure vessel thermocouples
were also permanently adhered to its exterior to measure metal temperature Figure 4-16
depicts the relative locations of these thermocouples along the length of the pressure
vessel - thermocouples T-4 and T-10 were fixed to both Graylocreg blind hubs T-5 and
T-9 were attached to each weld joining the blind hub to the IN-625 section T-6 was
positioned at the midpoint inside the furnace and T-7 T-8 T-9 and T-10 collectively
gave a discrete thermal profile of the pressure vessel - outside the furnace - in the axial
direction
92
Figure 4-14 Downstream of the pressure vessel
-+c
J ^
Figure 4-15 Electrical enclosure
mi
rrmdash11 ^777777 BrW
NWV1
Figure 4-16 Thermocouple locations along the length of the pressure vessel
93
As part of the solenoid valve relay circuit discussed in Section 452 seven of the
fourteen (nineteen during commissioning) analog inputs that fed into the GL820 logger
were assigned upper threshold alarm triggers Only four unique trigger conditions (one
pressure- and three temperature-related) were actually defined though leaving some
input channels to serve in a duplicate or redundant capacity the magnitudes of two of
these alarm triggers were also dependent on which operating point was selected Table
4-3 identifies the values of each of the four alarm trigger conditions and which input
94
channel(s) they applied to The first and second alarm triggers listed in Table 4-3
represent the predetermined solenoid valve relay circuit activation pressures and the
design temperatures of the pressure vessel Similarly the remaining two trigger points
were conservative maximum limits for both the process temperature of the PMP71
transmitter and the exposure temperature of the thread sealant used in the Graylocreg blind
hubs - the actual maximum temperature ratings of each were 125degC and 288degC
respectively
Table 4-3 Assigned upper threshold alarm triggers
Alarm ID
1A
2A
3 4
Applicable Channel Inputs
PMP71 pressure transmitter
Internal temperature of the pressure vessel (2 signals) Metal temperature of the IN-625 section inside the furnace
Metal temperature of the PMP71 process connection Metal temperature of the left and right Gralyocreg blind hubs
Assigned Value
2831 MPa or 1699 MPa
750degC or 800degC 100degC 250degC
A Value depends on the particular operating point chosen - 250 MPa at 700degC or 150 MPa at 750degC
5 Commissioning
95
Following its assembly functional testing of the Carleton-NRCan high temperature
S-CO2 corrosion test rig was conducted to evaluate its performance against the original
design criteria Time constraints only allowed for comprehensive thermal profiling inside
the pressure vessel to be completed at 150 MPa nevertheless two furnace set points
established at 150 MPa were used to investigate what effect operating at a higher
pressure (eg 250 MPa) would have on heating the S-CO2 This section describes what
was observed during the initial start-up of this corrosion test rig and summarizes the
results of its commissioning process
51 Initial Start-up and Modifications
To characterize the temperature distribution of S-CO2 within the pressure vessel a
custom OMEGAreg profile probe was acquired with six thermocouples incorporated into a
381 mm (180 in) portion of its overall length Figure 5-1 illustrates how this profile
probe in addition to a secondary single-point OMEGAreg KQIN probe were arranged
relative to the heated zones of the furnace the thickness of the single-point probe has
been exaggerated to differentiate between the two Starting at the leftmost edge of
zone 2 temperature was measured at successive 762 mm (30 in) intervals across its
entire length temperature was also measured at the rightmost edge of zone 3
Initial functional testing was performed at 150 MPa and with CO2 leaving the test
rig at a constant flowrate of 20 Lhr at standard conditions Temperature in each heated
zone of the furnace was also increased at a linear rate of 200degChr to a final set point of
96
600degC to lessen the thermal shock that the pressure vessel would be subjected to
Figure 5-2 shows the temperature distribution both of the pressure vessel itself and the
S-CO2 inside it once a steady state was reached Data points used to generate Figure 5-2
and likewise all figures to follow were averaged from steady state data that was sampled
every 50 s for a total duration of two hours (ie a sample size of 1440 data points)
Overall the heating process was found to be quite inefficient with fluid
temperatures averaging approximately half the value of the furnace set points
Additionally duplicate temperature measurements at the tips of each probe (T-2 and
T-13) differed by approximately 25degC with the single-point probe measuring the lower
of the two Although difficult to confirm the radial positioning of each probe tip was
most likely asymmetrical the greater unsupported length of the profile probe would have
attributed to a larger deflection under its own weight causing this thermocouple to
actually be closer to the bottom of the pressure vessel Testing was stopped though when
the original PTFE-based thread sealant used to interface with the pressure vessel began
to discolour and melt to the Graylocreg hubs
762 mm (30 in) TYP
I 18
| j | M V77YX7Mlt7 77777
zoNEi ZONE 2 ZONE 3
Figure 5-1 Location of thermocouples within the pressure vessel (hatched)
97
500
400 -
300 U o u u 3 i-
I 200
100 -
n i
Radial positioning of these thermocouples was likely different
bull Weld
lt bull Graylocreg hub
bull 1 1
bull Metal Temperature
bull Fluid Temperature i
m
w bull bullbull
^ Weld
bull Graylocreg hub 4
0 025 05 075 1 Normalized Pressure Vessel Length
Figure 5-2 Initial temperature distribution at 150 MPa for furnace set points of 600degC
Similar to what was realized by Dunlevy [38] metallic reflectors were added inside
the bore of the pressure vessel in an attempt to concentrate heat within the confines of the
furnace Molybdenum (Mo) sheeting was cut into six 1905 mm (075 in) diameter
disks and each disk was perforated with four equidistance holes about its axis to
encourage flow As shown in Figure 5-3 reflector placement was symmetric about the
centre of the furnace with the first of three reflectors positioned 635 mm (25 in) from
the outermost edge of zones 1 and 3 subsequent reflectors were spaced 254 mm (10 in)
apart from one another moving towards the ends of the furnace Furthermore high
purity nickel wire was crimped onto both probe sheaths on either side of each Mo heat
reflector to ensure they remained fixed as the vessel was pressurized Figure 5-4 depicts
98
the arrangement of Mo reflectors on the profile probe sheath prior to being inserted into
the pressure vessel Following its reassembly a metallic-based thread sealant capable of
withstanding temperatures up to 288degC was used instead on the process connections with
the pressure vessel
635 mm (25 in) TYP
254 mm (10 in) TYP 13) (14) 05) (16) ( IT) T 18)
W77 VMA77Z y(JYSYi ^ ^ v))Mvy^ M M
ZONE 1 ( 2 ZONE 2 ZONE 3
Figure 5-3 Heat reflector positioning within the pressure vessel (hatched)
Figure 5-4 Heat reflectors attached to the profile probe sheath
99
At identical conditions (150 MPa with 600degC furnace set points) to the previous
functional test Figure 5-5 illustrates a marked increase - by as much as 150degC - in
S-CO2 temperature with the addition of these heat reflectors However the effectiveness
of the heat reflectors is perhaps best exemplified by the significant temperature difference
between adjacent thermocouples positioned within (T-17) and outside of (T-18) of their
boundaries The presence of the heat reflectors would also appear to minimize the
temperature disparity between T-15 and T-17 skewing the nearly symmetric bell-shaped
distribution that was observed before slightly right of centre Moreover temperatures
measured by T-2 and T-13 should have been in closer agreement with each other as the
heat reflectors were also acting to centre both probes within the bore however unlike the
earlier test in which T-2 was roughly 25 degC cooler T-2 was now 30degC wanner When the
pressure vessel was disassembled again the single-point probe was found to have a sharp
bend along its length which could have been incurred from misalignment during its
initial insertion Similarly Figure 5-6 depicts the change in metal temperature following
the addition of the heat reflectors As the causal effect of the increased fluid temperatures
observed in Figure 5-5 metal temperature within the furnace experienced the most
pronounced change - an increase of approximately 85degC While not as noteworthy the
heat reflectors also served some purpose in keeping the Graylocreg hubs cooler
Since the alumina specimen boat can only accommodate metal coupons in
2286 mm (90 in) of its overall length temperature need only be held constant over an
equivalent length inside the pressure vessel For each thermal profile conducted
hereafter furnace set points were adjusted to give an approximately uniform temperature
100
distribution across T-14 to T-17 inclusively Thus when the specimen boat is to be
inserted into the pressure vessel it will be centred 381 mm (15 in) to the right of the
midpoint of the furnace
O o
i-= s laquo u a
amp
T-2 M
4 T-2 bull
-500-
400mdash
300-
200-
100-
-0-
- i r~
^ ( 1 1
Significant decrease in S-C02
temperature outside the heat reflectors
bull Prior to Adding Heat Reflectors
bull Following the Addition of Heat Reflectors
-200 -150 -100 -50 0 50 100 150 200 250 300 350
Distance from Centre of Furnace (mm)
Figure 5-5 Effectiveness of the heat reflectors on raising fluid temperature at 150 MPa for furnace set points of 600degC
100
75
101
u o o S -
s laquo s -ltu a E
50
25
025 05 075
-25 Normalized Pressure Vessel Length
Figure 5-6 Change in metal temperature following the addition of the heat reflectors at 150 MPa for furnace set points of 600degC
52 Thermal Profiling at 150 MPa
Two separate profiling trials were carried out at 150 MPa to first establish furnace
set points that would give uniform temperature distributions at 550 600 650 and 700degC
(ie temperatures that could serve as the TIT for the S-CO2 Brayton cycle) and then
using the same series of set points to confirm the repeatability of the initial results This
validation trial was also used to refine the original furnace set points if needed and
further reduce the maximum temperature difference over the defined heated length
Similarly the highest possible S-CO2 temperature that would allow for a uniform
102
distribution was also determined however the furnace set points required to achieve this
were not validated like those at lower temperatures and were ultimately limited to the
design temperature (800degC) of the pressure vessel While this section focuses solely on
the internal temperature distribution of the pressure vessel specifically over the
2286 mm (90 in) length spanning between T-14 and T-17 complete thermal profiles (at
the aforementioned temperatures) are made available in Appendix B
Furnace set points that would produce the desired fluid temperatures were
determined by progressively increasing their values and monitoring what effect this had
on the overall temperature distribution within the pressure vessel Temperature was
increased at a linear rate of 200degChr regardless of the magnitude of the temperature rise
but only once pressure had stabilized at 150 MPa To allow the S-CO2 time to properly
acclimatize itself to any increase in temperature two hours - if the temperature increase
was equal to or greater than 15degC - had to have elapsed before the next change to a
specific furnace set point could be made temperature increases less than 15degC were only
given an hour Table 5-1 details the succession of furnace set points beginning at a
universal starting point of 580degC and clearly identifies the final set points needed to attain
each of the four internal temperatures As the overall temperature was increased the
difference between zone 1 and 3 set points (needed to counteract forced convection) was
found to decrease most likely as the effects of radiation heat transfer became more
significant From the outset of thermal profiling the following convention was also
adopted to summarize the set points of each heated zone in the furnace
[ZONE 1 I ZONE 2 | ZONE 3] (51)
Table 5-1 Heated zone set points to give uniform temperature distributions
Desired S-C02
Temperature
550degC
600degC
650degC
700degC
Heated Zone Set Point
1 2 3
CO 580
620
650
665
680
680
690
695
695
710
720
725
725
740
750
750
750
765 775 780 780 785 785 785
580
620
620
620
620
620
620
620
645
650
650
650
675
675
685
690
715
725 735 735 735 735 735 735
580
620
620
620
635
650
650
655
680
690
700
700
725
725
725
725
750
750 755 760 765 765 770 775
104
U o V s -3
bull bull
eS i a pound
i X i
i lt i I I E 1 1 I
4 i bull
n [bull] i i i i i i
_ J _ _ i l
4
l)J^ bull
u j i r i f c -i
crf a u u u mm
550-^h
5 0 0 -
4 5 0 - 1
X
Jk
gt - -
i 1
i
X 1 1
1 1 I t
bull 1
1
1 1
1 1
1 1
-200 -150 -100 -50 0 50 100 150 200
Distance from Centre of Furnace (mm)
bull [695degC | 620degC | 655degC] bull [725degC | 650degC | 700degC]
A[750degC | 690degC | 725degC] X[785degC | 735degC | 775degC]
Figure 5-7 Temperature distributions for 550 600 650 and 700degC using the established furnace set points
Figure 5-7 shows the expected temperature distributions over the usable length of
the specimen boat at 550 600 650 and 700degC Of these four temperatures the average
maximum temperature deviation between the respective peak and the lesser of the two
ends was approximately 147degC or 236 of the peak temperature Results of the
validation trial are plotted in Figures 5-8 through 5-11 and generally show less variation
with the original data set at higher temperatures However for each case uniformity of
temperature across the 2286 mm (90 in) length was marginally improved Table 5-2
summarizes the furnace set points and thermocouple readings that were used to generate
these plots as well as the maximum temperature differences that were observed
105
At both 550 and 600degC Figures 5-8 and 5-9 illustrate that specific furnace set
points actually had to be reduced by as much as 15degC to replicate the same temperature
distribution as before a small discrepancy in flowrate between the two trials was likely
the cause Although flowrate was visually confirmed to be 20 Lhr at standard
conditions for each trial a more accurate means of flow measurement (ie a coriolis
flowmeter) than what is currently in place would have substantiated this claim These
discrepancies in flowrate are less influential on heat transfer to the S-CO2 above 650degC
as the radiative heat transfer mechanism becomes more dominant Figures 5-10 and 5-11
show that the temperatures obtained as part of the validation trial were nearly identical to
those first measured in establishing furnace set points for 650 and 700degC In an effort to
flatten these initial temperature distributions even more individual furnace set points
were increased by 5degC and the maximum temperature difference at both 650 and 700degC
was reduced by roughly 05degC Overall the average maximum temperature difference
resulting from the validation trial was 131degC or 209 of the peak temperature
consequently it was decided that the slightly modified furnace set points obtained from
this trial would replace their original counterparts
u o i-
s s -
S
m
1
bull
-100 -50
560-
5 5 5 -
550
545
540-
535
530-
150 0 50 100
Distance from Centre of Furnace (mm)
bull [695degC | 625degC | 655degC] Initial Run B[6850C | 610degC | 645degC] Validation Run
200
Figure 5-8 Validation of the furnace set points to give 550degC at 150 MPa
U o
u
a E
E2
bull100
-605-
-600
-595
-590-4
-585
-580
t
-50 0 50 100
Distance from Centre of Furnace (mm)
150 200
bull [725degC | 650degC | 700degC] Initial Run l[725degC | 640degC | 690degC] Validation Run
Figure 5-9 Validation of the furnace set points to give 600degC at 150 MPa
-655-
U o
s-S
i-
P E
-65a-
-645
-640
-635 - -
630-
bull100 -50 0 50 100 150 200
Distance from Centre of Furnace (mm)
bull [750degC | 690degC | 725degC] Initial Run B[755degC | 695degC | 725degC] Validation Run
Figure 5-10 Validation of the furnace set points to give 650degC at 150 MPa
U o O) s -
s u
m
705-
700 - raquo -
695
690
685
680- 1 1 1
-100 -50 0 50 100 150
Distance from Centre of Furnace (mm)
bull [785degC | 735degC | 775degC] Initial Run bull [785degC | 735degC | 780degC] Validation Run
200
Figure 5-11 Validation of the furnace set points to give 700degC at 150 MPa
108
Table 5-2 Summary of the thermal profiling trials conducted at 150 MPa
Heated Zone Set Point
1 2 3
(degC) 695
685
725
725
750
755
785
785
800
620
610
650
640
690
695
735
735
750
655
645
700
690
725
725
775
780
800
Thermocouple Reading
T-14 T-15 T-16 T-17
(degC) 5366
5472
5827
5909
6363
6378
6857
6875 j
7082
5499
5591
5995
6020
6499
6500
6998
7003
7215
5457
5535
5970
5962
6444
6437
6939
6941
7155
5373
5467
5881
5897
6357
6362
6854
6865J
7082
AVERAGE
ATMAX
(degC) 133
123
168
123
142
138
144
138
133
138
ATMAX
TMAX
() 242
221
279
204
218
213
206
198
184
218
As an exploratory exercise the furnace set points of zones 1 and 3 were set to the
design temperature of the pressure vessel at 150 MPa (800degC) and zone 2 was adjusted
until a uniform temperature distribution was achieved Thus at [800degC | 750degC | 800degC]
Figure 5-12 shows that S-CO2 could be heated to approximately 721degC - only 29degC less
than the envisioned maximum testing capability of this facility - and maintained to
within 133degC over the usable length of the specimen boat Achieving a uniform fluid
temperature of 750degC is certainly plausible especially since the metal temperature at the
midpoint of the furnace was 7656degC However a greater number of thermocouples - as
a minimum one in each heated zone of the furnace - should be mounted to the pressure
vessel to ensure its safe operation as the set points are increased beyond 800degC In the
meantime a more optimal placement or greater number of heat reflectors within the bore
of the pressure vessel should be investigated to increase fluid temperature
109
U o
s-w a E
bull
-100 -50
725-
720-
715-
710-
705-
700- mdash i mdash
50 0 50 100 150
Distance from Centre of Furnace (mm)
200
Figure 5-12 Temperature distribution using furnace set points of [800degC | 750degC | 800degC] at 150 MPa
Although not shown explicitly in any of the previous plots the standard error
associated with each thermocouple is plusmn075 of its measured value at 7215degC (the
largest recorded temperature) this amounts to plusmn54degC Additionally fluctuations in
pressure at 150 MPa are largely attributed to the duty cycle of the furnace and can be
controlled to approximately plusmn02 MPa not including the maximum plusmn002 MPa reference
accuracy of the transmitter Figure 5-13 shows a representative sampling of pressure
over a 10 hour window at 650degC with the average maximum and minimum recorded
pressures being 1497 MPa 1516 MPa and 1482 MPa respectively For the same 10
hour window Figure 5-14 illustrates the variation in both fluid temperature across zone 2
(T-2 T-13 through T-17) and metal temperature inside the furnace boundary (T-6)
110
0gt i -S se
200
190
180 +
170
160 --
150
140
130
120 --
110
100
raquomraquomdashnraquomdash mmmmmtmmi M M M M M mmmmmdmmm
PAVG 1497 MPa PMAX 1516 MPa
PMIN 1482 MPa
0 2 4 6 8
Time (hr)
Figure 5-13 Pressure variations at 150 MPa over a 10 hour period at 650degC
10
725
700
U o
675 --
650
g 625 E
H 600
5 7 5 -bull
550
T-6
T-15 T-16 T-17 T-14
4gt
(J) T-2 T-13 W 14) (15) fl6 ~ltyen =F=FH
ZONE 1 ( 2
0 8 2 4 6
Time (hr)
Figure 5-14 Temperature variations at 650degC over a 10 hour period at 150 MPa
10
I l l
53 Pressure Effects on Performance
Two additional thermal profiling trials were performed for 550 and 600degC but at
250 MPa to assess what effect operating at a higher pressure would have on the heating
characteristics of this corrosion test rig Intuitively an increase in pressure and hence an
increase in density should result in a lower fluid temperature for fixed furnace set points
just how much lower was unknown As density increases conductive heat transfer
becomes more efficient [90] through the S-CO2 and heat loss through the walls of the
pressure vessel is expected to be greater Figure 5-15 in fact confirms this assumption
illustrating an increase in metal temperature outside the furnace for furnace set points of
[685degC I 610degC I 645degC] and [725degC | 640degC | 690degC] Accordingly Figures 5-16 and
5-17 both show an approximate 40degC reduction in fluid temperature at 250 MPa
Only after this pressure investigation was completed was it realized that the using
the same normalized flowrate at both pressures (20 Lhr) would have produced fluid
velocities at 250 MPa that were approximately half of what they were at 150 MPa
However the improved conduction mechanism at 250 MPa seems to have a more
pronounced effect on temperature distribution than velocity shifting the entire profile to
the right ie the maximum temperature is observed at T-16 rather than T-15 Despite
this noted shift in the S-CO2 temperature distribution Figure 5-18 suggests that the
thermal time constant of this test rig is independent of its operating pressure Increasing
at a linear rate of 200degChr from room temperature to furnace set points of
[685degC I 610degC I 645degC] the time needed for T-15 to reach a steady state is nearly
identical at both 150 and 250 MPa
112
U o w u a V s -
o -=s -^ os s -
Q
E
50
40 -bull
30
20
10
-10 --
-20
II
0 0
bull [685degC | 610degC | 645degC] Set Point
bull [725degC | 640degC | 690degC] Set Point
bull
1
bull i
1 1
25 05 075 i i
f i
Normalized Pressure Vessel Length
Figure 5-15 Differences in metal temperature at 250 MPa from 150 MPa for equivalent furnace set points
U o Qi i-S ca s-o
a
bull -100
bull560-
550
540-
530
520-
510-
500
490 H
480
bull 150 MPa
bull 250 MPa
-50 0 50 100
Distance from Centre of Furnace (mm)
150 200
Figure 5-16 Temperature distributions using fixed furnace set points of [685degC | 610degC | 645degC] at 150 and 250 MPa
113
U o ltu s -S laquo V D pound
bull100
-610-
-600 J
-590-
-580-
-570-
-560-
-550-
-540 H
-530
-520
bull 15 0MPa
bull 250 MPa
-50 0 50 100
Distance from Centre of Furnace (mm)
150 200
Figure 5-17 Temperature distributions using fixed furnace set points of [725degC | 640degC | 690degC] at 150 and 250 MPa
600
500
degi 400 u
1 300 u V Q
I 200
100 -
150 MPa^^- I -
A ^ i ^ 2 5 0 MPa
1
Time (hr)
Figure 5-18 Thermal response of T-15 from room temperature to fixed furnace set points of [685degC | 610degC | 645degC] at 150 and 250 MPa
114
6 Summary and Conclusions
Representing the first facility of its kind in Canada the Carleton-NRCan S-CO2
corrosion test rig was developed to satisfy two anticipated operating points (i) 700degC at
250 MPa or (ii) 750degC at 150 MPa These operating points and the ability to
accommodate test specimens measuring 127 mm (05 in) in diameter give the Carleton-
NRCan facility testing capabilities comparable to those at MIT and UW-Madison using a
relatively modest budget On a global scale the Carleton-NRCan corrosion test rig will
undoubtedly contribute to the growing demand to evaluate the corrosion behaviour of
various structural materials in high temperature S-CO2 A better understanding of such
corrosion mechanisms will assist in selecting or potentially developing alloys that will
offer long-term reliability to the S-CO2 Brayton cycle The major conclusions that
resulted from this thesis include
1 The initial start-up of this test rig revealed the fluid temperature within the
confines of the furnace to be approximately half that of the furnace set points
Consequently the heating efficiency of the furnace was improved by adding
three equally-spaced molybdenum heat reflectors on opposite sides of the
furnace but inside the bore of the pressure vessel to mitigate the heat loss along
its length
2 Furnace set points that would yield a near-uniform temperature distribution
across the usable length of the specimen boat were established and validated at
150 MPa for 550 600 650 and 700degC similarly limiting the maximum of any
of furnace set points to 800degC (the design temperature of the pressure vessel) a
115
uniform temperature was 721degC was attained Of the nine trials conducted at
150 MPa temperature and pressure variations could be controlled to within 123
to 168degC and plusmn02 MPa respectively once a steady state had been reached
3 Preliminary functional testing at 250 MPa indicated an approximate 40degC
decrease in average S-CO2 temperature from 150 MPa for equivalent furnace
set points
61 Future Work
Given that this corrosion test rig is now operational commissioning needs to be
completed at 250 MPa to ascertain what maximum S-CO2 temperature can be uniformly
achieved within the pressure vessel Once this maximum temperature is defined furnace
set points that will give uniform distributions at lower temperatures - presumably 500
550 600 and 650degC - will need to be determined and validated as was done at
150 MPa Likewise the commissioning envelope can be further expanded to include
100 MPa and 200 MPa this will ultimately provide a catalogue of furnace set points to
use for any conceivable combination of test conditions
A thorough investigation should also be carried out to confirm if the current
placement and number of heat reflectors inside the bore of the pressure vessel is indeed
the optimal arrangement Affixing the heat reflectors to the sheaths of each thermocouple
probe was found to have the unwanted effect of shifting the maximum temperature inside
the pressure vessel slightly right of its centre One option to remedy this effect would be
to provide a fluid path into and out of the pressure vessel that is not directly influenced by
116
the presence of the heat reflectors The 316-SS tubing that surrounds each thermocouple
probe prior to interfacing with the pressure vessel could be extended inside the pressure
vessel and the heat reflectors attached to this tubing instead Another option to increase
the heating efficiency of the furnace is to wrap the surface of the pressure vessel -
immediately at its boundary with the furnace - with insulation This would undoubtedly
require that another detailed FEA be performed to verify that (i) sufficient length of the
IN-625 is still exposed to dissipate heat and (ii) thermal stresses are not too severe
Ideally the commissioning process would have been conducted with the specimen
boat in-situ to give the most representative conditions of an actual corrosion test
However excess weld slag from joining the Graylocreg hubs to the IN-625 section
prevented the specimen boat from actually being inserted into the pressure vessel This
problem needs to be addressed and resolved before a more detailed thermal
characterization can be executed but most importantly before corrosion testing can
begin Price-Schonstrom Inc has indicated that this work will be done at their expense
but leaves the test rig inoperable while it is carried out Once this work is completed
though a preliminary corrosion test at 650degC and 150 MPa for 500 hours will be
initiated five stainless steels - 15-5 17-7 316-SS 416-SS and 420-SS - and one nickel-
base superalloy - IN-738LC - have been acquired for this very purpose
Corrosion testing that will inevitably result from this facility should distinguish
what effect pressure has on the corrosion response of suitable construction materials -
nickel-base superalloys - in S-CO2 even more so than what was done by Dunlevy [38]
The corrosion mechanism of these same materials should also be investigated at several
117
temperatures to determine what if any effect the dissociation of CO2 to CO above 700degC
will have on the corrosion rate Lastly each corrosion trial that is performed should be
done so at durations (ie 3000 hours) that will either confirm or refute the long-term
stability of the various oxide layers However to successfully achieve all of the
abovementioned would require several test rigs to be operated concurrently or a
compromise be made between the number of test points evaluated and the duration of
each test
118
References
[I] International Energy Agency World Energy Outlook R Priddle Ed Paris France 2009
[2] T Yokoyama Japanese RampD on CO2 Capture in Proc of the 6th International Conference of Greenhouse Gas Control Technologies vol I Kyoto Japan 1-4 Oct 2002 pp 13-18
[3] A Technology Roadmap for Generation IV Nuclear Energy Systems US DOE Nuclear Energy Research Advisory Committee and the Generation-IV International Forum GIF-002-00 Dec 2002
[4] GIF RampD Outlook for Generation IV Nuclear Energy Systems Generation IV International Forum Aug 2009
[5] J Lillington The Future of Nuclear Power Oxford UK Elsevier Ltd 2004
[6] V Dostal A Supercritical Carbon Dioxide Cycle for Next Generation Nuclear Reactors Massachusetts Institute of Technology Cambridge MA PhD dissertation Jan 2004
[7] T Schulenberg H Wider MA Fiitterer Electricity Production in Nuclear Power Plants - Rankine vs Brayton Cycles in ANSENS International Winter Meeting (GLOBAL 2003) New Orleans LA 16-20 Nov 2003
[8] Y Kato T Nitawaki Y Muto Medium Temperature Carbon Dioxide Gas Turbine Reactor Nuclear Engineering and Design vol 230 no 1-3 pp 195-207 2004
[9] ML Corradini Transport Phenomena in Supercritical Fluids in GENIV Reactor Designs in Proc of the 12th International Meeting on Nuclear Reactor Thermal Hydraulics (NURETH-12) Pittsburgh PA 30 Sept-4 Oct 2007
[10] A Moisseytsev JJ Sienicki Extension of the Supercritical Carbon Dioxide Brayton Cycle for Application to the Very High Temperature Reactor in Proc of the International Congress on Advances in Nuclear Power Plants (ICAPP 10) San Diego CA 13-17 June 2010
[II] CH Oh et al Development of a Supercritical Carbon Dioxide Brayton Cycle Improving VHTR Efficiency and Testing Material Compatibility Idaho National Laboratory Idaho Falls ID INLEXT-06-01271 Mar 2006
119
[12] CS Turchi Supercritical CO2 for Application in Concentrating Solar Power Systems in Proc of Supercritical CO2 Power Cycle Symp 2009 Troy NY 29-30 Apr 2009
[13] DJ Chapman DA Arias An Assessment of the Supercritical Carbon Dioxide Cycle for Use in Solar Parabolic Trough Power Plant in Proc of Supercritical C02 Power Cycle Symp 2009 Troy NY 29-30 Apr 2009
[14] GA Johnson M McDowell Issues Associated with Coupling Supercritical CO2 Power Cycles to Nuclear Solar and Fossil Fuel Heat Sources in Proc of Supercritical C02 Power Cycle Symp Troy NY 29-30 Apr 2009
[15] National Institute of Standards and Technology (NIST) (2010 Sept) Carbon Dioxide Gas Phase Thermochemistry Data [Online] httpwebbooknistgovcgi cbookcgiID=C 1243 89ampUnits=SIampMask=4Thermo-Phase
[16] MA Jacobs Measurement and Modeling of Thermodynamic Properties for the Processing of Polymers in Supercritical Fluids Technische Universiteit Eindhoven Eindhoven Netherlands PhD dissertation Sept 2004
[17] National Institute of Standards and Technology (NIST) (2010 September) Helium Gas Phase Thermochemistry Data [Online] httpwebbooknistgovcgi cbookcgiID=C7440597ampUnits-SIampMask=4Thermo-Phase
[18] V Dostal P Hejzlar MJ Driscoll High-Performance Supercritical Carbon Dioxide Cycle for Next-Generation Nuclear Reactors Nuclear Technology vol 154 no 3 pp 265-282 June 2006
[19] V Dostal P Hejzlar MJ Driscoll The Supercritical Carbon Dioxide Power Cycle Comparison to Other Advanced Cycles Nuclear Technology vol 154 no 3 pp 283-301 June 2006
[20] J Sarkar Second Law Analysis of Supercritical CO2 Recompression Cycle Energy vol 34 no 10 pp 1172-1178 September 2009
[21] J Ashcroft K Kimball M Corcoran Overview of Naval Reactors Program Development of the Supercritical Carbon Dioxide Brayton System in Supercritical COz Power Cycle Symposium 2009 Troy NY USA 2009
[22] V Dostal M Kulhanek Research on the Supercritical Carbon Dioxide Cycles in the Czech Republic in Supercritical CO2 Power Cycle Symposium 2009 Troy NY USA 2009
120
[23] FW Schremp GR Roberson Effect of Supercritical Carbon Dioxide (CO2) on Construction Materials Society of Petroleum Engineers Journal vol 15 no 3 pp 227-233 June 1975
[24] EM Russick et al Corrosive Effects of Supercritical Carbon Dioxide and Cosolvents on Metals The Journal of Supercritical Fluids vol 9 no 1 pp 43-50 Mar 1996
[25] WA Propp et al Corrosion in Supercritical Fluids Idaho National Laboratory Idaho Falls ID INEL-960180 May 1996
[26] C Tyzack HC Cowen The Corrosion of Reactor Materials in Carbon Dioxide Atomic Energy Review vol 14 no 2 pp 263-324 1976
[27] RA Brierley Studies of the Oxidation of 9 and 12 Cr Steels in High Temperature High Pressure CO2 in Proc of the British Nuclear Energy Society International Conference at Reading University Berkshire UK 23-24 Sept 1974 pp 165-179
[28] PC Rowlands et al Oxidation of 9 Cr Steels in High Pressure High Temperature CO2 in Proc of the British Nuclear Energy Society International Conference at Reading University Berkshire UK 23-24 Sept 1974 pp 193-207
[29] PL Harrison et al The Oxidation of 9Cr IMo Steels in Carbon Dioxide - A Discussion of Possible Mechanisms in Proc of the British Nuclear Energy Society International Conference at Reading University Berkshire UK 23-24 Sept 1974 pp 220-233
[30] MGC Cox B McEnaney VD Scott Structure and Growth of Oxide on Iron-Chromium Alloys in Proc of the British Nuclear Energy Society International Conference at Reading University Berkshire UK 23-24 Sept 1974 pp 247-256
[31] PL Surman et a l Methods of Controlling the Oxidation of 9CrlMo Steel in High Temperature CO2 in Proc of the British Nuclear Energy Society International Conference at Reading University Berkshire UK 23-24 Sept 1974 pp257-271
[32] JCP Garrett et al Some Factors in the Oxidation of Austenitic Stainless Steels in Proc of the British Nuclear Energy Society International Conference at Reading University Berkshire UK 23-24 Sept 1974 pp 298-310
121
[33] T Furukawa Y Inagaki M Aritomi Corrosion Behaviour of FBR Structural Materials in High Temperature Supercritical Carbon Dioxide Journal of Power and Energy Systems vol 4 no 1 pp 252-261 2010
[34] JP Gibbs Corrosion of Various Engineering Alloys in Supercritical Carbon Dioxide Massachusetts Institute of Technology Cambridge MA MS Thesis June 2010
[35] JY Lim et al Corrosion of Materials in Supercritical Carbon Dioxide Environments in Proc of NACE International Corrosion 2008 New Orleans LA 16-20 Mar 2008
[36] K Sridharan et al Corrosion of Candidate Alloys in Supercritical Carbon Dioxide in Proc of Supercritical CO2 Power Cycle Symp Troy NY 29-30 Apr 2009
[37] F Rouillard F Charton G Moine Corrosion Behaviour of Different Metallic Materials in Supercritical CO2 at 550degC and 250 bars in Proc of Supercritical C02 Power Cycle Symp Troy NY 29-30 Apr 2009
[38] MW Dunlevy An Exploration of the Effect of Temperature on Different Alloys in a Supercritical Carbon Dioxide Environment Massachusetts Institute of Technology Cambridge MA MS Thesis Sept 2009
[39] M Donachie Jr S Donachie Superalloys A Technical Guide 2nd ed Materials Park OH ASM International 2002
[40] RC Reed The Superalloys Fundamentals and Applications New York NY USA Cambridge University Press 2006
[41] CT Sims NS Stoloff WC Hagel Superalloys II New York NY USA Wiley-Interscience 1987
[42] M Durand-Charre The Microstructure of Superalloys Amsterdam The Netherlands Gordon and Breach Science Publishers 1997
[43] TM Pollock S Tin Nickel-Based Superalloys for Advanced Turbine Engines Chemistry Microstructure and Properties Journal of Propulsion and Power vol 22 no 2 pp 361-374 March-April 2006
[44] JR Davis Nickel Cobalt and Their Alloys Materials Park OH ASM International 2000
122
[45] GY Lai High-Temperature Corrosion and Materials Applications Materials Park OH ASM International 2007
[46] TJA Richardson Ed Shreirs Corrosion 4th ed Oxford UK Elsevier Ltd 2010 vol I
[47] N Birks GH Meier FS Pettit Introduction to the High-Temperature Oxidation of Metals 2nd ed Cambridge UK Cambridge University Press 2006
[48] P Kofstad High Temperature Corrosion London and New York Elsevier Applied Science Publishers Ltd 1988
[49] O Toft S0rensen Ed Nonstoichiometric Oxides London UK Academic Press Inc 1981
[50] R Prescott MJ Graham The Formation of Aluminium Oxide Scales on High-Temperature Alloys Oxidation of Metals vol 38 no 34 pp 233-254 1992
[51] GB Gibbs RE Pendlebury MR Wootton Protective and Breakaway Oxidation of Mild Steel in CO2 in Proc of the British Nuclear Energy Society International Conference at Reading University Berkshire UK 23-24 Sept 1974 pp 59-72
[52] AM Pritchard et al Some Investigations into the Mechanism of Breakaway Oxidation of Three Mild Steels in High Pressure C0 2 at 500degC in Proc of the British Nuclear Energy Society International Conference at Reading University Berkshire UK 23-24 Sept 1974 pp 73-84
[53] DJ Young High Temperature Oxidation and Corrosion of Metals Oxford UK Elsevier Ltd 2008
[54] HJ Grabke I Wolf Carburization and Oxidation Materials Science and Engineering vol 87 pp 23-33 Mar 1987
[55] M Schutze HJ Grabke Ed Corrosion by Carbon and Nitrogen - Metal Dusting Carburization and Nitridation Cambridge UK Woodland Publishing Ltd 2007
[56] P Szakalos M Lundberg R Pettersson Metal Dusting on an Alumina-forming Ni-base Alloy Corrosion Science vol 48 no 7 pp 1679-1695 July 2006
[57] SR Shatynski The Thermochemistry of Transition Metal Carbides Oxidation of Metals vol 13 no 2 pp 105-118 Apr 1979
123
[58] D Farkas Corrosion of Nickel-Base Superalloys in Simultaneous Carburizing and Oxidizing Environments in Proc of Materials in Nuclear Energy Huntsville ON 29 Sept-2 Oct 1982 pp 227-233
[59] M Shindo H Nakajima Effects of Carburization and Aging on the Tensile Properties of an Experimental Ni-Cr-W Superalloy Journal of Nuclear Materials vol 144 no 1-2 pp 20-28 Jan 1987
[60] J Zhang DJ Young Kinetics and Mechanisms of Nickel Metal Dusting I Kinetics and Morphology Corrosion Science vol 49 no 3 pp 1496-1512 Mar 2007
[61] GW Stachowiak AW Batchelor Engineering Tribology Oxford UK Elsevier Ltd 2005
[62] AW Batchelor LN Lam M Chandrasekaran Materials Degradation and its Control by Surface Engineering 2nd ed London UK Imperial College Press 2002
[63] I Kleis P Kulu Solid Particle Erosion Occurrence Prediction and Control London UK Springer Ltd 2008
[64] DM Rishel FS Pettit N Birks Some Principal Mechanisms in the Simultaneous Erosion and Corrosion Attack of Metals at High Temperatures Materials Science and Engineering vol 143 no 1-2 pp 197-211 Sept 1991
[65] R Baboian Ed Corrosion Tests and Standards Application and Interpretation 2nd ed West Conshohocken PA ASTM International 2005
[66] DB Meadowcroft HJ Grabke Ed Guidelines for Methods of Testing and Research in High Temperature Corrosion London UK The Institute of Materials 1995
[67] JR Nicholls Laboratory Studies of Erosion-Corrosion Processes Under Oxidising and OxidisingSulphidising Conditions Materials at High Temperatures vol 14 no 3 pp 289-306 1997
[68] N Hayashi et al Development of a New Testing Method by Centrifugal Erosion Tester at Elevated Temperature Wear vol 258 no 1-4 pp 443-457 Jan 2005
[69] FH Stott et al The Erosion-Corrosion of Alloys Under Oxidizing-Sulphidizing Conditions at High Temperature Wear vol 186-187 no 1 pp 291-298 July 1995
124
[70] AV Levy Solid Particle Erosion and Erosion-Corrosion of Materials Materials Park OH ASM International 1995
[71] WF Adler Erosion Prevention and Useful Application Baltimore MD ASTM 1979
[72] AV Levy J Yan J Patterson Elevated Temperature Erosion of Steels Wear vol 108 no 1 pp 43-60 Mar 1986
[73] R Flitney Seals and Sealing Handbook 5th ed Oxford UK Elsevier Ltd 2007
[74] R Viswanathan Boiler Materials for USC Plant in 17th Annual NETL Conf on Fossil Energy Materials 22-24 Apr 2003
[75] Y Kato Overview of Supercritical CO2 Cycle Studies at TokyoTech in Proc of MIT-TokyoTech Symp on Innovative Nuclear Energy Systems Cambridge MA 2-4 Nov 2005
[76] P Hejzlar et al Supercritical CO2 Brayton Cycle for Medium Power Applications Massachusetts Institute of Technology Cambridge MA MIT-ANP-PR-117 July 2007
[77] INL Portal (Dec 2010) Fiscal Year 2010 Nuclear Energy University Program Research and Development Awards [Online] httpsinlportalinlgovportal serverptgatewayPTARGS_0_2_61553_0_0_1810-872_Sridharan_lmp_5-6-10pdf
[78] F Rouillard Private communication Mar 2011
[79] TJA Richardson Ed Shreirs Corrosion 4th ed Oxford UK Elsevier Ltd 2010 vol II
[80] BA Sexton RStC Smart DJ OConnor Ed Surface Analysis Methods in Materials Science 2nd ed Heidelberg Germany Springer 2003
[81] JE Antill JB Warburton Oxidation of Nickel by Carbon Dioxide Journal of the Electrochemical Society vol 114 no 12 pp 1215-1221 Dec 1967
[82] US DOE (Mar 2011) Oxide Dispersion-Strengthened Alloys - Fossil Energy [Online] httpfossilenergygovinteraationalPublicationsDECC_task_08_US_2pagepdf
[83] C Moore Private Communication Mar 2011
125
[84] C Moore PVECalc-3786 unpublished
[85] A Schuegraf Preliminary Heating Characteristics of IN-625 Pressure Vessel unpublished
[86] JR Farr MH Jawad Guidebook for the Design ofASME Section VIII Pressure Vessels 2nd ed New York NY ASME Press 2001
[87] (Mar 2011) Oceaneering - Graylocreg Products [Online] http wwwoceaneeringcomoceandocumentsbrochuressubseaproductsGRLC20-20The20Ultimate20Connectorpdf
[88] SC Hydraulic Engineering Corporation (Mar 2010) GB Gas Boosters and Systems - Rev 10-15-06 [Online] httpwwwschydrauliccomdocuments GasBoosterREVl 0-15-06pdf
[89] American Petroleum Institute Sizing Selection and Installation of Pressure-Relieving Devices in Refineries Part I Washington DC API Publishing Services Jan 2000
[90] JP Holman Heat Transfer 9th ed New York NY McGraw-Hill 2002
APPENDIX A Bill of Materials
ID
V-l
V-2
V-3
U-l
V-4
FR-l
V-5
BP-1
V-6
U-2 U-3
PV-1
R-l
V-7 V-9
V-8
BD-1
F-l
PV-2
V-10
V-l l
V-12
COMPONENT DESCRIPTION
14 in tube fitting ball valve
18 in NPT normally-closed solenoid valve
14 in tube fitting three-way ball valve
Tee-type 150 urn particulate filter
12 in FNPT ball valve
34 in FNPT filter-regulator
34 in NPT normally-closed solenoid valve
Double acting two-stage gas booster pump
14 in check valve 10 psig cracking pressure
Tee-type 70 um particulate filter
14 in FNPT 300 mL sample cylinder
0 to 4000 psig SS regulator 14 in MNPT ports
14 in tube fitting high-pressure ball valve
F84-M safety valve 2370 psig set pressure
F84-M safety valve 3590 psig set pressure
34 in FNPT SFAZ-UT burst disk holder
12 in SFAZ-002 rupture disk 2560 psig burst pressure
12 in SFAZ-002 rupture disk 4266 psig burst pressure
Three-zone 1100degC split tube furnace
Three-zone furnace controller
10 in ID X 125 in wall IN-625 pressure vessel
316-SS machined blind hub
316-SS Graylocreg clamp assembly
17-4 PHSS sealing ring
14 in tube fitting X 14 in tube fitting X 14 in FNPT three-way high-pressure ball valve
18 in NPT metering valve 000005 max C v
14 in FNPT variable area flowmeter 05 to 50 std Lhr
PART NO
SS-43S4
8264G009
SS-43GXS4
SS-4TF-15
465499
B74G-6AK-QD3-RMG-FR
8210G95
GBT-1530
SS-CHS4-10
SS-4TF-7
316L-50DF4-300-PD
PR57-1F11Q2N14F
SS-83PS4
01-2183L-103SL
FS2U
UD-SFAZ-UT-00-0013-02
XST-6-0-24-3V
3-1-40-230-E15SP
3-GR20
2-12-3
GR20
SS-83XPS4
CC-A16A21APE
VAF-G1-01M-1-0
QTY
2
2
2
1
4 each
1
1
1
2
2
3
1
1
1
FITTINGS INSTRUMENTATION AND MISCELLANEOUS COMPONENTS
ID
P-01
P-03 P-04
P-05
P-06
T-01T-03 T-04 T-05 T-07 T 08 T-09 T-10
T-02 T-l l
T-06
T-12T-13
COMPONENT DESCRIPTION
14 in tube fitting X 14 in tube fitting X 14 in FNPTTee
14 in MNPTplug
14 in tube fitting X 14 in MNPT straight
34 in FNPT full flow quick-connect body
34 in FNPT full flow quick-connect stem
38 in thermoplastic hose 38 in SS MNPT
14 in tube fitting Tee
14 in tube fitting X 14 in FNPT elbow
14 in tube fitting elbow
14 in MNPT X 12 in tube adapter straight
14 in MNPT X 34 in MNPT reducer
12 in tube fitting X 34 in MNPT straight
14 in tube fitting cross
14 in tube adapter X 12 in FNPT straight
14 in tube adapter X 18 in tube fitting straight bored through
14 in tube adapter X 18 in tube fitting straight
14 in tube fitting X 18 in MNPT straight
0 to 300 psig gauge 50 mm face 14 in MNPT
0 to 6000 psig gauge 2 5 m face 14 in MNPT
0 to 6000 psig transmitter 12 in MNPT
0 to 5 psig gauge 2 5 in face 14 in MNPT
Self-adhesive K-type thermocouple
K-type single-point thermocouple probe IN-600 18 in diameter 41 in length sheath
K-type multi-point profile probe IN-600 18 m diameter 53 in length sheath
thermocouples 0 3 6 9 12 and 18 in from tip
K-type IN-600 over-braided thermocouple
K-type single-point thermocouple probe 304-SS 18 in diameter 3 in length sheath
18 in OD X 0 028 in wall SS-316316L tubing
14 m O D X 0 035in wall SS-316316L tubing
12 in O D X 0 065in wall SS-316316L tubing
14 in OD X 116 in wall vinyl tubing
12 0 ft heating cord 250 W output
PART NO
SS-400-3-4TTF
SS-4-P
SS-400-1-4
SS-QF12-B-12PF
SS-QF12-S-12PF
SS-7R6-PM6-PM6-30
SS-400-3
SS-400-8-4
SS-400-9
SS-8-TA-1-4
SS-12-HRN-4
SS-810-1-12
SS-400-4
SS-4-TA-7-8
SS-200-R-4BT
SS-200-R-4
SS-400-1-2
PGI-50M-PG300-CAOX-BG
G058113
PMP71 -WAC1W21RD AAA
33075
SA1-K-SRTC
KQIN-18U-41
EIPP6012
XCIB-K-2-1-3
KTSS-18G-3
SS-T2-S-028
SS-T4-S-035
SS-T8-S-065
LT-2-4
HTC-120
QTY
6
2
12
1
1
1
4
2
1
1
1
1
1
1
4
2
2
1
2
1
1
8
2
1
1
2
20 ft
50 ft
20 ft
10 ft
2
FITTINGS INSTRUMENTATION AND MISCELLANEOUS COMPONENTS (CONTD)
ID COMPONENT DESCRIPTION
Portable temperature controller 10 to 79degC range
38 in ID X 18 in wall elastomeric insulation
Adjustable height support stand 150 lb capacity
Alumina specimen boat assembly
Isolated input multi-channel data logger
24 VDC 600 W power supply
Hinged electrical enclosure
500 mL Erlenmeyer flask
Size 6 two-hole rubber stopper
PART NO
CN-TOT-A-175JF-120V
M06010
9967T45
GL820
S8VS-06024
R201206
FLA204
DPSSTO3032
QTY
2
24 ft
2
1
1
1
1
2
2
APPENDIX B Representative Thermal Profiles of the Pressure Vessel
700
600
U 500 --
pound 400
300 --S3 i -
a = pound 200
100
0
1 1
j bull_ bull bull p bull bull
1 1
J
1
i
bullMetal Temperature
bullFluid Temperature
-mdash bull l bull bull
1
0 025 05 075
Normalized Pressure Vessel Length
Figure B-1 Temperature distribution at 150 MPa for [685degC | 610degC | 645degC]
700
600 -
u o
S + S3 i-
o s 3
500
400
300
200
100 -
0
4 1 j|laquoPB
bullMetal Temperature
bull Fluid Temperature
bull bull
__ j j i
T - 1
- - - - -
lt bull
0 025 05 075
Normalized Pressure Vessel Length
Figure B-2 Temperature distribution at 150 MPa for [725degC | 640degC | 690degC]
800
700
G 600
1 5 0 deg 1 400
I 300 s 200
100
0
1 1 1 1 1 1
J ^
bull bull bull bull bull
bull
bull Metal Temperature
bull Fluid Temperature i
bull bull
I J [ bulllt
i i i
0 025 05 075
Normalized Pressure Vessel Length
Figure B-3 Temperature distribution at 150 MPa for [755degC | 695degC | 725degC]
U o
1
3
800
700
600
500
400 -f
S- 300
pound 200 plusmn
100
0
4 1 r bullbullbull
bullMetal Temperature
bull Fluid Temperature
bull bull bull
bull i i i bull
i i i
0 025 05 075
Normalized Pressure Vessel Length
Figure B-4 Temperature distribution at 150 MPa for [785degC | 735degC | 780degC]
131
U o o u 3 S3 s-V a E
900
800
700
600
500
400
300
200
100
0
1 bull 1 mdash 1 1 1 1
T _ _ _ bull
bullMetal Temperature
bullFluid Temperature 1
bull bull I
bull J i Lmdashbull_
bull i bull w 1 1 1
- i i i
0 025 05 075
Normalized Pressure Vessel Length
Figure B-5 Temperature distribution at 150 MPa for [800degC | 750degC | 800degC]
700
600
U 500
3 -n cs
a S pound
400
300
200
100 -
0
i
-
J laquobull MMm T-2 bent out of
- - centre and moved closer to wall
bullMetal Temperature
bullFluid Temperature
bull i i i i
bull bull __ T ____ r ^
bull _ 1 + |
bull i l l i i i i i i
i i i i i i
1 1 1
0 025 05 075
Normalized Pressure Vessel Length
Figure B-6 Temperature distribution at 250 MPa for [685degC | 610degC | 645degC]
700
600
500
400
300
200
100
0
1 1
bull
1 1
bull bull
T-2 bent out of - - centre and moved
closer to wall
i
bullMetal Temperature
bullFluid Temperature
bull i i i i i i
bull i bull i i i ^
i i i i i i i i i i i i
025 05 075
Normalized Pressure Vessel Length
Figure B-7 Temperature distribution at 250 MPa for [725degC | 640degC | 690degC]

X
Figure 4-3 Graylocreg connector prior to (left) and following (right) tightening
Adapted from [87] 75
Figure 4-4 Working drawing of the IN-625 pressure vessel [84] 76
Figure 4-5 Furnace dimensions and heated zone locations 78
Figure 4-6 Overpressurization protection flowchart 80
Figure 4-7 Circuit diagram of solenoid valve relay 82
Figure 4-8 Alumina specimen boat 83
Figure 4-9 PampID for Carleton-NRCan high temperature S-CO2 corrosion test rig 84
Figure 4-10 Carleton-NRCan high temperature S-CO2 corrosion test rig 85
Figure 4-11 Inlet connections to the GBT-1530 gas booster 87
Figure 4-12 At the outlet of the GBT-1530 gas booster 89
Figure 4-13 At the inlet to the pressure vessel 90
Figure 4-14 Downstream of the pressure vessel 92
Figure 4-15 Electrical enclosure 93
Figure 4-16 Thermocouple locations along the length of the pressure vessel 93
Figure 5-1 Location of thermocouples within the pressure vessel (hatched) 96
Figure 5-2 Initial temperature distribution at 150 MPa for furnace set points of
600degC 97
Figure 5-3 Heat reflector positioning within the pressure vessel (hatched) 98
Figure 5-4 Heat reflectors attached to the profile probe sheath 98
Figure 5-5 Effectiveness of the heat reflectors on raising fluid temperature at 150 MPa for furnace set points of 600degC 100
Figure 5-6 Change in metal temperature following the addition of the heat reflectors at 150 MPa for furnace set points of 600degC 101
Figure 5-7 Temperature distributions for 550 600 650 and 700degC using the established furnace set points 104
xi
Figure 5-8 Validation of the furnace set points to give 550degC at 150 MPa 106
Figure 5-9 Validation of the furnace set points to give 600degC at 150 MPa 106
Figure 5-10 Validation of the furnace set points to give 650degC at 150 MPa 107
Figure 5-11 Validation of the furnace set points to give 700degC at 150 MPa 107
Figure 5-12 Temperature distribution using furnace set points of
[800degC | 750degC | 800degC] at 150 MPa 109
Figure 5-13 Pressure variations at 150 MPa over a 10 hour period at 650degC 110
Figure 5-14 Temperature variations at 650degC over a 10 hour period at 150 MPa 110
Figure 5-15 Differences in metal temperature at 250 MPa from 150 MPa for equivalent furnace set points 112
Figure 5-16 Temperature distributions using fixed furnace set points of [685degC | 610degC | 645degC] at 150 and 250 MPa 112
Figure 5-17 Temperature distributions using fixed furnace set points of [725degC | 640degC | 690degC] at 150 and 250 MPa 113
Figure 5-18 Thermal response of T-15 from room temperature to fixed furnace set points of [685degC | 610degC | 645degC] at 150 and 250 MPa 113
xii
List of Appendices
APPENDIX A Bill of Materials 126
APPENDIX B Representative Thermal Profiles of the Pressure Vessel 129
Introduction
1
11 Demand for Advanced Power Conversion Cycles
The International Energy Agency (IEA) estimates that the global electricity demand
will increase 76 between 2007 and 2030 This marked growth is a direct result of the
continued development and maturation of non-Organization for Economic Co-operation
and Development (OECD) economies Assuming albeit highly unlikely that no changes
are made to existing governmental energy policies Figure 1-1 shows that fossil fuels will
supplement the majority of this increase in electricity generation [1] The combustion of
fossil fuels however has an adverse effect on the environment and potentially the
climate because of the emissions that are produced At the very least efficiency gains
must be made to the design and operation of fossil fuel-based electrical power plants
either by increasing their operating conditions or utilizing improved combustion
technologies The capture and sequestration of carbon emissions would also lessen the
environmental impact of fossil fuel combustion but not remove it entirely Current
carbon dioxide (CO2) capture processes though are energy-intensive and may actually
decrease the electrical output of a power plant once implemented [2] Reducing the role
of fossil fuels in the energy production aggregate represents a more complete solution to
an environmentally-conscience energy source Nuclear energy has the potential to offset
this reduced role
With the intent of achieving the mainstream use of nuclear energy the Generation-
IV International Forum (GIF) was established to facilitate research and development
efforts of future nuclear energy systems Six reactor designs were chosen by the GIF that
2
were deemed to offer the most promise in areas such as sustainability economic
competitiveness safety and proliferation resistance and physical protection In addition
the supercritical Rankine steam cycle helium Brayton cycle and supercritical carbon
dioxide (S-CO2) Brayton cycle were selected as the electric power conversion systems to
complement the Generation-IV reactors [3-5] The inherent advantages of the S-CO2
Brayton cycle in comparison to the other cycles mentioned will be briefly discussed in
the section to follow
2007 2015
bull 2030
Hydro ^ ^ ^ ^ ^ ^ ^ ^ ^ ^ ^ _
t - Gas ^ ^ ^ ^ ^ ^ ^ ^ ^ ^ ^ ^ ^ ^ ^ ^ ^ ^ _
Coal ^ ^ ^ ^ ^ ^ ^ ^ ^ ^ ^ ^ ^ ^ ^ ^ ^ ^ ^ ^ ^ ^ ^ ^ ^ ^ ^ ^ ^ ^ ^ ^ ^ ^ ^ ^ ^ ^ - ^ 1 1 1 1
0 4 000 BOM 12 000 16 WO
TWh
Figure 1-1 Global electricity generation by fuel type [1]
The S-CO2 cycle was originally envisioned to be used as the power conversion
system in both the lead-cooled fast reactor (LFR) and sodium-cooled fast reactor (SFR)
because of their intermediate (550degC) core outlet temperature More recent developments
[46-11] have also suggested the favourable application of this cycle to other advanced
reactor concepts in particular the gas-cooled fast reactor (GFR) molten salt reactor
(MSR) and very high temperature reactor (VHTR) Outside the nuclear field the S-CO2
cycle is being actively researched as an alternative to the traditional steam and organic
Oil
Btomass
Other renewable
Nuclear
3
Rankine cycles used in concentrated solar [1213] and nuclear ship propulsion [6]
systems In fossil fuel-based cogeneration installations the S-CO2 cycle is also being
considered as a possible bottoming cycle option for waste heat recovery [14]
12 S-CO2 Brayton Cycle
The S-CO2 cycle is intended to operate as a closed system and exclusively above
the critical point of C02 ie above 3103degC (30418 K) and 738 MPa (738 bar) [15]
Carbon dioxide phase diagrams are shown in Figure 1-2 for both the pressure-
temperature and density-pressure planes Above the critical point liquid and gaseous
phases become indistinguishable - represented in Figure l-2a by dashed phase
boundaries - and CO2 exists as a homogenous supercritical fluid phase At temperatures
and pressures far exceeding those that define the critical point S-CO2 fluid behaviour
approximates that of an ideal gas Only near the critical point do fluid properties such as
density viscosity and specific heat capacity exhibit large gradients with small changes
in temperature [616] Figure l-2b illustrates how significant this temperature sensitivity
is on the density and hence the compressibility of S-CO2
Exploiting the low compressibility of CO2 in the vicinity of its critical point is
what gives the S-CO2 cycle a distinct advantage over the ideal gas helium Brayton cycle
the extremely low critical point of helium (-26795degC) [17] makes it impracticable to
benefit from these same real gas properties Consequently the S-CO2 cycle uses only
30 of its total turbine work for compression as opposed to the 45 needed by the
helium cycle This reduced compressor work eliminates the need for intercooling
4
decreasing the overall plant footprint complexity and cost [6818-22] Figure 1-3
depicts the extremely compact turbomachinery of the S-CO2 cycle in relation to the
helium Brayton and supercritical Rankine steam cycles
10000
1000
3 w
Q
(a) 200 250 300 350
temperature (K)
400
1000
30 50 70 90 110 130 150 170
(b) pressure (bar
Figure 1-2 CO2 phase diagrams for the (a) pressure-temperature plane and (b) density-pressure plane [16]
bull Steam Turbine 55 stages 250 M W
Mitsubishi Heavy Industries Ltd Japan (with casing)
Helium Turbine 17 stages 333 M W (167 MW e ) XL Yan LM Lidsky (MIT) (without casing)
S-C0 2 Turb ine 4 stages 450 M W (300 MW e ) (without casing and with compressors of comparable size)
Figure 1-3 Marked differences in turbine size among the advanced power cycles [6]
The proposed turbine inlet conditions for the S-C02 and helium Brayton cycles
differ considerably as well Using a thermal efficiency of 45 as a benchmark between
cycles the S-CO2 recompression cycle (the most efficient of all the layouts investigated)
needs only 550degC and 200 MPa to attain this level compared to the 750degC (closer to
800degC if all losses are considered) and 80 MPa required by the helium Brayton cycle [6]
Figure 1-4 provides a temperature-entropy (T-s) diagram for the S-CO2 recompression
cycle illustrating how heat rejection is minimized (or efficiency is improved) with the
addition of another compressor before the pre-cooler The higher operating temperature
of the helium cycle imposes a significant demand on both component cooling and
material requirements [6-81819] In terms of material strength and creep resistance the
higher operating pressure of the S-CO2 recompression cycle is less problematic at the
5 m
6
lower turbine inlet temperature (TIT) Furthermore a higher operating pressure reduces
the detrimental effects that fractional pressure drops have on cycle efficiency Thermal
efficiencies for the supercritical Rankine cycle and both Brayton cycles are plotted in
Figure 1-5 for TITs between 350 and 950degC inclusively For TITs above 550degC the
S-CO2 recompression cycle is the most advantageous of the three cycles considered this
is promising for even greater efficiency gains once confidence is acquired at lower the
initial operating temperature Although the Rankine cycle appears to have superiority
over the S-CO2 recompression cycle at lower temperatures the added plant complexity
and auxiliaries required to do so lead to a higher capital investment [6-819]
6 0 0 i bull bull j bull bull bull 1
13 15 17 19 21 23 25 27
Entropy (kJkgK)
Figure 1-4 T-s diagram for the S-CO2 recompression cycle Adapted from [6]
7
10 bull - Supercritical C02 Brayton cycle
bullmdashHelium Brayton cycle
4mdash Supercritical Rankine steam cycle
350 450 550 650 750 Turbine Inlet Temperature (degC)
850 950
Figure 1-5 An efficiency comparison of the S-CO2 helium Brayton and supercritical Rankine cycles between 350 and 950degC Reproduced from [6]
13 High Temperature S-CO2 Corrosion
While the S-CO2 Brayton cycle offers merit in achieving high thermal efficiencies
the novelty of this cycle poses a unique challenge relating to material selection - the
compatibility of materials with CO2 at the temperature and pressure combination dictated
by the S-CO2 recompression cycle is relatively unknown For the most part CO2
corrosion studies originating from the oil and gas industry involve carbon steels and gas
compositions (high sulphur and water content) [23] that are likely never to be used or
encountered within a S-CO2 cycle Moreover the small fraction of corrosion tests
conducted at supercritical conditions with relatively pure CO2 and prior to the
8
realization of the S-CO2 cycle were done so at rather low temperatures (54 to 238degC)
[2425] Experience with the British Magnox and advanced gas reactor (AGR) program
can provide more relevant insight into material interaction with high temperature CO2 but
only at subcritical pressures - the maximum being about 53 MPa Apart from some
reactor-specific alloys [26] corrosion data obtained as a result of this nuclear program
was primarily for mild and stainless steels [27-32]
The ability to conduct accelerated laboratory corrosion testing in a high
temperature S-CO2 environment is warranted yet still only possible at a small number of
institutions worldwide Preliminary results published by these institutions correlate well
with what was observed in the AGR program despite the differences in pressure
Regarding corrosion resistance austenitic stainless steels still outperform their ferritic
counterparts mainly because of greater chromium (Cr) content [33-37] Repeated testing
at supercritical conditions is required to determine what effect if any pressure has on the
formation and protectiveness of oxide layers Although these S-CO2 studies focused
predominantly on the corrosion behaviour of steels the nickel-base superalloys that were
tested also demonstrated excellent corrosion resistance [343638] Corrosion data
relating to this family of superalloys however needs to be expanded as they represent the
logical material choice for the S-CO2 turbomachinery and heat exchangers Additionally
the duration of future S-CO2 corrosion tests will also need to increase to properly
characterize the corrosion mechanisms involved and assess the long-term stability of
oxide layers
9
14 Objective and Organization of Thesis
In a collaborative effort between Carleton University and CanmetENERGY of
Natural Resources Canada (NRCan) the development and optimization of a 100 MWe
S-CO2 advanced Brayton cycle has been initiated As part of the overall scope of this
project a long-term S-CO2 corrosion study is required to evaluate the corrosion
behaviour of selected structural materials The main objective of this thesis is therefore
to design construct and commission a S-CO2 corrosion test loop that will be used to
conduct this study
In the subsequent chapter an introduction to high temperature corrosion
mechanisms and testing methods is presented at the outset to accompany a review of past
and current high temperature CO2 corrosion studies The specific objectives of this thesis
are outlined in Chapter 3 Chapter 4 describes the design and assembly of the S-CO2
corrosion test loop while its commissioning is detailed in Chapter 5 Finally Chapter 6
summarizes the work carried out for this project draws upon the major conclusions and
lays out recommendations for future work
10
2 Literature Review - High Temperature S-C02 Corrosion Testing
This chapter provides a detailed review of high temperature metal corrosion in a
S-CO2 environment An overview of high temperature materials exclusively the nickel-
base class of superalloys is first presented Following this the thermodynamic and
kinetic principles of high temperature corrosion are explained While several modes of
high temperature corrosion are recognized only those that seem apt for a carbon-rich
atmosphere and closed-cycle gas turbine application will be discussed High temperature
corrosion tests are then described in addition to the methods used to both quantify and
evaluate the extent of corrosion Finally a survey detailing metallic interaction with a
CCgt2-rich environment concludes this chapter This survey begins with high temperature
corrosion investigations conducted at subcritical CO2 pressures and ends with the most
recent corrosion studies related to the S-CO2 Brayton cycle
21 A Primer on High Temperature Materials
High temperature materials more commonly referred to as superalloys consist of
nickel- nickel-iron- and cobalt-base alloy systems At service temperatures above
540degC superalloys possess high creep-rupture strength and exhibit a considerable
resistance to thermo-mechanical fatigue oxidation and corrosion [39-42] This primer
however will focus only on the metallurgical aspects (namely the composition
microstructures processing methods and surface protection) of nickel-base superalloys
due to their prevalence in current gas turbine applications The reader is directed to work
by Donachie [39] for a more comprehensive discussion of all the superalloy classes
11
Nominal compositions of some representative nickel-base superalloys are given in
Table 2-1 The controlled alloying elements - possibly as many as fourteen - that
comprise the listed superalloys have a major influence on the phase structures that form
as well as the mechanical properties and environmental protection that they impart
Thus each element can be classified as having one or more of the following roles within
the nickel-base superalloy matrix strengthener intermetallic precipitate former carbide
former grain boundary strengthener or surface stabilizer [3940] Table 2-2 summarizes
the specific roles of the various alloying elements
Table 2-1 Compositions of some common nickel-base superalloys [4043]
Alloy
Waspaloy Udimet 720
Mar-M246 IN-713LC
IN-792
PWA 1480 CMSX-2
PWA 1484 CMSX-4
CMSX-10
TMS-162
Cr
195 179
83 120
124
100 80
50 65
20
29
Co
135 147
100 -
92
Nominal Composition (wt
Mo W Ta Re Ru
Wrought Superalloys
43 -
30 13 - - -
Conventionally Cast Alloys
07 100 30 45 - -
Directionally Solidified Alloy
19 39 42
bal Ni)
Nb
-
-
-
20
-
First-Generation Single-Crystal Alloys
50 50
40 120 06 80 60
-
-
Second-Generation Single-Crystal Alloys
100 96
20 60 90 30 -06 64 65 30 -
-
-
Third-Generation Single-Crystal Alloy
30 04 50 80 60 - -
Fourth-Generation Single-Crystal Alloy
58 39 58 56 49 60
Al
13 25
55 59
35
50 56
56 56
57
58
Ti
30 50
10 06
39
15 10
-
10
02
-
Hf
-
~
150 -
-
-
-
010 010
003
009
c
008 004
014 016
007
-
-
-
-
-
-
12
Table 2-2 The roles of selected alloying elements in nickel-base superalloys [3940]
Alloying Element Purpose
Cr Co Mo W Fe Re Ta Nb Al Ti Hf C B Zr
Matrix Strengthener X X X X X X
Intermetallic v
Precipitate Former
Carbide Former X X X X
Grain Boundary Strengthener
Surface Stabilizer X
Nickel-base superalloys consist of a face-centred cubic (FCC) gamma (austenitic)
matrix together with several secondary phases The coherent intermetallic gamma prime
(y) phase and the carbides are for the scope of this review considered to be the most
relevant secondary phases The y-phase constitutes the ordered Ni3(AlTi) compounds
that nucleate within the austenitic matrix from an initial solution heat treatment and
evolve with subsequent aging heat treatment(s) The presence of the y-phase distorts the
austenitic matrix so as to impede the movement of dislocations and hence conferring
strength to the superalloy the volume fraction particle size and morphology of the
y-phase all dictate to what extent this strengthening mechanism occurs [394042] All
three factors are controlled by the aluminium and titanium contents of the superalloy and
the heat treatments it has been subjected to [39] Figure 2-1 illustrates the creep-rupture
behaviour of a nickel-base superalloy as a function of its y volume fraction Beyond an
optimum volume fraction of approximately 70 further increases in y volume fraction
X X X
X X X
X X X X
X
13
actually reduce creep-rupture life [40] Similarly Figure 2-2 shows an increase in creep-
rupture strength with greater aluminium and titanium contents
10 000 E 1 1 1 1 1 1 r
1000 r
100 r
ogt 0) 3 10 r
0
o bullj p
01
001
A - - -a J I L
- bull - T M S - 7 5 9 0 0 C -laquo -TMS-75 1100 o C -lt^--TMS-82+900degC -iSr-TMS-824-1100C I
0 20 40 60 80 100
Designed amount of y volume fraction ()
Figure 2-1 The relationship between creep-rupture life and y volume fraction [40]
tn
OU
50
40
m
20
10
0
bull
^ gt
bull V
_ v
i i i j
bull
bull
-
bull Wrought bull Cast
_ i 1 J Utrade
- 345
amp 276
- 207 c o o
138
- 67
0 1 2 3 4 5 6 7 8 9 10
Al + Ti content w i
Figure 2-2 Creep-rupture strength as a function of combined Al and Ti content [39]
14
(a) (b) (c)
Figure 2-3 Possible morphologies of grain boundary carbides (a) favourable discrete globular type [39] (b) unfavourable continuous film [44] and
(c) unfavourable discontinuous cellular type [44]
Carbide species that readily form in these superalloys either at grain boundaries or
within the grains include MC M23C6 MeC and M7C3 where M denotes a refractory
metal atom The carbon content of the superalloy as well as the temperature and duration
of its thermal exposure (be it via heat treatment or through service) affect what carbide
type will form Grain boundary carbides specifically their morphology have a
significant effect on creep-rupture behaviour Discrete globular M23C6 carbides prevent
premature failure by inhibiting grain boundary sliding and allowing adjacent grains to
retain enough ductility to accommodate this redistribution of stress Carbides that
precipitate as continuous films or discontinuous cellular formations however are
detrimental to creep-rupture life [394143] These distinct grain boundary carbide
morphologies are shown above in Figure 2-3 Other functions that carbides have in
nickel-base superalloys are to provide secondary strengthening to the austenitic matrix
and bind to impurity elements that would otherwise degrade mechanical properties [39]
15
Nickel-base superalloys are processed in both wrought and cast forms notable
differences in the size morphology and orientation of the grains exist between the two
processing methods [41] Wrought superalloys typically possess excellent tensile
strength and low-cycle-fatigue (LCF) resistance on account of their finer-sized grains
Conversely the coarser grain sizes of cast superalloys enhance high temperature creep-
rupture properties [39404243] Further benefits to creep-rupture properties are possible
if directionally solidified (DS) casting techniques are employed At elevated
temperature metal fracture occurs intergranularly - often initiated at grain boundaries
oriented perpendicular to the direction of applied loading [39] With control over grain
orientation through DS casting transverse grain boundaries can be removed from the
superalloy to extend creep-rupture life Depicted in Figure 2-4 the logical progression of
turbine blade microstructures - from polycrystalline (PC) to columnar grain directionally
solidified (CGDS) and finally single crystal directionally solidified (SCDS) - reiterates
the improved high temperature performance that was realized first with the elimination of
transverse grain boundaries and then grain boundaries altogether
To protect against material degradation nickel-base superalloys are intentionally
alloyed with elements that form thermodynamically-stable oxides - primarily chromia
(Cr203) and alumina (AI2O3) [41] These oxides develop into continuous adherent
surface films which act to isolate the superalloy from its surrounding environment
Compared to an applied diffusion overlay or thermal barrier coating system the C^Ch
and AI2O3 oxide layers are also regenerative in nature that is even with spallation these
oxide layers are ultimately restored by consuming additional alloying species from the
16
austenitic matrix This regenerative ability however can be damaging to mechanical
properties as both chromium and aluminium contribute to strengthening mechanisms of
the nickel-base superalloy Overlay and thermal barrier coatings do offer the added
benefits of being specially tailored to suit a particular service environment and
significantly reducing metal temperatures respectively [3940] The premise behind
oxidation is explained in greater detail in the succeeding section
Figure 2-4 Evolution of cast turbine blade grain structure equiaxed polycrystalline (left) columnar grain directionally solidified (centre)
and single crystal directionally solidified (right) [39]
22 Modes of High Temperature Corrosion
High temperature (above 500degC) corrosion can be regarded as the non-galvanic
electrochemical reaction between a metal and non-metal whose interfacial anode and
cathode are separated by a layer or film of reaction product [4546] While oxidation is
the most prevalent mode of high temperature corrosion other modes - such as
nitridation carburization and metal dusting halogenation sulfidation erosion-corrosion
17
and molten salt deposition - are also possible depending on the atmospheric composition
that the metal is exposed to For the context of this review however only the principles
of oxidation carburization and metal dusting and erosion-corrosion will be considered
Exclusion of the remaining high temperature corrosion modes follows from the logic that
although contaminant species will inevitably exist within the S-CO2 fluid their trace
levels are unlikely to be the controlling corrosion mechanism(s) This section
summarizes the detailed high temperature corrosion reviews conducted by Lai [45]
Shreir [46] Birks Meier and Pettit [47] and Kofstad [48]
221 Oxidation
Oxidation is potentially the most beneficial form of high temperature corrosion
because if properly exploited the ensuing oxide layer or scale serves as an effective
barrier to subsequent metal attack However if this same oxide layer proves to be
thermodynamically unstable or prone to cracking porosity and spallation the protection
it provides may be compromised or absent altogether [4647] Perhaps of even greater
interest is that environments that are otherwise devoid of molecular oxygen (O2) and
therefore have extremely low oxygen activities such as one composed primarily of CO2
can still support oxidation This section provides an understanding behind the basic
thermodynamics responsible for whether an oxide layer will form and if so the kinetics
that determine at what rate it will evolve To complement these oxidation fundamentals
the selective oxidation of high temperature materials specifically Cr2Cgt3- and AI2O3-
forming nickel-base superalloys will conclude this discussion
18
2211 Thermodynamics
The synthesis of a metallic oxide (MxOy) from a metal (M) and a single gaseous
oxidant O2 for simplicity can be represented by a reaction of the general form
2x 2 mdash M(s) + 0 2 (g) laquo -MOy (s) (21) [46]
Whether or not this reaction indeed tends to be product-favouring that is proceeds
from left to right is indicated by its change in Gibbs free energy (AG) By definition AG
characterizes the algebraic sum of the first and second laws of thermodynamics for an
isothermal (constant temperature) and isobaric (constant pressure) process Thus the
Gibbs free energy change of Equation 21 at absolute temperature T is expressed as
a2y AG = AGdeg + RUT bull In tradefy (22) [46]
aM - a o 2 J
where AGdeg is the standard-state Gibbs free energy of formation Ru is the universal gas
constant and a is the chemical activity of the indicated species
Commonly the metal and oxide activities are taken as unity under the assumption
that both are pure solids and therefore due to their small molar volumes are insensitive
to pressure Furthermore if the oxidant behaves as an ideal gas its activity can be
assumed equivalent to its partial pressure P0Xidant in the given atmosphere but normalized
to standard pressure [454648] However for significant deviations from ideal gas
behaviour such as in the supercritical regime fugacity must be used in lieu of partial
pressure to accurately quantify gas concentrations Incorporating these simplifications at
equilibrium (AG = 0) Equation 22 can be rearranged to give the dissociation pressure of
19
the oxide Po^S o r the ambient oxygen partial pressure above which oxidation of the
metal is possible
Over a desired temperature range a convenient means to assess the relative
thermodynamic stabilities of various oxides and similarly the products of other
metalnon-metal reactions is with the use of an Ellingham diagram [45-48] An
Ellingham diagram in its simplest form plots AGdeg per mole of oxidant consumed as a
function of temperature Apart from the noble metals and away from extreme
temperature metals are naturally disposed to oxide formation [46] and Equation 21
consequently proceeds from left to right Increasingly negative values of AGdeg -
tantamount to moving from the top to bottom of the diagram - are indicative of the
difficulty in which an oxide can be reduced [45-48] ie its thermodynamic stability
Regarding alloys the Ellingham diagram provides initial insight into which constituent
elements oxidation will predominate and thus which phase diagram to use to describe
the variation in oxide structure [47] Figure 2-5 shows both Cr2Cgt3 and AI2O3 curves to
fall below that of nickel(II) oxide (NiO) explaining why in nickel-base superalloys a NiO
oxide layer is not favoured at least not for the long term Also noteworthy of Figure 2-5
are the partial pressure nomograms or ancillary scales surrounding the Ellingham
diagram These nomograms give the dissociation pressure of the oxide either directly by
P0 2 or indirectly via the equilibrium ratio of carbon monoxide (CO) to CO2 for the
following reaction
20
C 0 2 ( g ) ~ C O ( g ) + - 0 2 ( g ) (24)
What can be concluded from either nomogram is that the formation of Cr2Cgt3 and AI2O3
are very difficult to prevent [46] - at 550degC Cr203 and the more thermodynamically
stable AI2O3 need PQ2 of only 1038 atm and 1060atm respectively to form
PcoPco2 10- io^ s io- 0 io-9 io-8 io-7 10-8 10-5 10-4
o o E
laquolaquogt
c
II
lt3 -3
I J
o
OK
u
- 1 0 0
- 2 0 0
-300
-400
-500
-600
-700
-800
-900
1000
1100
1200 c
laquo bull
^
9 S J
^
O j
fTTsM2deg
4ampU+
-|3flts
of ^r^^
^
5^
H
j j S amp S ^ ^
=hltdeg
degA 2^
^
^^
i 2 r
yf
on
M
M
c
i deg -
oj
M
temperature degC
200 400
Pa DP( o2
3^2
M |MJ
y gt ^ i
M
lt ^ fit
J S gt
tf8deg2
^e 0
r2gtf w
B(
cU
M
[hj
bdquodegraquo-
lt 7 o r f ^ M
M mdash c o = cos
M
3
B
1M
wi Melting point or metal
m Melting point ot oxide
600 800 1000 1200 1400 1600 mo-m o-K w^ i o - 4 2 i o - M
1 0 - 1 mdash
t o - 2 -
1 0 - 3 mdash
10 - 4 -mdash
l O 6 - ^
1 0 - ^
1 0 1 ^
io - i ^
10 1 ^
10-
10
1 0
1024
io-2 b
N io-2deg
1 0 M
S I O -
1 0 4
1Q-1
1 0
10
10
10
101
Figure 2-5 Ellingham diagram for the oxidation of selected metals [47]
21
2212 Kinetics of Oxide Formation and Growth
The mechanisms and rates of oxide evolution are as equally important as the
underlying thermodynamics in terms of the level of protection that an oxide layer will
impart to its substrate At elevated temperature metallic oxides can typically be
classified as non-stoichiometric ionic compounds meaning that their metal-to-oxygen
atom ratio differs slightly from what their chemical formula would imply Point defects -
vacancies on cationic (Mn+) and anionic (O2) sub-lattices and ions occupying interstitial
positions - allow for such deviations from stoichiometric composition and in conjunction
with electronic defects preserve the overall electrical neutrality of the oxide [4647]
Free electrons and electron holes (higher valency cations) constitute these electronic
defects and give the metallic oxide either a negative-type (n-type) for the former or a
positive-type (p-type) for the latter semiconductive behaviour [49] Figure 2-6
distinguishes between the two semiconductor types showing either a metal excess or
oxygen deficit for an n-type oxide (Figure 2-6a) and a metal deficit or oxygen excess for
a p-type oxide (Figure 2-6b)
M2+ O2
e O2 M2+
M2+
M2+ O2
e O2- M2+
e M2+ O2
M2+
O2
M2+
O2
M2+
O2 M2+
M2+
M2+ O2
bull M 2 +
M2+ O2
M+
O2 M2+
M2+ O2
O2 M3+
M2+ O2
o2-O2- M2+
M3+ O2
M2+
O2
M2+
O2
M2+
O2 M3+
bull o2
O2 M2+
M3+ O2
M+
O2 M2+
(a) (b)
Figure 2-6 Lattice defects typical of (a) n-type and (b) p-type oxides Interstitial species represent excesses and sub-lattice vacancies represent deficiencies
Adapted from [47]
22
Together the crystalline and electronic defects previously described are for the
most part responsible for oxide growth via diffusion a phase boundary process such as
the dissociation and adsorption of a molecular oxidant establishes the other principal
growth mechanism [48] Depending on the mechanism and ambient temperature
oxidation kinetics may conform to one or some combination of the linear parabolic and
logarithmic rate laws and can be easily measured by a change in mass per unit area f mdashJ
[45-48] A simplified representation of high temperature oxidation in which the rate
controlling step transitions first from a phase boundary process to ionic and electronic
diffusion through the growing oxide layer is illustrated below in Figure 2-7
o2(g) O 0 O 0 0
o2(g)
Metal
i- r-r
Metal
0 oT
Metal To m e
o T o Metal
MOx(g) 02(g)
f yfi^f ol To
Metal
(a) (b) (c) (d) (e)
Figure 2-7 Evolution of a metallic oxide layer at high temperature (a) metal-oxidant reaction at the metal surface (b) nucleation of a thin oxide film (c) oxide film growth controlled by diffusion (d) possible emergence of oxide layer defects and separation
from the metal substrate and (e) subsequent loss of protectiveness Reproduced from [46]
Initially (Figure 2-7a) O2 molecules collide with and are adsorbed on the metal
surface Islands of oxide then rapidly develop (Figure 2-7b) in accordance with Equation
21 and spread laterally over the metal until a continuous thin layer forms Chemical and
electrical potential gradients are established across this layer and in conjunction with the
intrinsic crystalline defects of the oxide promote the diffusion of ions and electrons
23
through it (Figure 2-7c) As a result the thickness of this oxide layer increases with its
direction of growth - either inward from the metal-oxide interface or outward from the
oxide-gas interface - contingent on whether anion or cation migration is favoured
[4648] A complete understanding behind oxide transport properties is beyond the scope
of this review but can be found in either Shreir [46] Birks et al [47] or Toft Sorensen
[49] Micro voids and cracks may begin to appear within the oxide layer (Figure 2-7d) as
a means to alleviate or redistribute stresses induced during growth or from thermal
exposure If these cracks propagate completely through its thickness (breakaway
oxidation) or the oxide is easily vaporized virgin metal is once again exposed leading to
further metal attack (Figure 2-7e) [4648]
The preceding oxidation process exemplifies linear (during initial formation and
potentially again if the oxide layer fails) and parabolic (when solid-state diffusion
predominates) rate behaviour with both rate equations and their combination along with
the logarithmic rate equation plotted in Figure 2-8 Of these three elementary rate
equations only the linear reaction rate remains constant with time and thus independent
of oxide thickness [45] Oxide growth or loss (eg volatilization) consistent with linear
behaviour is likely related to a phase boundary process [46] and may be represented by
where kz and t denote the linear rate constant and time respectively
Protective barriers form when oxidation kinetics follow either a parabolic
^)-kpt + C (26)
24
or logarithmic time dependence
(^-) = klog-log(t + t0)+A (27)
where kp kiog C t0 and A all represent constants In each case reaction rates tend to
decrease and stabilize with the progression of time The logarithmic rate equation
however is usually only applicable to the low temperature (lt 400degC) oxidation of metals
and is often difficult to substantiate with a single growth mechanism [47]
ro O
E
Time
Figure 2-8 Common oxidation rate laws with the associated protective (P) temporarily protective (TP) or non-protective (NP) behaviour noted in parentheses
Using the applicable molar volume molar mass and composition of the oxide
together with the measured change in specimen mass the ordinate of Figure 2-8 can be
just as easily transformed into either the oxide thickness or the depth of metal
penetration In fact the volumetric ratio of oxide produced to metal consumed - termed
the Pilling-Bedworth ratio (PBR) - serves as a preliminary assessor of the protectiveness
of a given oxide layer A PBR less than unity is generally indicative of a porous oxide
layer or one that fails to fully cover the metal surface Conversely a compact and
Parabolic (P)
Logarithmic (P)
25
protective oxide layer is assumed to form when the PBR exceeds unity although an
accumulation of compressive growth stresses could lead to unwanted cracking and
spallation [46-48] Other factors however such as the oxide-substrate adherence must
ultimately be considered when quantifying the protection of an oxide layer
2213 Desired High Temperature Oxide Scales
Up to 900degC the attractiveness of both Cr203 and AI2O3 oxide scales is not only
attributed to their thermodynamic stability but also to their slow growth rates and low
coefficients of thermal expansion [46-48] Chromia however becomes increasingly
susceptible to oxidation above 900degC and at high P 0 2 resulting in the formation of
volatile chromium trioxide (CrOs)
Cr 2 0 3 (s) + ^02 (g) -raquo 2Cr03 (g) (28)
A competing effort between the evaporation of Cr03 and ionic diffusion through the
thinner Cr203 oxide layer leads to an overall increase in oxidation rate [4647]
Figure 2-9 summarizes the parabolic oxidation rate constants of amp2O3 and AI2O3 in
addition to the base metals that form the three superalloy classes as a function of
temperature For the hatched region defining the oxidation kinetics of amp2O3 a sharp
increase in slope of its lower bound marks the abovementioned effect of Cr03 formation
While amp2O3 may lack the extreme thermal stability of AI2O3 it does have a
rhombohedral crystal structure identical to that of (X-AI2O3 the most stable polymorph of
AI2O3 All other metastable or transition phases y- 5- and 0-AI2O3 being the most
common eventually transform to (X-AI2O3 when heated above a critical temperature The
26
magnitude of this temperature and also the rate of phase transformation are largely
influenced by the base metal of an alloy alloying additions such as the rare earths (RE)
Cr and Ti and the presence of an isotypic phase [50] In a binary alloy system
consisting of a nickel base and either chromium or aluminium as the solute element
considerable solute content - at least 18 wt Cr or 17 wt Al - is required to preclude
internal oxidation and the formation of complex less protective spinel Ni(CrAl)204
oxides When both elements are combined to form an alloy of Ni-Cr-Al composition
protective AI2O3 oxide scales can be achieved with Al contents as low as 5 wt due in
part to the gettering effect of chromium [4647] Figure 2-10 characterizes the transient
to steady-state oxidation of a Ni-Cr-Al alloy with time
10 5
T(degC) 1200 1100 1000 900 800 700 600
9 10
104T(K1)
Figure 2-9 Parabolic oxidation rate constants for metals pertinent to superalloy composition as a function of temperature Reproduced from [46]
(a)
(b)
(c)
S NiO S NiO S
Alloy
S | N I O | S gt J I O | S
Alloy
NiO
O0O0O0O0O0O0O
A l l Al ldegy TCr
0 2
(d)
bull Cr20
NiO
Alloy | Al
2 ^ 3 o AI2O3 Ni(CrAI)204
27
Figure 2-10 Oxide scale development on a Ni-Cr-Al alloy (a) nickel-rich oxides appear first at the alloy-gas interface (b) lower oxygen activity beneath the external scale
promotes discontinuous Cr203 and AI2O3 formation (c) continuous Cr203 and (d) finally AI2O3 subscales result with the progression of time Reproduced from [47]
The abundance of nickel in the alloy initially encourages the formation of oxides
that are predominantly nickel-based - NiO and Ni(CrAl)204 - at the alloy-gas interface
(Figure 2-10a) Internal isolated pockets of Q2O3 and AI2O3 develop below this nickel-
based external scale (Figure 2-10b) on account of their thermodynamic stability at lower
oxygen activities With sufficient Cr content a continuous Q2O3 subscale ensues
(Figure 2-10c) further decreasing oxygen activity within the alloy and blocking previous
diffusion paths to the surface Given enough time AI2O3 becomes continuous underneath
this duplex scale (Figure 2-10d) and protects the alloy from subsequent oxidation [47]
28
222 Carbonaceous Gas Reactions
When carbon also comprises the oxidant (eg CO2) the high temperature metal-
gas interaction becomes slightly more complex than it would be with O2 alone In
addition to a metallic oxide CO is also formed as a product of the oxidation reaction
For a CO2 atmosphere with trace levels of CO H2 and H2O Gibbs et al [51] and
Pritchard et al [52] have suggested that carbon activity (ac) is controlled by the
disproportionation of CO as per the Boudouard reaction
2CO(g) ~ C (s) + C0 2 (g) (29)
or via the synthesis gas reaction
CO(g) + H2 (g) ~ C (s) + H20(g) (210)
Carbon (C) ingress into an alloy can affect oxide scale formation morphology and
adhesion because of the precipitation of carbides (carburization) [5354] as well as
disintegrate the alloy entirely (metal dusting) if the local ac is high enough [5556] This
section summarizes carburization (ac lt 1) and metal dusting (ac gt 1) mechanisms as
applicable to nickel-base superalloys in addition to what is done to protect against carbon
attack
2221 Carburization (ac lt 1)
Binary metallic carbides (MxCy) are just as easily formed as oxides assuming that
the ambient carbon activity supports the metal-carbon reaction [4557] With the same
thermodynamic concepts outlined in Section 2211 also applicable to carbide formation
an Ellingham diagram can be constructed to represent the comparative temperature-
dependent stabilities of assorted carbides Such a diagram is shown in Figure 2
metallic carbides specific to nickel-base superalloy compositions
copy p 150 cOj t t
Cor boo activity
tobe 40-00
Figure 2-11 Ellingham diagram for transition metal carbides [57]
30
In the absence of a protective oxide layer nickel and by extension its alloys are
catalytic to the carbon-producing reactions described by Equations 29 and 210 [53]
Thus carbon atoms adsorb on the exposed surface and facilitated by the disinclination of
nickel carbide (NisC) to precipitate (AG gt 0) diffuse into the nickel matrix The ensuing
metal-carbon reaction produces internal Cr and to a lesser extent other refractory
carbides that nucleate both at grain boundaries and within the grains themselves [5458]
Chromium-based carbides (Q23C6 Cr7C3 and Cr3C2) however can be particularly
harmful to an alloy that relies on the formation of a C^Ch scale for protection against
metal attack these carbides consume Cr from the nickel matrix that would otherwise be
used to form the protective oxide layer [45] A stability diagram for a Cr-O-C system at
620degC is depicted in Figure 2-12 and shows that carbide formation only becomes
preferential with extremely low oxygen partial pressures ie PQ2 lt 10 atm
Carbide morphology - controlled by the gaseous carbon activity exposure
temperature and alloy composition - obviously has a direct bearing on how carburization
will affect mechanical properties at service conditions [5354] Creep-rupture life for
example may be slightly improved with the precipitation of finely dispersed carbides
(low temperature and ac) or severely impaired by the formation of continuous carbide
films at the grain boundaries (high temperature and ac) [45] The effect of carburization
on room temperature mechanical properties however is almost always deleterious
regardless of carbide morphology [59] Figure 2-13 reveals significant decreases in both
tensile strength and ductility with increasing carbon content for two nickel-base
superalloys at room temperature pre-carburization data is included for contrast
-14 -12 -10
Log PCo2Pco
- 6 - 4 - 2 0 2 4 6 10 12 U
0
-2
-4
o -6 TO
-10
-12
-14
-16
I I I I I
Cr3C2(s)
Cr7C3(s)
_ Cr23C6(s)
-
Cr(s)
i i i
i i i i
Cl~ 1 -bull)
i i i
i i i i
Cr203(s)
i i i
i
-
-
-
i i
0
-2
-4
-6
-8
-10
-12
-14
-16
o o p_
O O
Q U) o
_ l
-50 -45 -40 -35 -30 -25 -20 - 1 5 - 1 0 - 5 0 5
Log Po2 (atm)
ure 2-12 Stability diagram for the Cr-O-C system at 620degC Reproduced from [45]
en c
pound
Si gt-5
a
pound
1000
soo
600
iOO
60
40
20
0
- mdash | mdash mdash mdash r
Ni-Cr-W
coarse
mdash-fmdashI 1 h - r Romge of data for solution -
bull ^ treated specimens and for spea---
J mens aged at i 950C
- J mdash J j mdash j -
HastelloyXR
I I I I I
Q-ltltin Oi 08 0 04 08
Carbon Content
Figure 2-13 Effect of carburization on room temperature mechanical properties of nickel-base superalloys [59]
32
2222 Metal Dusting (ac gt 1)
Metal dusting or catastrophic carburization occurs when susceptible materials -
coincidentally the base metals of superalloys - are exposed to gaseous carbon activities
greater than unity at temperatures between 400 and 800degC [4555] Graphite nucleation
and growth on or within these alloys is favoured because of the carbon-supersaturated
environment and inevitably leads to their destruction The subsequent corrosion product
(termed coke) consists of disintegrated metal and graphitic carbon in addition to oxides
and carbides depending on the alloy composition [5355] Figure 2-14 provides a
schematic representation of the metal dusting phenomenon for a C^Oyforming nickel-
base alloy
Carbon dissolution into a nickel-base alloy (Figure 2-14a) initiates at a defect or
void in its protective C^Ch oxide layer and accordingly a zone of finely dispersed
internal carbides (M7C3 and M23C6) develops beneath it (Figure 2-14b) Until now metal
dusting and carburization mechanisms are identical What differentiates the two beyond
this point is that the higher ac associated with metal dusting allows this carbide zone to
become supersaturated with carbon over time Graphite nucleates on the still-exposed
substrate surface assuming the oxide layer was unable to properly heal and grows
inward into the carbon-rich zone and dendritically along surrounding grain boundaries
(Figure 2-14c) Moreover metal grains encapsulated by graphite tend to separate from
the bulk metal because of the compressive stresses attributed to an expansion in volume
The outward growth of coke (Figure 2-14d) results in the uptake of metal carbides and
oxides from the substrate leaving behind hemispherical pits when it breaks away [5560]
33
Cr20 j M7C3 Internal carbides
Figure 2-14 Metal dusting mechanism of a Cr203-forming nickel-base alloy (a) carbon diffusion into the substrate initiated at C^C^ scale defect (b) formation of internal
carbides (M7C3 and M23C6) and local carbon-supersaturation of substrate (c) graphite nucleation and inward growth and (d) outgrowth of coke corrosion product
Reproduced from [55]
2223 Protection Against Carbon Attack
Carbon attack is prevented or at the very least hindered by the application or
formation of a barrier impervious to carbon diffusion such as a coating system or oxide
scale [58] or the introduction of gaseous hydrogen sulphide (H2S) [4555] into the
process environment The low carbon solubility in C^Cb and AI2O3 scales as well as Cr-
and Al-based coatings makes them ideal candidates for carbon barriers assuming that
they remain adherent to the substrate and free of porosity Protection imparted by
34
sulphur is slightly different from the former mechanism given that sulphur atoms adsorb
on the alloy surface and interfere with carbon-releasing reactions directly rather than
establish a protective barrier [4555] Too high a sulphur content in the process
environment though can also be harmful and lead to degradation by sulphidation
223 Erosion-Corrosion
Since most practical gaseous environments contain suspended particles erosion-
corrosion can be regarded as the most realistic of all the high temperature corrosion
modes Under that same rationale however the simultaneous surface degradation by both
mechanical and chemical means gives erosion-corrosion the potential to be one of the
most aggressive modes as well [45] Erosion for the context of this discussion applies
only to surface degradation by solid particle impingement and not by tribological
(friction) wear or cavitation This section first gives a brief overview on the mechanisms
of erosion and concludes with a description of the established erosion-corrosion regimes
2231 Mechanisms of Erosion
Erosion mechanisms broadly correspond to either the ability (ductile response) or
inability (brittle response) of a surface to absorb and dissipate the kinetic energy of an
impinging particle [61-63] At high temperature metals will most always exhibit a
ductile response a stark contrast to the brittle nature of such corrosion products as oxide
scales and coke deposits Figure 2-15 shows erosion mechanisms for both ductile and
brittle materials in response to a particle impact The ductile mechanism can be further
35
expanded to illustrate what effect impact angle (the angle measured from the surface to
the particles trajectory) and particle velocity have on surface degradation Other
contributing factors to the erosion rate of a material include the size shape hardness and
mass flux of the erodent [61]
DUCTILE RESPONSE
(a)
Low angle
BRITTLE RESPONSE
(c) High medi
angle ^ um speed V jWmdashgt Flake
formation
(d)
High ang leM- high speed
Melting J~ r ^ p
o O
Figure 2-15 Erosion mechanisms for ductile and brittle materials (a) low angle surface abrasion (b) high angle low velocity surface fatigue (c) excessive plastic deformation at
high angle medium velocity (d) surface melting due to high velocity impact and (e) brittle fracture Adapted from [61]
36
At low impact angles and above a threshold particle velocity the erodent cuts into
the surface of a ductile material (Figure 2-15a) of lesser or equal hardness Surface
gouging and subsequent material loss only intensify as particle velocity is increased
although this relationship between erosion rate and velocity is not shown explicitly in
Figure 2-15 As the impact angle approaches 90 degrees surface damage attributed to
particle impingement transitions from channels or grooves to impact craters At low
velocity but high impact angle plastic deformation is minimal yet the repetitive
bombardment of erodent produces highly localized surface fractures and ultimately leads
to fatigue (Figure 2-15b) Plastic deformation becomes increasingly exaggerated (Figure
2-15c) as does surface melting and re-solidification (Figure 2-15d) with even greater
particle velocities [61] However unlike the ductile mechanism of erosion the brittle
response to particle impact is characterized by negligible plastic deformation the
coalescence of subsurface cracks and subsequent spallation (Figure 2-15e) are
responsible for material removal [63]
Ductile and brittle erosion responses are typified in Figure 2-16 as a function of
impact angle The erosion rate of a ductile material reaches a maximum when surface
cutting predominates (ie an impact angle between 20 and 30 degrees) and decreases
rapidly as the particle trajectory becomes normal to the surface Conversely for a brittle
material the maximum erosion rate occurs when the particle impacts the surface at
90 degrees [6263] Furthermore overall erosion resistance is specific to the material and
not to the controlling erosion mechanism ie AI2O3 (brittle) is superior to both annealed
aluminum (ductile) and graphite (brittle) in terms of erosion resistance [61]
37
LU h -lt DC
O CD O DC LU
IMPACT ANGLE ((3)
Figure 2-16 Effect of particle impact angle on the erosion rate of ductile and brittle materials
2232 High Temperature Corrosion Interaction
Depending on the relative intensities of erosion and corrosion their combined
effect on surface degradation can be categorized into one of four regimes These regimes
are represented schematically in Figure 2-17 and listed in order of increasing erosion rate
or decreasing corrosion rate include pure corrosion erosion-enhanced corrosion
oxidation-affected erosion and pure erosion For each regime (excluding pure erosion)
diffusion-controlled oxidation is assumed to be the dominant corrosion process [64]
The pure corrosion regime as its name would imply is unaffected by the presence
of an erodent Only in the erosion-enhanced regime does the synergistic effect of erosive
and corrosive processes on surface attack first become obvious Moreover this regime
itself encompasses three unique modes - termed types I II and III - of erosion-corrosion
DUCTILE RESPONSE
38
interaction For type I erosion-enhanced corrosion erosive thinning of the oxide scale
leads to an overall increase in oxidation rate However an eventual balance between
erosion and oxidation rates is established and the scale thickness remains constant In
some instances scale thickness may actually increase because of particle impingement a
feature typical of type II erosion-enhanced corrosion Rishel et al [64] has postulated
this behaviour to be a result of one or both of the following mechanisms (i) elements
(eg Al) that would otherwise selectively oxidize and form slow growing protective
oxides scales (eg AI2O3) are removed from the matrix by the erodent or (ii) the number
of short-circuit diffusion pathways in the oxide scale are increased by impact-induced
cracking Lastly type III erosion-enhanced corrosion can be viewed upon as an
extension of type I except that both the intensity and irregularity (either in particle size or
impact frequency) of erosion have increased the oxide scale becomes incoherent
allowing the erodent to now deform the substrate [64]
When erosion prevails over corrosion to become the dominant mode of surface
degradation the oxidation-affected erosion regime is befitting to describe the erosion-
corrosion interaction Successive particle impacts occur and remove material much faster
than the oxide scale can grow laterally over the exposed substrate Consequently a
complex conglomerate of corrosion product erodent and metal develops in lieu of the
oxide scale The final erosion-corrosion regime - the pure erosion regime - occurs in the
absence of an oxidant or at temperatures too low to facilitate scale formation [4764]
Metal recession therefore proceeds according to the ductile erosion response presented in
Section 2231
39
E R O S 1
O N
R A T E
C 0 R R O S 1
o N
R A T E
NO CORR
METAL
SPALLS
A
METAL
COMPOSITE LAYER
METAL
METAL
EROSION OF OXIDE
ONLY
TYPE II
EROSION ENHANCED
CORROSION
TYPE I
TYPE II
OXIDATION AFFECTED EROSION
I
EROSION OF METAL ONLY
Figure 2-17 Erosion-corrosion interaction regimes Adapted from [64]
23 High Temperature Corrosion Testing
Ideally high temperature corrosion testing would be carried out in the intended
service environment to give the most meaningful material response However when
such a task proves impractical frequently because of the costs or safety implications
involved laboratory corrosion test rigs serve as effective alternatives in which to
approximate service conditions [65] Additionally the control afforded by laboratory test
40
rigs over such process variables as temperature pressure flowrate environmental
composition exposure time and entrained particulate allows for a methodological
approach in determining how each will influence corrosion behaviour Very rarely
though if ever are the quantitative results (eg corrosion rates) obtained through
laboratory testing directly exchangeable with the real-world application instead these
results help to rank and identify suitable candidate materials [6566] This section will
discuss laboratory corrosion test rigs as related to high temperature (purposely gas
turbine) applications and summarize the autoclave-based S-CO2 corrosion systems that
have been built to date
231 Erosion-Corrosion Rig Testing
Erosion-corrosion test rigs capable of producing intermediate to high velocity
particle impacts at elevated temperature can be classified into one of two groups the
rotating-type or the blast-type [67] These groups coincide with how contact between the
specimen(s) and erodent (typically silicon dioxide AI2O3 or ash) is initiated - either
indirectly from the rotary action of a motor or from particles entrained within the gas
itself [6768] Despite their obvious differences in operation the main components
comprising each type of erosion-corrosion test rig are essentially the same a unit to hold
erodent either in the form of a hopper or fluidized bed and subsequent system to collect
it a gas-particle mixer and a test chamber which is usually enclosed by a furnace
41
2311 Rotating-Type Rigs
The rotating-type class of erosion-corrosion test rigs whose negligible gas
velocities make them apposite to testing in harsh gas compositions include the whirling
arm [69] and centrifugal designs [68] Both designs can also accommodate multiple
specimens simultaneously allowing for time-efficient testing of different materials under
identical conditions or one material at various impingement angles
Even when compared to its centrifugal counterpart the whirling arm test rig is
unique because the erodent in addition to the corrosive gas remains effectively static
relative to a stationary reference frame Specimens are mounted to an arm or holder
which in turn is rotated though a fluidized bed or stream to encourage particle
interaction [67] Accordingly the particle impact velocity (limited to approximately
30 ms) becomes a function of the rotational speed of the arm and at what radial distance
the specimens are mounted from its axis of rotation [69] A process flow diagram of a
whirling arm test rig used in high-sulphur low-oxygen environments is shown in
Figure 2-18 although other gaseous compositions could be easily interchanged
Centrifugal erosion-corrosion rigs as depicted in Figure 2-19 use a centrally-
located rotating nozzle to eject erodent at specimens Specimens are positioned to
encircle the perforated base of the nozzle and particle impact velocity analogous to the
rotating arm design is governed by its rotational speed [68] Impact velocities and
loading rates of up to 200 ms and 06 kgm2s respectively are possible with the
centrifugal rig but quantifying the total mass of erodent that has impacted with the
specimens becomes convoluted if various impingement angles are tested at once [67]
42
H gt
r Waste gas
Fluid izsd
V Direction of gas flow
bull J Nitrogen
Figure 2-18 Whirling arm erosion-corrosion test rig [69]
Pariide feed nozzle
Rotating (g) Vjirsction
Partltd9 - ~~Zygt Rotating nozzle
Test p i e c a - ^ s ^ f ^ F Heater -
Particle flying dradion
Partcte Particles _ feed nozzle Rotating
l ~J~- - noHte
Heater (insWe)
Test piece (20x50)
Figure 2-19 Centrifugal erosion-corrosion test rig [68]
43
2312 Blast-Type Rigs
Erosion-corrosion test rigs utilizing pressurized gas to accelerate the erodent
represent the most common configuration used at research institutions and in industry due
to their simple construction and inexpensive operation [67] Regardless of their
prevalence gas jet and high velocity rigs are not capable of the same degree of particle
velocity uniformity that can be achieved with the rotating-type designs
For the gas jet blast-type test rig the erodent is introduced to a pressurized reactive
gas accelerated via aerodynamic drag force through a convergent nozzle and accelerator
tube and directed at a single specimen or stage of specimens [7071] A schematic
representation of such a rig is provided in Figure 2-20 Contrary to the rotating-type rigs
particle velocity - typically limited to 40 ms [67] - is dictated by the pressure
differential established between the gas carrier and the test chamber as well as the length
and diameter of the accelerator tube to a lesser extent both particle size and shape in
addition to the temperature at the accelerator tube outlet also influence particle velocity
[71] The reactive gas stream may also be supplied from the exhaust of a combustor
(referred to as a burner rig in this arrangement) with erodent injected into the attendant
air or fuel supply prior to combustion or into the exhaust gas stream following
combustion [67] Likewise burner rigs are imperative to the study of hot corrosion
mechanisms and understanding the deposition behaviour of molten salts
High velocity high temperature wind tunnels draw many parallels to the gas jet
blast-type test rigs but on a much larger scale Erodent is typically injected far upstream
of the test specimen(s) and accelerated by the high velocity gas in a constant area duct
44
The outcome is an erodent-laden gas stream spanning the entire cross-section of the duct
which acts to preserve the aerodynamic characteristics of the fluid field [71] ie the
erosion-corrosion interaction is more representative of what would be seen in service as
opposed to that induced by a localized gas jet Compared to high velocity burner rigs the
wind tunnel configuration can achieve comparable particle velocities (approximately
300 ms) at similar test temperatures (1100degC) but only at a fraction of the operating cost
[67] Figure 2-21 illustrates a wind tunnel erosion-corrosion test rig whose gas stream is
supplied by the exhaust of a can combustor
Particle inflow
MmifM chamber heater
G as laquoHef
Specimen Wdr
Mixing chamber
Nozzle Uoxlk heater Speamen chamber
irnen
Specimen chamber tartar
Copplaquof electrode
Figure 2-20 Gas jet erosion-corrosion test rig [72]
45
( A I R SUPPLY ( I )
XL FUEL
PARTICLE mdash 4 INJECTQS
bullbull PROPANE IGNITER laquo COMBUSTOS (C)
STCAK
ACCELEF-ATION TUNNEL ( F)
^ EXHAUST
J-
SECONDARY a AIR
PARTICLE FEEOtR
( A )
EXHAUST TANK (H)
Figure 2-21 Wind tunnel-type erosion-corrosion test rig [67]
232 Autoclave Testing
High temperature autoclave test systems emphasize the chemical rather than the
mechanical response to the simulated service environment and therefore have no cause
to accelerate erodent and generate high velocity impingements Whether these systems
are intended to be operated under static once-through or recirculating conditions each
will employ some form of a metallic usually cylindrical pressure vessel [65] either to
hold test specimens or to function as one (in the case of a pipe) Here the inclusion of a
pressure vessel permits corrosion studies to be conducted well above standard pressure
something that most erosion-corrosion test rigs are not capable of Exactly what
46
combination of internal pressure and temperature the vessel can safely be subjected to is
determined by its cross-sectional dimensions and construction material
Pressure vessels used in autoclave corrosion test systems tend to limit their capacity
to between 05 and 50 L to minimize the associated material costs [65] Figure 2-22
shows the general relationship between the internal pressure (P) of a pressure vessel and
the minimum required wall thickness (t) to contain it normalized to the maximum
allowable material stress (omax) and internal radius (rj) respectively Regardless of
whether the internal or external radius of the vessel is fixed wall thickness increases
exponentially in response to increasing internal pressure for the former the vessel can
become quite cumbersome as its pressure approaches amax whereas for the latter internal
volume is significantly reduced Often the overall length of the pressure vessel is
extended to maintain a workable internal volume yet still preserve a sensible external
diameter [65]
0 025 05 075 1
POmax
Figure 2-22 Effect of internal pressure on the minimum required wall thickness for a pressure vessel of circular cross-section
47
Caution should be exercised when selecting the pressure vessel material(s) if the
metal temperature is likely to exceed 550degC Figure 2-23 provides maximum allowable
stress versus temperature curves for alloys used in current fossil boilers and those
expected to be integral to emerging ultra-supercritical water power plants ie materials
which must retain their mechanical properties (eg creep-rupture strength and fracture
toughness) at intermediate to high temperatures while at the same time resist corrosive
attack As expected nickel-based alloys outperform both ferritic and austenitic stainless
steels at these service temperatures and are fit to serve as either the shell or seal material
for a pressure vessel By contrast non-metallic seal materials such as elastomers and
plastics are generally ill-suited for high pressure applications and also degrade rapidly
between 150 and 250degC [73] Particularly aggressive test environments may even
warrant the application of a compatible ceramic liner to the bore of the pressure vessel
[65]
800 900 1000 1100 1200 1300 1400 1500 1600 1700 Temperature (dF)
Figure 2-23 Stress-temperature curves for high temperature boiler materials [74]
48
2321 S-C02 Corrosion Test Rigs
The majority of S-CO2 corrosion test rigs (and exclusively those with high
temperature capabilities) have just recently emerged with the advent of S-CO2 Brayton
cycles earlier corrosion test rigs evolved when S-CO2 was being considered for oil
recovery endeavours [23] and as an industrial solvent [24] All S-CO2 test rigs however
at least those published in open literature have been based on the autoclave design (either
at static or low flowing conditions) and exist or once existed at the following institutions
the Chevron Oil Field Research Company [23] Sandia National Laboratories [24] Idaho
National Laboratory (INL) [11] Tokyo Institute of Technology [3375] Massachusetts
Institute of Technology (MIT) [34353876] University of Wisconsin-Madison
(UW-Madison) [36] and the Commissariat a lEnergie Atomique (CEA) [37] Only
Sridharan of UW-Madison has initiated the development of a test loop to investigate
flow-assisted corrosion mechanisms in high temperature S-CO2 environments [77] This
section will review the S-CO2 corrosion facilities listed above in chronological order
One of the earliest references to a test rig dedicated to studying material
compatibility with S-CO2 originated at the Chevron Oil Field Research Company shortly
before 1972 [23] A novel enhanced oil recovery effort at the time Chevron proposed to
inject high pressure CO2 (165 MPa) into spent wells to restore reservoir pressure hence
the construction of a laboratory corrosion test rig was necessitated to replicate the
conditions that would be encountered within these CO2 pipelines As depicted in Figure
2-24 the Chevron test rig consisted of three pressure vessels - large enough to
accommodate test specimens 3048 mm (120 in) in diameter - which were arranged to
49
form two independent recirculating test loops Together an air-driven gas booster pump
and nitrogen-charged accumulator delivered dry CO2 (at 139 MPa) to both loops where
it was heated and then circulated at fluid velocities of 762 to 1016 mmmin (300 to 400
inmin) Provisions in the overall design also allowed for impurity species such as water
and H2S to be easily incorporated into the S-CO2 if so desired Each test loop however
was limited to just 173 MPa - in fact safety relief valves and rupture discs would
activate at 153 and 160 MPa respectively to protect against inadvertent over-
pressurization - and could only reach a maximum temperature of 54degC
v l VIB ~ FUU-FIOW 8ALI VALVES SWF laquo 1MB PSi v3 VSI = SOFT SEATING VALVES W 6006 11
V91 4 SKUt QFf VALVt FOB AIR SWP ISO PSi
Figure 2-24 Chevron Oil Field Research Company S-CO2 corrosion test rig [23]
In 1994 Sandia National Laboratories designed and assembled a static
S-CO2 corrosion test rig to complement research related to using S-CO2 as an industrial
solvent [24] A process flow diagram of the Sandia design is shown in Figure 2-25
Compression to the desired CO2 test pressure (242 MPa) was achieved using a two-
50
stage gas booster pump arrangement to prevent or at the very least minimize problems
(pump hesitation and surging) associated with a low CO2 supply pressure Specimens
were suspended from a glass support stand inside an 18 L sample vessel which because
of the temperature-controlled water bath used to heat it was inherently limited to
temperatures under 100degC (ie the boiling point of water at standard pressure) Upon
depressurization of the sample vessel to atmosphere a 10 L recovery vessel acted as an
intermediary to collect co-solvent (eg water and other alcohols) that would condense as
the solubility in CO2 decreased with pressure The entire corrosion test system -
including both sample and recovery vessels as well as the tubing and fittings - was
fabricated from 316-grade stainless steel (316-SS) and ultimately restricted to test
pressures below 346 MPa
Desiccant Molecular Sieve
M
k 4 Pump
co2
Check Valve
Vent to fume hood
Temp controlled sample vessel
Recovery vessel
Figure 2-25 Sandia National Laboratories S-C02 corrosion test rig [24]
Between 2002 and 2005 the INL conducted an extensive research initiative to
develop a S-CO2 Brayton cycle that could be applied to the VHTR [11] Two test rigs
were created as part of this initiative that would mark the beginning of a series of high
temperature S-CO2 corrosion test rigs The first corrosion test rig while somewhat
51
unconventional in its configuration used water-cooled connections to convert a tubular
test specimen into a functioning segment of high pressure pipe Figure 2-26 shows a
schematic of this initial design with the test specimen supplied with CO2 from a high
precision syringe pump and surrounded by a resistance tube furnace In using the water-
cooled connections the ends of the specimen were kept at a considerably lower
temperature than its center adding axial-varying thermal stresses to the mechanical
stresses already induced at the bore Test conditions (ie pressure and temperature) were
specific to the specimen material even though this once-through test rig was capable of
delivering CO2 at 210 MPa and 25 mLmin and heating it to 1100plusmn5degC prior to
throttling to atmosphere
The second corrosion test rig built by the INL was in fact just an adaptation of their
initial design replacing the single tubular test specimen with five thick-walled 304-
grade stainless steel (304-SS) pipes Each pipe measured 12 m (472 in) in length had
an internal diameter (ID) of 11 mm (043 in) and used a wall thickness that could
withstand an internal pressure of 70 MPa at 1000degC for 10000 hours Multiple
specimens could be inserted into these pipes and tested simultaneously although the use
of 304-SS at elevated temperature left them prone to creep and in one instance resulted in
a rupture Figure 2-27 illustrates the layout of this corrosion test rig complete with a gas
sampling system (a mass spectrometer as well as O2 and COCO2 meters) and confirms
its likeness to its predecessor Both corrosion test rigs have since been decommissioned
following the conclusion of this S-CO2 initiative
52
To Vent
C02
Control Valve
bull Q
Back Pressure Regulator
TC Pump
o A A A A A A A A A A t -CXmdashraquobull Relief Valve
Prc-heater
Resistance Furnace
Heater
A A A
Water cooled seals attached to ends of test tube
V V s Vent to Atmosphere
Figure 2-26 INL single specimen S-CO2 corrosion test rig Adapted from [11]
Pressure Relief Valve
Preheat Tube RfC] Furnace
Cooling Water ( p) fp
It
ffffl pound Filter
(mdash1X1--Xh-
f
DP
Tube Heater
rwww^ mdashIXt-
V4 Header I I High Pressure Pump Test Sections
Corrosion Section 1000degC
T ) ( P
Yi Header
copy Vent 1 Rotameter bull
0 reg
O Meter
LrmdashImdashJ -1X1mdashI
Mass Spec
C0 2
Meter
C02 C02
Figure 2-27 INL multi-specimen S-CO2 corrosion test rig Adapted from [11]
53
Almost concurrent with the INL initiative the Tokyo Institute of Technology in
collaboration with the Japanese Atomic Energy Agency (JAEA) began the first stage of a
very similar advanced energy system project in 2003 The main objective of this project
was to verify the performance and system design of a S-CO2 Brayton cycle for use with a
fast breeder reactor (FBR) [75] In addition to the compressor and heat recovery test
loops that resulted a high temperature S-CO2 corrosion test rig was also developed to
investigate the corrosion resistance of 316-SS and 12-chromium steels This corrosion
test rig largely mirrored the multi-specimen design produced by the INL but as depicted
in Figure 2-28 was modified to function as a recirculating system Two gas booster
pumps pressurized a buffer tank to 220 MPa where CO2 was regulated to 200 MPa and
sent to the five corrosion test sections at 12 kghr Spent CO2 was then cooled from a
maximum test temperature of 600degC reduced to 40 MPa and returned to the booster
pumps Test sections in the furnace though measured only 127 mm (05 in) in outer
diameter limiting the cross-sectional size of specimens that they could accept to just
under 4 mm (016 in)
In 2007 researchers at MIT constructed two single vessel S-C02 corrosion test
rigs to expand upon the high temperature corrosion data assembled by both the INL and
Tokyo Institute of Technology [38] As Figures 2-29 and 2-30 would suggest the
general configuration of each test rig was the same apart from the size of and flow path
through their respective pressure vessels a gas booster pump supplied an Inconel-625
(IN-625) pressure vessel with high pressure CO2 where it was heated by a split-tube
furnace and later exhausted to atmosphere at 10 Lhr through a gas bubbler Residual
54
gas analyzers (RGA) integrated into each test rig allowed gas compositions to be
compared both prior to entering and after exiting the pressure vessel although no
discernible difference between the two streams was ever noted
The smaller of the two pressure vessels (Figure 2-29) had an ID of 127 mm
(05 in) measured 3048 mm (120 in) in overall length (1016 mm or 40 in of which
was heated) and was limited on account of the compression ratio of its gas booster
pump to a maximum operating pressure of 125 MPa at 650degC With only one opening
in its shell gas entry and egress was accomplished using 16 mm (00625 in) and 64 mm
(025 in) tubing arranged in such a way that the annulus surrounding the smaller inner
tube delivered fresh CO2 to the vessel while the inner tube itself provided a pathway to
atmosphere Conversely the larger pressure vessel (Figure 2-30) had an ID of 254 mm
(120 in) and measured 152 m (600 in) in length 061 m (240 in) of which was heated
by a three-zone 50 kW furnace While this vessel could according to American Society
of Mechanical Engineers (ASME) standards safely operate at any combination of
pressure and metal temperature up to 270 MPa and 750degC respectively corrosion
studies following its initial commissioning were restricted to below 220 MPa and 700degC
Furthermore both vessels used carbon steel bolts to hold conical IN-625 end seals in
place requiring additional thermal management (internal heat reflectors and heat sinks)
to ensure that the bolts remained below their tempering temperature
W Water bath PH Pre heater RP Rotary pump
BT Buffer tank DP Dew-point hygrometer FM Flowmeter DPG Differential press gauge O2 Oxygen analyzer
Test Sections
Figure 2-28 Tokyo Institute of Technology S-CO2 corrosion test rig Adapted from [33]
Heat Fin Internal Thermocouple
Gas Booster Pump
Compressed Air Supply
RGA
Sample External Train Thermocouple
Gas Bubbler
C0 2 Supply
Figure 2-29 MIT low pressure S-CO2 corrosion test rig Reproduced from [38]
Furnace
56
Helt Sink
CO2 S u p p k
Bleed V a k e
Internal fcternal Thermocouple Thermocouple
Gas Bubbler
Figure 2-30 MIT high pressure S-CO2 corrosion test rig Reproduced from [38]
No later than 2009 the UW-Madison built its own S-CO2 corrosion test rig joining
the likes of the INL Tokyo Institute of Technology and MIT to assess materials that
could be used in S-CO2 power conversion systems [36] As shown in Figure 2-31 this
once-through test system used a syringe pump to deliver CO2 at 00 to 50 gmin to an
IN-625 pressure vessel The pressure vessel which was wrapped with three resistive
heating cords instead of seated within a tube furnace was designed to contain a
maximum test pressure of 269 MPa at 650degC Unlike the previous high temperature
S-CO2 corrosion test rigs though operation of this system was controlled entirely through
a computer
57
ItslSeaMech f~ ) D u m l X l h e I h c t t l m C l tnllmHlk ltbull Cm L SI
Tliroltlc 0 2 miuui liller ]i cj S Ilea Sim ltt t^~^~^ bull l o uit
Inkl m o ilvt
Ik Ule Pres^ I lani
lnla0 2 miLron hlkr
Bottle I
Bottle 2
1 lcnnl IILULI-2
DORtsistnc Ikat
Ettrnil lit utr ] lElt iml Ikilu
Figure 2-31 UW-Madison S-CO2 corrosion test rig Adapted from [36]
The most recent high temperature S-CO2 corrosion test rig was fabricated by the
CEA to support ongoing French research dedicated to the SFR [37] Specimens were
placed in a 10 L 316L-SS agitated pressure vessel that could withstand 250 MPa at
550degC Figure 2-32 provides a schematic of this very modest static test rig whose only
recorded variable was the temperature within the vessel
Thermocouple
Agitated Reactor
Figure 2-32 CEA S-C02 corrosion test rig [78]
58
24 Methods of Corrosion Analysis
Numerous analytical techniques can be employed both to measure the growth rate
of the corrosion product as well as to characterize its structure and composition While
electrochemical methods are viable at high temperatures a change in specimen mass is
frequently used instead to assess reaction kinetics [66] Additionally the limitations
presented by optical microscopy such as the maximum attainable resolution and inability
to generate elemental maps are overcome with electron microscopy and electron- or ion-
based spectroscopy [79] This section will therefore outline aspects relating to
gravimetric analysis as well as spatially resolved and surface analysis techniques
241 Gravimetric Analysis
Gravimetric analysis can be performed either in-situ or ex-situ of the corrosion test
environment with obvious advantages to each approach In-situ mass gain
measurements provide the most accurate representation of reaction kinetics but
unsurprisingly are expensive and usually less applicable to longer exposure times and at
higher pressures [475366] A single specimen is suspended from a delicate silica fibre
or platinum wire which in turn is attached to a continuous-recording microbalance
Moreover an inert shielding gas of equal or slightly greater pressure than the test
chamber must be used to protect the microbalance against corrosion [4753] In contrast
ex-situ measurements require minimal premeditative effort to carry out and allow
multiple specimens to be tested simultaneously Since specimens must be removed from
the test chamber to be weighed mass gain data is discontinuous and possibly erroneous if
59
the thermal shock imposed on the specimens affects the stability of their corrosion
product [66]
242 Microscopic and Spectroscopic Analyses
Lateral resolutions as low as 10 nm can be achieved with a scanning electron
microscope (SEM) which uses a thermally-generated electron beam under vacuum to
raster scan the surface of the specimen [79] Figure 2-33 depicts the resultant electron
and radiation emissions following the interaction of this incident electron beam with the
surface Typically backscattered and secondary electrons energies are detected
amplified and used in conjunction with a cathode ray tube to produce a topographical or
cross-sectional image of the specimen [7980] These images can then be used to
examine the morphology and total thickness of the oxide layer in addition to the mode
(eg uniform or intergranular) of corrosive attack
Fitted with the appropriate detectors the SEM can also perform Auger electron
spectroscopy (AES) or X-ray photoelectron spectroscopy (XPS) concurrent to the
imaging process Both of these spectroscopic analyses have very limited depth resolution
or penetration but can provide invaluable compositional information (ie the oxidation
state of detected elements) of what is being viewed Secondary ion mass spectroscopy
(SIMS) is often used when a more precise surface characterization of the corrosion
product is required Ion sputtering replaces the electron beam and elemental mass
concentrations are determined either on the surface or as a function of profile depth
[4780]
Incident electron beam
Backscattered electrons
Secondary electrons
Characteristic X-rays
Auger electrons
Diffracted electrons
Inelastically scattered electrons
Transmitted electrons
60
Figure 2-33 Surface interaction with an incident electron beam [47]
25 Metallic Corrosion in High Temperature CO2 Environments
Prior to the realization of the S-CO2 Brayton cycle the British AGR program was
essentially the only motivating force for high temperature CO2 corrosion testing
Fittingly this testing was aimed to investigate the corrosion resistance of proposed
superheater and fuel cladding materials - ferritic and austenitic stainless steels - at CO2
pressures up to 53 MPa While these tests helped to qualify the oxidation kinetics of
steels in high temperature CO2 they could not substantiate whether similar behaviour
would be observed at higher (supercritical) pressures and with nickel-base superalloys
such was the basis for the S-CO2 corrosion test facilities presented in Section 2321
This section will briefly review high temperature CO2 corrosion studies conducted at
both at subcritical and supercritical pressures
61
251 Subcritical Pressure
Corrosion studies carried out as part of the AGR nuclear program affirmed that the
chromium content of an alloy was perhaps the most influential factor in determining its
resistance to CO2 attack Ferritic and austenitic steels were exposed to CO2 up to 700degC
and 53 MPa and the morphology kinetics and composition of the resultant oxide
layer(s) were examined For chromium content characteristic of ferritic stainless steels
(ie below 12) a Cr-partitioned duplex oxide layer formed consisting of a magnetite
(F6304) outer layer and chromite spinel (FeC^CU) substratum [27-31] This duplex oxide
structure is shown in Figure 2-34 The growth mechanism of the FeC^Cv substratum -
the rate controlling oxidation process [29] - was a result of the inward diffusion of the
oxidant opposite to the outward diffusion of Fe needed to sustain to the Fe3Cgt4 layer
However as Figure 2-35 indicates these steels became increasingly susceptible to
breakaway oxidation above 550degC (823 K) following a period of protective and then
transitive behaviour the incubation time to the onset of breakaway oxidation decreased
predominately with increasing temperature although surface finish specimen geometry
prior cold working and silicon content also had some effect [2728]
F e 3 0 4
FeCr SPINEL
INTERNAL OXIDATION ZONE
10 y
Figure 2-34 Multi-layered oxide (FesCM | SiCgt2 | FeCfoO-O that formed on a ferritic stainless steel following 1060 hour exposure to C02 at 520degC and 40 MPa [31]
62
0 1 I 1 1 1 1 1 SIS 873 SS3 773 713 673
TEHPCKATURI (K)
Figure 2-35 Post-breakaway oxidation rate as a function of temperature [27]
Breakaway oxidation was attributed to the underlying metal becoming saturated
with carbon to the point that oxide grains were encapsulated by carbides or graphite and
as a result removed any adherence between the oxide and metal [29] Furthermore the
vacancies left in the ferritic matrix by chromium depletion created new short-circuit
diffusion pathways to the oxide-gas interface increasing the overall oxidation rate
Higher levels of CO in the ambient atmosphere were also found to be conducive to
breakaway oxidation because of the increase in carbon activity and hence tendency for
carburization [28] With chromium content above 18 austenitic stainless steels were
disposed to form continuous Q2O3 oxide layers in addition to the aforementioned
63
duplex oxide structure Unlike their ferritic counterparts though these steels were
unreceptive to breakaway oxidation and their higher chromium content conferred a self-
healing feature to the oxide if damaged [32]
While limited in number similar corrosion studies were also conducted using pure
nickel [81] and nickel-base superalloys [26] As expected pure nickel performed poorly
between 700 and 1100degC relative to the superalloys due to its inability to form Cr- or
Al-based oxide layers At lower temperatures the corrosion resistance of nickel-base
superalloys in CO2 was comparable to that of austenitic stainless steels although the
former seemed to be more affected by internal oxidation Nevertheless Hastelloy X
appeared at the time to be the most stable of all the superalloys in CO2 albeit this was
prior to 1976 [26] Recent work has also shown IN-617 to have a propensity for
intergranular attack in CO2 but only at extreme temperature ie 1000degC [11]
Figure 2-36 illustrates the ingress of corrosion product into the base metal after 175 hours
of testing suggesting that long-term material stability may eventually be compromised
Intercranular attack
2 5jnm Base metal
Figure 2-36 Intergranular attack of IN-617 following 175 hour exposure to C0 2 at 1000degC and 70 MPa [11]
64
252 Supercritical Pressure
While testing in the high temperature S-CO2 regime is still in its infancy early
results would suggest that the larger pressures have a relatively minor influence on
corrosion behaviour Hejzlar et al [76] liken this to the fact that the density of CO2 -
which determines the solubility and dissociation of both corrosive species and subsequent
corrosion products - does not markedly increase with pressure at temperatures so far
above its critical point (3103degC and 738 MPa) Additionally austenitic steels - 304-SS
and 316-SS - tested at temperatures nearer the critical point of CO2 where density is the
greatest showed no discernable evidence of corrosion even with significant impurity
(water methanol or sulphur) content added [23-25] Table 2-3 summarizes the various
test conditions (eg pressure temperature and duration) used by researchers with the
high temperature S-CO2 corrosion facilities described in Section 2321
Much of what was learnt from the AGR program regarding the surface response of
ferritic and austenitic stainless steels to CO2 exposure is equally applicable at
supercritical pressures Ferritic stainless steels - 410J3-SS F91 HCM12A HT-9 and
T91 - exhibited the same breakaway oxidation behaviour due to their inability to form a
continuous Cr2Cgt3 layer and susceptibility to carburization [33-37] Apart from the silica
inner layer Figure 2-37 shows a near identical FeaCVchromite spinel duplex oxide
morphology to that which was depicted in Figure 2-34 In fact S-CO2 corrosion tests
that included ferritic stainless steels were intentionally limited to below 500 hours to
minimize the extent of spallation and avoid potential cross-contamination with other
specimens
65
Table 2-3 Test conditions used for high temperature S-CO2 corrosion studies
Researcher
Oh et al
Furukawa et al
Li et al
Dunlevy
Gibbs
Lim et al
Sridharan et al
Rouillard et al
Institution
INL
Tokyo Institute of Technology and JAEA
MIT
UW-Madison
CEA
Test Conditions Pressure (MPa) 70100
200
128 200
125
200
125
120
220
207 250
Temperature (degC) 1000
400
500
550
600
660
714 650
750
610
650
650
550
Duration (hrs) 500
1991
230
500
1000
3000
230 1032
194
3000
310
Ref
[11]
[33]
[76]
[38]
[34]
[35]
[36]
[37]
Base metal
J 100pm
Figure 2-37 Characterization of 410J3-SS oxide structure following 1000 hour exposure to S-CO2 at 600degC and 200 MPa [33]
66
Excluding 316316L-SS austenitic stainless steels - 310-SS 800800H and
AL-6XN - had mass gains that were indistinguishable from most of the nickel-base
superalloys examined [3436] Figure 2-38 plots the cumulative mass gains for these
steels as well as the other alloys tested at UW-Madison The poor corrosion performance
of 316316L-SS above 650degC while not as severe as what was observed with the ferritic
stainless steels was again ascribed to oxidant eventually permeating through the duplex
oxide layer and reacting with the chromium-depleted austenite matrix Seemingly
counterintuitive the corrosion rate of 316316L-SS was also found to decrease with
increasing temperature - from 011 mgcm -day at 650degC to 006 mgcm -day at 750degC
[38] At higher temperatures the lattice diffusivity of chromium within this alloy was
believed to increase allowing for the formation of an underlying chromite spinel layer to
occur much sooner [76]
Ten nickel-base superalloys constitute the preliminary high temperature S-CO2
corrosion database that has been openly established for this class of high-performance
material IN-625 IN-690 IN-693 IN-718 IN-725 IN-740 IN-740+ Haynes 230
MA754 and PE-16 With sufficient chromium content to promote the growth of a thin
external Cr203 layer all of these superalloys displayed excellent corrosion resistance and
consistency amongst one another [343638] The slight differences in mass gain that
were noted correlated directly to the Al content of the alloy - the growth of a NiAl204
substratum or continuous AI2O3 external layer both served as a more effective barrier to
the outward diffusion of cations than a C^Ch oxide layer could alone
ltJ
200
180
160
140
120
bull | 100 O pound 080 ox
1 pound 060 040
020
000 rTJll
-n
P 500 Hours bull 1000 Hours
D1500 Hours D 2000 Hours
bull 2500 Hours H 3000 Hours
67
[ r f m T l rITB riTB rf i i rrfTM PM2000 316 s s 310 SS AL-6XN 800H HAYNES ALLOY 625 PE16IN-
230 CM-639P
Figure 2-38 Cumulative mass gains of various alloys following a 3000 hour exposure to S-C02 at 650degC and 207 MPa at UW-Madison Reproduced from [36]
Figure 2-39 shows the cumulative mass gains for the various nickel-base
superalloys tested at MIT by Dunlevy [38] For select materials (IN-718 and LN-725)
samples were also cut parallel to the rolling direction of the supply stock under the
assumption that exposed end grains (EG) would facilitate the uptake of oxidant and result
in increased corrosion rates however the formation of a protective oxide layer was likely
so quick that these short-circuit diffusion pathways were covered over almost
immediately Similarly no connection between pressure and corrosion behaviour was
firmly established - in some instances the increase in pressure at higher temperature
appeared to suppress oxidation but the variance in test data at 650degC was too large to
corroborate this Protrusions from the external oxide layer indicated that transitional
68
elements in the alloy (Nb Ti and Zr) in addition to Cr were also diffusing to the surface
and forming carbides While these carbide precipitates had no bearing on the stability of
the oxides in this study Dunlevy [38] suggested that they could serve as eventual sites for
crack initiation within the oxide layer
O016
0014
bullS 0012
i 0010 3) ~ 0008 E () 0006
O) 0004
0002
0000
bull LA2 Cumulative 0-500 Hour T=650 C P=125 MPa
bull LA1 Cumulative 0-500 Hour T=714 C P=20 MPa
I I I III III I I Inconel Inconel Inconel Inconel Inconel Inconel Inconel Inconel
690 693 718 (EG) 718 725 (EG) 725 740 740+
Figure 2-39 Cumulative mass gains of nickel-base superalloys following exposure to S-CO2 at various test conditions [38]
Lastly iron-base oxide-dispersion strengthened (ODS) alloys and particularly
those with high Al content (MA957 and PM2000) demonstrated superior corrosion
resistance to even that of the nickel-base superalloys an adherent but wavy AI2O3 layer
formed on the surface of these alloys [34-36] While they seem like a logical choice for
the structural materials of a S-CO2 Brayton cycle ODS alloys are currently expensive to
process and unfavourable to conventional welding techniques [82] Until these issues are
resolved nickel-base superalloys represent the best alternative
69
26 Summary
The foregoing sections emphasize just how complex and potentially disastrous
material interaction with a high temperature CO2 environment can be Moreover the
reader should now have an appreciation for the current state of corrosion research related
to the S-CO2 Brayton cycle and why the development of a dedicated S-CO2 corrosion
testing facility is justified Summarized below are the key points that should be taken
from this literature review
1 Multi-step chemical processes allow for the release of O and C atoms from a
carbon-rich oxidant to initiate and sustain oxidation carburization and
potentially metal dusting corrosion mechanisms
2 While limited in number all the S-CO2 corrosion facilities that have been built
to date utilize a metallic pressure vessel to either contain test specimens or to
function as one Static once-through and recirculating configurations have
been used
3 Preliminary results from high temperature S-CO2 corrosion studies correlate
well with what was observed at subcritical pressure as part of the British AGR
nuclear program ie the ability to form a continuous adherent Cr203 oxide
layer is an effective but not the best means to protect against CO2 attack
4 Corrosion rates of nickel-base superalloys and ODS alloys that were able to
form AhC^-based oxide layers are the lowest of any of the materials studied in
high temperature S-CO2 environments
70
3 Thesis Objectives and Outline
This thesis contributes to one of the deliverables identified in an ongoing research
partnership between Carleton University and CanmetENERGY of NRCan involving the
design of a 100 MWe S-CO2 advanced Brayton cycle As was noted in the literature
review S-CO2 corrosion data exists only for a limited number of materials and at specific
pressure and temperature combinations - none of which are expected to be identical to
the operating conditions of the cycle that results Thus to properly fulfil this deliverable
and support the selection of suitable materials under relevant test conditions a dedicated
S-CO2 corrosion test facility is required Consequently the main objectives of this thesis
include
1 The comprehensive design and assembly of a high temperature S-CO2 corrosion
test rig from the definition of its test conditions to the layout selection and
procurement of its components
2 Commissioning this test rig through calibration trials and baseline operation to
fully understand and optimize its operation
These objectives purposely coincide with what is necessary to see the development of
such a corrosion test rig to completion In the two chapters to follow both objectives will
be discussed in greater detail
71
4 Design of the Carleton-NRCan S-CO2 Corrosion Test Rig
From the outset of its design the Carleton-NRCan S-CO2 corrosion test rig was to
offer a testing envelope that at the very least matched the pressure and temperature
capabilities established at MIT and UW-Madison While safety considerations would
ultimately influence the final design of this test rig low implementation costs and a high
level of usability were also regarded as important design criteria This section first states
the requirements of the Carleton-NRCan S-CO2 corrosion test rig and details such
fundamental components as the pressure vessel pump furnace integrated safety features
and specimen boat The rationale behind how these and other auxiliary components were
arranged to form this test rig is then elucidated
41 Design Criteria
Summarized below in bullet form are the compulsory design requirements of the
Carleton-NRCan S-CO2 corrosion test rig
bull A primary operating point of 250 MPa at 700degC with potential to test as high as
750degC but only at 150 MPa
bull The capability to sustain a continuous CO2 flowrate of at least 10 Lhr (at
standard conditions) and allow for intermittent static periods
bull Near-autonomous operation during testing
bull A pressure vessel that could readily accommodate test specimens with a
maximum cross-sectional diameter of 127 mm (05 in) and do so without
restricting flow
72
bull The use of CO2 whose purity is close to or above 999
bull A method of specimen support that itself would be unreceptive to corrosion and
relatively inert so as to not serve as a catalyst for any chemical reaction
bull The incorporation of both passive and active safety systems to protect against
and quickly remedy any inadvertent overpressurization or thermal runaway
bull All applicable components to be registered with the Technical Standards and
Safety Authority (TSSA) in Ontario as pressure-retaining devices
42 Pressure Vessel
The proposed operating conditions of this test rig removed the applicability of any
commonly available pressure vessel and demanded that one be custom designed and
fabricated from a suitable high temperature material Figure 4-1 shows maximum
allowable stress versus temperature curves of three nickel-base superalloys - IN-617
IN-625 and Haynes 230 - initially considered for the construction material of the
pressure vessel for comparison 316-SS is also included to exhibit its rapid deterioration
of mechanical properties above 550degC Despite all three candidate nickel-base
superalloys having comparable strengths above 700degC IN-625 was selected as the
pressure vessel body material because of its recent (but favourable) service experience at
MIT [3438] and UW-Madison [36] with high temperature S-C02 Much like those used
in prior S-CO2 corrosion test rigs this pressure vessel was to be tubular in shape
however an ID larger than 127 mm (05 in) suggested that round bar stock would need
to be bored through to give the minimum required wall thickness
73
225 i 1 1 1
0 -I 1 1 1 1 1 1 1 bullmdashi
0 100 200 300 400 500 600 700 800 900
Temperature (degC)
Figure 4-1 Stress-temperature curves for pressure vessel material candidates Generated with ASME data provided by Moore [83]
Initial sizing calculations were performed in accordance to the ASME
B313-2008 Process Piping standard and later verified by Moore [84] at Pressure Vessel
Engineering Ltd of Waterloo Ontario for Canadian Registration Number (CRN)
designation Given the two proposed operating conditions design points of 2941 MPa at
750degC and 1765 MPa at 800degC were chosen for the pressure vessel with its final cross-
sectional geometry based on whichever condition represented the limiting case For each
point the design pressure was equated to the burst pressure of the rupture disks
similarly design temperatures were made 50degC higher than their respective operating
temperatures - as determined from simulations conducted by Schuegraf [85] - to account
for the higher furnace set points that would be needed to offset heating losses Moreover
considering the very nature of this facility a conservative corrosion allowance of
74
635 mm (025 in) was also applied to the bore of the vessel Failure of the pressure
vessel would inevitably be dictated by its circumferential stress and thus the minimum
required wall thickness (tmjn) was calculated from
tmin = 0 + CA) (T + P
+ CA (41) [86]
where CA and omax denote the specified corrosion allowance and temperature-dependent
yield stress respectively With a fixed ID of 254 mm (10 in) an OD of 889 mm
(35 in) was found to provide an acceptable wall thickness for both operating conditions
Figure 4-2 depicts the anticipated operating pressure and the maximum internal pressure
this vessel can withstand at metal temperatures ranging from 650 to 875degC inclusively
~ s R
OH
pound s SB SB
~ a laquo s 01
bull
s HH
100
90
80
70
60
50
40
30
20
10
mdash 1 I
X
bull Primary Design Point 2941 MPa at 750degC
4 Secondary Design Point 1765 MPa at 800degC
J T | ^Vgt M a x i m u r a allowable pressure |
^ ^ v ^ ^ | Anticipated operating pressure ^S ^^ ^sltiJ
1 1
1
600 650 700 750 800
Temperature (degC)
850 900
Figure 4-2 Maximum allowable internal pressure-metal temperature curve for the pressure vessel as per the ASME B313-2008 Process Piping code
75
Both ends of the pressure vessel were sealed using 316-SS Graylocreg connectors
(CRN 0B27905) each of which consisted of three components (i) accompanying
3-GR20 blind hubs (ii) a 2-12-3 clamping assembly and (iii) a polytetrafluroethylene
(PTFE)-coated GR20 sealing ring One 3-GR20 hub was welded to either end of the
IN-625 section with its complement serving as the closure to the pressure vessel The
2-12-3 clamping assembly brought both hub faces together as it was tightened causing
the GR20 sealing ring to elastically deform and conform to the shrinking cavity between
them A schematic of this metal-to-metal sealing arrangement is illustrated in Figure 4-3
and deemed an improvement over the carbon steel bolts used by MIT to retain their seal
Before Tightening After Tightening
Figure 4-3 Graylocreg connector prior to (left) and following (right) tightening Adapted from [87]
To assist in determining an appropriate length for the IN-625 section a thermal
analysis of the entire vessel was also carried out by Moore [84] of Pressure Vessel
Engineering Ltd using Finite Element Analysis (FEA) software The intention was to
use the superior high temperature properties of IN-625 to dissipate as much heat as
possible - via free convection and radiative heat transfer mechanisms - before interfacing
76
with the 316-SS hubs As a result the overall length of the pressure vessel including the
Graylocreg connectors was 17272 mm (680 in) with 14605 mm (575 in) of that length
constituted by the IN-625 section These dimensions in addition to those pertaining to
the cross-section are summarized below in Figure 4-4 Construction radiographic
inspection of the welds and finally hydrostatic pressure testing of the vessel were all
executed by Price-Schonstrom Inc in Walkerton Ontario allowing it to be registered as
a type H fitting with TSSA (CRN 0H140405)
A
i
2X0 375 IN (9 525 mm)THRU NPT 0395 IN (10033 mm) DEEP
Figure 4-4 Working drawing of the IN-625 pressure vessel [84]
-680 IN (1727 2 mm) - 575 IN (14605 mm
ltr
77
43 Gas Booster
Sacrificing precise control over flowrate in favour of minimizing costs high
pressure CO2 was generated using an SC Hydraulic Engineering Corp GBT-1530 gas
booster rather than a syringe pump This two stage-double acting gas booster required
only compressed air and gas supply sources to operate hence the outlet parameters of
the booster were governed by its own inherent gas amplification factor and the pressures
and flow capacities of these sources Provided by the manufacturer an approximate
correlation between the compressed air (PA) and gas supply source (Ps) pressures needed
to produce a particular static outlet stall pressure (Po) was
P0 = 30 bull PA + 2 bull Ps (42) [88]
Below Po though pressure perturbations were introduced into the outlet gas flow because
of the intrinsic reciprocating action of the gas booster Methods employed to mitigate
this problem are discussed as part of the conceptual layout of the test rig in Section 47
44 Furnace
The pressure vessel was centered within a Thermcraft Inc XST-6-0-24-3V furnace
whose split-tube design facilitated the initial loading and positioning of the vessel
Three independently controlled heated zones gave this furnace a total heated chamber
length of 6096 mm (240 in) and a cumulative power output of 6800 W zones 1 2 and
3 measured 1524 mm (60 in) 3048 mm (120 in) and 1524 mm (60 in) in length
respectively Figure 4-5 identifies the location of each heated zone and its corresponding
Platinel II thermocouple Temperature set points were inputted to and regulated by a
78
Thermcraft Inc 3-1-40-230-E15SP control system however were only indicative of the
air temperatures inside the heated chamber The basis of Section 52 was therefore to
find through trial and error the necessary set points of each heated zone that would give
- with an approximately uniform distribution - the desired temperature inside the vessel
Upon its reception the control system was also reconfigured to limit the maximum set
point of any heated zone to 800degC (in agreement with the maximum design temperature
of the pressure vessel)
1 11 ImdashI
- 3 0 38 IN (771 65 mm) OVERALL-30 0 IN (762 0 mm) SHELL
24 0 IN (609 6 mm) HEATED
(1524mm)^ v (1524mm)
^ rft-P 1 1 r f c
ZONE1 ZONE 2 im
ZONE 3
M
T TT-aij -arf
PLATINELII THERMOCOUPLE
Figure 4-5 Furnace dimensions and heated zone locations
45 Integrated Safety Features
Again due to the pressures and temperatures involved in operating this corrosion
test rig the implementation of measures to safeguard the user against serious injury or
even death was indisputable The resulting safety features consisted of several
preventative (passive) and protective (active) components some of which could be
interchanged to specifically tailor to each operating condition This section elaborates on
how these safety features influenced the design of the test rig
79
451 Passive Elements
The passive safety elements ensured that the integrity of the corrosion test rig
would not be compromised even under the most unexpected of conditions A conscience
effort was made throughout the design process that involved the selection of both tubing
and valves whose pressure ratings were still above 2941 MPa (the higher of the two burst
pressures) even at temperatures they would likely never encounter For example the
635 mm (025 in) OD tubing that was used extensively throughout the test rig had a wall
thickness of 089 mm (0035 in) allowing for safe operation at prolonged exposure up to
430degC The thicker walls also had the added effect of providing for some corrosion
allowance at normal operating temperatures For an added level of assurance and to
have the test rig registered as a whole with TSSA components containing pressures
above 20477 kPa (excluding the gas booster and those part of the compressed air system)
were required to have a CRN The CRN denoted that the designs and their specified
maximum pressure rating were in fact validated by a regulatory agency
452 Active Elements
Unlike their passive counterparts the active safety elements of the test rig were
intended to relieve pressure or block all inlet flow to the gas booster These elements - a
safety relief valve (SRV) solenoid valve relay circuit and rupture disk - comprised the
redundant overpressurization protection system represented schematically in Figure 4-6
The activation pressure of each component was purposely chosen such that each was
triggered in sequence rather than simultaneously with increasing pressure and in order
80
of increasing impact on system operation Accordingly the relief pressure (PR) was set
midway between the operating (POP) and burst (PB) pressures and in turn the relay
circuit activation pressure (PRC) was set midway between the relief and burst pressures
Table 4-1 summarizes the magnitudes of each activation pressure at both specified
operating points
Solenoid Valve Relay Circuit
P -P P =P + B R
Increasing Pressure Safety Relief Valve
(SRV)
P -P Tgt - p | X B l OP rR rOP r j
Increasing Pressure
Figure 4-6 Overpressurization protection flowchart
Table 4-1 Activation pressures to remedy an overpressurization
Operating Pressure
(MPa) 2500 1500
Activation Pressure
P R PRC P B
(MPa) 2721 1632
2831 1699
2941 1765
Flowsafe Inc F84-M safety relief valves (CRN 0G104985) the first of the two
pressure relieving devices used were sized according to American Petroleum Institute
(API) Recommended Practice 520 Part I [89] Even with their different set pressures an
orifice area of 194 mm2 (0003 in2) in each 316-SS valve was found to provide sufficient
flow capacity to atmosphere Conversely the 316-SS SFAZ series rupture disks and
their attendant 304-SS FS-2U holder were purchased from ZOOK Canada Inc
(CRN 0G84835CADD1) At the recommendation of ZOOK these scored forward-
81
acting disks were produced with a 0 manufacturing range so that the proposed
operating pressures would constitute 85 of their respective burst pressures This higher
burst tolerance despite being almost 170 the cost of a standard model was specified to
ensure that the rupture disk would in fact be the last relieving device to activate
In the event that the SRV failed closed the solenoid valve relay circuit was
designed to isolate the gas booster from its supply feeds ie stop the addition of further
CO2 to the corrosion test rig To achieve this the alarm signal output of a Graphtec Corp
GL820 midi logger was connected to the control side (12 VDc) of a normally-open relay
to serve as a circuit interrupter Likewise normally-closed solenoid valves - Ascoreg
8264 CyroLC02- and 8210 General Service-series (CRN 0C122395) - were connected
in parallel on the load side (120 VAC) of this relay and to both the CO2 and air supplies
Alarm trigger conditions (discussed in Section 47) were assigned to specific input
channels of the logger and if they were exceeded forced the alarm output to act as if it
were an open circuit subsequently the relay was de-energized and both solenoids were
closed Figure 4-7 depicts the circuit diagram for this solenoid valve relay
82
opd co2 5V DC
120 VAC
bullCD CZgt
CD Ground
gtf Air
12 V DC
ltZJ
Data Logger Alarm Output
Figure 4-7 Circuit diagram of solenoid valve relay
46 Specimen Boat
Test specimens were electrically isolated from the pressure vessel and suspended
inside it using a custom-built alumina specimen boat Rather than machine this
specimen boat entirely from a solid cylindrical rod it was assembled from four
components which required little to no material removal a grooved 222 mm (0875 in)
OD tube two stepped semi-circular end caps and a 32 mm (0125 in) diameter solid
support rod This boat - fabricated by Elan Technologytrade of Midway Georgia -
measured 2667 mm (105 in) in length and used the semi-circle void in each of its ends
to encourage CO2 flow Figure 4-8 shows this specimen boat following its assembly
along with the alumina spacers that will be used to separate adjacent specimens
83
Figure 4-8 Alumina specimen boat
47 Conceptual Layout and Assembly
After much deliberation the NRCan Bells Corners complex (BCC) was chosen
over Carleton to house this S-CO2 corrosion test rig their telemetrically-monitored CO2
bulk tank comprehensive leak detection system and dedicated technicians to assist both
with assembly and routine maintenance were all influencing factors in this decision As
provided by BOC Canada Ltd CO2 within this bulk tank had a minimum guaranteed
purity of 9985 with maximum impurity levels listed in Table 4-2 The final design of
this test rig was to utilize a once-through arrangement with static testing capabilities as
opposed to being a recirculating system While a recirculating system would be most
representative of the closed cycle S-CO2 Brayton cycle excessive contaminant in either
solid or gaseous form could potentially limit the life of the gas booster Figures 4-9 and
4-10 illustrate the complete process and instrumentation diagram (PampID) and physical
arrangement of this corrosion test rig its accompanying bill of materials (BOM) is found
in Appendix A
Figure 4-9 PampID for Carleton-NRCan high temperature S-CO2 corrosion test rig 00 -1^
85
Table 4-2 Maximum impurity content of BOC Canada Ltd standard grade bulk CO2
ppm (vol)
Inerts CxHy H20 0 2 NH3 CO CxIy NOx S02 COS H2S (volatile) (non-volatile)
1000 50 32 30 25 10 10 05 05
Figure 4-10 Carleton-NRCan high temperature S-C02 corrosion test rig
Carbon dioxide was supplied to the gas booster at 159 MPa after first passing
through the Ascoreg 8264 CyroLC02 solenoid valve and a 150 um particulate filter The
use of a three-way needle valve and check valve (located at the booster outlet) also
allowed for C02 to bypass the gas booster altogether and purge the test rig at this lower
pressure Similarly compressed instrument air flowed through a Norgren Excelonreg
86
B74G filter-regulator assembly and the Ascoreg 8210 General Service solenoid valve
before entering the booster Apart from the check valve Figure 4-11 shows where each
of these components is located in relation to the GBT-1530 gas booster To simplify
control over the outlet pressure of the gas booster only the pressure of the compressed air
feed could be adjusted Furthermore it was determined from Equation 42 that given the
maximum available CO2 and compressed air pressures the stall pressure of the gas
booster was limited to approximately 2592 MPa
Upon leaving the gas booster compressed CO2 was filtered through a 70 urn
particulate filter and stored in a 316-SS 300 mL buffer tank The buffer tank was one
part of a two-stage system aimed to remove the inevitable pressure pulsations from the
CO2 its complement was a GO-Regulator PR-57 series regulator Stored energy in the
CO2 would first serve as a rudimentary dampener to smooth out these pulsations before
entering the PR-57 regulator where the CO2 would then leave at essentially constant
pressure The addition of the buffer tank kept at a slightly higher pressure than the
intended operating pressure was to prolong the life of the regulators diaphragm
GO-Regulator had also recommended that ethylene propylene be substituted for the
standard Viton seals to prevent any chance of explosive decompression with S-CO2
Moreover an Endress+Hauser Cerabar S PMP71 transmitter was used in conjunction
with the PR-57 regulator to help in regulating the CO2 to the desired test pressure
87
Figure 4-11 Inlet connections to the GBT-1530 gas booster
88
Figures 4-12 and 4-13 depict the layout of various components downstream of the
GBT-1530 gas booster both at its immediate outlet and at the inlet to the pressure
vessel As each figure clearly shows all tubing leading from the outlet of the gas booster
to the inlet of the pressure vessel was wrapped with OMEGAreg HTC heating cords and
Aeroflexreg tube insulation to keep the CO2 in a supercritical rather than liquid state the
pressure vessel in turn was supported by adjustable laboratory jack stands which were
aimed to facilitate its initial positioning and possible future removal Two needle valves
also allowed this corrosion test rig to function as a static system by completely isolating
the pressure vessel Consequently both the FlowSafe F84-M SRV and ZOOK SFAZ
rupture disk had to be located between these valves so as not to remove their protective
role when operating at static conditions Once testing commences the specimen boat
will sit inside the pressure vessel and temperature will be measured on both sides of it
using OMEGAreg KQIN thermocouple probes
As a provision to accommodate higher flowrates 61 m (20 ft) of 3175 mm
(0125 in) OD 316-SS tubing was coiled and added at the outlet of the pressure vessel to
provide additional surface area for cooling - either by free convection or by submersing
the coil in a water bath Downstream of this cooling coil a 70 urn filter removed any
particulate entrained within the CO2 before reaching the TESCOMtrade CC-series metering
valve This particulate filter was situated between one of the static isolation valves and
another three-way valve so that it could be taken out and replaced without interfering
with a corrosion test Similar to what was done upstream of the pressure vessel all
89
pertinent valves and measuring instruments were mounted onto stainless steel plating to
make controlling the test rig as efficient as possible
Upstream isolation valve
7 (jrn f i l t e r
lt FROM GAS BOOSTER
Figure 4-12 At the outlet of the GBT-1530 gas booster
90
Figure 4-13 At the inlet to the pressure vessel
Pressure drop and hence flow control was achieved using the CC-series metering
valve with both temperature and pressure measured at its outlet to monitor against
freeze-ups and indirectly quantify higher flowrates Flowrates lower than 50 Lhr at
standard conditions were read off of a Swagelok rotameter which because of the precise
control afforded by the metering valve was converted into a passive flowmeter Spent
CO2 was finally exhausted to atmosphere after first passing through a simple gas scrubber
91
configuration - two 500 mL Erlenmeyer flasks arranged in series Figure 4-14 illustrates
how the corrosion test rig was configured downstream of the pressure vessel
Type-K thermocouples were used exclusively throughout this test rig and like the
pressure transducer had their output sampled and recorded by the Graphtec GL820
logger This logger as well as the solenoid valve relay circuit and OMRON DC power
supply were all mounted inside the electrical enclosure shown in Figure 4-15 In
addition to those located inside and downstream of the pressure vessel thermocouples
were also permanently adhered to its exterior to measure metal temperature Figure 4-16
depicts the relative locations of these thermocouples along the length of the pressure
vessel - thermocouples T-4 and T-10 were fixed to both Graylocreg blind hubs T-5 and
T-9 were attached to each weld joining the blind hub to the IN-625 section T-6 was
positioned at the midpoint inside the furnace and T-7 T-8 T-9 and T-10 collectively
gave a discrete thermal profile of the pressure vessel - outside the furnace - in the axial
direction
92
Figure 4-14 Downstream of the pressure vessel
-+c
J ^
Figure 4-15 Electrical enclosure
mi
rrmdash11 ^777777 BrW
NWV1
Figure 4-16 Thermocouple locations along the length of the pressure vessel
93
As part of the solenoid valve relay circuit discussed in Section 452 seven of the
fourteen (nineteen during commissioning) analog inputs that fed into the GL820 logger
were assigned upper threshold alarm triggers Only four unique trigger conditions (one
pressure- and three temperature-related) were actually defined though leaving some
input channels to serve in a duplicate or redundant capacity the magnitudes of two of
these alarm triggers were also dependent on which operating point was selected Table
4-3 identifies the values of each of the four alarm trigger conditions and which input
94
channel(s) they applied to The first and second alarm triggers listed in Table 4-3
represent the predetermined solenoid valve relay circuit activation pressures and the
design temperatures of the pressure vessel Similarly the remaining two trigger points
were conservative maximum limits for both the process temperature of the PMP71
transmitter and the exposure temperature of the thread sealant used in the Graylocreg blind
hubs - the actual maximum temperature ratings of each were 125degC and 288degC
respectively
Table 4-3 Assigned upper threshold alarm triggers
Alarm ID
1A
2A
3 4
Applicable Channel Inputs
PMP71 pressure transmitter
Internal temperature of the pressure vessel (2 signals) Metal temperature of the IN-625 section inside the furnace
Metal temperature of the PMP71 process connection Metal temperature of the left and right Gralyocreg blind hubs
Assigned Value
2831 MPa or 1699 MPa
750degC or 800degC 100degC 250degC
A Value depends on the particular operating point chosen - 250 MPa at 700degC or 150 MPa at 750degC
5 Commissioning
95
Following its assembly functional testing of the Carleton-NRCan high temperature
S-CO2 corrosion test rig was conducted to evaluate its performance against the original
design criteria Time constraints only allowed for comprehensive thermal profiling inside
the pressure vessel to be completed at 150 MPa nevertheless two furnace set points
established at 150 MPa were used to investigate what effect operating at a higher
pressure (eg 250 MPa) would have on heating the S-CO2 This section describes what
was observed during the initial start-up of this corrosion test rig and summarizes the
results of its commissioning process
51 Initial Start-up and Modifications
To characterize the temperature distribution of S-CO2 within the pressure vessel a
custom OMEGAreg profile probe was acquired with six thermocouples incorporated into a
381 mm (180 in) portion of its overall length Figure 5-1 illustrates how this profile
probe in addition to a secondary single-point OMEGAreg KQIN probe were arranged
relative to the heated zones of the furnace the thickness of the single-point probe has
been exaggerated to differentiate between the two Starting at the leftmost edge of
zone 2 temperature was measured at successive 762 mm (30 in) intervals across its
entire length temperature was also measured at the rightmost edge of zone 3
Initial functional testing was performed at 150 MPa and with CO2 leaving the test
rig at a constant flowrate of 20 Lhr at standard conditions Temperature in each heated
zone of the furnace was also increased at a linear rate of 200degChr to a final set point of
96
600degC to lessen the thermal shock that the pressure vessel would be subjected to
Figure 5-2 shows the temperature distribution both of the pressure vessel itself and the
S-CO2 inside it once a steady state was reached Data points used to generate Figure 5-2
and likewise all figures to follow were averaged from steady state data that was sampled
every 50 s for a total duration of two hours (ie a sample size of 1440 data points)
Overall the heating process was found to be quite inefficient with fluid
temperatures averaging approximately half the value of the furnace set points
Additionally duplicate temperature measurements at the tips of each probe (T-2 and
T-13) differed by approximately 25degC with the single-point probe measuring the lower
of the two Although difficult to confirm the radial positioning of each probe tip was
most likely asymmetrical the greater unsupported length of the profile probe would have
attributed to a larger deflection under its own weight causing this thermocouple to
actually be closer to the bottom of the pressure vessel Testing was stopped though when
the original PTFE-based thread sealant used to interface with the pressure vessel began
to discolour and melt to the Graylocreg hubs
762 mm (30 in) TYP
I 18
| j | M V77YX7Mlt7 77777
zoNEi ZONE 2 ZONE 3
Figure 5-1 Location of thermocouples within the pressure vessel (hatched)
97
500
400 -
300 U o u u 3 i-
I 200
100 -
n i
Radial positioning of these thermocouples was likely different
bull Weld
lt bull Graylocreg hub
bull 1 1
bull Metal Temperature
bull Fluid Temperature i
m
w bull bullbull
^ Weld
bull Graylocreg hub 4
0 025 05 075 1 Normalized Pressure Vessel Length
Figure 5-2 Initial temperature distribution at 150 MPa for furnace set points of 600degC
Similar to what was realized by Dunlevy [38] metallic reflectors were added inside
the bore of the pressure vessel in an attempt to concentrate heat within the confines of the
furnace Molybdenum (Mo) sheeting was cut into six 1905 mm (075 in) diameter
disks and each disk was perforated with four equidistance holes about its axis to
encourage flow As shown in Figure 5-3 reflector placement was symmetric about the
centre of the furnace with the first of three reflectors positioned 635 mm (25 in) from
the outermost edge of zones 1 and 3 subsequent reflectors were spaced 254 mm (10 in)
apart from one another moving towards the ends of the furnace Furthermore high
purity nickel wire was crimped onto both probe sheaths on either side of each Mo heat
reflector to ensure they remained fixed as the vessel was pressurized Figure 5-4 depicts
98
the arrangement of Mo reflectors on the profile probe sheath prior to being inserted into
the pressure vessel Following its reassembly a metallic-based thread sealant capable of
withstanding temperatures up to 288degC was used instead on the process connections with
the pressure vessel
635 mm (25 in) TYP
254 mm (10 in) TYP 13) (14) 05) (16) ( IT) T 18)
W77 VMA77Z y(JYSYi ^ ^ v))Mvy^ M M
ZONE 1 ( 2 ZONE 2 ZONE 3
Figure 5-3 Heat reflector positioning within the pressure vessel (hatched)
Figure 5-4 Heat reflectors attached to the profile probe sheath
99
At identical conditions (150 MPa with 600degC furnace set points) to the previous
functional test Figure 5-5 illustrates a marked increase - by as much as 150degC - in
S-CO2 temperature with the addition of these heat reflectors However the effectiveness
of the heat reflectors is perhaps best exemplified by the significant temperature difference
between adjacent thermocouples positioned within (T-17) and outside of (T-18) of their
boundaries The presence of the heat reflectors would also appear to minimize the
temperature disparity between T-15 and T-17 skewing the nearly symmetric bell-shaped
distribution that was observed before slightly right of centre Moreover temperatures
measured by T-2 and T-13 should have been in closer agreement with each other as the
heat reflectors were also acting to centre both probes within the bore however unlike the
earlier test in which T-2 was roughly 25 degC cooler T-2 was now 30degC wanner When the
pressure vessel was disassembled again the single-point probe was found to have a sharp
bend along its length which could have been incurred from misalignment during its
initial insertion Similarly Figure 5-6 depicts the change in metal temperature following
the addition of the heat reflectors As the causal effect of the increased fluid temperatures
observed in Figure 5-5 metal temperature within the furnace experienced the most
pronounced change - an increase of approximately 85degC While not as noteworthy the
heat reflectors also served some purpose in keeping the Graylocreg hubs cooler
Since the alumina specimen boat can only accommodate metal coupons in
2286 mm (90 in) of its overall length temperature need only be held constant over an
equivalent length inside the pressure vessel For each thermal profile conducted
hereafter furnace set points were adjusted to give an approximately uniform temperature
100
distribution across T-14 to T-17 inclusively Thus when the specimen boat is to be
inserted into the pressure vessel it will be centred 381 mm (15 in) to the right of the
midpoint of the furnace
O o
i-= s laquo u a
amp
T-2 M
4 T-2 bull
-500-
400mdash
300-
200-
100-
-0-
- i r~
^ ( 1 1
Significant decrease in S-C02
temperature outside the heat reflectors
bull Prior to Adding Heat Reflectors
bull Following the Addition of Heat Reflectors
-200 -150 -100 -50 0 50 100 150 200 250 300 350
Distance from Centre of Furnace (mm)
Figure 5-5 Effectiveness of the heat reflectors on raising fluid temperature at 150 MPa for furnace set points of 600degC
100
75
101
u o o S -
s laquo s -ltu a E
50
25
025 05 075
-25 Normalized Pressure Vessel Length
Figure 5-6 Change in metal temperature following the addition of the heat reflectors at 150 MPa for furnace set points of 600degC
52 Thermal Profiling at 150 MPa
Two separate profiling trials were carried out at 150 MPa to first establish furnace
set points that would give uniform temperature distributions at 550 600 650 and 700degC
(ie temperatures that could serve as the TIT for the S-CO2 Brayton cycle) and then
using the same series of set points to confirm the repeatability of the initial results This
validation trial was also used to refine the original furnace set points if needed and
further reduce the maximum temperature difference over the defined heated length
Similarly the highest possible S-CO2 temperature that would allow for a uniform
102
distribution was also determined however the furnace set points required to achieve this
were not validated like those at lower temperatures and were ultimately limited to the
design temperature (800degC) of the pressure vessel While this section focuses solely on
the internal temperature distribution of the pressure vessel specifically over the
2286 mm (90 in) length spanning between T-14 and T-17 complete thermal profiles (at
the aforementioned temperatures) are made available in Appendix B
Furnace set points that would produce the desired fluid temperatures were
determined by progressively increasing their values and monitoring what effect this had
on the overall temperature distribution within the pressure vessel Temperature was
increased at a linear rate of 200degChr regardless of the magnitude of the temperature rise
but only once pressure had stabilized at 150 MPa To allow the S-CO2 time to properly
acclimatize itself to any increase in temperature two hours - if the temperature increase
was equal to or greater than 15degC - had to have elapsed before the next change to a
specific furnace set point could be made temperature increases less than 15degC were only
given an hour Table 5-1 details the succession of furnace set points beginning at a
universal starting point of 580degC and clearly identifies the final set points needed to attain
each of the four internal temperatures As the overall temperature was increased the
difference between zone 1 and 3 set points (needed to counteract forced convection) was
found to decrease most likely as the effects of radiation heat transfer became more
significant From the outset of thermal profiling the following convention was also
adopted to summarize the set points of each heated zone in the furnace
[ZONE 1 I ZONE 2 | ZONE 3] (51)
Table 5-1 Heated zone set points to give uniform temperature distributions
Desired S-C02
Temperature
550degC
600degC
650degC
700degC
Heated Zone Set Point
1 2 3
CO 580
620
650
665
680
680
690
695
695
710
720
725
725
740
750
750
750
765 775 780 780 785 785 785
580
620
620
620
620
620
620
620
645
650
650
650
675
675
685
690
715
725 735 735 735 735 735 735
580
620
620
620
635
650
650
655
680
690
700
700
725
725
725
725
750
750 755 760 765 765 770 775
104
U o V s -3
bull bull
eS i a pound
i X i
i lt i I I E 1 1 I
4 i bull
n [bull] i i i i i i
_ J _ _ i l
4
l)J^ bull
u j i r i f c -i
crf a u u u mm
550-^h
5 0 0 -
4 5 0 - 1
X
Jk
gt - -
i 1
i
X 1 1
1 1 I t
bull 1
1
1 1
1 1
1 1
-200 -150 -100 -50 0 50 100 150 200
Distance from Centre of Furnace (mm)
bull [695degC | 620degC | 655degC] bull [725degC | 650degC | 700degC]
A[750degC | 690degC | 725degC] X[785degC | 735degC | 775degC]
Figure 5-7 Temperature distributions for 550 600 650 and 700degC using the established furnace set points
Figure 5-7 shows the expected temperature distributions over the usable length of
the specimen boat at 550 600 650 and 700degC Of these four temperatures the average
maximum temperature deviation between the respective peak and the lesser of the two
ends was approximately 147degC or 236 of the peak temperature Results of the
validation trial are plotted in Figures 5-8 through 5-11 and generally show less variation
with the original data set at higher temperatures However for each case uniformity of
temperature across the 2286 mm (90 in) length was marginally improved Table 5-2
summarizes the furnace set points and thermocouple readings that were used to generate
these plots as well as the maximum temperature differences that were observed
105
At both 550 and 600degC Figures 5-8 and 5-9 illustrate that specific furnace set
points actually had to be reduced by as much as 15degC to replicate the same temperature
distribution as before a small discrepancy in flowrate between the two trials was likely
the cause Although flowrate was visually confirmed to be 20 Lhr at standard
conditions for each trial a more accurate means of flow measurement (ie a coriolis
flowmeter) than what is currently in place would have substantiated this claim These
discrepancies in flowrate are less influential on heat transfer to the S-CO2 above 650degC
as the radiative heat transfer mechanism becomes more dominant Figures 5-10 and 5-11
show that the temperatures obtained as part of the validation trial were nearly identical to
those first measured in establishing furnace set points for 650 and 700degC In an effort to
flatten these initial temperature distributions even more individual furnace set points
were increased by 5degC and the maximum temperature difference at both 650 and 700degC
was reduced by roughly 05degC Overall the average maximum temperature difference
resulting from the validation trial was 131degC or 209 of the peak temperature
consequently it was decided that the slightly modified furnace set points obtained from
this trial would replace their original counterparts
u o i-
s s -
S
m
1
bull
-100 -50
560-
5 5 5 -
550
545
540-
535
530-
150 0 50 100
Distance from Centre of Furnace (mm)
bull [695degC | 625degC | 655degC] Initial Run B[6850C | 610degC | 645degC] Validation Run
200
Figure 5-8 Validation of the furnace set points to give 550degC at 150 MPa
U o
u
a E
E2
bull100
-605-
-600
-595
-590-4
-585
-580
t
-50 0 50 100
Distance from Centre of Furnace (mm)
150 200
bull [725degC | 650degC | 700degC] Initial Run l[725degC | 640degC | 690degC] Validation Run
Figure 5-9 Validation of the furnace set points to give 600degC at 150 MPa
-655-
U o
s-S
i-
P E
-65a-
-645
-640
-635 - -
630-
bull100 -50 0 50 100 150 200
Distance from Centre of Furnace (mm)
bull [750degC | 690degC | 725degC] Initial Run B[755degC | 695degC | 725degC] Validation Run
Figure 5-10 Validation of the furnace set points to give 650degC at 150 MPa
U o O) s -
s u
m
705-
700 - raquo -
695
690
685
680- 1 1 1
-100 -50 0 50 100 150
Distance from Centre of Furnace (mm)
bull [785degC | 735degC | 775degC] Initial Run bull [785degC | 735degC | 780degC] Validation Run
200
Figure 5-11 Validation of the furnace set points to give 700degC at 150 MPa
108
Table 5-2 Summary of the thermal profiling trials conducted at 150 MPa
Heated Zone Set Point
1 2 3
(degC) 695
685
725
725
750
755
785
785
800
620
610
650
640
690
695
735
735
750
655
645
700
690
725
725
775
780
800
Thermocouple Reading
T-14 T-15 T-16 T-17
(degC) 5366
5472
5827
5909
6363
6378
6857
6875 j
7082
5499
5591
5995
6020
6499
6500
6998
7003
7215
5457
5535
5970
5962
6444
6437
6939
6941
7155
5373
5467
5881
5897
6357
6362
6854
6865J
7082
AVERAGE
ATMAX
(degC) 133
123
168
123
142
138
144
138
133
138
ATMAX
TMAX
() 242
221
279
204
218
213
206
198
184
218
As an exploratory exercise the furnace set points of zones 1 and 3 were set to the
design temperature of the pressure vessel at 150 MPa (800degC) and zone 2 was adjusted
until a uniform temperature distribution was achieved Thus at [800degC | 750degC | 800degC]
Figure 5-12 shows that S-CO2 could be heated to approximately 721degC - only 29degC less
than the envisioned maximum testing capability of this facility - and maintained to
within 133degC over the usable length of the specimen boat Achieving a uniform fluid
temperature of 750degC is certainly plausible especially since the metal temperature at the
midpoint of the furnace was 7656degC However a greater number of thermocouples - as
a minimum one in each heated zone of the furnace - should be mounted to the pressure
vessel to ensure its safe operation as the set points are increased beyond 800degC In the
meantime a more optimal placement or greater number of heat reflectors within the bore
of the pressure vessel should be investigated to increase fluid temperature
109
U o
s-w a E
bull
-100 -50
725-
720-
715-
710-
705-
700- mdash i mdash
50 0 50 100 150
Distance from Centre of Furnace (mm)
200
Figure 5-12 Temperature distribution using furnace set points of [800degC | 750degC | 800degC] at 150 MPa
Although not shown explicitly in any of the previous plots the standard error
associated with each thermocouple is plusmn075 of its measured value at 7215degC (the
largest recorded temperature) this amounts to plusmn54degC Additionally fluctuations in
pressure at 150 MPa are largely attributed to the duty cycle of the furnace and can be
controlled to approximately plusmn02 MPa not including the maximum plusmn002 MPa reference
accuracy of the transmitter Figure 5-13 shows a representative sampling of pressure
over a 10 hour window at 650degC with the average maximum and minimum recorded
pressures being 1497 MPa 1516 MPa and 1482 MPa respectively For the same 10
hour window Figure 5-14 illustrates the variation in both fluid temperature across zone 2
(T-2 T-13 through T-17) and metal temperature inside the furnace boundary (T-6)
110
0gt i -S se
200
190
180 +
170
160 --
150
140
130
120 --
110
100
raquomraquomdashnraquomdash mmmmmtmmi M M M M M mmmmmdmmm
PAVG 1497 MPa PMAX 1516 MPa
PMIN 1482 MPa
0 2 4 6 8
Time (hr)
Figure 5-13 Pressure variations at 150 MPa over a 10 hour period at 650degC
10
725
700
U o
675 --
650
g 625 E
H 600
5 7 5 -bull
550
T-6
T-15 T-16 T-17 T-14
4gt
(J) T-2 T-13 W 14) (15) fl6 ~ltyen =F=FH
ZONE 1 ( 2
0 8 2 4 6
Time (hr)
Figure 5-14 Temperature variations at 650degC over a 10 hour period at 150 MPa
10
I l l
53 Pressure Effects on Performance
Two additional thermal profiling trials were performed for 550 and 600degC but at
250 MPa to assess what effect operating at a higher pressure would have on the heating
characteristics of this corrosion test rig Intuitively an increase in pressure and hence an
increase in density should result in a lower fluid temperature for fixed furnace set points
just how much lower was unknown As density increases conductive heat transfer
becomes more efficient [90] through the S-CO2 and heat loss through the walls of the
pressure vessel is expected to be greater Figure 5-15 in fact confirms this assumption
illustrating an increase in metal temperature outside the furnace for furnace set points of
[685degC I 610degC I 645degC] and [725degC | 640degC | 690degC] Accordingly Figures 5-16 and
5-17 both show an approximate 40degC reduction in fluid temperature at 250 MPa
Only after this pressure investigation was completed was it realized that the using
the same normalized flowrate at both pressures (20 Lhr) would have produced fluid
velocities at 250 MPa that were approximately half of what they were at 150 MPa
However the improved conduction mechanism at 250 MPa seems to have a more
pronounced effect on temperature distribution than velocity shifting the entire profile to
the right ie the maximum temperature is observed at T-16 rather than T-15 Despite
this noted shift in the S-CO2 temperature distribution Figure 5-18 suggests that the
thermal time constant of this test rig is independent of its operating pressure Increasing
at a linear rate of 200degChr from room temperature to furnace set points of
[685degC I 610degC I 645degC] the time needed for T-15 to reach a steady state is nearly
identical at both 150 and 250 MPa
112
U o w u a V s -
o -=s -^ os s -
Q
E
50
40 -bull
30
20
10
-10 --
-20
II
0 0
bull [685degC | 610degC | 645degC] Set Point
bull [725degC | 640degC | 690degC] Set Point
bull
1
bull i
1 1
25 05 075 i i
f i
Normalized Pressure Vessel Length
Figure 5-15 Differences in metal temperature at 250 MPa from 150 MPa for equivalent furnace set points
U o Qi i-S ca s-o
a
bull -100
bull560-
550
540-
530
520-
510-
500
490 H
480
bull 150 MPa
bull 250 MPa
-50 0 50 100
Distance from Centre of Furnace (mm)
150 200
Figure 5-16 Temperature distributions using fixed furnace set points of [685degC | 610degC | 645degC] at 150 and 250 MPa
113
U o ltu s -S laquo V D pound
bull100
-610-
-600 J
-590-
-580-
-570-
-560-
-550-
-540 H
-530
-520
bull 15 0MPa
bull 250 MPa
-50 0 50 100
Distance from Centre of Furnace (mm)
150 200
Figure 5-17 Temperature distributions using fixed furnace set points of [725degC | 640degC | 690degC] at 150 and 250 MPa
600
500
degi 400 u
1 300 u V Q
I 200
100 -
150 MPa^^- I -
A ^ i ^ 2 5 0 MPa
1
Time (hr)
Figure 5-18 Thermal response of T-15 from room temperature to fixed furnace set points of [685degC | 610degC | 645degC] at 150 and 250 MPa
114
6 Summary and Conclusions
Representing the first facility of its kind in Canada the Carleton-NRCan S-CO2
corrosion test rig was developed to satisfy two anticipated operating points (i) 700degC at
250 MPa or (ii) 750degC at 150 MPa These operating points and the ability to
accommodate test specimens measuring 127 mm (05 in) in diameter give the Carleton-
NRCan facility testing capabilities comparable to those at MIT and UW-Madison using a
relatively modest budget On a global scale the Carleton-NRCan corrosion test rig will
undoubtedly contribute to the growing demand to evaluate the corrosion behaviour of
various structural materials in high temperature S-CO2 A better understanding of such
corrosion mechanisms will assist in selecting or potentially developing alloys that will
offer long-term reliability to the S-CO2 Brayton cycle The major conclusions that
resulted from this thesis include
1 The initial start-up of this test rig revealed the fluid temperature within the
confines of the furnace to be approximately half that of the furnace set points
Consequently the heating efficiency of the furnace was improved by adding
three equally-spaced molybdenum heat reflectors on opposite sides of the
furnace but inside the bore of the pressure vessel to mitigate the heat loss along
its length
2 Furnace set points that would yield a near-uniform temperature distribution
across the usable length of the specimen boat were established and validated at
150 MPa for 550 600 650 and 700degC similarly limiting the maximum of any
of furnace set points to 800degC (the design temperature of the pressure vessel) a
115
uniform temperature was 721degC was attained Of the nine trials conducted at
150 MPa temperature and pressure variations could be controlled to within 123
to 168degC and plusmn02 MPa respectively once a steady state had been reached
3 Preliminary functional testing at 250 MPa indicated an approximate 40degC
decrease in average S-CO2 temperature from 150 MPa for equivalent furnace
set points
61 Future Work
Given that this corrosion test rig is now operational commissioning needs to be
completed at 250 MPa to ascertain what maximum S-CO2 temperature can be uniformly
achieved within the pressure vessel Once this maximum temperature is defined furnace
set points that will give uniform distributions at lower temperatures - presumably 500
550 600 and 650degC - will need to be determined and validated as was done at
150 MPa Likewise the commissioning envelope can be further expanded to include
100 MPa and 200 MPa this will ultimately provide a catalogue of furnace set points to
use for any conceivable combination of test conditions
A thorough investigation should also be carried out to confirm if the current
placement and number of heat reflectors inside the bore of the pressure vessel is indeed
the optimal arrangement Affixing the heat reflectors to the sheaths of each thermocouple
probe was found to have the unwanted effect of shifting the maximum temperature inside
the pressure vessel slightly right of its centre One option to remedy this effect would be
to provide a fluid path into and out of the pressure vessel that is not directly influenced by
116
the presence of the heat reflectors The 316-SS tubing that surrounds each thermocouple
probe prior to interfacing with the pressure vessel could be extended inside the pressure
vessel and the heat reflectors attached to this tubing instead Another option to increase
the heating efficiency of the furnace is to wrap the surface of the pressure vessel -
immediately at its boundary with the furnace - with insulation This would undoubtedly
require that another detailed FEA be performed to verify that (i) sufficient length of the
IN-625 is still exposed to dissipate heat and (ii) thermal stresses are not too severe
Ideally the commissioning process would have been conducted with the specimen
boat in-situ to give the most representative conditions of an actual corrosion test
However excess weld slag from joining the Graylocreg hubs to the IN-625 section
prevented the specimen boat from actually being inserted into the pressure vessel This
problem needs to be addressed and resolved before a more detailed thermal
characterization can be executed but most importantly before corrosion testing can
begin Price-Schonstrom Inc has indicated that this work will be done at their expense
but leaves the test rig inoperable while it is carried out Once this work is completed
though a preliminary corrosion test at 650degC and 150 MPa for 500 hours will be
initiated five stainless steels - 15-5 17-7 316-SS 416-SS and 420-SS - and one nickel-
base superalloy - IN-738LC - have been acquired for this very purpose
Corrosion testing that will inevitably result from this facility should distinguish
what effect pressure has on the corrosion response of suitable construction materials -
nickel-base superalloys - in S-CO2 even more so than what was done by Dunlevy [38]
The corrosion mechanism of these same materials should also be investigated at several
117
temperatures to determine what if any effect the dissociation of CO2 to CO above 700degC
will have on the corrosion rate Lastly each corrosion trial that is performed should be
done so at durations (ie 3000 hours) that will either confirm or refute the long-term
stability of the various oxide layers However to successfully achieve all of the
abovementioned would require several test rigs to be operated concurrently or a
compromise be made between the number of test points evaluated and the duration of
each test
118
References
[I] International Energy Agency World Energy Outlook R Priddle Ed Paris France 2009
[2] T Yokoyama Japanese RampD on CO2 Capture in Proc of the 6th International Conference of Greenhouse Gas Control Technologies vol I Kyoto Japan 1-4 Oct 2002 pp 13-18
[3] A Technology Roadmap for Generation IV Nuclear Energy Systems US DOE Nuclear Energy Research Advisory Committee and the Generation-IV International Forum GIF-002-00 Dec 2002
[4] GIF RampD Outlook for Generation IV Nuclear Energy Systems Generation IV International Forum Aug 2009
[5] J Lillington The Future of Nuclear Power Oxford UK Elsevier Ltd 2004
[6] V Dostal A Supercritical Carbon Dioxide Cycle for Next Generation Nuclear Reactors Massachusetts Institute of Technology Cambridge MA PhD dissertation Jan 2004
[7] T Schulenberg H Wider MA Fiitterer Electricity Production in Nuclear Power Plants - Rankine vs Brayton Cycles in ANSENS International Winter Meeting (GLOBAL 2003) New Orleans LA 16-20 Nov 2003
[8] Y Kato T Nitawaki Y Muto Medium Temperature Carbon Dioxide Gas Turbine Reactor Nuclear Engineering and Design vol 230 no 1-3 pp 195-207 2004
[9] ML Corradini Transport Phenomena in Supercritical Fluids in GENIV Reactor Designs in Proc of the 12th International Meeting on Nuclear Reactor Thermal Hydraulics (NURETH-12) Pittsburgh PA 30 Sept-4 Oct 2007
[10] A Moisseytsev JJ Sienicki Extension of the Supercritical Carbon Dioxide Brayton Cycle for Application to the Very High Temperature Reactor in Proc of the International Congress on Advances in Nuclear Power Plants (ICAPP 10) San Diego CA 13-17 June 2010
[II] CH Oh et al Development of a Supercritical Carbon Dioxide Brayton Cycle Improving VHTR Efficiency and Testing Material Compatibility Idaho National Laboratory Idaho Falls ID INLEXT-06-01271 Mar 2006
119
[12] CS Turchi Supercritical CO2 for Application in Concentrating Solar Power Systems in Proc of Supercritical CO2 Power Cycle Symp 2009 Troy NY 29-30 Apr 2009
[13] DJ Chapman DA Arias An Assessment of the Supercritical Carbon Dioxide Cycle for Use in Solar Parabolic Trough Power Plant in Proc of Supercritical C02 Power Cycle Symp 2009 Troy NY 29-30 Apr 2009
[14] GA Johnson M McDowell Issues Associated with Coupling Supercritical CO2 Power Cycles to Nuclear Solar and Fossil Fuel Heat Sources in Proc of Supercritical C02 Power Cycle Symp Troy NY 29-30 Apr 2009
[15] National Institute of Standards and Technology (NIST) (2010 Sept) Carbon Dioxide Gas Phase Thermochemistry Data [Online] httpwebbooknistgovcgi cbookcgiID=C 1243 89ampUnits=SIampMask=4Thermo-Phase
[16] MA Jacobs Measurement and Modeling of Thermodynamic Properties for the Processing of Polymers in Supercritical Fluids Technische Universiteit Eindhoven Eindhoven Netherlands PhD dissertation Sept 2004
[17] National Institute of Standards and Technology (NIST) (2010 September) Helium Gas Phase Thermochemistry Data [Online] httpwebbooknistgovcgi cbookcgiID=C7440597ampUnits-SIampMask=4Thermo-Phase
[18] V Dostal P Hejzlar MJ Driscoll High-Performance Supercritical Carbon Dioxide Cycle for Next-Generation Nuclear Reactors Nuclear Technology vol 154 no 3 pp 265-282 June 2006
[19] V Dostal P Hejzlar MJ Driscoll The Supercritical Carbon Dioxide Power Cycle Comparison to Other Advanced Cycles Nuclear Technology vol 154 no 3 pp 283-301 June 2006
[20] J Sarkar Second Law Analysis of Supercritical CO2 Recompression Cycle Energy vol 34 no 10 pp 1172-1178 September 2009
[21] J Ashcroft K Kimball M Corcoran Overview of Naval Reactors Program Development of the Supercritical Carbon Dioxide Brayton System in Supercritical COz Power Cycle Symposium 2009 Troy NY USA 2009
[22] V Dostal M Kulhanek Research on the Supercritical Carbon Dioxide Cycles in the Czech Republic in Supercritical CO2 Power Cycle Symposium 2009 Troy NY USA 2009
120
[23] FW Schremp GR Roberson Effect of Supercritical Carbon Dioxide (CO2) on Construction Materials Society of Petroleum Engineers Journal vol 15 no 3 pp 227-233 June 1975
[24] EM Russick et al Corrosive Effects of Supercritical Carbon Dioxide and Cosolvents on Metals The Journal of Supercritical Fluids vol 9 no 1 pp 43-50 Mar 1996
[25] WA Propp et al Corrosion in Supercritical Fluids Idaho National Laboratory Idaho Falls ID INEL-960180 May 1996
[26] C Tyzack HC Cowen The Corrosion of Reactor Materials in Carbon Dioxide Atomic Energy Review vol 14 no 2 pp 263-324 1976
[27] RA Brierley Studies of the Oxidation of 9 and 12 Cr Steels in High Temperature High Pressure CO2 in Proc of the British Nuclear Energy Society International Conference at Reading University Berkshire UK 23-24 Sept 1974 pp 165-179
[28] PC Rowlands et al Oxidation of 9 Cr Steels in High Pressure High Temperature CO2 in Proc of the British Nuclear Energy Society International Conference at Reading University Berkshire UK 23-24 Sept 1974 pp 193-207
[29] PL Harrison et al The Oxidation of 9Cr IMo Steels in Carbon Dioxide - A Discussion of Possible Mechanisms in Proc of the British Nuclear Energy Society International Conference at Reading University Berkshire UK 23-24 Sept 1974 pp 220-233
[30] MGC Cox B McEnaney VD Scott Structure and Growth of Oxide on Iron-Chromium Alloys in Proc of the British Nuclear Energy Society International Conference at Reading University Berkshire UK 23-24 Sept 1974 pp 247-256
[31] PL Surman et a l Methods of Controlling the Oxidation of 9CrlMo Steel in High Temperature CO2 in Proc of the British Nuclear Energy Society International Conference at Reading University Berkshire UK 23-24 Sept 1974 pp257-271
[32] JCP Garrett et al Some Factors in the Oxidation of Austenitic Stainless Steels in Proc of the British Nuclear Energy Society International Conference at Reading University Berkshire UK 23-24 Sept 1974 pp 298-310
121
[33] T Furukawa Y Inagaki M Aritomi Corrosion Behaviour of FBR Structural Materials in High Temperature Supercritical Carbon Dioxide Journal of Power and Energy Systems vol 4 no 1 pp 252-261 2010
[34] JP Gibbs Corrosion of Various Engineering Alloys in Supercritical Carbon Dioxide Massachusetts Institute of Technology Cambridge MA MS Thesis June 2010
[35] JY Lim et al Corrosion of Materials in Supercritical Carbon Dioxide Environments in Proc of NACE International Corrosion 2008 New Orleans LA 16-20 Mar 2008
[36] K Sridharan et al Corrosion of Candidate Alloys in Supercritical Carbon Dioxide in Proc of Supercritical CO2 Power Cycle Symp Troy NY 29-30 Apr 2009
[37] F Rouillard F Charton G Moine Corrosion Behaviour of Different Metallic Materials in Supercritical CO2 at 550degC and 250 bars in Proc of Supercritical C02 Power Cycle Symp Troy NY 29-30 Apr 2009
[38] MW Dunlevy An Exploration of the Effect of Temperature on Different Alloys in a Supercritical Carbon Dioxide Environment Massachusetts Institute of Technology Cambridge MA MS Thesis Sept 2009
[39] M Donachie Jr S Donachie Superalloys A Technical Guide 2nd ed Materials Park OH ASM International 2002
[40] RC Reed The Superalloys Fundamentals and Applications New York NY USA Cambridge University Press 2006
[41] CT Sims NS Stoloff WC Hagel Superalloys II New York NY USA Wiley-Interscience 1987
[42] M Durand-Charre The Microstructure of Superalloys Amsterdam The Netherlands Gordon and Breach Science Publishers 1997
[43] TM Pollock S Tin Nickel-Based Superalloys for Advanced Turbine Engines Chemistry Microstructure and Properties Journal of Propulsion and Power vol 22 no 2 pp 361-374 March-April 2006
[44] JR Davis Nickel Cobalt and Their Alloys Materials Park OH ASM International 2000
122
[45] GY Lai High-Temperature Corrosion and Materials Applications Materials Park OH ASM International 2007
[46] TJA Richardson Ed Shreirs Corrosion 4th ed Oxford UK Elsevier Ltd 2010 vol I
[47] N Birks GH Meier FS Pettit Introduction to the High-Temperature Oxidation of Metals 2nd ed Cambridge UK Cambridge University Press 2006
[48] P Kofstad High Temperature Corrosion London and New York Elsevier Applied Science Publishers Ltd 1988
[49] O Toft S0rensen Ed Nonstoichiometric Oxides London UK Academic Press Inc 1981
[50] R Prescott MJ Graham The Formation of Aluminium Oxide Scales on High-Temperature Alloys Oxidation of Metals vol 38 no 34 pp 233-254 1992
[51] GB Gibbs RE Pendlebury MR Wootton Protective and Breakaway Oxidation of Mild Steel in CO2 in Proc of the British Nuclear Energy Society International Conference at Reading University Berkshire UK 23-24 Sept 1974 pp 59-72
[52] AM Pritchard et al Some Investigations into the Mechanism of Breakaway Oxidation of Three Mild Steels in High Pressure C0 2 at 500degC in Proc of the British Nuclear Energy Society International Conference at Reading University Berkshire UK 23-24 Sept 1974 pp 73-84
[53] DJ Young High Temperature Oxidation and Corrosion of Metals Oxford UK Elsevier Ltd 2008
[54] HJ Grabke I Wolf Carburization and Oxidation Materials Science and Engineering vol 87 pp 23-33 Mar 1987
[55] M Schutze HJ Grabke Ed Corrosion by Carbon and Nitrogen - Metal Dusting Carburization and Nitridation Cambridge UK Woodland Publishing Ltd 2007
[56] P Szakalos M Lundberg R Pettersson Metal Dusting on an Alumina-forming Ni-base Alloy Corrosion Science vol 48 no 7 pp 1679-1695 July 2006
[57] SR Shatynski The Thermochemistry of Transition Metal Carbides Oxidation of Metals vol 13 no 2 pp 105-118 Apr 1979
123
[58] D Farkas Corrosion of Nickel-Base Superalloys in Simultaneous Carburizing and Oxidizing Environments in Proc of Materials in Nuclear Energy Huntsville ON 29 Sept-2 Oct 1982 pp 227-233
[59] M Shindo H Nakajima Effects of Carburization and Aging on the Tensile Properties of an Experimental Ni-Cr-W Superalloy Journal of Nuclear Materials vol 144 no 1-2 pp 20-28 Jan 1987
[60] J Zhang DJ Young Kinetics and Mechanisms of Nickel Metal Dusting I Kinetics and Morphology Corrosion Science vol 49 no 3 pp 1496-1512 Mar 2007
[61] GW Stachowiak AW Batchelor Engineering Tribology Oxford UK Elsevier Ltd 2005
[62] AW Batchelor LN Lam M Chandrasekaran Materials Degradation and its Control by Surface Engineering 2nd ed London UK Imperial College Press 2002
[63] I Kleis P Kulu Solid Particle Erosion Occurrence Prediction and Control London UK Springer Ltd 2008
[64] DM Rishel FS Pettit N Birks Some Principal Mechanisms in the Simultaneous Erosion and Corrosion Attack of Metals at High Temperatures Materials Science and Engineering vol 143 no 1-2 pp 197-211 Sept 1991
[65] R Baboian Ed Corrosion Tests and Standards Application and Interpretation 2nd ed West Conshohocken PA ASTM International 2005
[66] DB Meadowcroft HJ Grabke Ed Guidelines for Methods of Testing and Research in High Temperature Corrosion London UK The Institute of Materials 1995
[67] JR Nicholls Laboratory Studies of Erosion-Corrosion Processes Under Oxidising and OxidisingSulphidising Conditions Materials at High Temperatures vol 14 no 3 pp 289-306 1997
[68] N Hayashi et al Development of a New Testing Method by Centrifugal Erosion Tester at Elevated Temperature Wear vol 258 no 1-4 pp 443-457 Jan 2005
[69] FH Stott et al The Erosion-Corrosion of Alloys Under Oxidizing-Sulphidizing Conditions at High Temperature Wear vol 186-187 no 1 pp 291-298 July 1995
124
[70] AV Levy Solid Particle Erosion and Erosion-Corrosion of Materials Materials Park OH ASM International 1995
[71] WF Adler Erosion Prevention and Useful Application Baltimore MD ASTM 1979
[72] AV Levy J Yan J Patterson Elevated Temperature Erosion of Steels Wear vol 108 no 1 pp 43-60 Mar 1986
[73] R Flitney Seals and Sealing Handbook 5th ed Oxford UK Elsevier Ltd 2007
[74] R Viswanathan Boiler Materials for USC Plant in 17th Annual NETL Conf on Fossil Energy Materials 22-24 Apr 2003
[75] Y Kato Overview of Supercritical CO2 Cycle Studies at TokyoTech in Proc of MIT-TokyoTech Symp on Innovative Nuclear Energy Systems Cambridge MA 2-4 Nov 2005
[76] P Hejzlar et al Supercritical CO2 Brayton Cycle for Medium Power Applications Massachusetts Institute of Technology Cambridge MA MIT-ANP-PR-117 July 2007
[77] INL Portal (Dec 2010) Fiscal Year 2010 Nuclear Energy University Program Research and Development Awards [Online] httpsinlportalinlgovportal serverptgatewayPTARGS_0_2_61553_0_0_1810-872_Sridharan_lmp_5-6-10pdf
[78] F Rouillard Private communication Mar 2011
[79] TJA Richardson Ed Shreirs Corrosion 4th ed Oxford UK Elsevier Ltd 2010 vol II
[80] BA Sexton RStC Smart DJ OConnor Ed Surface Analysis Methods in Materials Science 2nd ed Heidelberg Germany Springer 2003
[81] JE Antill JB Warburton Oxidation of Nickel by Carbon Dioxide Journal of the Electrochemical Society vol 114 no 12 pp 1215-1221 Dec 1967
[82] US DOE (Mar 2011) Oxide Dispersion-Strengthened Alloys - Fossil Energy [Online] httpfossilenergygovinteraationalPublicationsDECC_task_08_US_2pagepdf
[83] C Moore Private Communication Mar 2011
125
[84] C Moore PVECalc-3786 unpublished
[85] A Schuegraf Preliminary Heating Characteristics of IN-625 Pressure Vessel unpublished
[86] JR Farr MH Jawad Guidebook for the Design ofASME Section VIII Pressure Vessels 2nd ed New York NY ASME Press 2001
[87] (Mar 2011) Oceaneering - Graylocreg Products [Online] http wwwoceaneeringcomoceandocumentsbrochuressubseaproductsGRLC20-20The20Ultimate20Connectorpdf
[88] SC Hydraulic Engineering Corporation (Mar 2010) GB Gas Boosters and Systems - Rev 10-15-06 [Online] httpwwwschydrauliccomdocuments GasBoosterREVl 0-15-06pdf
[89] American Petroleum Institute Sizing Selection and Installation of Pressure-Relieving Devices in Refineries Part I Washington DC API Publishing Services Jan 2000
[90] JP Holman Heat Transfer 9th ed New York NY McGraw-Hill 2002
APPENDIX A Bill of Materials
ID
V-l
V-2
V-3
U-l
V-4
FR-l
V-5
BP-1
V-6
U-2 U-3
PV-1
R-l
V-7 V-9
V-8
BD-1
F-l
PV-2
V-10
V-l l
V-12
COMPONENT DESCRIPTION
14 in tube fitting ball valve
18 in NPT normally-closed solenoid valve
14 in tube fitting three-way ball valve
Tee-type 150 urn particulate filter
12 in FNPT ball valve
34 in FNPT filter-regulator
34 in NPT normally-closed solenoid valve
Double acting two-stage gas booster pump
14 in check valve 10 psig cracking pressure
Tee-type 70 um particulate filter
14 in FNPT 300 mL sample cylinder
0 to 4000 psig SS regulator 14 in MNPT ports
14 in tube fitting high-pressure ball valve
F84-M safety valve 2370 psig set pressure
F84-M safety valve 3590 psig set pressure
34 in FNPT SFAZ-UT burst disk holder
12 in SFAZ-002 rupture disk 2560 psig burst pressure
12 in SFAZ-002 rupture disk 4266 psig burst pressure
Three-zone 1100degC split tube furnace
Three-zone furnace controller
10 in ID X 125 in wall IN-625 pressure vessel
316-SS machined blind hub
316-SS Graylocreg clamp assembly
17-4 PHSS sealing ring
14 in tube fitting X 14 in tube fitting X 14 in FNPT three-way high-pressure ball valve
18 in NPT metering valve 000005 max C v
14 in FNPT variable area flowmeter 05 to 50 std Lhr
PART NO
SS-43S4
8264G009
SS-43GXS4
SS-4TF-15
465499
B74G-6AK-QD3-RMG-FR
8210G95
GBT-1530
SS-CHS4-10
SS-4TF-7
316L-50DF4-300-PD
PR57-1F11Q2N14F
SS-83PS4
01-2183L-103SL
FS2U
UD-SFAZ-UT-00-0013-02
XST-6-0-24-3V
3-1-40-230-E15SP
3-GR20
2-12-3
GR20
SS-83XPS4
CC-A16A21APE
VAF-G1-01M-1-0
QTY
2
2
2
1
4 each
1
1
1
2
2
3
1
1
1
FITTINGS INSTRUMENTATION AND MISCELLANEOUS COMPONENTS
ID
P-01
P-03 P-04
P-05
P-06
T-01T-03 T-04 T-05 T-07 T 08 T-09 T-10
T-02 T-l l
T-06
T-12T-13
COMPONENT DESCRIPTION
14 in tube fitting X 14 in tube fitting X 14 in FNPTTee
14 in MNPTplug
14 in tube fitting X 14 in MNPT straight
34 in FNPT full flow quick-connect body
34 in FNPT full flow quick-connect stem
38 in thermoplastic hose 38 in SS MNPT
14 in tube fitting Tee
14 in tube fitting X 14 in FNPT elbow
14 in tube fitting elbow
14 in MNPT X 12 in tube adapter straight
14 in MNPT X 34 in MNPT reducer
12 in tube fitting X 34 in MNPT straight
14 in tube fitting cross
14 in tube adapter X 12 in FNPT straight
14 in tube adapter X 18 in tube fitting straight bored through
14 in tube adapter X 18 in tube fitting straight
14 in tube fitting X 18 in MNPT straight
0 to 300 psig gauge 50 mm face 14 in MNPT
0 to 6000 psig gauge 2 5 m face 14 in MNPT
0 to 6000 psig transmitter 12 in MNPT
0 to 5 psig gauge 2 5 in face 14 in MNPT
Self-adhesive K-type thermocouple
K-type single-point thermocouple probe IN-600 18 in diameter 41 in length sheath
K-type multi-point profile probe IN-600 18 m diameter 53 in length sheath
thermocouples 0 3 6 9 12 and 18 in from tip
K-type IN-600 over-braided thermocouple
K-type single-point thermocouple probe 304-SS 18 in diameter 3 in length sheath
18 in OD X 0 028 in wall SS-316316L tubing
14 m O D X 0 035in wall SS-316316L tubing
12 in O D X 0 065in wall SS-316316L tubing
14 in OD X 116 in wall vinyl tubing
12 0 ft heating cord 250 W output
PART NO
SS-400-3-4TTF
SS-4-P
SS-400-1-4
SS-QF12-B-12PF
SS-QF12-S-12PF
SS-7R6-PM6-PM6-30
SS-400-3
SS-400-8-4
SS-400-9
SS-8-TA-1-4
SS-12-HRN-4
SS-810-1-12
SS-400-4
SS-4-TA-7-8
SS-200-R-4BT
SS-200-R-4
SS-400-1-2
PGI-50M-PG300-CAOX-BG
G058113
PMP71 -WAC1W21RD AAA
33075
SA1-K-SRTC
KQIN-18U-41
EIPP6012
XCIB-K-2-1-3
KTSS-18G-3
SS-T2-S-028
SS-T4-S-035
SS-T8-S-065
LT-2-4
HTC-120
QTY
6
2
12
1
1
1
4
2
1
1
1
1
1
1
4
2
2
1
2
1
1
8
2
1
1
2
20 ft
50 ft
20 ft
10 ft
2
FITTINGS INSTRUMENTATION AND MISCELLANEOUS COMPONENTS (CONTD)
ID COMPONENT DESCRIPTION
Portable temperature controller 10 to 79degC range
38 in ID X 18 in wall elastomeric insulation
Adjustable height support stand 150 lb capacity
Alumina specimen boat assembly
Isolated input multi-channel data logger
24 VDC 600 W power supply
Hinged electrical enclosure
500 mL Erlenmeyer flask
Size 6 two-hole rubber stopper
PART NO
CN-TOT-A-175JF-120V
M06010
9967T45
GL820
S8VS-06024
R201206
FLA204
DPSSTO3032
QTY
2
24 ft
2
1
1
1
1
2
2
APPENDIX B Representative Thermal Profiles of the Pressure Vessel
700
600
U 500 --
pound 400
300 --S3 i -
a = pound 200
100
0
1 1
j bull_ bull bull p bull bull
1 1
J
1
i
bullMetal Temperature
bullFluid Temperature
-mdash bull l bull bull
1
0 025 05 075
Normalized Pressure Vessel Length
Figure B-1 Temperature distribution at 150 MPa for [685degC | 610degC | 645degC]
700
600 -
u o
S + S3 i-
o s 3
500
400
300
200
100 -
0
4 1 j|laquoPB
bullMetal Temperature
bull Fluid Temperature
bull bull
__ j j i
T - 1
- - - - -
lt bull
0 025 05 075
Normalized Pressure Vessel Length
Figure B-2 Temperature distribution at 150 MPa for [725degC | 640degC | 690degC]
800
700
G 600
1 5 0 deg 1 400
I 300 s 200
100
0
1 1 1 1 1 1
J ^
bull bull bull bull bull
bull
bull Metal Temperature
bull Fluid Temperature i
bull bull
I J [ bulllt
i i i
0 025 05 075
Normalized Pressure Vessel Length
Figure B-3 Temperature distribution at 150 MPa for [755degC | 695degC | 725degC]
U o
1
3
800
700
600
500
400 -f
S- 300
pound 200 plusmn
100
0
4 1 r bullbullbull
bullMetal Temperature
bull Fluid Temperature
bull bull bull
bull i i i bull
i i i
0 025 05 075
Normalized Pressure Vessel Length
Figure B-4 Temperature distribution at 150 MPa for [785degC | 735degC | 780degC]
131
U o o u 3 S3 s-V a E
900
800
700
600
500
400
300
200
100
0
1 bull 1 mdash 1 1 1 1
T _ _ _ bull
bullMetal Temperature
bullFluid Temperature 1
bull bull I
bull J i Lmdashbull_
bull i bull w 1 1 1
- i i i
0 025 05 075
Normalized Pressure Vessel Length
Figure B-5 Temperature distribution at 150 MPa for [800degC | 750degC | 800degC]
700
600
U 500
3 -n cs
a S pound
400
300
200
100 -
0
i
-
J laquobull MMm T-2 bent out of
- - centre and moved closer to wall
bullMetal Temperature
bullFluid Temperature
bull i i i i
bull bull __ T ____ r ^
bull _ 1 + |
bull i l l i i i i i i
i i i i i i
1 1 1
0 025 05 075
Normalized Pressure Vessel Length
Figure B-6 Temperature distribution at 250 MPa for [685degC | 610degC | 645degC]
700
600
500
400
300
200
100
0
1 1
bull
1 1
bull bull
T-2 bent out of - - centre and moved
closer to wall
i
bullMetal Temperature
bullFluid Temperature
bull i i i i i i
bull i bull i i i ^
i i i i i i i i i i i i
025 05 075
Normalized Pressure Vessel Length
Figure B-7 Temperature distribution at 250 MPa for [725degC | 640degC | 690degC]