the development and analysis of a … development and analysis of a hydraulically actuated valve for...
TRANSCRIPT

THE DEVELOPMENT AND ANALYSIS OF A HYDRAULICALLY ACTUATED VALVE FOR A
DUAL MODE TURBULENT JET IGNITION (DM-TJI) ENGINE
By
Joshua Myers
A THESIS
Submitted to
Michigan State University
in partial fulfillment of the requirements
for the degree of
Mechanical Engineering – Master of Science
2017

ABSTRACT
THE DEVELOPMENT AND ANALYSIS OF A HYDRAULICALLY ACTUATED VALVE FOR A
DUAL MODE TURBULENT JET IGNITION(DM-TJI) ENGINE
By
Joshua Myers
With the increased concern for the affect that the use of internal combustion engines has on the
environment, interest in engine technologies that can reduce the emissions has increased
significantly. One such example that is being investigated by Michigan State University is the
use of a Dual Mode Turbulent Jet Ignition (DM-TJI) to replace the use of a traditional spark
plug. A DM-TJI engine can produce a more complete burn of the fuel while also allowing for use
of leaner air–fuel mixes resulting in improved fuel economy. Controlling the intake of air into
the pre-chamber of the DM-TJI engine is extremely important for it to run properly since
controlling the intake of air allows for purging and management of the strength of the ignition
jets. To achieve this, a valve that is capable of operating at the speeds necessary to allow for the
proper amount of air to enter the prechamber, has been designed and is under final fabrication.
The purpose of this thesis is a proof of concept experiment and analysis. Areas of improvement
have been identified and once viable modifications have been recommended.

iii
ACKNOWLEDGEMENTS
I would like to thank several people:
My parents, Alan and Jenni, for supporting me and encouraging me to pursue my goals.
Dr. Harold Schock, my advisor, for his financial support that allowed me to pursue my degree,
and for making this project possible for me to work on, and for letting me work at the MSU
Engine Research Lab.
Dr. Zhu and Dr. Jaberi for being on my advisory committee.
Tom Stuecken for his work in designing and building the setup and for helping with the editing
of this thesis.
Craig Gunn for helping edit this thesis.
The staff and students of the Engine Research Laboratory, including Brian Rowley, Brian
Diemling, Ruitao Song, and Ravi Vedula for helping me on several occasions to keep the
experiments on track.
iv
TABLE OF CONTENTS
LIST OF TABLES .......................................................................................................................... v
LIST OF FIGURES ....................................................................................................................... vi
CHAPTER 1 ................................................................................................................................... 1
Introduction ..................................................................................................................................... 1
1.1 Motivation ............................................................................................................................. 1
1.2 Introduction to Camless Valve Operation ............................................................................. 2
1.3 Previous Work ....................................................................................................................... 3
CHAPTER 2 ................................................................................................................................... 6
Experimental Setup and Procedure ................................................................................................. 6
2.1 Major Equipment................................................................................................................... 6
2.1.1 Hydraulic Pump ............................................................................................................. 6
2.1.2 Hydraulic Accumulator ................................................................................................. 7
2.1.3 Control Valve ................................................................................................................ 8
2.1.4 Piston, Retainers, Spring, and Poppet Valve ................................................................. 9
2.1.5 Assemblies ................................................................................................................... 10
2.1.6 Instrumentation ............................................................................................................ 11
2.2. Testing Procedures ............................................................................................................. 12
CHAPTER 3 ................................................................................................................................. 15
Proof of Concept Testing .............................................................................................................. 15
3.1 Initial Testing ...................................................................................................................... 15
3.2 Endurance Test .................................................................................................................... 19
3.3 Testing With New Return Spring ........................................................................................ 20
CHAPTER 4 ................................................................................................................................. 24
Simulation ..................................................................................................................................... 24
4.1 Baseline Model .................................................................................................................... 24
4.2 Valve Modification ............................................................................................................. 27
CHAPTER 5 ................................................................................................................................. 36
Summary and Conclusions ........................................................................................................... 36
CHAPTER 6 ................................................................................................................................. 37
Recommendations ......................................................................................................................... 37
REFERENCES ............................................................................................................................. 38

v
LIST OF TABLES
Table 1: Port configurations and what effect they had on the system .......................................... 29

vi
LIST OF FIGURES
Figure 1: Hydraulic pump and hoses .............................................................................................. 6
Figure 2: Hydraulic oil accumulator ............................................................................................... 7
Figure 3: Sturman control valve ..................................................................................................... 8
Figure 4: Piston, retainers, spring, and piston shown in exploded view ......................................... 9
Figure 5: Lower Assembly............................................................................................................ 10
Figure 6: Exploded view of complete assembly ........................................................................... 10
Figure 7: Laser sensor placement ................................................................................................. 11
Figure 8: CAS user interface......................................................................................................... 12
Figure 9: Cycle profile for 1500 rpm and 135-degree duration .................................................... 16
Figure 10: Cycle variation for 1500 rpm and 135-degree duration profile................................... 16
Figure 11: Cycle variation for 1500 rpm and 135-degree duration for new accumulator placement
....................................................................................................................................................... 18
Figure 12: Cycle profile for 1500 rpm and 135-degree duration with pressurized air supply ...... 18
Figure 13: Cycle variation for pressurized air supply case ........................................................... 19
Figure 14: Cycle profiles for 1500 rpm and 135 degrees of duration for old and new preload of
449 N ............................................................................................................................................. 21
Figure 15: Cycle profiles for 1500 rpm and 135 degrees of duration for old and new preload of
627 N ............................................................................................................................................. 22
Figure 16: Baseline model component diagram ........................................................................... 25
Figure 17: Opening and closing profiles of physical tests versus the simulation ......................... 26
Figure 18: Ported cylinder model component diagram................................................................. 28
Figure 19: System pressure of ported vs non-ported cylinder ...................................................... 30
Figure 20: Modified piston component diagram .......................................................................... 32
Figure 21: Modified piston closing profiles.................................................................................. 33

vii
Figure 22: Modified piston ........................................................................................................... 35

1
CHAPTER 1
Introduction
1.1 Motivation
With the increased concern for the affect that the use of internal combustion engines has on the
environment, interest in engine technologies that can reduce the emissions has increased
significantly. One such example that is being investigated by Michigan State University (MSU)
is the use of a Dual Mode Turbulent Jet Ignition (DM-TJI) to replace the use of a traditional
spark plug. A DM-TJI engine can produce a more complete burn of the fuel while also allowing
for use of leaner air–fuel mixes resulting in improved fuel economy. Controlling the intake of air
into the pre-chamber of the DM-TJI engine is extremely important for it to run properly since
controlling the intake of air allows for purging and management of the strength of the ignition
jets. Currently, in the MSU research engine a modified fuel injector handles the intake of air into
the pre-chamber from a high-pressure supply, which is required due to the high loss of pressure
across the injector. A problem arises every so often in that the injector must be periodically
lubricated by disconnecting the compressed-air line and feeding a small amount of gasoline
through the injector to avoid a degradation in the performance of the injector.
To bypass the need for periodic lubrication and the need for a higher supply pressure, an
alternative intake valve design utilizing hydraulics and powerful return springs to open and close
the valve both quickly and consistently is needed. Ultimately, the goal is to determine the crank
angle positions at which the valve needs to be opened and closed so that a camshaft profile can
be designed to operate the valve at the most optimal points.

2
1.2 Introduction to Camless Valve Operation
Traditionally, engines have relied on a camshaft system for controlling the opening and closing
of the intake and exhaust valve. This system results in the time at which the valves open and
close to be fixed based on the lobe profile on the camshaft; and while there are systems that
allow for some flexibility on when this cycle starts or stops only, so much can be done with a
fixed profile cam. Systems like a Delphi cam phaser [10], which allows the cam lobe angular
position through the use of a module mounted to camshaft in place the regular cam pulley, are
one such example of systems that allow for some flexibility. Another alternative is the use of a
variable lift system such as that also made by Delphi [11] which allows the changing of the
duration and lift of the valve along with the timing with a cam with three lobes an a valve rocker
arm that can change lift modes for different lobes. However, even with these options there is still
the constraint of the camshaft with fixed lobe position. Thus, a compromise must be made on
how well the engine will perform versus how efficient it will be when a camshaft is used.
Therefore, alternatives to the traditional cam-driven system have to be developed to overcome
this limitation. Two have come to be the predominant driving methods. First are
electromechanical driven systems. These use either one of two drivers; one is a traditional
electric motor connected to a cam mechanism, which drives the poppet valve. The other is a
direct magnetic drive that uses armature coils to control the magnetic force via flow of current
through the system.This also allows the system to be operated without the traditional return
spring normally seen on engine valves as demonstrated by Braune and Liu [8]. In either of these
cases, the system is capable of opening the valve to a desired lift while being able to control how
hard the valve lands on closing. One drawback to using these systems is that they require a
higher operating voltage than what is traditionally seen on road-going vehicles today. The system

3
having to be transitioned away from 12 volts to 48 volts [12] to operate the electric motors
required for these systems to function properly.
The second option is electro-hydraulically driven systems. For these systems, a high-pressure
hydraulic oil is what actuates the poppet valve open while a spring is used to close the valve. An
electrically controlled valve is used to determine if the oil is being supplied to open the poppet
valve or draining oil to allow the poppet valve to close. Ideally, this system is able to operate by
using the already present engine oil to avoid the need to have two separate oil reserves for
operation. This system requires a means of accumulating oil to in a reserve in order to smooth
out any possible fluctuations that could occur from the main oil supply. The other requirement is
a pump to supply the pressure needed to operate the system. This pump can driven by the engine
and disconnected as needed to reduce its draw of power from the system.
1.3 Previous Work
Before looking at the possibilities of the using a hydraulic system to operate the valve it was
important to look at what systems have been created using similar mechanisms for controlling
the opening and closing of the poppet valves with the primary types being electromechanical and
electrohydraulic.
One of the main examples of electrohydraulic actuators for intake valves is the work that was
done by Lotus in 2002 [3, 6] for research engines. This system utilized a double-acting piston for
the controlling of the position of the intake/exhaust valve with a linear displacement transducer
to determine the position. From this, a production system that utilized a return spring instead of
hydraulic force for closing and a two-stage valve system for the opening of the valve. The first
valve controlled the supply of pressure, thus the opening signal, and a proportional valve

4
controlled the opening and closing speed. With this configuration, they were able to have
response times of 2 ms for open and close with a lift of 10 mm of the valve while still
maintaining a soft-landing speed of 0.1 m/s. Unfortunately, for a 4-cylinder, 16-valve engine the
cost to implement this system was $1245, which can be prohibitive; but it demonstrated the
potential.
Similar systems to that of Lotus have been shown by Denger and Mischker[5], and Lou, Z.,
Wen, S., Qian, J. Xu, H et al. [7] showing similar levels of performance with the Denger and
Mischker design having two production models, while the Wen et al. system is currently still
under development. Denger and Mischker’s [5] system demonstrated open and close times of
about 4.0 ms for a 10 mm lift while having a landing velocity of 0.5 m/s via a hydraulic brake
system. The Lou, Z., Wen, S., Qian, J. Xu, H et al. [7] system had an opening time of 3.34 ms
and closing time of 2.56 ms with a landing velocity of 0.21 m/s for a 8 mm lift. They also had a
lift of 2.2 mm with an opening time of 2.33 ms and a closing time of 5.31 ms with a closing
velocity 0.12 m/s. For their system, they achieved a soft landing by closing the control valve
before landing and having the remaining oil being forced through a throttling orifice located at
the top of the actuator assembly. Sturman Industries [4] also has a production hydraulically
driven valve system that is being considered for use in diesel engines, which is part of the
inspiration for the design of the system detailed in this paper. However, there are currently no
performance specifications publically available for this system beyond the patent information.
Alternatively, the use of electromagnetic based systems has also been explored by of Henry and
Leqesne [2], Parlikaret et al [1], and Braune and Liu [8]. The Henry and Leqesne [2] system
utilized a electric motor connected to a cam lobe that operated a traditional poppet valve-return
spring assembly. The system was capable of a wide variety of lifts ranging from 2 mm to 11 mm

5
with durations ranging from 10 to 40 ms of duration. For each different profile to time it takes
for the valve to open it is equal to half the total duration of the profile thus the fastest response
was 5 ms for a 2 mm lift case. A similar system was developed by Parlikaret et al. [1] using an
electric motor to drive a disk with a profile track and a follower to control the lift of the valve. In
this configuration the system was able to achieve an opening time of 3.5 ms with a lift of 5 mm.
The system by Braune and Liu [8] utilized a direct-magnetic drive with a linear reluctance drive
in lieu of a more conventional electric motor. With this configuration, they were able to achieve
a response time of roughly 10 ms for 9 mm of lift for open and close. One caveat to this system,
though, is that they noted some degradation in the performance of the system as the temperature
increased.
There is a third alternative to the hydraulically and electrically driven systems, which is a
pneumatically based one, however, this type of actuator is less common. The primary example of
this type of actuator is the Cargine Free Valve Actuator [9], which is capable of an opening time
of 2.5 ms and close of 2.6 ms for a maximum lift of 13 mm. The system operating pressure
ranges from 3 bar to 16 bar which results in an operating power consumption of 1.2 Kw per
cycle.

6
CHAPTER 2
Experimental Setup and Procedure
2.1 Major Equipment
Descriptions of the experimental components will be listed separate to avoid interrupting
the procedure with these details.
2.1.1 Hydraulic Pump
The test stand is comprised of a hydraulic pump/tank combination with an electric motor rated at
one and a half horsepower that has a swept displacement of 1.57 cubic centimeters per
revolution. The pump during normal operation operates at 1725 revolutions per minute shown in
figure 1. The regulating valve on the tank, which for the primary operation experiments was set
to 17237 kPa (2500 psi), regulates the system’s operating pressure.
Figure 1: Hydraulic pump and hoses
7
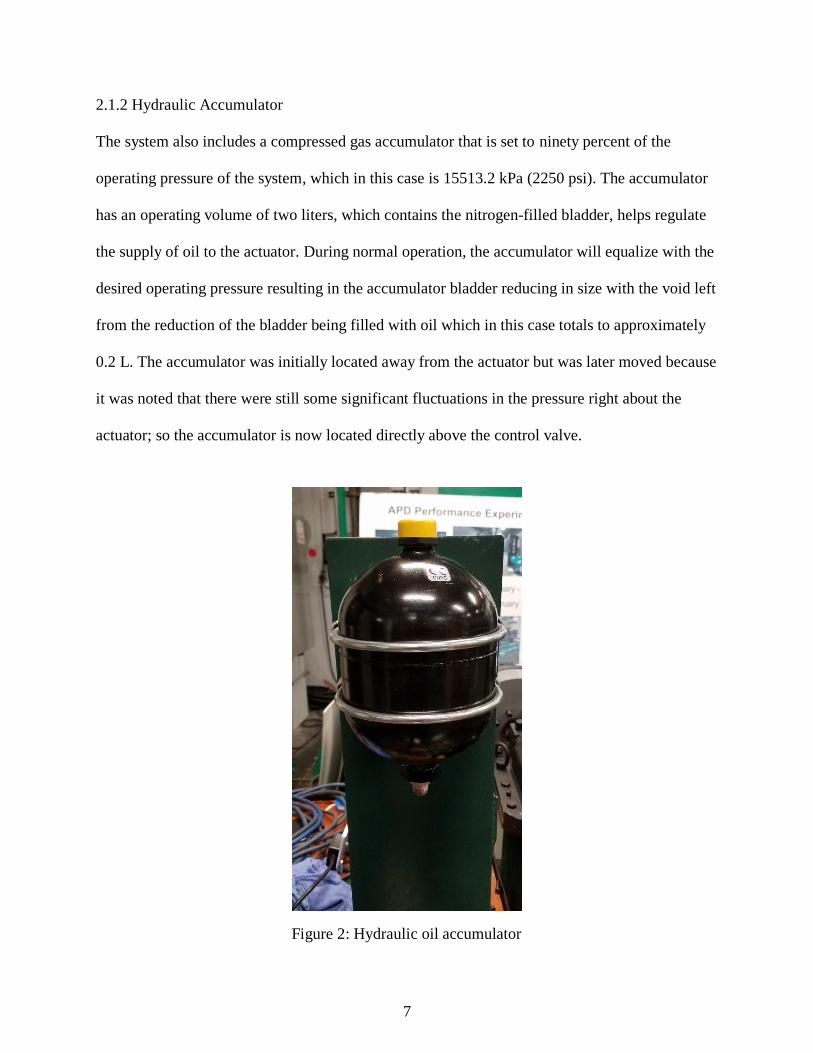
2.1.2 Hydraulic Accumulator
The system also includes a compressed gas accumulator that is set to ninety percent of the
operating pressure of the system, which in this case is 15513.2 kPa (2250 psi). The accumulator
has an operating volume of two liters, which contains the nitrogen-filled bladder, helps regulate
the supply of oil to the actuator. During normal operation, the accumulator will equalize with the
desired operating pressure resulting in the accumulator bladder reducing in size with the void left
from the reduction of the bladder being filled with oil which in this case totals to approximately
0.2 L. The accumulator was initially located away from the actuator but was later moved because
it was noted that there were still some significant fluctuations in the pressure right about the
actuator; so the accumulator is now located directly above the control valve.
Figure 2: Hydraulic oil accumulator

8
2.1.3 Control Valve
A Sturman G 2.8 two-position valve controls the flow to and from the actuator, which along with
the initial piston and the housing were obtained from the internal components of an International
fuel injector used by Ford in its 6.0-liter diesel engines from 2004 to 2010. The spool-valve has a
response time of 600 microseconds for opening and a closing time of 500 microseconds.
Unfortunately, the flow characteristics of the valve were not made available, and during the
initial testing no data was recorded on what the flow values were. Instead, they can be inferred
by opening time of the poppet valve in the context of the actuator piston area and the lift of the
valve. By using some basic hydraulic equations based on the stroke of the piston, the area of the
piston face, and the time required for the stroke, the average flow was determined to be around
37.85 liters per minute.
Figure 3: Sturman control valve
9
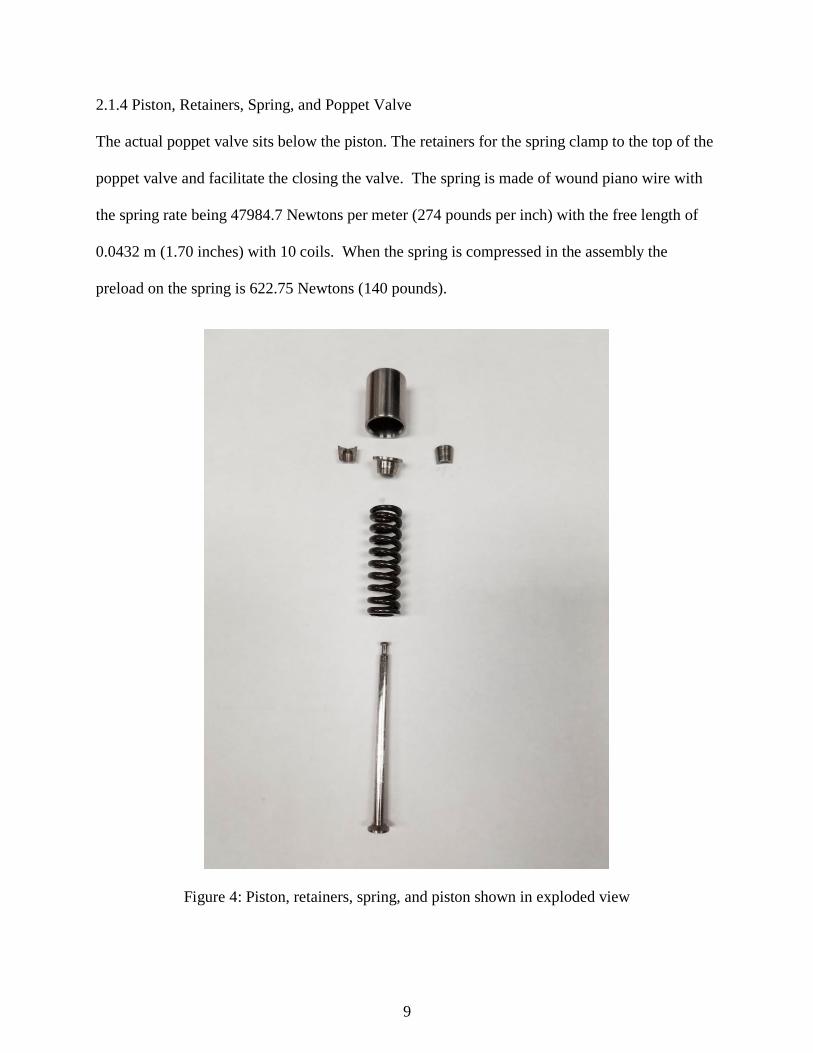
2.1.4 Piston, Retainers, Spring, and Poppet Valve
The actual poppet valve sits below the piston. The retainers for the spring clamp to the top of the
poppet valve and facilitate the closing the valve. The spring is made of wound piano wire with
the spring rate being 47984.7 Newtons per meter (274 pounds per inch) with the free length of
0.0432 m (1.70 inches) with 10 coils. When the spring is compressed in the assembly the
preload on the spring is 622.75 Newtons (140 pounds).
Figure 4: Piston, retainers, spring, and piston shown in exploded view
10
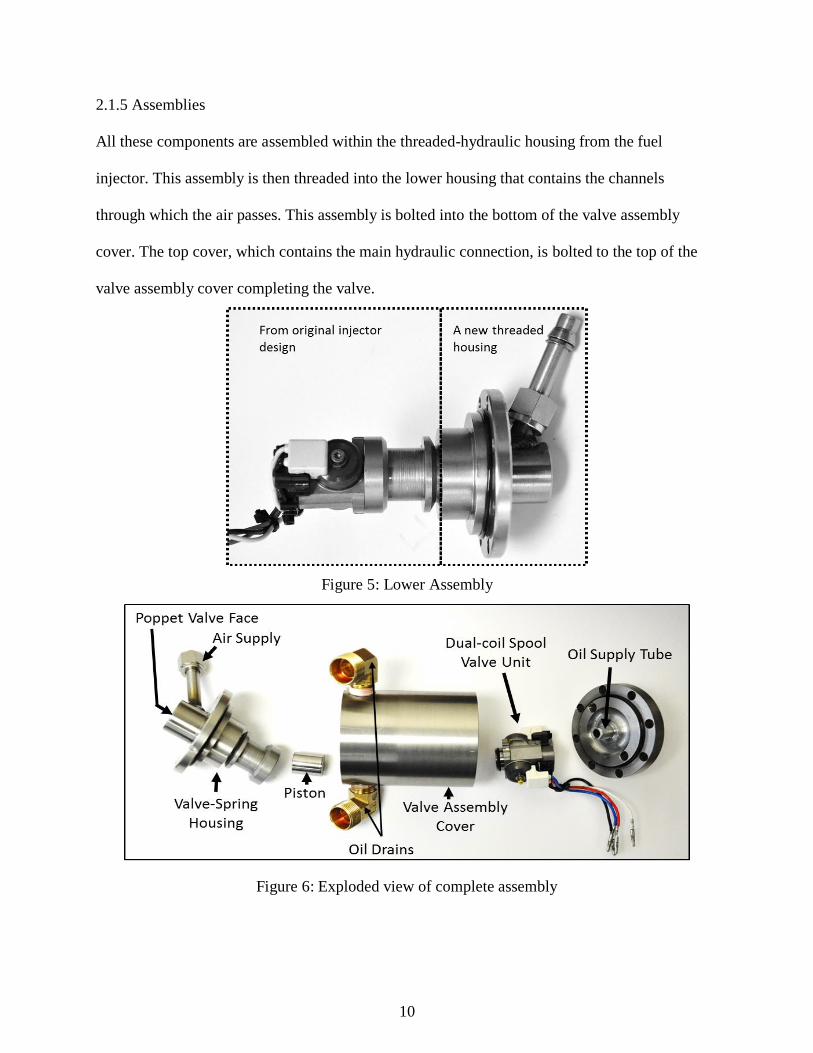
2.1.5 Assemblies
All these components are assembled within the threaded-hydraulic housing from the fuel
injector. This assembly is then threaded into the lower housing that contains the channels
through which the air passes. This assembly is bolted into the bottom of the valve assembly
cover. The top cover, which contains the main hydraulic connection, is bolted to the top of the
valve assembly cover completing the valve.
Figure 5: Lower Assembly
Figure 6: Exploded view of complete assembly

11
2.1.6 Instrumentation
To measure the displacement of the valve, a Micro-Epsilon optical distance LD1607-20
displacement sensor with a response frequency of 15 kHz was mounted below the valve. The
laser is center on the face of the valve to ensure consistent measurement quality with the initial
mounting system being connected directly to the body of the valve. The mount was later
connected to the system stand to reduce the amount of vibration that the sensor was experiencing
thus improving the consistency of the readings. In order to ensure that the strength of the
reflected laser was strong enough to provide satisfactory results the face is coated with white
paint to improve its reflectivity to ensure a strong reflected signal for the sensor to measure. The
laser-based displacement sensor was chosen to allow for the displacement to be measured while
not requiring direct contact with the valve. The response time of the sensor is fast enough to
allow for accurate recording of the displacement of the valve.
Figure 7: Laser sensor placement

12
The signal from the displacement sensor along with the triggering signals for both open and
close were recorded by a computer using A&D Technologies Combustion Analysis System (CAS).
This program is capable of interfacing with the displacement sensor and exporting the recorded
data to allow for post processing of the results. CAS also allows for initial analysis of the results
to determine if the test proved fruitful. For the recording of the valve performance the sampling
frequency was set to 10 kHz in order to capture the opening and closing profiles as well as the
opening and closing commands.
2.2. Testing Procedures
The following describes the testing procedure for the response profiles of the valve system. For
the testing of the displacement time of the valve the pump is started before the rest of the system
to ensure that the system lines are completely filled with hydraulic oil. Especially if the system
Figure 8: CAS user interface
13
has been sitting for more than two hours. The drain valve is left open so the oils flowing through
the system but at this stage it will not build pressure. Next, the switching valve is activated while
the drain valve is slowly shut so the system slowly begins to build pressure while actuating the
valve. The reason for starting the system with no pressure and slowly raising the pressure to the
desire operating point is to avoid inducing any unnecessary shock to the system. For this whole
period the CAS system is recording the trigger and displacement signal showing the increase in
the displacement as the operating pressure is reached.
After the test has been completed, the switching valve and the pump are turned off before the
system pressure is relieved in order to leave some oil in the switching valve to prevent it from
running dry. Now with the valve deactivated the drain valve is opened so that any remaining
pressure in the system will not force oil through the filter in the reverse direction. This is to
prevent any particulate trapped in the filter being reintroduced to the system.
For endurance testing the starting procedure is the same as the displacement tests; but for these
test the displacement sensor is removed from the test stand because one possible result of this
testing is failure of the valve assembly, which could damage to the displacement sensor if it is
left on the test stand. Once the valve is operating, the system is left to run for at least thirty
minutes up to two hours. During the tests the temperature of the oil reservoir is taken to ensure
that is not going beyond the recommended operating temperature of the oil and that the change in
viscosity of the oil is not too extreme. The pressure is also observed during the test to ensure the
system is maintaining pressure. If, for some reason, there is an extreme loss of pressure in the
system; the test is halted and the stand is investigated for damage to determine if it is possible to
restart the endurance testing. Once the test has concluded, the system is shut down in the same
order as the displacement test.

14
If minor failure occurs such as one of the internal fasteners failing, the test will be continued as
long as the system is still functional and it does not appear that any further operation may result
in damage that is more significant to the system. Once the test has been concluded, the system is
disassembled to inspect for any damage that may not have been visible during the test. During
the inspection period if failed parts are discovered, they are examined to determine the cause of
the failure and then replaced.
15
CHAPTER 3
Proof of Concept Testing
Experiments were conducted to determine if the valve would be capable of being both fast
enough to operate at the speeds seen of an operating engine and having the consistent lift
required to ensure that any desired controls input to the valve will yield proper lift and closing
profiles
3.1 Initial Testing
For the initial testing of the system the accumulator was placed further upstream of the valve
with an inline filter placed just before the fittings for the top of the valve. An analog pressure
gauge placed on top of the valve for a quick visual inspection of the pressure while the system is
operating. Inside the spring used had a spring constant of 49911 Newton/meter (285 lbf/in) with
a preload of 378 Newtons (85 lbf). For these tests, the valve was allowed to open to 2.5 mm over
an operating period equivalent to between 130 to 180 crank angle degrees for operating speeds of
1500 or 3000 rpm for the purposes of this paper most of the examples will be shown at 1500
rpm. For these tests, the operating period lasted for ten minutes or less since the focus was the
determination of the opening and close times of this configuration and the amount of variation of
the opening and close times there was.
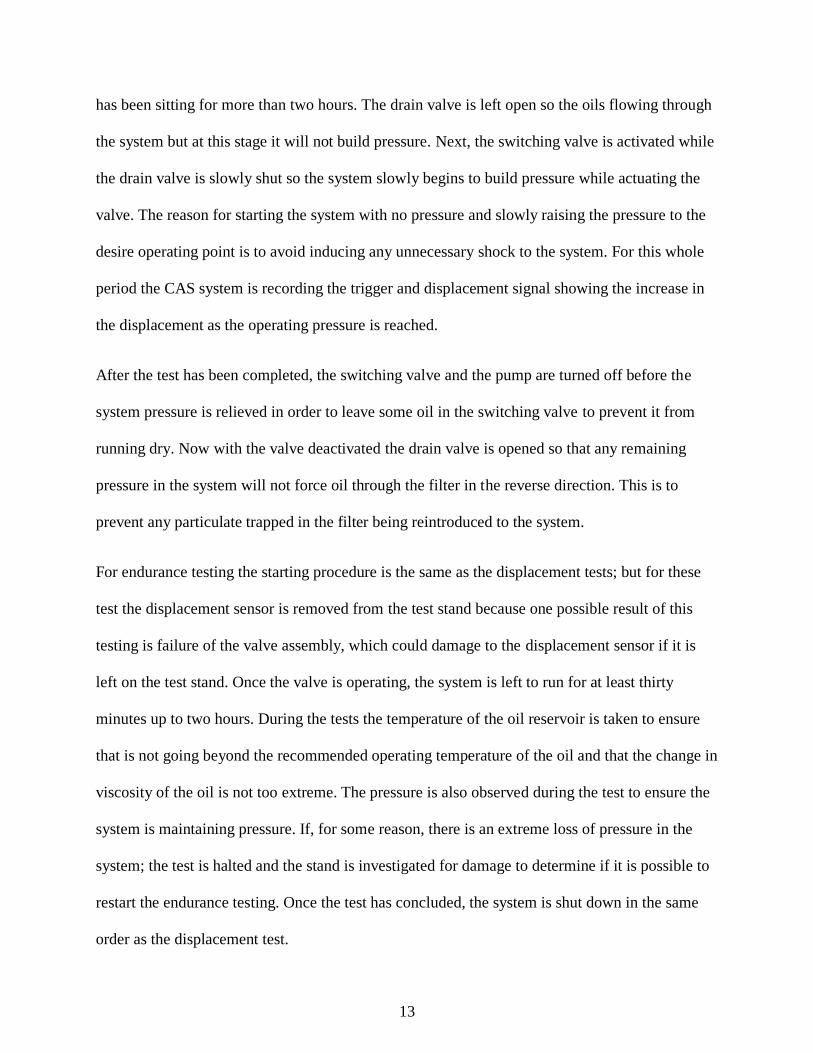
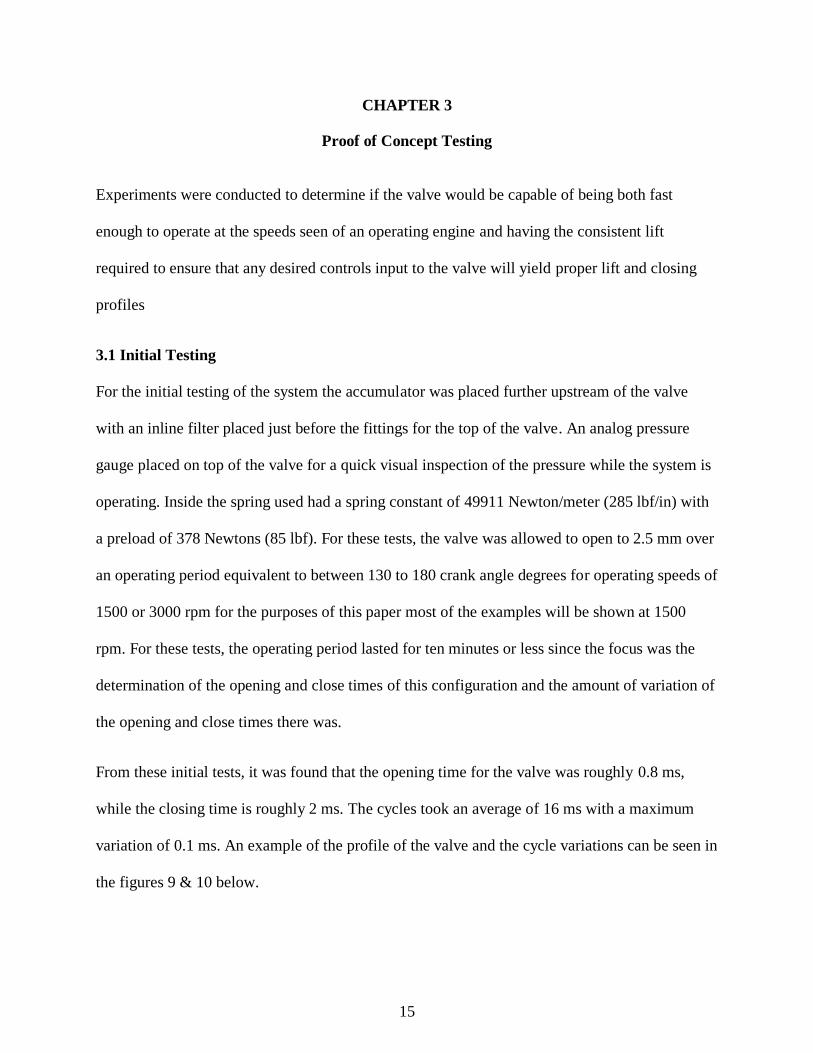
From these initial tests, it was found that the opening time for the valve was roughly 0.8 ms,
while the closing time is roughly 2 ms. The cycles took an average of 16 ms with a maximum
variation of 0.1 ms. An example of the profile of the valve and the cycle variations can be seen in
the figures 9 & 10 below.
16
Figure 10: Cycle variation for 1500 rpm and 135-degree duration profile
Figure 9: Cycle profile for 1500 rpm and 135-degree duration

17
As can be seen in the figures these initial results proved promising for the potential of the valve
for operating at the speeds necessary for controlling the intake of air into the pre-chamber. These
results also proved that for the closing at least a significant amount of improvement in the
closing time of the valve since it is contributing the majority of the time of the transitions of the
valve. The other concern revealed by these results is the number of cycles that took extra time for
cycle since part of the requirement of the valve was that it was consistent enough to be able to
program the controls for thus this variation needed to be addressed. The large overshoot that can
be seen in the opening profile in figure 9 of the valve from the poppet valve separating from the
piston raised some concern. Ultimately, it was determined that the poppet valve separation was
not significantly affecting the operation of the valve so no action to remove it was taken.
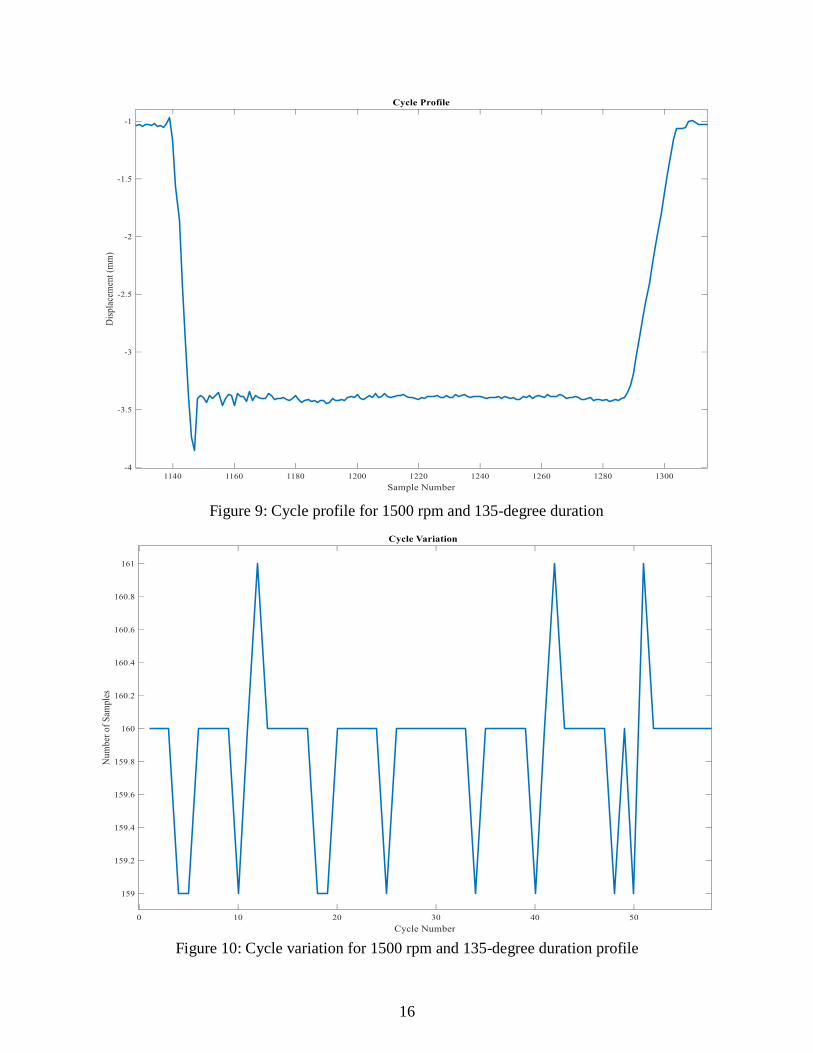
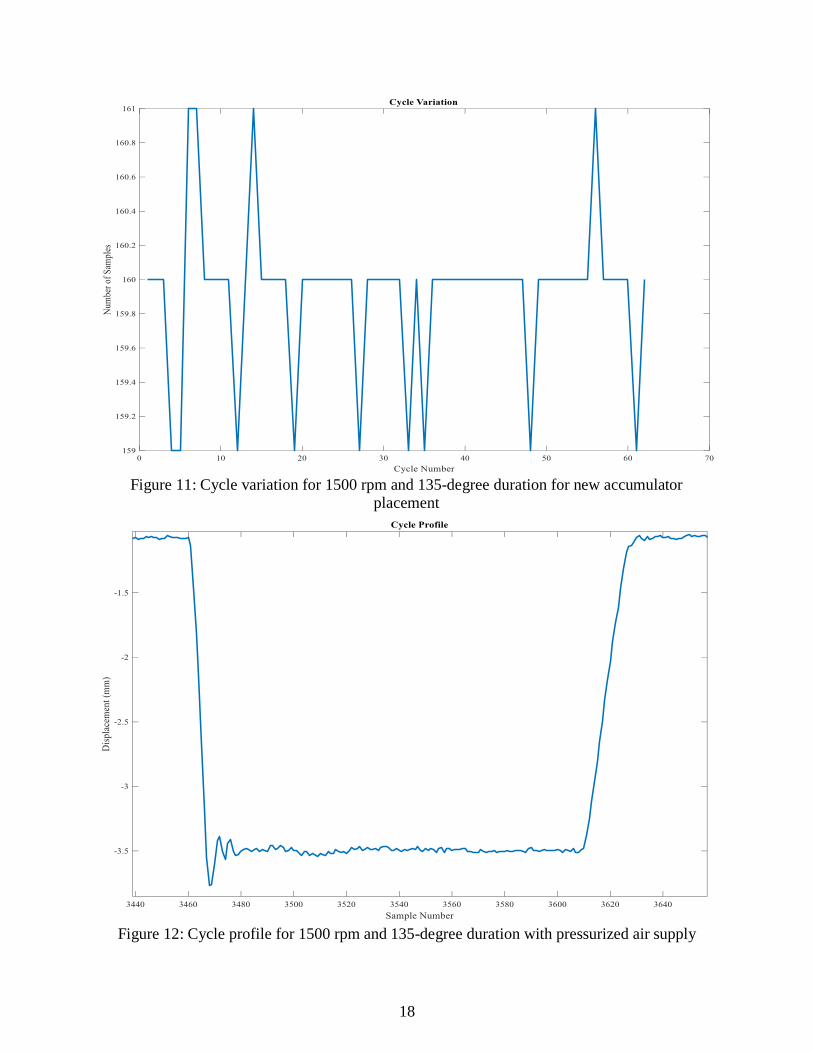
To address the variation the accumulator was moved to directly above the valve so that it would
see any fluctuation in the flow to the valve much sooner without the filter interfering. The spring
was replaced for these tests due to the spring collapsing from the previous testing, which needed
to be addressed but for these tests a new set of springs had not yet been sourced so a replacement
with the same characteristics was used for these tests. For these tests the opening and closing
times remained the same as before since neither the pressure nor the spring was changed. During
this set of tests the system was also tested with the boosted intake pressure connection in order to
determine if there would be a significant change the in the behavior of the system with the
introduction of pressurized air for the valve to control. The variation results for both the
unpressurized and pressurized tests are shown below along with an example of the profile for the
pressurized case.
18
Figure 11: Cycle variation for 1500 rpm and 135-degree duration for new accumulator placement
Figure 12: Cycle profile for 1500 rpm and 135-degree duration with pressurized air supply

19
As can be seen in figure 13, the variation in the cycles was reduced some by placing the
accumulator above the valve. The addition of the pressurized air supply did add some extra
variation and duration to the cycles due to the variable amount of resistance that the air flow
added but with the maximum variation remaining at 0.1 ms the system would still be viable for a
boosted intake.
3.2 Endurance Test
Once the profile tests were concluded the current spring the system was tested for durability.
This required the system be operated for an extended period and then be taken apart to determine
if there are any areas that could be prone to high amounts of wear. The total period that the valve
was run for was roughly two hours. During that period, the oil temperature was monitored with a
hand-held thermometer using a K-type thermal probe. The maximum temperature indicated was
Figure 13: Cycle variation for pressurized air supply case
20
74 degrees Celsius which is well within the manufacturer’s recommended operating temperature
of 91 degrees Celsius
During the test the valve housing started to leak oil out of the ports in the lid of the housing. It
continued to do so for the rest of the test with it getting progressively worse as the hydraulic oil
warmed and became less viscous. Once the system started to leak oil the system started to lose
pressure until it leveled out at 11032 kPa (1600 psi) where it remained for the rest of the test.
Once the test was concluded, the valve was taken apart to inspect for any damage internally. It
was found that one of the bolts that held the control valve to the actuation cylinder had failed just
below the head during the test, which lead to the oil coming from the housing of the valve
system. To remedy this for future testing new bolts with greater strength were installed and
subsequently tested showing no signs of failure. Otherwise, the internals of the valve system did
not show any significant signs of wear from the test with the exception of some noticeable wear
marks at the bottom of the actuation cylinder where the piston reaching its end of travel.
3.3 Testing With New Return Spring
After the durability testing had concluded a new return spring had been acquired and replaced
the spring that had been previously used. The new spring has a spring rate of 47984.7 N/m (274
lbf/in). The initial testing with this spring was done with the spring having a preload of 449.27 N
(101 lbf). With this new spring installed the system’s closing time was reduced from 2 ms to
roughly 1.7 ms. The new spring also lead to a reduction in the overshoot seen in earlier versions f
21
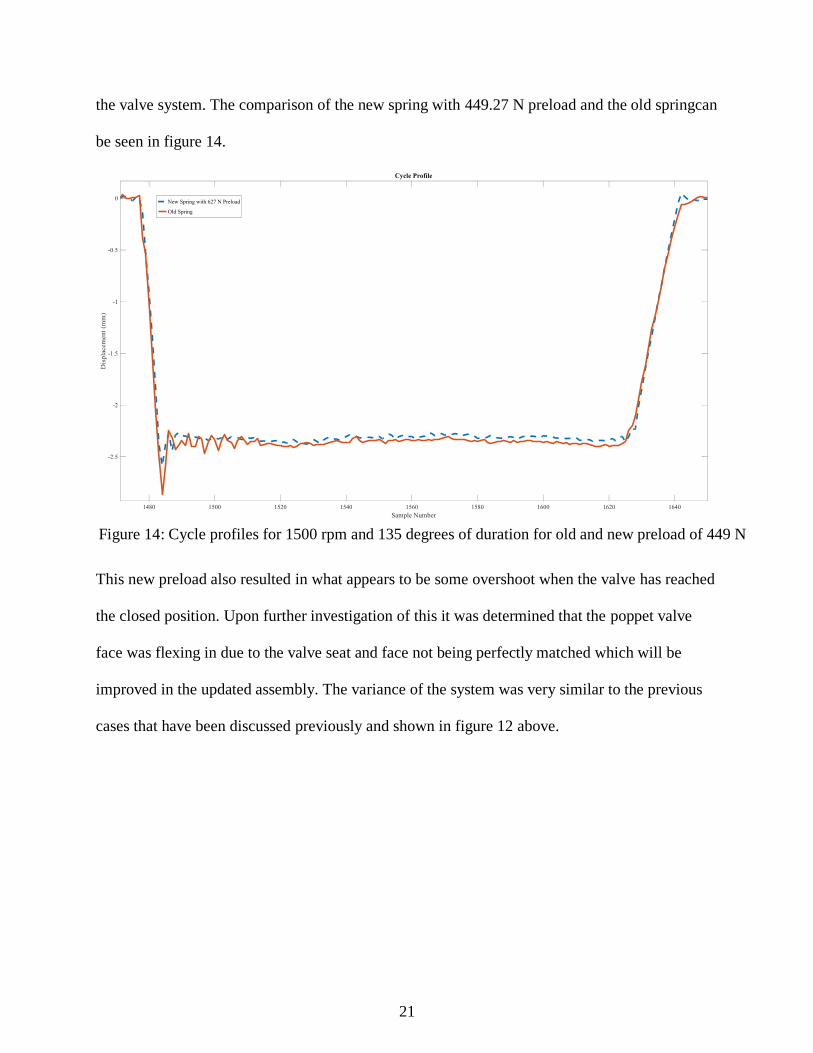
the valve system. The comparison of the new spring with 449.27 N preload and the old springcan
be seen in figure 14.
This new preload also resulted in what appears to be some overshoot when the valve has reached
the closed position. Upon further investigation of this it was determined that the poppet valve
face was flexing in due to the valve seat and face not being perfectly matched which will be
improved in the updated assembly. The variance of the system was very similar to the previous
cases that have been discussed previously and shown in figure 12 above.
Figure 14: Cycle profiles for 1500 rpm and 135 degrees of duration for old and new preload of 449 N

22
In an attempt to further reduce the closing time of the valve the preload of the spring was raised
to 627 N (140 lbf). With this increase in the preload the closing time of the valve was brought
down to 1.5 ms. The over travel of the poppet valve was also further reduced by the increase in
preload as show in figure 15 below.
This result proved promising so we looked into increasing the preload even further. However,
any attempt to reduce the closing time by increasing the preload proved to be impractical for the
assembly of the valve. This due to spring having to be compressed to allow the retainer to be
installed and increasing the preload further resulted in the coils of the spring clashing when the
retainer was being installed.
Figure 15: Cycle profiles for 1500 rpm and 135 degrees of duration for old and new preload of 627 N

23
With opening and closing times brought to their most feasible minimums some consideration for
improving the long-term operation of the valve system. One point of concern is the power
consumption associated with this system based on the operating parameter of 17236.89 kPa the
opening power requirement is close to 12.2 kW. Since this system will be only used for
determining the profile for a camshaft that would be used in the engine long term, thus this issue
can be tolerated for research but would be excessive for a production system. The other concern
was the landing velocity of the poppet valve due to the velocity being close to 2 m/s at close
while the maximum seating velocity that is generally suggested is 0.5 m/s. To try to address
these along with some other it was decided to try and model the system to test modifications
without make any physical changes that will be discussed in the next chapter.
24
CHAPTER 4
Simulation
4.1 Baseline Model
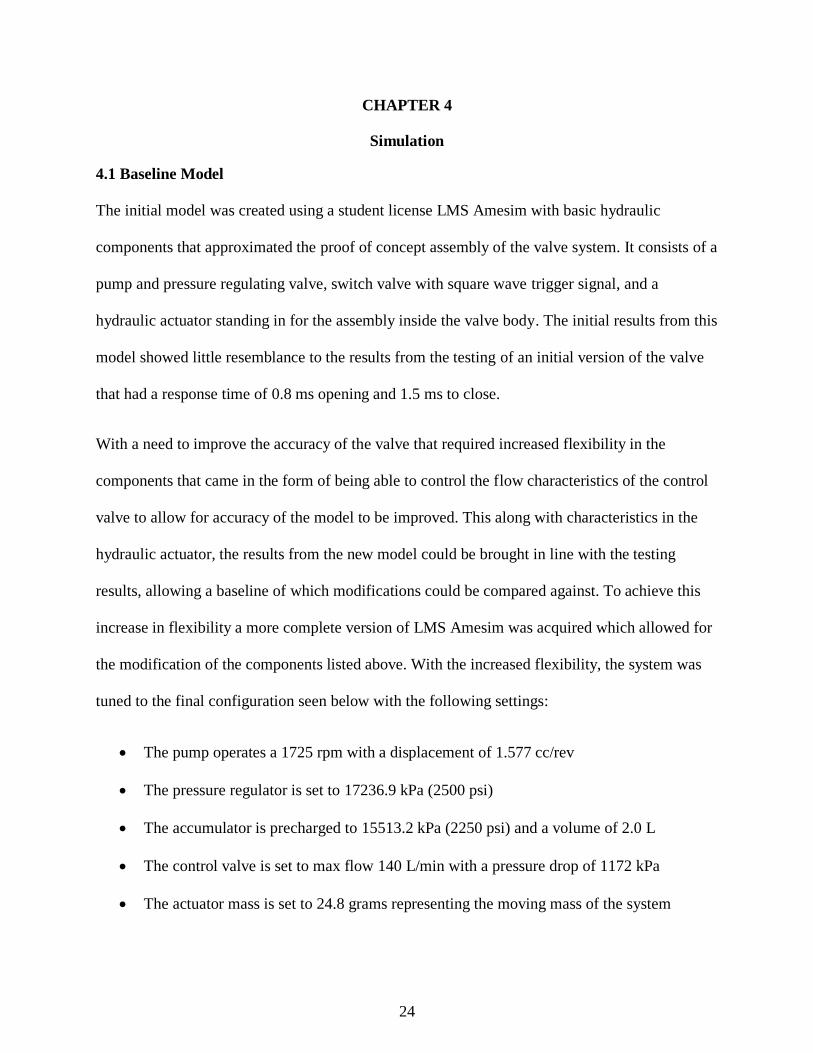
The initial model was created using a student license LMS Amesim with basic hydraulic
components that approximated the proof of concept assembly of the valve system. It consists of a
pump and pressure regulating valve, switch valve with square wave trigger signal, and a
hydraulic actuator standing in for the assembly inside the valve body. The initial results from this
model showed little resemblance to the results from the testing of an initial version of the valve
that had a response time of 0.8 ms opening and 1.5 ms to close.
With a need to improve the accuracy of the valve that required increased flexibility in the
components that came in the form of being able to control the flow characteristics of the control
valve to allow for accuracy of the model to be improved. This along with characteristics in the
hydraulic actuator, the results from the new model could be brought in line with the testing
results, allowing a baseline of which modifications could be compared against. To achieve this
increase in flexibility a more complete version of LMS Amesim was acquired which allowed for
the modification of the components listed above. With the increased flexibility, the system was
tuned to the final configuration seen below with the following settings:
The pump operates a 1725 rpm with a displacement of 1.577 cc/rev
The pressure regulator is set to 17236.9 kPa (2500 psi)
The accumulator is precharged to 15513.2 kPa (2250 psi) and a volume of 2.0 L
The control valve is set to max flow 140 L/min with a pressure drop of 1172 kPa
The actuator mass is set to 24.8 grams representing the moving mass of the system

25
The hydraulic actuator spring is set to 627 N (140 lbf) preload with a 47985 N/m (274
lb/in) spring rate
The friction characteristics are set to 334 N (75 lbf) for the stiction and Coulomb friction
and the viscous friction is set to 95 N/(m/s)
The leakage past the piston was set to 0.1 L/min/bar
The modification of the control valve flow rate allowed control of the opening profile since the
dominate force in the opening profile was the pressure and flow rate of the hydraulic fluid. For
the closing profile, the friction characteristics were the primary factors in the shaping of the
profile when the spring preload and rate were at a set point; and for this model these were set by
the final iteration of the proof of concept design.
Figure 16: Baseline model component diagram

26
Tuning of the aforementioned characteristics in the system allowed for bringing the model’s
profile output in line with the recorded profile from proof of concept testing. This allows for a
baseline from which any proposed modifications in the model would be compared to determine
their efficacy.
-3.5
-3
-2.5
-2
-1.5
-1
-0.5
0
0 0.0005 0.001 0.0015 0.002
Dis
pla
cem
ent
(mm
)
Time (s)
Opening Profile
Simulation
Measured
Max Difference .24mm
-3.5
-3
-2.5
-2
-1.5
-1
-0.5
0
0 0.0005 0.001 0.0015 0.002 0.0025 0.003
Dis
pla
cem
ent
(mm
)
Time (s)
Closing profile
Simulation
Measured
Max Difference .36mm
Figure 17: Opening and closing profiles of physical tests versus the simulation

27
The profile of the simulation shows reasonable adherence to what was recorded from the proof
of concept testing as seen in figure 17 but is unable to replicate the over travel that appeared in
the profile due to the poppet valve momentum separating the top of the valve stem from the
piston. The actuator in the model could not replicate this particular behavior since it treated the
valve stem and piston as one piece, resulting in a complete stop of the valve once the piston had
reached the end of travel.
4.2 Valve Modification
With the baseline model taken care of one of the first concerns was the velocity at which the
valve was being predicted to open at with a peak of 7 m/s just before the bottom of the stroke
with a hard stop resulting in a violent deceleration. The rapid deceleration from the piston
striking the bottom of cylinder could result in damage to the piston or cylinder reducing its
effective operating life. The approach that proved to be the most viable since it did not rely on
any form of damping material at the bottom of the piston stroke was the implementation of a set
of ports in the wall of the actuator to act as a pressure relief during travel to reduce the velocity
and soften the impact. To achieve an approximation of the ports being covered and uncovered,
the model was reconfigured to include valves which would be triggered to open and close by the
position of the piston and drain to atmospheric pressure in figure 18.

28
Figure 18: Ported cylinder model component diagram
The port diameters were changed in half a millimeter increments. This measure was chosen as
these increments were possible for fabrication in our machine shop. For testing several different
combinations of ports were used to study their affect. The height at which the ports opened was
also examined in some of the cases where multiple ports were used. After running several
iterations, the full list of which can be seen below in table 1, a general trend appeared in that the
only significant changes in the velocity occurred because the system became over-ported,
resulting in the system losing pressure over time due to the pump not being able to provide
enough flow.

29
Table 1: Port configurations and what effect they had on the system
Port Number and Diameter and point of full
open
Effect on System Velocity and Pressure
1 x 2.0 mm at 2.25 mm of travel Small change with system pressure at 16961
kPa
2 x 2.0 mm at 2.25 mm of travel Large change with system pressure at 15168
kPa with large fluctuations
1 x 1.5mm at 2.25 mm of travel No change with system pressure at 17237 kPa
2 x 1.5 mm at 2.3 mm of travel Small change with system pressure at 16685
kPa
2 x 1.5 mm at 2.35 mm of travel No change from above case
1 x 1.5 mm at 2.3 mm of travel
1 x 1.0 mm at 2.3 mm of travel
No change system pressure at 17237 kPa
1 x 1.5 mm at 2.3 mm of travel
2 x 1.0 mm at 2.3 mm of travel
No change system pressure at 17237 kPa
1 x 1.5 mm at 2.0 mm of travel
3 x 1.0 mm at 2.0 mm of travel
Large change system pressure at 16341 kPa
1 x 1.5 mm at 1.5 mm of travel
2 x 1.0 mm at 1.5 mm travel
No change system pressure at 17237 kPa
1 x 1.5 mm at 1.0 mm of travel
2 x 1.0 mm at 1.0 mm of travel
No change system pressure at 17237 kPa
1 x 1.5 mm at 1.5 mm of travel
2 x 1.0 mm at 1.5 mm of travel
1 x 0.5 mm at 1.0 mm of travel
Large change system pressure at 16341 kPa
1 x 1.5 mm at 1.5 mm of travel
2 x 1.0 mm at 1 mm of travel
1 x 0.5 mm at 1.0 mm of travel
Small change system pressure at 17078 kPa
1 x 1.5 mm at 1.5 mm of travel
2 x 1.0 mm at 1.5 mm of travel
1 x 0.5 mm at 1.5 mm of travel
Same as above case
1 x 1.5 mm at 2.0 mm of travel
2 x 1.0 mm at 2.0 mm of travel
1 x 0.5 mm at 2.0 mm of travel
No change system pressure at 17237 kPa
4 x 0.5 mm at .5 mm of travel No change system pressure at 17237 kPa
5 x 0.5 mm at 1 mm of travel No change system at 17237 kPa
1 x 1.0 mm at 1.0 mm of travel
1 x 1.0 mm at 1.5 mm of travel
3 x 0.5 mm at 1.0 mm of travel
Small change system pressure at 16203 kPa

30
In the over ported cases the system would reach a new operating pressure when the accumulator
would no longer have enough fluid to smooth out the fluctuations in the system pressure and the
flow for the ports has equalized with the flow the pump can provide. At this operating condition,
the system experiences large fluctuations in the operating pressure as seen in the example below.
This large fluctuation in the pressure in the system seen in figure 19 is very undesirable since it
would lead to inconsistency in the operation of the valve opening since the desired pressure may
not be available for actuation especially at engine speeds where a there is shorter period between
cycles. These ports did have an unintended consequence on the closing profile due to the reduced
pressure in the cylinder. The reduced pressure resulted in the initial movement being much faster
than the non-ported case until the ports were covered. When the piston would cover the ports, the
-2
0
2
4
6
8
10
12
14
16
18
20
159.232 159.234 159.236 159.238 159.24 159.242 159.244 159.246
Pre
ssu
re (
kPa)
Time (s)
System Pressure
Baseline Modified with Two 2 mm Daimeter Holes
Figure 19: System pressure of ported vs non-ported cylinder
x103

31
pressure would have a sharp increase due to a reduction in flow. This pressure increase would
lead to the piston slowing down since the spring was now facing more resistance. To ensure that
similar results would not be achieved with a simple reduction in the operation pressure, the
system was tested with no ports but with an operating pressure between 13790 kPa to 17237 kPa
in increments of 689 kPa. Then the results were plotted together to see if there was a difference
between the two. The results showed that the difference was the extra flow from the ports, which
allowed the piston to return quicker until they were covered. After that point the two profiles
looked quite similar since the only place for oil to flow was through the control valve.
Ultimately, while this option had the potential to improve the landing of the piston it was not
implemented. This was due to the desire to keep the operating pressure at 17237 kPa to keep the
minimal opening time for the cycle.
Another option that we explored for softening the return landing of the piston was the use of a
small protrusion on the face of the piston to serve as buffer, which is matched to a pocket in the
bottom face of the spool valve to trap oil. The buffer relies on the trapped oil increasing in
pressure to resist the spring, while still allowing the valve to return to the closed position via the
oil exiting through the gap. The effectiveness of this design is dependent on how the gap size
between the diameters of the protrusion. This gap determines how quickly the oil exits the
pocket. Since the number of control valves available for physical testing was limited, the
decision was made to only use one pocket diameter while varying the diameter of the protrusion
to study what the best possible combination would be.

32
A new model was created to allow for the integration of second piston to approximate the
addition of the protrusion on top of the piston. A switching valve was added to allow for
controlling whether the piston is being filled or trying to push the oil through the buffer gap with
the model shown in figure 20.
For this model, the piston diameter was varied from 0.338 to 0.351 cm in diameter with the
pocket diameter being set to 0.356 cm with a length of 1 mm for both the piston and the pocket.
To control how the piston influenced the opening and closing of the valve, a switching valve was
Figure 20: Modified piston component diagram

33
initially added to the model that is triggered by the position of the valve to signify the point at
which the protrusion would begin to be seated inside its corresponding pocket. This was later
disabled after determining that having the valve open for any period resulted in all the fluid in
the secondary piston being exhausted, which nullified the buffer gap mechanism. Meanwhile,
having the secondary piston draw oil through the orifice during opening had little to no impact
on the opening of the valve while still allowing the secondary piston to fill with oil. This still
allowed the piston to serve as a buffer during the return motion. The results of the various
protrusion diameters’ effects on the closing displacement and velocity of the system as compared
to the baseline are shown in the figures below.
0.00
0.50
1.00
1.50
2.00
2.50
3.00
19.9690 19.9695 19.9700 19.9705 19.9710 19.9715 19.9720
Dis
pla
cem
ent (m
m)
Time (s)
Displacement Profile
No Button
0.338 cm dia
button0.340 cm dia
button0.343 cm dia
button0.345 cm dia
button0.348 cm dia
button0.351 cm dia
button
Figure 21: Modified piston closing profiles

34
0.00
0.20
0.40
0.60
0.80
1.00
1.20
1.40
19.9708 19.9710 19.9712 19.9714 19.9716 19.9718 19.9720
Dis
pla
cem
ent
(mm
)
Time (s)
-3.00
-2.50
-2.00
-1.50
-1.00
-0.50
0.00
17.7495 17.7500 17.7505 17.7510 17.7515 17.7520
Vel
oct
iy (
m/s
)
Time (s)
Velocity Profile
No button 0.338 cm dia button
0.340 cm dia button 0.343 cm dia button
0.345 cm dia button 0.348 cm dia button
0.351 cm dia button
~ 1.9 m/s
~2.3 m/s
~2.5 m/s
Figure 22: Close up of modified piston closing profiles
Figure 23: Modified piston closing velocity profiles

35
Figures 21 & 22 show the modified pistons displacement plots as compared to the unmodified
piston with figure 22 showing a closer view of the end when you can see that the smallest gap
from the 0.351 cm diameter button resulting in the valve having the softest landing at the end of
travel. This is backed up by the velocity profiles in figure 23 where we can see that lowest
velocity is achieved when the protrusion diameters are 0.348 cm and 0.351 cm. These results
showed promise for this modification so some pistons were created with a protrusion on top for
testing with an example show below.
Ultimately, however, the models created are only capable of giving a preview of the possible
performance and it is still necessary too physically test the device to ensure the performance is
still at a desirable level.
Figure 24: Modified piston

36
CHAPTER 5
Summary and Conclusions
For this study, a proof of concept system was built to demonstrate that a hydraulically driven
valve’s performance will be suitable for operating in DM-TJI. Once the final version components
have arrived a fully functional valve will be assembled and prepared for testing. Several models
have been created using LMS Amesim to examine modifications to the system regarding issues
that were raised during the proof of concept testing. The main results of this study are as follows:
1. The proof of concept testing valve in its final version had an opening time of 0.8 ms
and closing time 1.5 ms.
2. The opening time is affected by fluid flow rate of the system and the closing time is
affected by the preload and spring rate of the return spring.
3. The system had over travel from the poppet valve separating from the piston but this
was reduced with increase in the preload of the spring.
4. The opening power required per cycle of the system is 12.2 kW due to the high
operating pressure required to achieve the desired opening time.
5. The landing velocity of the proof of concept testing and simulation results is near 2
m/s which is higher than recommended.
6. For a given operating speed the maximum variance from the average cycle time was a
maximum of 0.1 ms.
7. The system is not significantly slowed by the addition of pressurized air representing
an engine operating under boosted conditions.

37
CHAPTER 6
Recommendations
1. If the close time of the system needs to be reduced even further a spring that has a free
length longer than 0.0432 m with a spring rate comparable to 47984.7 Newtons per meter
(274 pounds per inch) should be acquired.
2. For improving the landing velocity, the piston with the protrusion diameter of 0.351 cm
and pocket diameter of 0.356 cm should be used or alternatively a protrusion and pocket
combination that yields a gap of 0.00508 cm.
3. Once the new components have all arrived, the system should be tested with the old,
unmodified pistons to ensure that the profile of the valve has not changed due to
increases in friction. If this does occur the friction characteristics of the models need to be
tuned to better approximate the new system for future modification examinations.

38
REFERENCES

39
REFERENCES
1. Y. H. Qiu et al., "Design and experimental evaluation of an electromechanical engine
valve drive," 2004 IEEE 35th Annual Power Electronics Specialists Conference (IEEE
Cat. No.04CH37551), 2004, pp. 4838-4843 Vol.6. doi: 10.1109/PESC.2004.1354855
2. Henry, R. and Lequesne, B., "A Novel, Fully Flexible, Electro-Mechanical Engine Valve
Actuation System," SAE Technical Paper 970249, 1997, doi:10.4271/970249.
3. Turner, J. W. G., Kenchington, S. A., and Stretch, D. A., 2004. Production AVT
development Lotus and Eaton's electrohydraulic closed-loop fully variable valve train
system. In: 25th Vienna Motor Symposium, 2004, 2004-04-01.
4. Sturman, Oded E., inventor. Hydraulic actuator for an internal combustion engine. US
patent 5,638,781. June 17, 1997
5. Denger, D. and Mischker, K., "The Electro-Hydraulic Valvetrain System EHVS - System
and Potential ," SAE Technical Paper 2005-01-0774, 2005, doi:10.4271/2005-01-0774.
6. Allen, J. and Law, D., "Production Electro-Hydraulic Variable Valve-Train for a New
Generation of I.C. Engines," SAE Technical Paper 2002-01-1109, 2002,
doi:10.4271/2002-01-1109.
7. Lou, Z., Wen, S., Qian, J., Xu, H. et al., "Camless Variable Valve Actuator with Two
Discrete Lifts," SAE Technical Paper 2015-01-0324, 2015, doi:10.4271/2015-01-0324.
8. S. Braune and S. Liu, "A novel linear actuator for variable valve actuation," 2005 IEEE
International Conference on Industrial Technology, Hong Kong, 2005, pp. 377-382.doi:
10.1109/ICIT.2005.1600667
9. Cargine. Free Valve Actuator. N.p.: Cargine, 2012. Print
10. "Gasoline Engine Management Systems." Delphi Variable Cam Phaser. Delphi, n.d.
Web. 17 Apr. 2017. <http://www.delphi.com/manufacturers/auto/powertrain/gas/valvetrain/vcp>.
11. "Gasoline Engine Management Systems." Delphi 2-Step Valve Lift System. Delphi, n.d.
Web. 17 Apr. 2017.
<http://www.delphi.com/manufacturers/auto/powertrain/gas/valvetrain/2step>.
12. Mackoski, Dusko. "Camless Engines." AutoSpeed Articles RSS. AutoSpeed, 7 Oct.
20174. Web. 17 Apr. 2017. <http://www.autospeed.com/cms/article.html?&A=113155>.