the determination of fumaric acid in animal · the determination of fumaric acid in animal tissues...
TRANSCRIPT
THE DETERMINATION OF FUMARIC ACID IN ANIMAL TISSUES BY PARTITION CHROMATOGRAPHY
BY LAWRENCE M. MARSHALL,* JAMES M. ORTEN, AND ARTHUR H. SMITH
(From the Department of Physiological Chemistry, Wayne University College of Medicine, Detroit)
(Received for publication, February 14, 1949)
The present investigation arose from a need for a method of analysis that would permit the estimation of the small quantities of fumaric acid alleged to be present in animal tissue. Annau et al. (1) suggested the possible metabolic significance of fumaric acid, and the “citric acid” cycle of Krebs (4), which followed promptly the demonstration by Orten and Smith (9) of citric acid precursors in the dog, attracted attention to the biological importance of certain other related organic acids. Although schemes of analysis for fumaric acid exist, the early methods either lacked sensitivity or specificity or required equipment which prevented their wide application. The methods of Annau et al. (1) and of Massart and van Grembergen (8) employed an extraction of the acid and final volu- metric measurement with standard potassium permanganate solution, whereas Krebs and coworkers (5) measured the fumaric acid after reduction to succinic acid. Szegedy (11) used addition reactions with bromine, while Stotz (10) measured the mercury held in mercurous fumarate pre- cipitates. Polarographic methods were developed by Giovanni and Rao (2) and by Warshowsky and coworkers (12). The method of Isherwood (3) for the determination of organic acids in fruits suggested the possibility of adapting the chromatographic +hnique to this problem. The theory of chromatography developed by Marcin and Synge (7) provided direction for the investigation from which evolved the method herein described. This procedure, in our hands, also appears suitable for succinic, malic, and citric acids as well. The present report presents the detailed procedure for the measurement of fumaric acid which has been employed in our laboratory (Marshall, Orten, and Smith (6)).
The principle of the method involves the transfer of the organic acids of the sample to a non-aqueous phase, an amyl alcohol-chloroform mixture, which is then passed through a column of specially treated silica gel; a physicochemical separation of the organic acids is thus accomplished. As
* The data in this paper have been taken from the dissertation submitted by Lawrence M. Marshall for the degree of Doctor of Philosophy, Wayne University, 1949. Junior Fellow, National Institute of Health, 1946-48. Present address, Howard University School of Medicine, Washington.
1127
by guest on June 4, 2018http://w
ww
.jbc.org/D
ownloaded from
1128 DETERMINATION OF FUMARIC ACID
will be described in detail later, further separation of fumaric acid from other organic acids, which are released from the column at nearly the same time, can be accomplished on rechromatographing the effluent and using a lower proportion of amyl alcohol to chloroform. The final measurement involves titration with standard alkali of fractions of the effluent and the values obtained describe a curve which approximates the normal curve of error. The reproducible location of the mode of this curve at the same position on the abscissa under comparable experimental conditions demon- strates the specificity of the method. A calorimetric method (Marshall, Orten, and Smith (6)) shown to be specific for fumaric acid, though less sensitive, was employed as a further procedure for verification.
Reagenl,hAcid acetone. 6 ml. of 10 N sulfuric acid diluted to 1 liter with acetone.
Amy1 alcohol, tertiary. Eastman; sp. gr., 20/20,0.815. Amy1 alcohol-chloroform mixtures. The calculated volume of amyl
alcohol diluted to 1 liter with chloroform. Butanol (normal). Baker’s Analyzed; sp. gr., 25”, 0.8080 (butyl alcohol,
normal). Butyl alcohol-chloroform mixtures. The calculated volume of butyl
alcohol was made up to 1 liter with chloroform. Chloroform. Baker and Adamson; sp. gr., 20/20, 1.490. Fumaric acid. M.p. 286”; neutralization equivalent 58; sublimes at
200”. Chas. Pfizer and Company, Brooklyn, New York. Silica gel. Commercial sodium silicate was allowed to stand for 10 to 24
hours under 4 liters of water. The solution was filtered and an approxi- mate value for total solids was obtained; this guided the dilution so that the sodium silicate solution had a final concentration of 20 f 2 per cent (weight per solution volume). Several drops of methyl orange were added and 10 N hydrochloric acid was added in a fine stream until the indicator became pink. 150 to 200 ml. were then added in excess and the mixture was allowed to stand for 3 hours, after which it was filtered on a Btichner funnel. The gel was suspended in 3 liters of 10 N hydrochloric acid overnight, filtered by suction, and washed with 5 liters of 5 N hydro- chloric acid, 10 liters of distilled water, 10 liters of absolute alcohol, and finally 5 liters of dry ether. The powder was dried in a warm current of air and, after standing 2 weeks, was suspended in 4 liters of 10 N hydro- chloric acid and allowed to stand overnight. The material was titered by suction, washed with 5 liters of 5 N hydrochloric acid, 50 liters of water, and 10 liters of absolute alcohol containing 1 per cent (by weight) of 10 N
sulfuric acid. Washing with ether completed the process. The gel was air-dried and before using was dried for a minimum of 24 hours over phosphorus pentoxide. That silica gel which passed, with gentle brushing, through a No. 90 mesh sieve was used.
by guest on June 4, 2018http://w
ww
.jbc.org/D
ownloaded from
L. M. MARSHALL, J. M. ORTEN, AND A. H. SMITH 1129
Thymol blue indicator. 40 mg. of thymol blue were triturated in a mortar with 4 ml. of 0.1 N sodium hydroxide. The solution was washed into a 200 ml. volumetric flask, made to volume with water, and filtered.
Procedure
Calibration-3 ml. of a solution of 0.5 N sulfuric acid are added to 3 gm. of dried silica gel. To this mixture are added 35 ml. of chloroform and the suspension is introduced into an 8 mm. glass tube, 1 meter in length, and closed at the bottom with a cotton plug fitted into a slightly constricted end. Chloroform is allowed to pass through the tube until the column settles as a contiguous mass. The surface of the column is kept moist with 1 ml. additions of chloroform. When the column settles as a single mass, the last portion of chloroform on the surface of the column is allowed to disappear and immediately 1 ml. of a 1 mg. per cent solution of pure fumaric acid in a 10 per cent amyl alcohol-chloroform mixture is added. Immedi- ately after the pure fumaric acid solution has drained into the column, 1 ml. of 5 per cent amyl alcohol-chloroform is introduced; two additional sepa- rate portions are added, each being allowed to drain into the column. When the last added portion disappears, the receiver is changed to a 25 ml. test-tube in a rack which contains thirteen (or more) similar test-tubes, the tubes being identified by number, i.e. Tube 1,2,3, etc. The column is quickly filled with 5 per cent amyl alcohol-chloroform, the meniscus of which becomes the zero on a movable “volume flow” scale placed against the column. The collecting tubes are changed so that the numbers on the receivers correspond to the interval opposite the falling meniscus, i.e. Tube 2 at scale interval 2, Tube 3 at scale interval 3, etc. The scale is prepared from wood strips having the dimensions of an ordinary meter stick with a scale graduated so that the length of the intervals on the scale progresses geometrically. Interval lengths are thus the products of 1.25 and the antilogarithm of 0, 0.05, 0.10, 0.15, 0.20, etc. The value 1.25 is the height of a 0.5 ml. volume of water standing in the glass tubing selected for the columns used. Collection of the samples in geometric progression as described reduces the titration error, particularly in the later samples which would contain increasingly smaller concentrations of fumaric acid per unit volume if linear collections were made. While the collections are proceeding, 1 drop of thymol blue indicator (see “Reagents”) is placed in each of the tubes. The first tube which shows indicator discharge marks the beginning of the approximate fumarate position; collections are con- tinued in this way until the effluent amyl alcohol-chloroform solution ceases to change the indicator color to red. The tube before the first tube which shows indicator discharge, the tube after the last tube which shows indicator discharge, and each tube showing indicator discharge are then titrated with 0.004 N sodium hydroxide with a 2 ml. micro burette. The
by guest on June 4, 2018http://w
ww
.jbc.org/D
ownloaded from
1130 DETERMINATION OF FUMARIC ACID
titration is conducted by admitting small amounts of the standard alkali and shaking until the first blue tint appears through the emulsion. Each value (ml. of 0.004 N NaOH) obtained is plotted against the fraction number and the accumulated titrations are calculated to fumaric acid by the formula
Mg. fumaric acid = Z:t X F
where t = ml. of sodium hydroxide required for the fraction, a = the Crst fraction measured (i.e., the tube before the first tube containing discharged indicator), o = the last fraction measured (i.e., the tube after the last tube which showed indicator discharge), and F = normality of the sodium hydroxide X 58.0.
After three determinations have established a recovery error of less than 5 per cent, the plotted curves are compared. When the mode (peak of the curve) for each curve occurs at the same interval and when the volumes of standard alkali indicated by the mode are equal within a range of 0.03 ml., the procedure may be checked by using a mixture of acids containing fumaric acid (e.g., acetic, fumaric, and malic acids). The position of fumaric acid in the effluent phase is thus determined and the interval or fraction at which fumaric acid first appears, the fraction number at the mode, and the fraction number marking the complete release of fumaric acid from the column are used as guides for subsequent measurements. When either reagents or apparatus are changed, the calibration must be repeated.
Preparation of Sample for Measurement; Deproteinizatibn-Approximately 10 gm, of the minced sample of tissue (or 10 ml. of blood or plasma) are mixed with acetone and the suspension is transferred to a 200 ml. volu- metric flask. 1.2 ml. of 10 N sulfuric acid are added and acetone is in- troduced until the level of the total mixture is within 5 to 10 ml. of the mark. After mixing, the flask is refrigerated overnight. Finally, the volume is adjusted to the mark with acetone and the mixture is filtered through a 15 cm. No. 50 Whatman filter paper. Three 40 ml. aliquots are taken to apparent dryness by placing them under an infra-red lamp and directing a current of air over them, the height of the lamp being adjusted so that the acetone will not boil. Overheating is to be avoided because of the possibility of esterification with the solvent. To the dry residue is added l- ml. of 2.0 N sodium hydroxide. After the alkali is mixed with the extract, the pH is adjusted to 3 f 0.5 with dropwise additions of 5 N sulfuric acid, by using indicator paper (Hydrion). Water is then added until the total volume is 2 ml. The acid-acetone procedure does not free the material completely from biuret-positive materials, but any such materials remaining do not appear to interfere with the meas- urement.
by guest on June 4, 2018http://w
ww
.jbc.org/D
ownloaded from
L. M. MARSHALL, J. Id. ORTEN, AND A. H. SMITH 1131
Transfer to Non-Aqueous Phase-The above extract, or an equal volume of aqueous non-protein solutions of fumaric acid, such as urine, adjusted to pH 2 f 0.5 is mixed intimately with 2 gm. of silica gel (see “Reagents”), suspended in 20 ml. of chloroform, and the suspension is poured into the column. As the chloroform drains through the silica gel, the top of the silica gel column is kept moist with repeated small additions (1 ml. each) of chloroform from a dropping pipette. When the silica gel column settles to an unbroken mass, the chloroform above the top of the silica gel is permitted to disappear into the column and immediately the column is filled with 30 per cent amyl alcohol-chloroform. The first 5 ml. of the liquid issuing from the column are discarded, then the flow is continued until 45 ml. of amyl alcohol-chloroform are collected, the column being refilled to maintain the flow. This amyl alcohol-chloroform mixture con- taining the fumaric acid is taken to dryness at room temperature by directing moving air over the material and the residue is set aside for measurement.
Measurement of Sample-To the foregoing residue are added 1 to 1.5 ml. of a 10 per cent amyl alcohol-chloroform solution, and after swirling the beaker so that the sides are rinsed with the solvent, it is covered with a watch-glass and allowed to stand for 1 hour. The material in amyl alcohol-chloroform is introduced on the surface of the column, prepared according to the procedure under the preliminary preparation for the analysis, and the beaker is rinsed twice with 0.25 ml. quantities of 10 per cent amyl alcohol-chloroform solution. The procedure for the measure- ment of fumaric acid then follows that presented under the calibration procedure.
Calculations-Since the above operations give mg. of fumaric acid meas- ured, the concentration of fumaric acid in the sample tested is calculated as follows :
C= mg. fumaric acid measured X P X 100
W
where C = concentration in mg. per cent of fumaric acid, P = aliquot fac- tor in deproteinixation, and W = sample weight.
Interference and Recovery Data
Studies were first undertaken to ascertain whether the organic acids known to occur in animal materials could be adequately separated by means of a silica gel column employing the aqueous alcohol-chloroform system and thus be shown not to interfere with the estimation of fumaric acid. To this end the method for preparation of the sample described above was followed. For the estimation of these acids the entire band of the
by guest on June 4, 2018http://w
ww
.jbc.org/D
ownloaded from
1132 DETERMINATION OF FUMARIC ACID
acid was measured instead of separate fractions as above. Fractions were not collected because “thiamine adsorption tubes” instead of the regular columns were used. The smaller columns permitted measurement of the acids which were released more slowly than fumaric acid in a shorter time. The position of each acid was determined by first examining when and where the acid would occur in the effluent phase. Acids immediately on either side of fumaric acid or coming before fumaric acid were released from the column with lower concentrations of alcohol-chloroform, while later acids required higher concentrations. Positions for malic, lactic, and oxalic acids, with 20 per cent butanol-chloroform, and citric acid, with 35 per cent butanol-chloroform, were similarly determined. The position of succinic acid was determined with 10 per cent butanol-chloroform. The position of fumaric acid was determined with 4,5, and 10 per cent butanol-
TABLE I
Recovery of Acids from Aqueous Solutions
The results are expressed in mg.
I Mixture I Mixture II
Fumaric. ....... Succinic. ....... Malic. .......... Citric. ......... Lactic. ......... Oxalic. .........
. . . . .
. . . . .
. . . . .
. . . . .
. . . . .
Acid Acid added found
--
0.75 0.73 0.25 0.29
Acid added
-
1.50 1.50 0.50 0.46 1.0 1.16
Acid Acid found added
Mixture III
Acid found --
2.30 2.47 1.50 1.13 3.10 3.14 3.40 3.25 2.25 2.16 5.51 4.79
chloroform. The distribution coefficient for the acid under consideration would largely determine the phase selected; i.e., acids less soluble in butyl alcohol and more soluble in water would require larger amounts of butyl alcohol than acids whose solubilities with respect to these phases were reversed. When amyl alcohol was substituted for butyl alcohol, the positions for the acids remained unchanged. In a previous report (Mar- shall, Orten, and Smith (6)) the sequence of acids is given. When acid mixtures were analyzed, the mobile phase was changed while the analysis was in progress by adding the new mobile phase immediately after the eflluent acid of the previous phase was released. This addition of new non-aqueous phase followed the removal of any mobile phase, already present above the column, by means of a pipette.
With these techniques, pure acid mixtures were analyzed and the results are given in Table I. Additional mixtures were tested for interfer-
by guest on June 4, 2018http://w
ww
.jbc.org/D
ownloaded from
Deter
- m
irkaio
n No
. 1 2 3 4 5 6 7 8 9 10
- , _- Ad
ded
w.
5.8 5.8
5.8
5.8
0.66
0.
52
0.32
0.
23
0.22
0.
098
7
Foun
d R;
y --
. pe
r cm
57
98
5.5
95
5.9
102
5.9
102
0.71
10
7 0.
50
96
0.40
12
5 0.
28
122
0.29
12
6 0.
096
98
-- Av
erag
e re
cove
ry.
. .I
107
106
1
TABL
E II
Rec
over
y of
Fum
aric
Acid
Ad
ded
to
Vario
us
Biol
ogica
l M
ater
ials
PlaS
ma
I I
IWho
a de
pmte
iniza
tio~
Adde
d
W.
2.98
1.
45
Foun
d R;
‘ --
mg.
pe
r cc
m
3.10
10
4 1.
60
108
T D
--
I Prot
ein
hydm
lysat
e wi
th
depr
otein
izatio
n I
Foun
d RT
;- Ad
ded
--- m
g.
par
ccut
m
g.
1.02
10
2 0.
14
1.03
10
3 0.
28
3.60
---
103
Foun
d Rz
y- Ad
ded
--- m
g.
per
ccd
7
0.15
10
7 32
0 0.
23
82
320
3.30
92
32
0 14
40
---
94
Foun
d Re
cov-
ery
-- pe
r CC
%
3730
10
3 33
3 10
4 33
0 10
3 13
72
98
-- 10
2
Adde
d
411
410
410
410
--
-
414
101
$j
365
89
8 39
4 96
,1
: 5 ? 9 --
1
96
R
by guest on June 4, 2018http://w
ww
.jbc.org/D
ownloaded from
1134 DETERMINATION OF FUMARIC rlC!ID
ence alone. Pyruvic, glutamic, aspartic, uric, acetic, &hydroxybutyric, aconitic, tricarballylic, oleic, palmitic, malic, malonic, and creatine rep- resent a partial list of other acids which were found not to interfere with the measurement of fumaric acid.
Studies of the recovery of pure fumaric acid added to various biological fluids and tissues were made (see Table II). Varying quantities of fumaric acid were added to urine, which was found to contain no detectable amount of this acid.
Although it was known that large molecules could interfere with parti- tion in the chromatographic process (Martin and Synge (7)), the attempt was made to analyze some biological materials without prior separation of the contained protein. Whole blood, under these conditions, could not be analyzed because the discharge of acid hematin into the collecting vessels masked the color of the indicator during titration. The data indicate a somewhat high recovery of fumaric acid added to fresh plasma without previous deproteinization. However, satisfactory recoveries of fumaric acid added to plasma and then deproteinized with acid-acetone were obtained.
On the supposition that there might be interference by compounds having peptide linkages, but not necessarily protein, an enzymatic hydro- lysate of casein was analyzed after fumarate was added. Satisfactory recoveries were obtained.
Satisfactory recoveries of small amounts of fumaric acid added to liver and muscle were also obtained.
Application to Tissues
To apply the method to the determination of fumarate in tissues under carefully controlled conditions, eighteen normal adult rats of the August by Copenhagen strain’ were maintained on a stock ration of commercial dog chow. Twelve of these animals having weights of 285 f 15 gm. were selected and fasted 18 hours. They were then anesthetized by intraperi- toneal injections of pentobarbital sodium and after 15 minutes the animals were opened by a ventral abdominal incision and exsanguinated from the aorta. The blood was pooled in a heparinized vessel and the liver, kidney, gastrocnemius muscle, and brain were removed, also pooled, and immediately frozen with dry ice. The pooled tissues were crushed to a fine powder which was weighed while cold, but not frozen. After homo- genizing in a Waring blendor with acetone, the material was transferred quantitatively from the blendor into a volumetric flask with acetone and from this point the procedure followed that previously outlined.
1 Appreciation is expressed to Dr. Wilhelmina Dunning of the Department of Pathology for furnishing these rats.
by guest on June 4, 2018http://w
ww
.jbc.org/D
ownloaded from
L. M. MARSHALL, J. M. ORTEN, AND A. 11. SMITH 1135
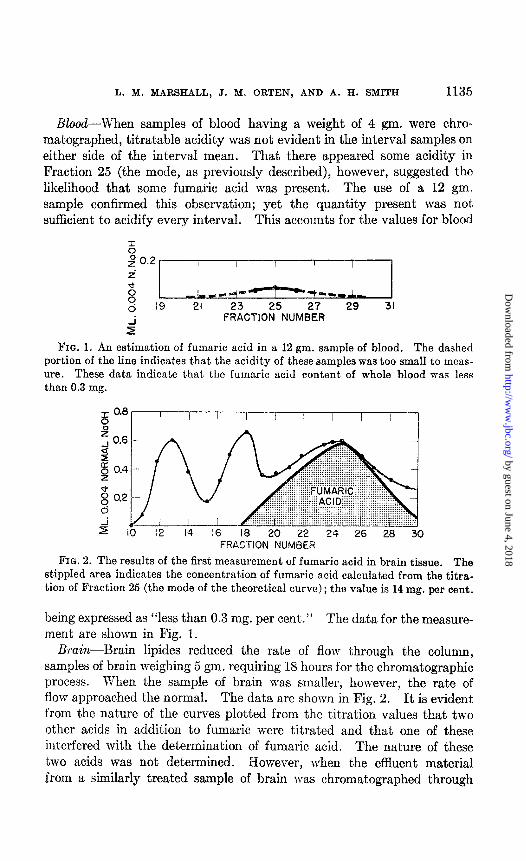
Blood--When samples of blood having a weight of 4 gm. were chro- matographed, titratable acidity was not evident in the interval samples on
either side of the interval mean. That there appeared some acidity in Fraction 25 (the mode, as previously described), however, suggested the likelihood that some fumaric acid was present. The use of a 1.2 gm. sample confirmed this observation; yet the quantity present was not, sufficient to acidify every interval. This accounts for the values for blood
- & z” 0.2 z’
B (j 19 21 23 25 27 29 31
r’ FRACTION NUMBER
FIG. 1. An estimation of fumaric acid in a 12 gm. sample of blood. The dashed portion of the line indicates that the acidity of these samples was too small to meas- ure. These data indicate that the fumaric acid content of whole blood was less than 0.3 mg.
* 0.8 F: z 0.6 d z p 0.4
I I I I I I I I I
1 12 14 16 18 20 22 24 26 28 30 FRACTION NUMBER
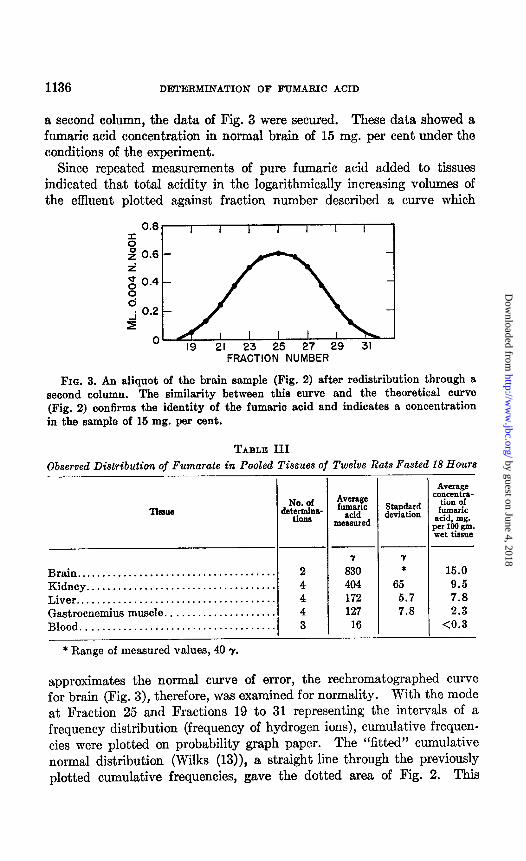
FIG. 2. The results of the first measurement of fumaric acid in brain tissue. The stippled area indicates the concentration of fumaric acid calculated from the titra- tion of Fraction 25 (the mode of the theoretical curve) ; the value is 14 mg. per cent.
being expressed as “less than 0.3 mg. per cent.” The data for the measure- ment are shown in Fig. 1.
Brain-Brain lipides reduced the rate of flow through the column, samples of brain weighing 5 gm. requiring 18 hours for the chromatographic process. When the sample of brain was smaller, however, the rate of flow approached the normal. The data are shown in Fig. 2. It is evident from the nature of the curves plotted from the titration values that two other acids in addition to fumaric were titrated and that one of these interfered with the determination of fumaric acid. The nature of these two acids was not determined. However, when the effluent material from a similarly treated sample of brain was chromatographed through
by guest on June 4, 2018http://w
ww
.jbc.org/D
ownloaded from
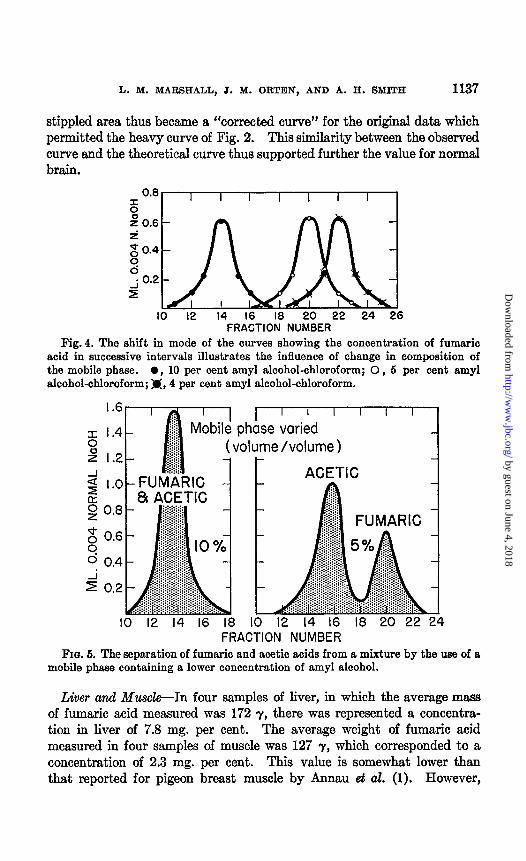
1136 DETERMINATION OF FTJMARIC ACID
a second column, the data of Fig. 3 were secured. These data showed a fumaric acid concentration in normal brain of 15 mg. per cent under the conditions of the experiment.
Since repeated measurements of pure fumaric acid added to tissues indicated that total acidity in the logarithmically increasing volumes of the effluent plotted against fraction number described a curve which
0.8 I I I I I I I is 2 0.6 - 1 “0 0.4 - 9
9 0.2 - 2
0 19 21 23 25 27 29 31
FRACTION NUMBER
FIG. 3. An aliquot of the brain sample (Fig. 2) after redistribution through a second column. The similarity between this curve and the theoretical curve (Fig. 2) confirms the identity of the fumaric acid and indicates a concentration in the sample of 16 mg. per cent.
TABLE III Observed Distribution of Fumarate in Pooled Tissues of Twelve Rats Fasted 18 Hours
Brain. .................................... Kidney ................................... Liver ..................................... Gastrocnemius muscle ..................... Blood. ................................... .
* Range of measured values, 40 y.
No. Of
detzY
20 404 172 127
16
. -
AVerage concentra-
Standard *ion of deviation fumaric
acid. mg. per loo gm. wet tissue
-- -Y * 15.0
65 9.5 5.7 7.8 7.8 2.3
co.3
approximates the normal curve of error, the rechromatographed curve for brain (Fig. 3), therefore, was examined for normality. With the mode at Fraction 25 and Fractions 19 to 31 representing the intervals of a frequency distribution (frequency of hydrogen ions), cumulative frequen- cies were plotted on probability graph paper. The “fitted” cumulative normal distribution (Wilks (13)), a straight line through the previously plotted cumulative frequencies, gave the dotted area of Fig. 2. This
by guest on June 4, 2018http://w
ww
.jbc.org/D
ownloaded from
L. M. MARSHALL, J. M. ORTEN, AND A. H. SMITH 1137
stippled area thus became a “corrected curve” for the original data which permitted the heavy curve of Fig. 2. This similarity between the observed curve and the theoretical curve thus supported further the value for normal brain.
0.8 g
I I I I I I I
IO 12 I4 16 18 20 22 24 26 FRACTION NUMBER
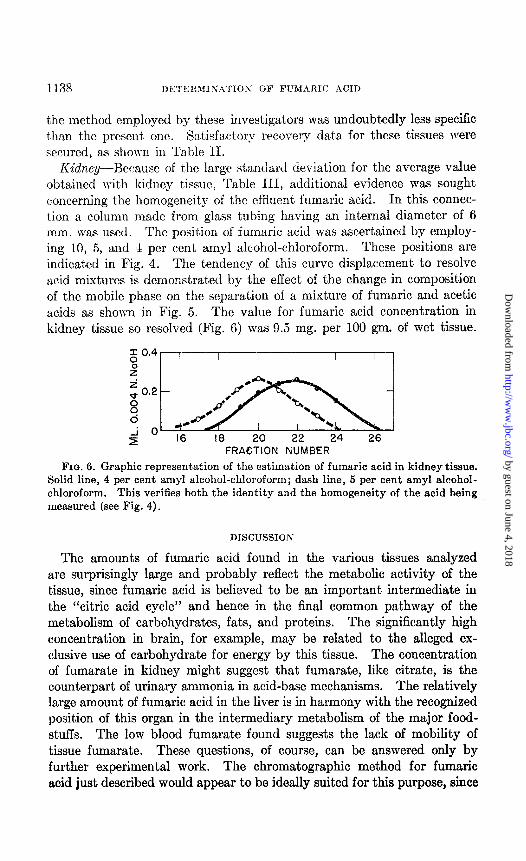
Fig. 4. The shift in mode of the curves showing the concentration of fumaric acid in successive intervals illustrates the influence of change in composition of the mobile phase. 0, 10 per cent amyl alcohol-chloroform; 0, 5 per cent amyl alcohol-chloroform; M, 4 per cent amyl alcohol-chloroform.
I .6
g 1.4
2 1.2
2 z I.0
g 0.8
5 0.6
6 0.4
r’ 0.2
I I 12 14 I6 18 IO I2 14 I6 I8 20 22 24 FRACTION NUMBER
FIG. 5. The separation of fumsric and acetic acids from a mixture by the use of a mobile phase containing a lower concentration of amyl alcohol.
Liver and Muscle-In four samples of liver, in which the average mass of fumaric acid measured was 172 7, there was represented a concentra- tion in liver of 7.8 mg. per cent. The average weight of fumaric acid measured in four samples of muscle was 127 7, which corresponded to a concentration of 2.3 mg. per cent. This value is somewhat lower than that reported for pigeon breast muscle by Annau et al. (1). However,
by guest on June 4, 2018http://w
ww
.jbc.org/D
ownloaded from
the method employed by these investigators was undoubtedly less specific than the present< one. Satisfactory recovery data for these tissues were secured, as shown in Table II.
Kidney--Because of the large standard deviation for the average value obtained with kidney tissue, Table III, additional evidence was sought concerning the homogeneity of the efiuent fumaric acid. In this connec- t.ion a column made from glass tubing having an internal diameter of 6 mm. was used. The position of fumaric acid was ascertained by employ- ing 10, 5, and J: per cent am.yl alcohol-chloroform. These positions are indicated in Fig. 4. The tendency of this curve displacement to resolve acid mixtures is demonstrated by the effect of the change in composition of the mobile phase on the separation of a mixture of fumaric and acetic acids as shown in Fig. 5. The value for fumaric acid concentration in kidney tissue so resolved (Fig. 6) was 9.5 mg. per 100 gm. of wet tissue.
I 0.4 0
t”
Zo.2
Ti 6
ii ’ ’ 16 I8 20 22 24 26 FRACTION NUMBER
FIQ. 6. Graphic representation of the estimation of fumaric acid in kidney tissue. Solid line, 4 per cent amyl alcohol-chloroform; dash line, 5 per cent amyl alcohol- chloroform. This verifies both the identity and the homogeneity of the acid being measured (see Fig. 4).
DISCUSSION
The amounts of fumaric acid found in the various tissues analyzed are surprisingly large and probably reflect the metabolic activity of the tissue, since fumaric acid is believed to be an important intermediate in the “citric acid cycle” and hence in the final common pathway of the metabolism of carbohydrates, fats, and proteins. The significantly high concentration in brain, for example, may be related to the alleged ex- clusive use of carbohydrate for energy by this tissue. The concentration of fumarate in kidney might suggest that fumarate, like citrate, is the counterpart of urinary ammonia in acid-base mechanisms. The relatively large amount of fumaric acid in the liver is in harmony with the recognized position of this organ in the intermediary metabolism of the major food- stuffs. The low blood fumarate found suggests the lack of mobility of tissue fumarate. These questions, of course, can be answered only by further experimental work. The chromatographic method for fumaric acid just described would appear to be ideally suited for this purpose, since
by guest on June 4, 2018http://w
ww
.jbc.org/D
ownloaded from
L. M. MARSHALL, J. M. ORTES, AND A. H. SMITH 1139
it is possible to determine not only fumaric acid but also, and on the same samples, citric, malic, succinic, and perhaps other osganic acids involved in the final oxidative disposition of metabolites.
SUMMARY
A satisfactory method for the determination of small amounts of fumaric acid in biological materials by partition chromatography is described. The procedure can be used to determine as little as 0.05 mg., and is spe- cific. Satisfactory recoveries of small amounts of fumaric acid added to the urine, plasma, casein hydrolysate, liver, and muscle were obtained.
Several tissues of the normal rat were examined for fumarate con- centration. Brain showed the highest concentration, with kidney and liver next. The lowest concentration of fumaric acid of the tissues tested was observed in blood.
BIBLIOGRAPHY
1. Annau, E., Banga, I., G8zsy, B., St. Huseak, I., Laki, K., Straub, B., and Saent- Gyijrgyi, A., 2. physiol. Chem., 236. 1 (1935).
2. Giovanni, S., and Rao, I., Mikrochemie, 23,9 (1937). 3. Isherwood, F. A., Biochem. J., 40,688 (1946). 4. Krebs, H. A., Salvin, E., and Johnson, W. A., Biochem. .I., 32, 113 (1938). 5. Krebs, H. A., Smyth, D. H., and Evans, E. A., Jr., Biochem. J., 34,104l (1940). 6. Marshall, L. M., Orten, J. M., and Smith, A. H., Science, 108, 92 (1948). 7. Martin, A. J. P., and Synge, R. L. M., Biochem. J., 36, 1358 (1941). 8. Massart, L., and van Grembergen, G., Arch. internat. pharmacod., 60, 65 (1938). 9. Orten, J. M., and Smith, A. H., J. Biol. Chem., 117, 555 (1937).
10. Stots, E., J. Biol. Chem., 118, 471 (1937). 11. Saegedy, E., 2. anal. Chem., 109, 95 (1937). 12. Warshowsky, B., Elving, P. J., and Mandel, J., Anal. Chem., 19, 161 (1947). 13. Wilks, S. S., Elementary statistical analysis, Princeton, 159-162 (1948).
by guest on June 4, 2018http://w
ww
.jbc.org/D
ownloaded from
Arthur H. SmithLawrence M. Marshall, James M. Orten and
PARTITION CHROMATOGRAPHYACID IN ANIMAL TISSUES BY
THE DETERMINATION OF FUMARIC
1949, 179:1127-1139.J. Biol. Chem.
http://www.jbc.org/content/179/3/1127.citation
Access the most updated version of this article at
Alerts:
When a correction for this article is posted•
When this article is cited•
alerts to choose from all of JBC's e-mailClick here
html#ref-list-1
http://www.jbc.org/content/179/3/1127.citation.full.accessed free atThis article cites 0 references, 0 of which can be by guest on June 4, 2018
http://ww
w.jbc.org/
Dow
nloaded from