the detector laboratory of utfsm/cctval - ictp … · en el 2007 conicyt y cern firmaron un...
TRANSCRIPT

The Detector Laboratory of UTFSM/CCTVAL
Sergey Kuleshov, Cesar Silva, Rimsky Rojas, Gonzalo Carvajal, Sergey Kovalenko, Rafael Mena, Christopher Nikulin
DGIP/UTFSM grant PI_M_18_03 DGIP/UTFSM grant PI_M_18_13
First steps to the laboratory
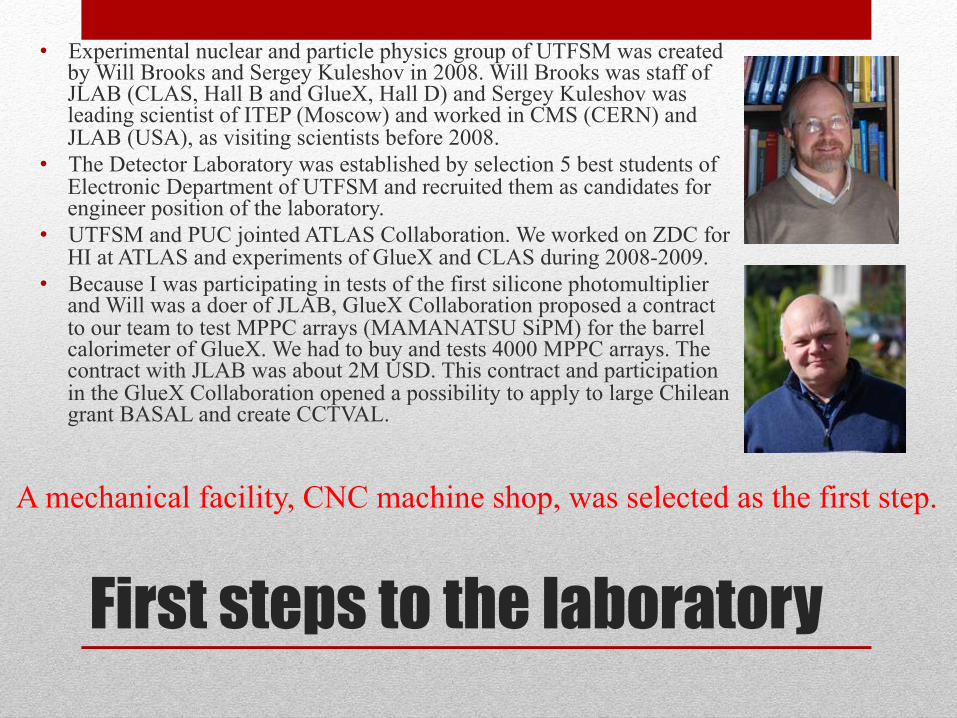
• Experimental nuclear and particle physics group of UTFSM was created by Will Brooks and Sergey Kuleshov in 2008. Will Brooks was staff of JLAB (CLAS, Hall B and GlueX, Hall D) and Sergey Kuleshov was leading scientist of ITEP (Moscow) and worked in CMS (CERN) and JLAB (USA), as visiting scientists before 2008.
• The Detector Laboratory was established by selection 5 best students of Electronic Department of UTFSM and recruited them as candidates for engineer position of the laboratory.
• UTFSM and PUC jointed ATLAS Collaboration. We worked on ZDC for HI at ATLAS and experiments of GlueX and CLAS during 2008-2009.
• Because I was participating in tests of the first silicone photomultiplier and Will was a doer of JLAB, GlueX Collaboration proposed a contract to our team to test MPPC arrays (MAMANATSU SiPM) for the barrel calorimeter of GlueX. We had to buy and tests 4000 MPPC arrays. The contract with JLAB was about 2M USD. This contract and participation in the GlueX Collaboration opened a possibility to apply to large Chilean grant BASAL and create CCTVAL.
A mechanical facility, CNC machine shop, was selected as the first step.
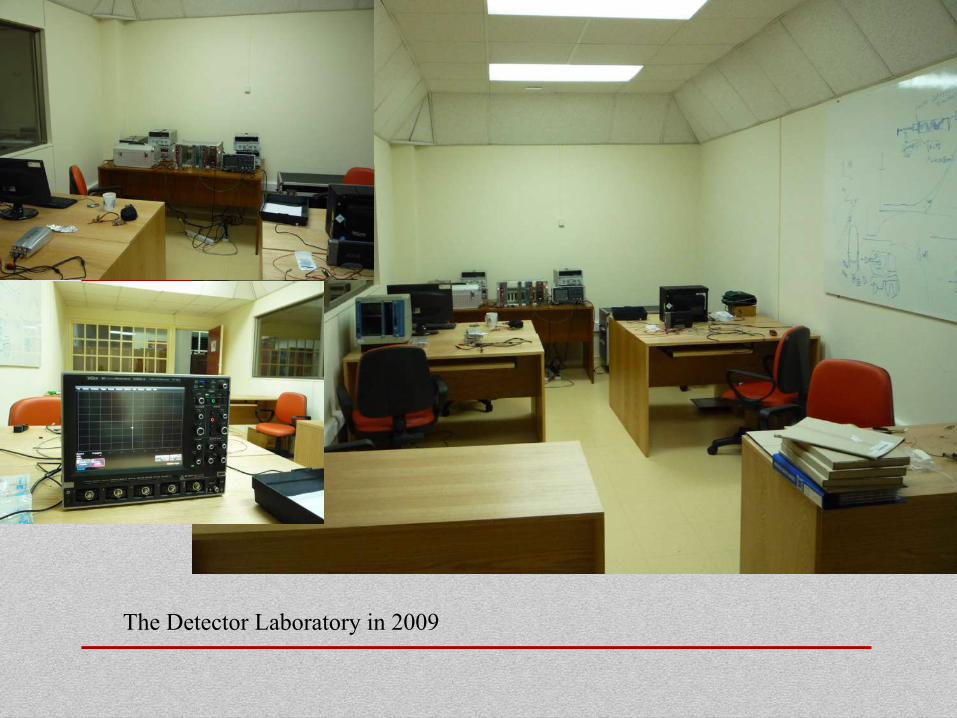
The Detector Laboratory in 2009

The first MPPC test set up in 2009. The current amplifier with 1 K feedback and 39 Ω in the output. On the scope we see V= Imppc *1000*50/89 (v)= = Imppc*561.
LED pulse duration was stetted <10 nS.
HAMAMATSU MPPC
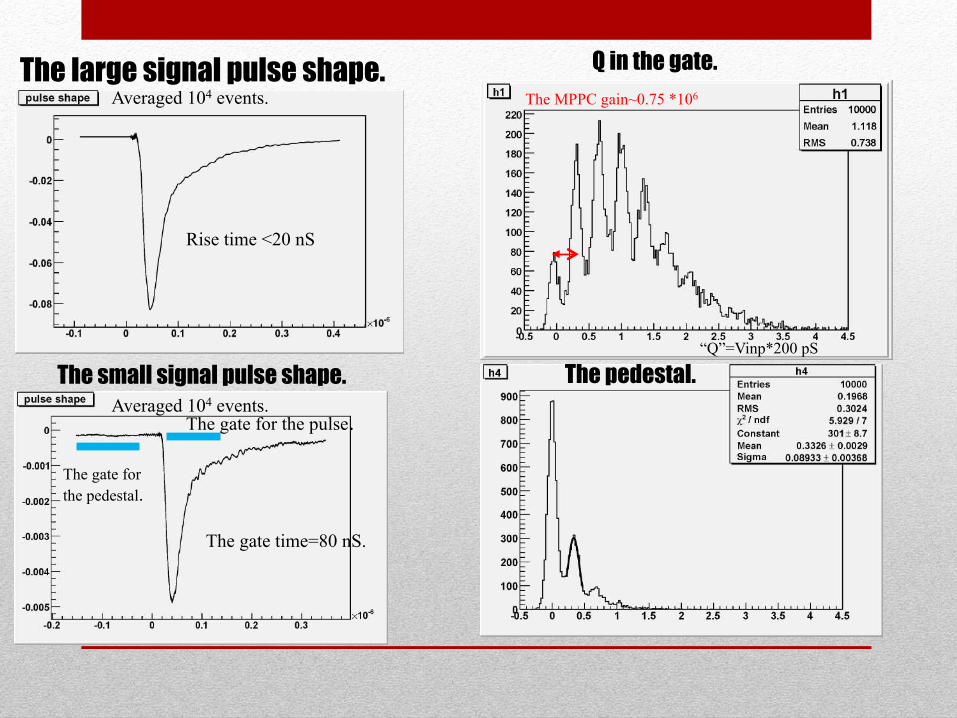
The large signal pulse shape.
Averaged 104 events.
Rise time <20 nS
The small signal pulse shape. Averaged 104 events.
Averaged 104 events.
The gate for the pulse.
The gate for the pedestal.
The gate time=80 nS.
Q in the gate. The MPPC gain~0.75 *106
“Q”=Vinp*200 pS
The pedestal.

Test and characterization of 4000 (x16) SiPM matrix for JLAB. It was done during 2010-2014
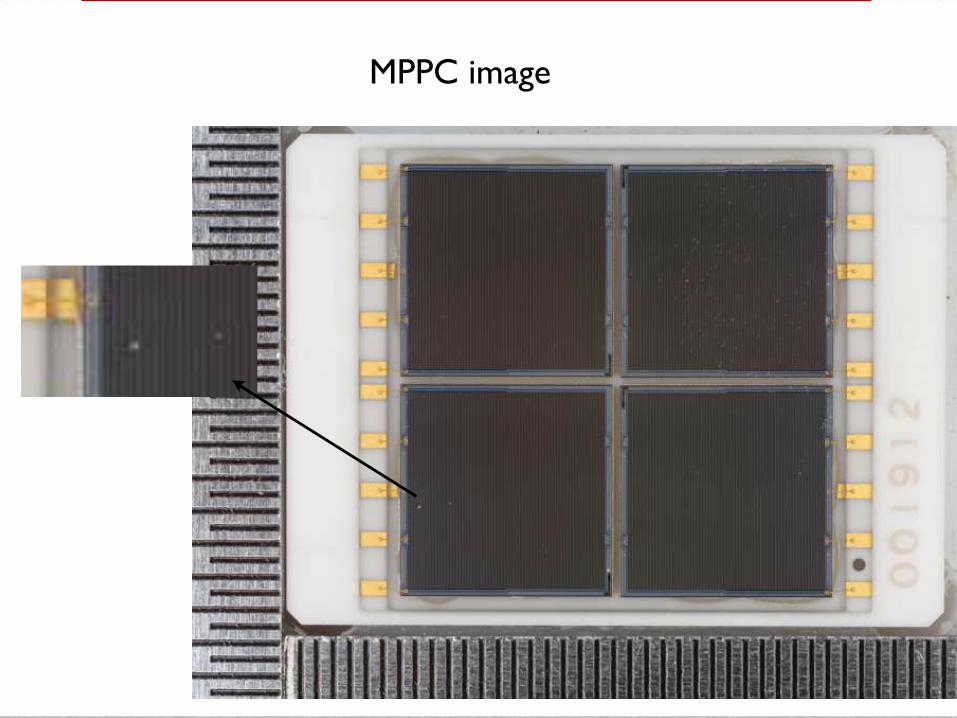
• The novel Hamamatsu Multi-Pixel Photon Counter (MPPC) S12045(X) is an array of 16 individual 3 x 3 mm2 MPPC devices each with 3600 Geiger-mode Avalanche Photodiode pixels of 50 50 µm2. Each MPPC in the array operates at a reverse bias of approximately 70 V. MPPC arrays used in the GlueX experiment in Hall D at Thomas Jefferson National Accelerator Facility (Jefferson Lab). We studied the main features of each of the 16 MPPC array channels for 2800 MPPC arrays at several different temperatures. Two measurement stations were built to extract gain, breakdown voltage, photon detection efficiency, optical crosstalk and dark rate for each of the 64000 MPPC array channels at each temperature setting. The hardware and the data analysis are described, and new analytical expressions for the mean number of photoelectrons and optical crosstalk are presented, as well as systematic trends of the performance parameters.
• Orlando Soto, Rimsky Rojas, Sergey Kuleshov, Hayk Hakobyan n, Alam Toro, William K. Brooks, Rene Rios “Novel Hamamatsu Multi-Pixel Photon Counter (MPPC) array studies for the GlueX experiment: New results.” Nuclear Instruments and Methods in Physics Research A 739 (2014) 89–97
• Orlando Soto n, Rimsky Rojas, Sergey Kuleshov, Hayk Hakobyan, Alam Toro, William K. Brooks
“Characterization of novel Hamamatsu Multi Pixel Photon Counter (MPPC) arrays for the GlueX experiment “Nuclear Instruments and Methods in Physics Research A 732 (2013) 431–436
4
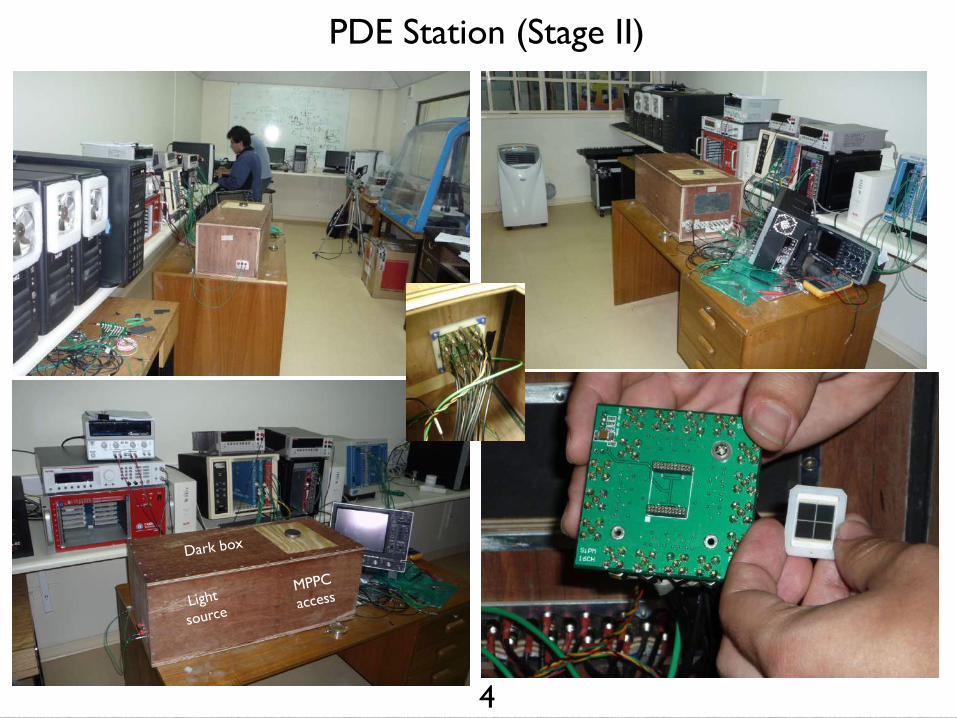
PDE Station (Stage II)
Light
source
MPPC
access
Dark box
5
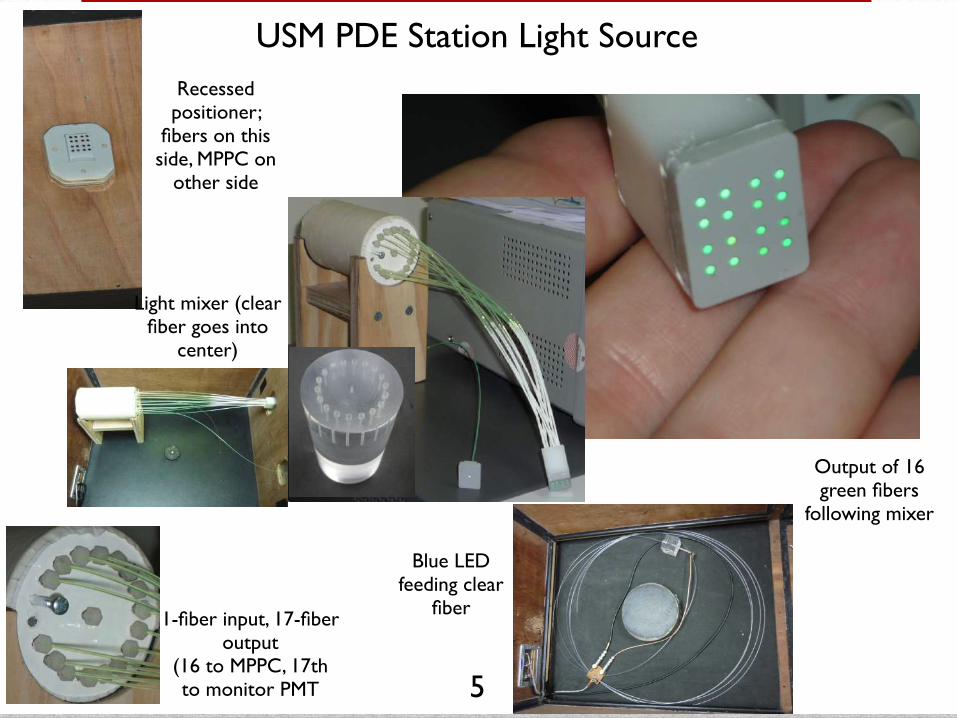
Recessed positioner;
fibers on this side, MPPC on
other side
USM PDE Station Light Source
Output of 16 green fibers
following mixer
Light mixer (clear fiber goes into
center)
1-fiber input, 17-fiber output
(16 to MPPC, 17th to monitor PMT
Blue LED feeding clear
fiber

6
Inspection Station (Stage I)Camera lens and light sensor
MPPC in holder
Camera setup
MPPC image
Fire-resistant safecontaining MPPCs
7
MPPC image

8
Temperature-Controlled Station (Stage III)
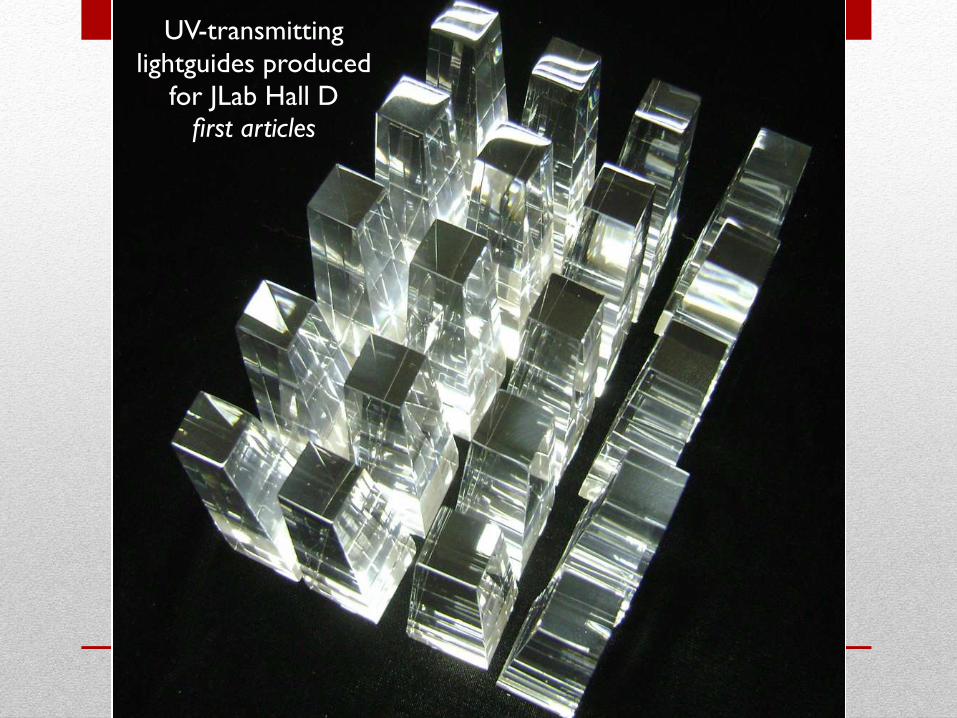
UV-transmitting lightguides produced
for JLab Hall Dfirst articles

THE ATLAS Detector Diameter 25 m Barrel toroid length 26 m End-cap end-wall chamber span 46 m Overall weight 7000 Tons Material cost 540MCHF
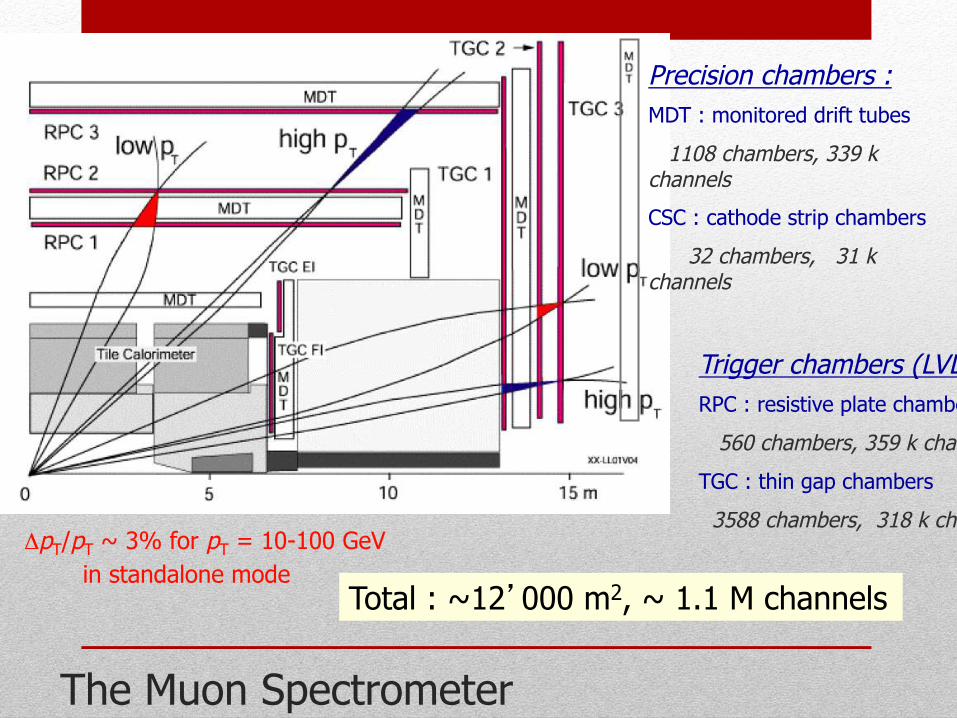
The Muon Spectrometer
Precision chambers : MDT : monitored drift tubes
1108 chambers, 339 k channels
CSC : cathode strip chambers
32 chambers, 31 k channels
Trigger chambers (LVL1): RPC : resistive plate chambers
560 chambers, 359 k channels
TGC : thin gap chambers
3588 chambers, 318 k channels ΔpT/pT ~ 3% for pT = 10-100 GeV
in standalone mode Total : ~12’000 m2, ~ 1.1 M channels

08/04/2008 M.Nessi
Motivation
• The instantaneous luminosity of the Large Hadron Collider at CERN will be increased up to a factor of five with respect to the design value by undergoing an extensive upgrade program over the coming decade.
• The largest phase-1 upgrade project for the ATLAS Muon System is the replacement of the present first station in the forward regions with the so-called New Small Wheels (NSWs) during the long-LHC shutdown in 2019/20

Principal reasons to change the Small Wheel
• Precise position measurement in front of the end-cap magnet is crucial for the momentum determination of the muon.
• Low energy particles produce fake triggers by hitting the end-cap trigger chambers at an angle similar to that of real high pT muons. An analysis of 2012 data demonstrates that approximately 90% of the muon triggers in the end-caps are fake.

New Small Wheel
• The NSW is a set of precision tracking and trigger detectors able to work at high rates with excellent real-time spatial and time resolution. These detectors can complement the muon Level-1 trigger system with online track segments of good angular resolution (<1mrad) to improve the momentum measurement
• two sTGC wedges, pivot and confirm sandwiched the MicroMegas detector in small and large sectors.

sTGC structure
• The basic sTGC structure consists of a grid of gold-plated tungsten wires sandwiched between two resistive cathode planes at a distance of 1.4mm from the wire plane.
• The precision cathode plane has strips with a 3.2mm pitch for precision readout relative to a precision brass insert outside the chamber, and the cathode plane on the other side has pads for triggering .
• The gap is provided using precision frames machined and sanded to 1.4mm ±20µm and glued to the cathode boards

7/20/14, 9:05 PMCONICYT y CERN firman acuerdo para la construcción en Chile de pieza clave en la renovación del experimento ATLAS | PCI
Page 1 of 2http://www.conicyt.cl/pci/2014/06/11/conicyt-y-cern-firman-acuerdo-pa…cion-en-chile-de-pieza-clave-en-la-renovacion-del-experimento-atlas/
Ver newsletters anteriores
FILTRAR RESULTADOS POR
TIPO DE CONTENIDOTIPO DE CONTENIDO
Actividades (17)
Columnas de opinión (0)
Concursos (15)
Entrevistas (0)
ÁREA DE INVESTIGACIÓNÁREA DE INVESTIGACIÓN
Ciencias biológicas (3)
Ciencias físicas (1)
Ciencias médicas y de la salud (2)
Ciencias químicas (0)
Ciencias sociales (1)
Computación y ciencias de lainformación (2)
Ingeniería y tecnología (0)
NEWSLETTER CONICYT
Recibe las noticias y fechasimportantes en tu email
Ingresa tu email
SuscribirmeSuscribirme
Noticias
Publicado 11-06-2014
CONICYT Y CERN FIRMAN ACUERDO PARA LACONSTRUCCIÓN EN CHILE DE PIEZA CLAVE EN LARENOVACIÓN DEL EXPERIMENTO ATLAS
Small Wheel
Actividades Actividades Actividades Concursos
Con el apoyo de CONICYT además se financiará la incorporación como miembro pleno de la Universidad deCon el apoyo de CONICYT además se financiará la incorporación como miembro pleno de la Universidad de
Talca al experimento ALICE.Talca al experimento ALICE.
CONICYT y la Organización Europea de Investigación Nuclear
(CERN) firmaron la semana pasada un Memorandum de
Entendimiento (MoU) para la construcción de la Pequeña Rueda
de Mounes (Muon New Small Wheel Project) por parte de
científicos de la Pontificia Universidad Católica y del Centro
Científico Tecnológico de Valparaíso (CCTVal) de la Universidad
Técnica Federico Santa María, como parte del proceso de
renovación de ATLAS, el detector de partículas más grande del
mundo.
CONICYT financiará con más de 200 millones deCONICYT financiará con más de 200 millones de
pesos el equipamiento necesario para la construcciónpesos el equipamiento necesario para la construcción
de parte de la Pequeña Rueda de Muonesde parte de la Pequeña Rueda de Muones, proyecto
considerado clave en la renovación del experimento ATLAS que
busca incrementar la eficiencia en la detección de partículas.
Por otro lado, CONICYT financiará la incorporación en calidad de miembro pleno de la Universidad de Talca a ALICE,
experimento donde esta universidad colabora desde diciembre del 2011 como uno de los laboratorios de computación de alto
rendimiento donde físicos del CERN envían sus dato para ser procesados.
En el 2014 el apoyo de CONICYT para potenciar la actividad de instituciones chilenas en CERN permitirá además a la Pontificia
Universidad Católica y la Universidad Federico Santa María aumentar de cuatro a cinco sus investigadores en ATLAS.
CERN es el laboratorio de física de partículas más grande del mundo, que reúne en Suiza a más de 7.500 científicos, ingenieros,
estudiantes y técnicos de 60 países, incluido Chile, para colaborar en la busca de nuevos fenómenos y partículas que forman la
materia obscura.
En el 2007 CONICYT y CERN firmaron un Protocolo que ha servido de marco para la participación a largo plazo de estudiantes,
científicos y técnicos de universidades e instituciones de investigación en Chile en los experimentos de CERN, permitiendo a la
Pontificia Universidad Católica y la Universidad Federico Santa María incorporarse como miembros de ATLAS, dando un impulso
sin precedentes al desarrollo de la física experimental en Chile.
NOTICIAS RELACIONADASNOTICIAS RELACIONADAS
PCIPCIPrograma de CooperaciónInternacional
Ir a CONICYT.cl
Inicio Sobre PCI Concursos Noticias Estadísticas Cooperación Unión Europea
Suscribirme al:
02-2365 4400 Centro de Ayuda OIRSCentro de Ayuda OIRS
Contacto English Preguntas Frecuentes Accesos Programas
Chilean contribution (core) : sTGC 294K CHF HV/LV power supply chain 40K CHF

FONDEQUIPT grant
1. Winding machine 250 000 Nls or USD 70.6 K 2. Rotary table 200 000 Nls or USD 56.5 K
• The grant for industrial equipment only • A machine price >> USD 120K • 20% university, 80% CONICYT • We have about USD 200K from contract with JLAB
CEFLA finishing group, PRIMA machine USD 130 K
sTGC project of ATLAS
New Small Wheels: Layout
July 11 2014 S. Zimmermann, CERN Detector Seminar 21
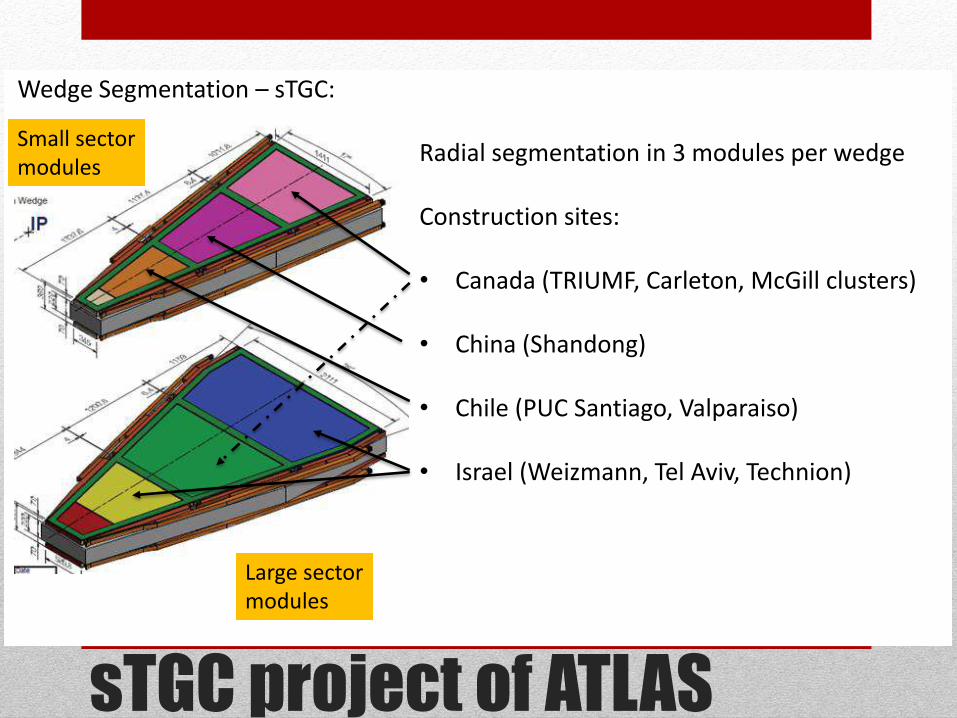
Wedge Segmentation – sTGC:
Small sector modules
Large sector modules
Radial segmentation in 3 modules per wedge Construction sites: • Canada (TRIUMF, Carleton, McGill clusters) • China (Shandong) • Chile (PUC Santiago, Valparaiso)
• Israel (Weizmann, Tel Aviv, Technion)

small-strip Thin Gap Chamber
• Pads readout provide fast pre-trigger to determine which strips to read.
• Precision strips for precision muon tracking reconstruction at level of 100µm
• High efficiency at high background rate.
• All quadruplets have trapezoidal shapes with surface areas up to 2 m2

Precision brass insert and alignment pin
Brass inserts
pin

Construction steps
• Cathode boards check QA/QC • Resistive layer spraying • Polishing to get 100kohm/sqr. Surface resistivity • Gluing of precision frames, QA/QC • Winding of pad cathodes boards • Soldering of wires, wash, solder resistors and cables, QA/QC • Closing of single chambers, QA/QC flatness and thickness • Test with HV during 7 days and gain uniformity with xrays, QA/QC • Assembly of doublet/quadruplet, QA/QC

Spraying and frame gluing
Horizontal spraying machine PRIMA Frame gluing under vacuum

Polishing to get 100kohm/sqr. Surface resistivity
• Board is polished to get down the resistivity to 100kΩ/square ±20% • Surface resistivity is recorded to DB • If surface resistivity does not meet the requirement, cathode board is
cleaned and sprayed again.

Gluing of precision rulers

Winding of pad cathodes boards
• Two pad boards with frames glued are placed in a rotary table in which a gold plated tungsten wire is winded
LUMA METALL 50 microns wire

Soldering of wires, cut excess of wires, wash, solder resistors and cables…

Chamber closing
Pad cathode under high voltage
Chamber with aluminum honeycomb strong-back

Uniformity test using x-ray
New room for HV test and X-ray test Status of xray station
Work on progress, we need the next week tocomplete the room
Status of xray station
Work on progress, we need the next week tocomplete the room
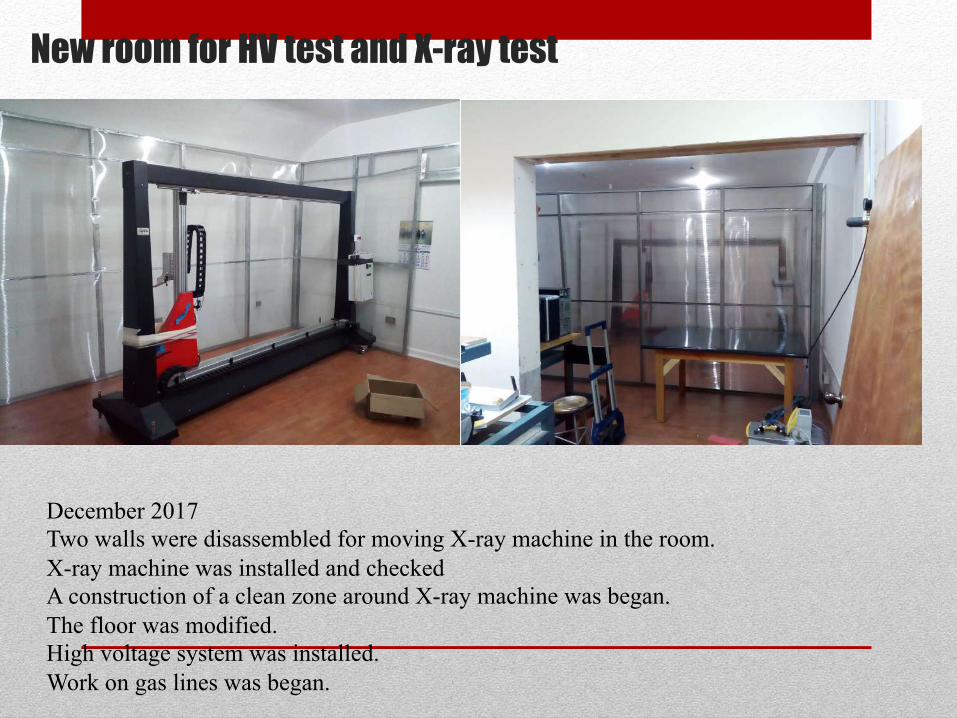
December 2017 Two walls were disassembled for moving X-ray machine in the room. X-ray machine was installed and checked A construction of a clean zone around X-ray machine was began. The floor was modified. High voltage system was installed. Work on gas lines was began.
New room for HV test and X-ray test
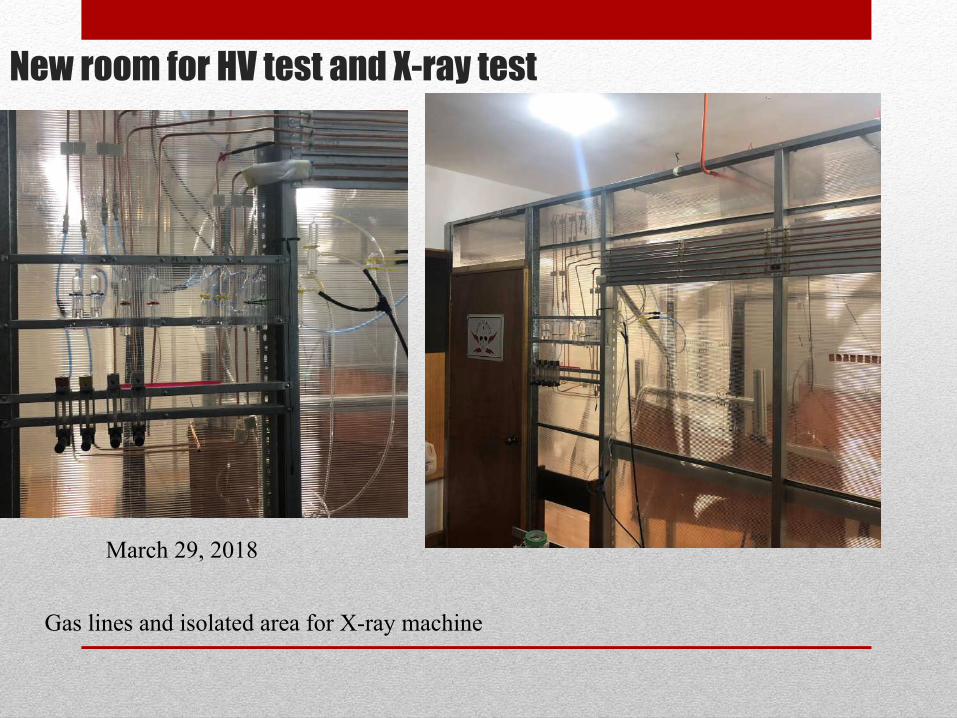
March 29, 2018
Gas lines and isolated area for X-ray machine
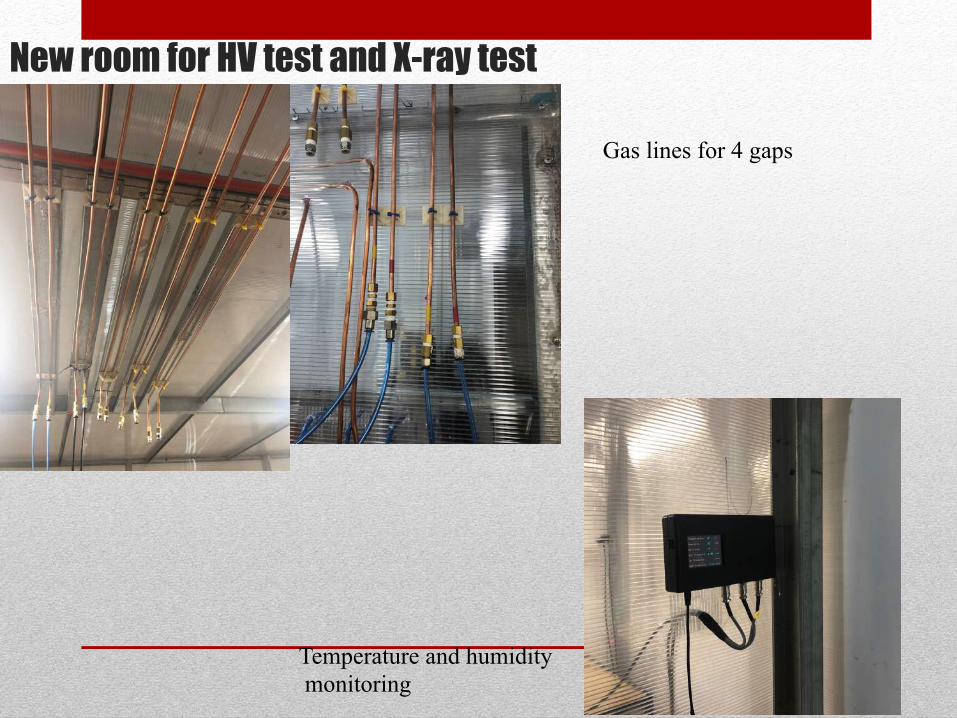
New room for HV test and X-ray test
Temperature and humidity monitoring
Gas lines for 4 gaps
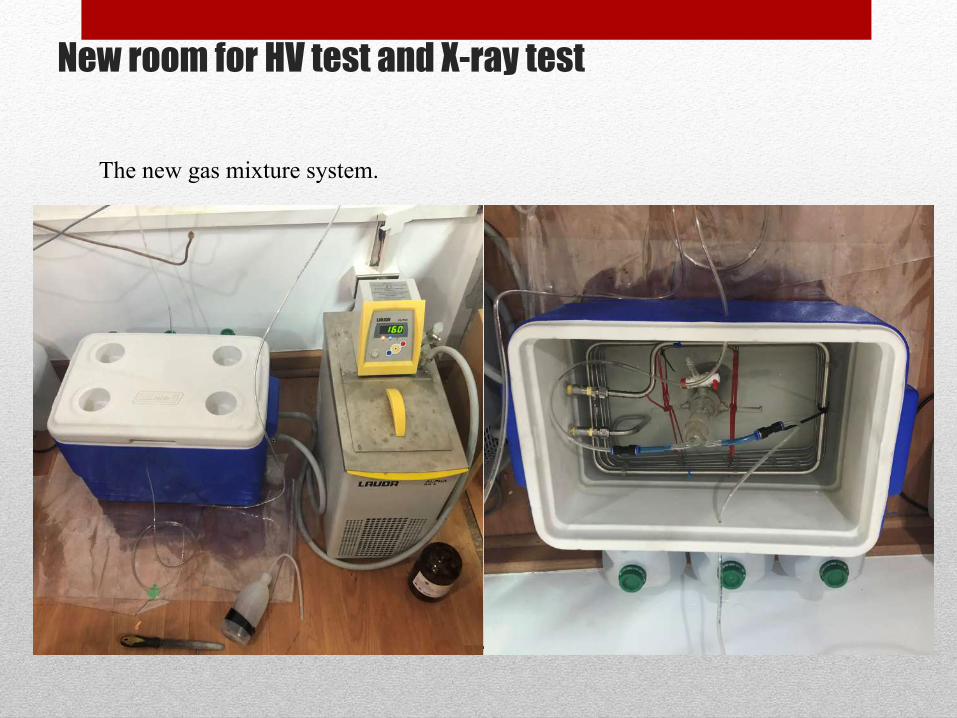
New room for HV test and X-ray test
The new gas mixture system.
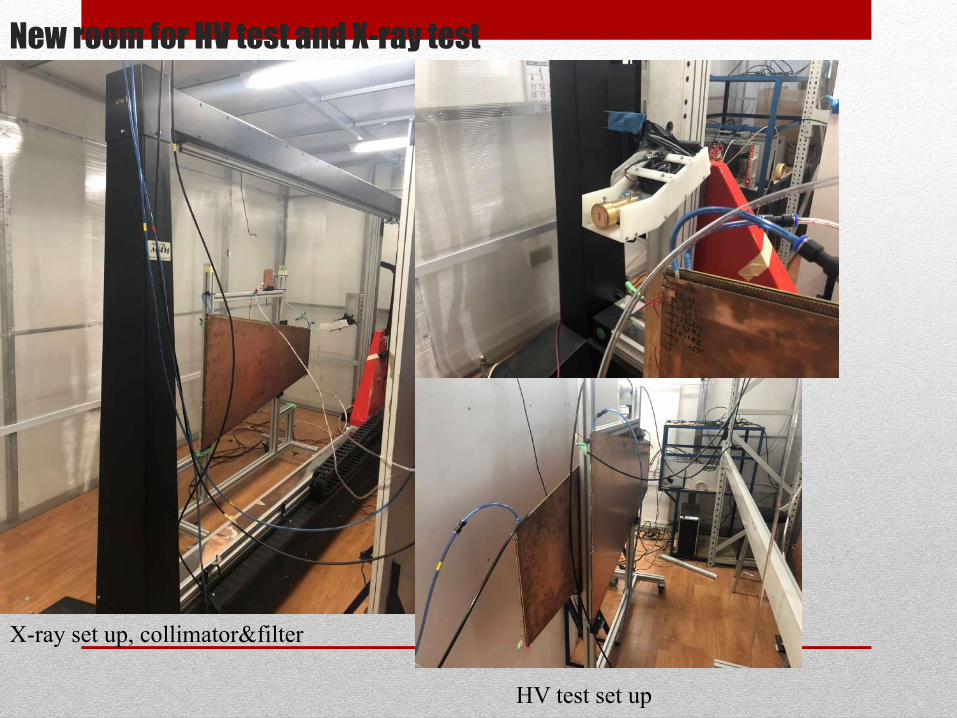
New room for HV test and X-ray test
X-ray set up, collimator&filter
HV test set up

Work with the strong back

sTGC assembling facility of Chile

Team members in CERN: Rimsky Rojas and Gerardo Vasquez
The shipment of Module0 from UTFSM to CERN

Rooms and space at UTFSM Det.Lab before August 2018
CNCroomandofficeRulersworkarea Cleanroom Windingmachineandfaro Offices,pick&place office
+graphiteroominotherbuilding
x-ray scanner room
20m2

Cosmic ray test facility. 400 detectors were produced.
Cosmic Ray detectors: Production & Facility
https://wiki.bnl.gov/conferences/images/a/a5/EIC_R%26D_WSciFi%2BShashlik_7-26-18.pdf https://wiki.bnl.gov/conferences/images/1/1e/Eic_r%26d_july2018_v4.2_intro.pdf
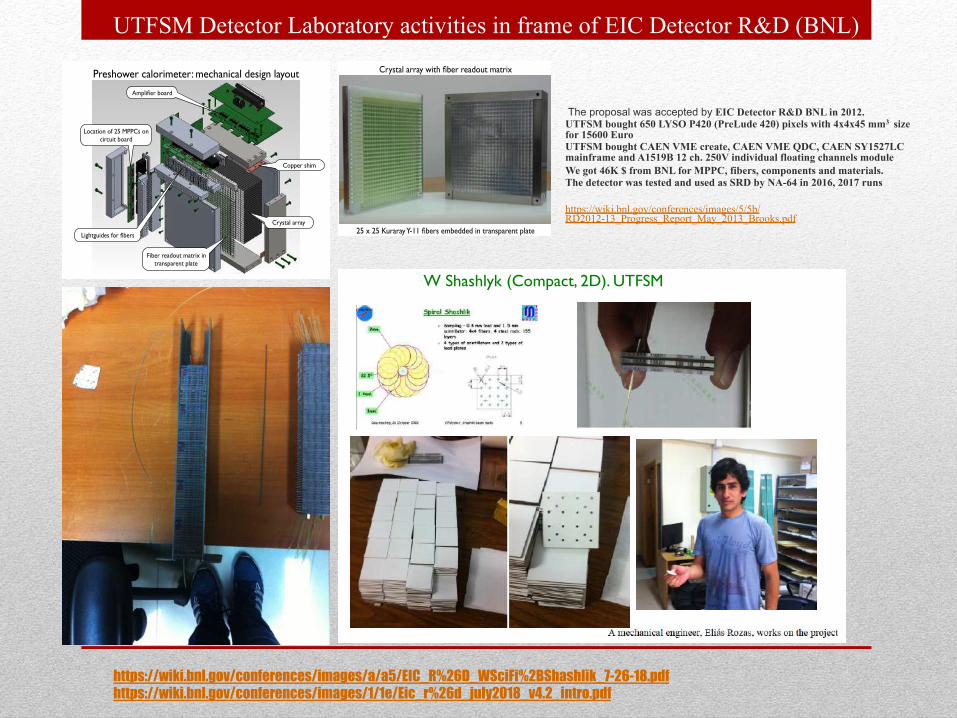
Preshower calorimeter: mechanical design layout
Crystal array
Fiber readout matrix in transparent plate
Lightguides for fibers
Location of 25 MPPCs on circuit board
Amplifier board
Copper shim
25 x 25 Kuraray Y-11 fibers embedded in transparent plate
Crystal array with fiber readout matrix
The proposal was accepted by EIC Detector R&D BNL in 2012. UTFSM bought 650 LYSO P420 (PreLude 420) pixels with 4x4x45 mm3 size for 15600 Euro UTFSM bought CAEN VME create, CAEN VME QDC, CAEN SY1527LC mainframe and A1519B 12 ch. 250V individual floating channels module We got 46K $ from BNL for MPPC, fibers, components and materials. The detector was tested and used as SRD by NA-64 in 2016, 2017 runs https://wiki.bnl.gov/conferences/images/5/5b/RD2012-13_Progress_Report_May_2013_Brooks.pdf
9
Beam LineDX
Magnet
W Shashlyk (Compact, 2D). UTFSM
UTFSM Detector Laboratory activities in frame of EIC Detector R&D (BNL)

DAQ project
• New project for design and production of DAQ (103
channels) with 14 bits ADC slice sample about 2nS for NA64, new COMPASS and medical physics projects.

NA64, July 2016
NA64
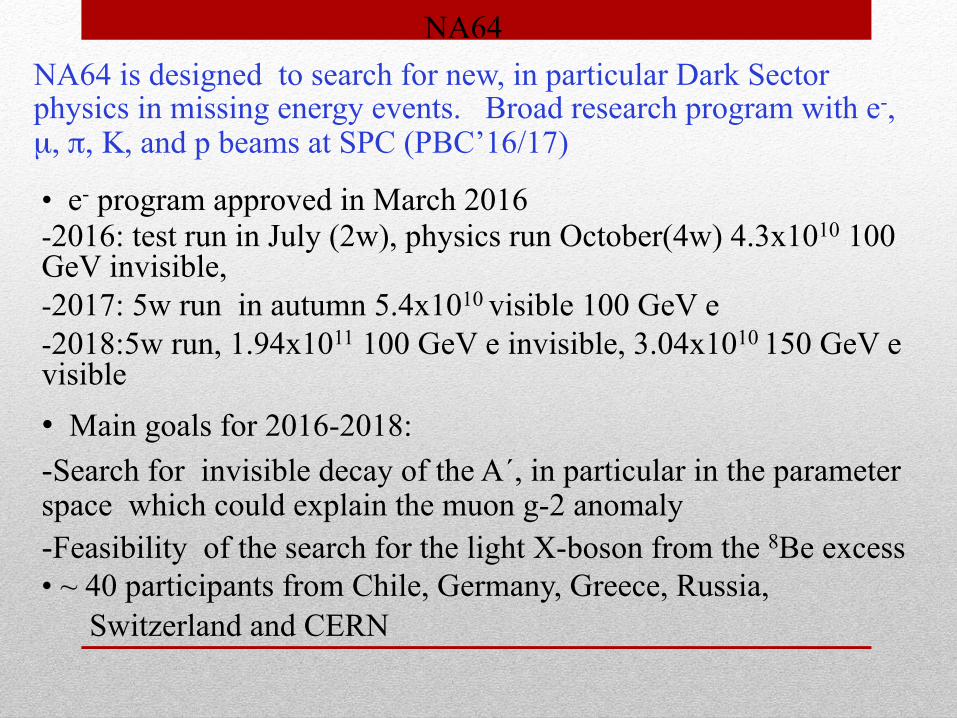
• e- program approved in March 2016 - 2016: test run in July (2w), physics run October(4w) 4.3x10¹⁰ 100 GeV invisible, - 2017: 5w run in autumn 5.4x10¹⁰ visible 100 GeV e - 2018:5w run, 1.94x10¹¹ 100 GeV e invisible, 3.04x10¹⁰ 150 GeV e visible • Main goals for 2016-2018: - Search for invisible decay of the A´, in particular in the parameter space which could explain the muon g-2 anomaly - Feasibility of the search for the light X-boson from the 8Be excess • ~ 40 participants from Chile, Germany, Greece, Russia, Switzerland and CERN
NA64 is designed to search for new, in particular Dark Sector physics in missing energy events. Broad research program with e-, µ, π, Κ, and p beams at SPC (PBC’16/17)
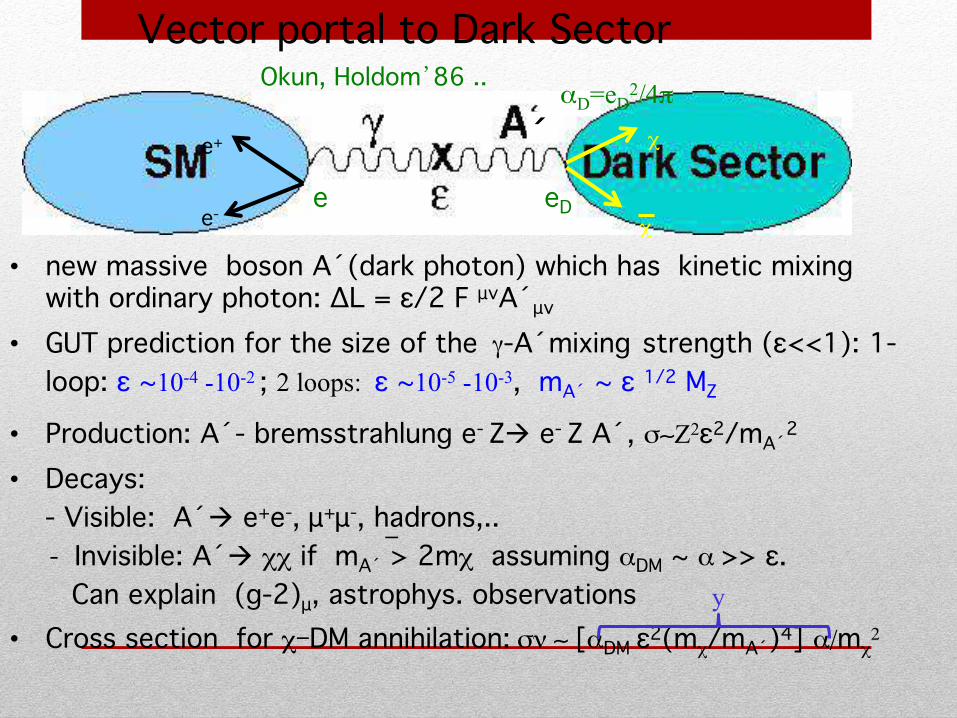
Vector portal to Dark Sector Okun, Holdom’86 ..
• new massive boson A´(dark photon) which has kinetic mixing with ordinary photon: ΔL = ε/2 F μνA´μν
• GUT prediction for the size of the γ-A´mixing strength (ε<<1): 1-loop: ε ~10-4 -10-2 ; 2 loops: ε ~10-5 -10-3, mA´ ~ ε 1/2 MZ
• Production: A´- bremsstrahlung e- Zà e- Z A´, σ∼Z2ε2/mA´2
• Decays: - Visible: A´à e+e-, μ+μ-, hadrons,.. - Invisible: A´à χχ if mA´ > 2mχ assuming αDM ~ α >> ε. Can explain (g-2)μ, astrophys. observations• Cross section for χ-DM annihilation: σν ∼ [αDM ε2(mχ/mA´)4] α/mχ
2
χ
χ
e+
e-eDe
´
_
y
αD=eD2/4π

Search for A´->invisible decays at CERN SPS
Main components :
• clean 100 GeV e- beam
• e- tagging system: tracker+SRD
• 4π fully hermetic ECAL+ HCAL
S.Andreas et al., arXiv: 1312.3309S.G., PRD(2014)
SES < 10-11/EOT
Background:
u µ, π, K decays in flight
u Tail < 50 GeV in the e- beam
u Energy leak from ECAL+HCAL
Signature:
§ in: 100 GeV e- track
§ out: EECAL< E0 shower in ECAL
§ no energy in Veto and HCAL
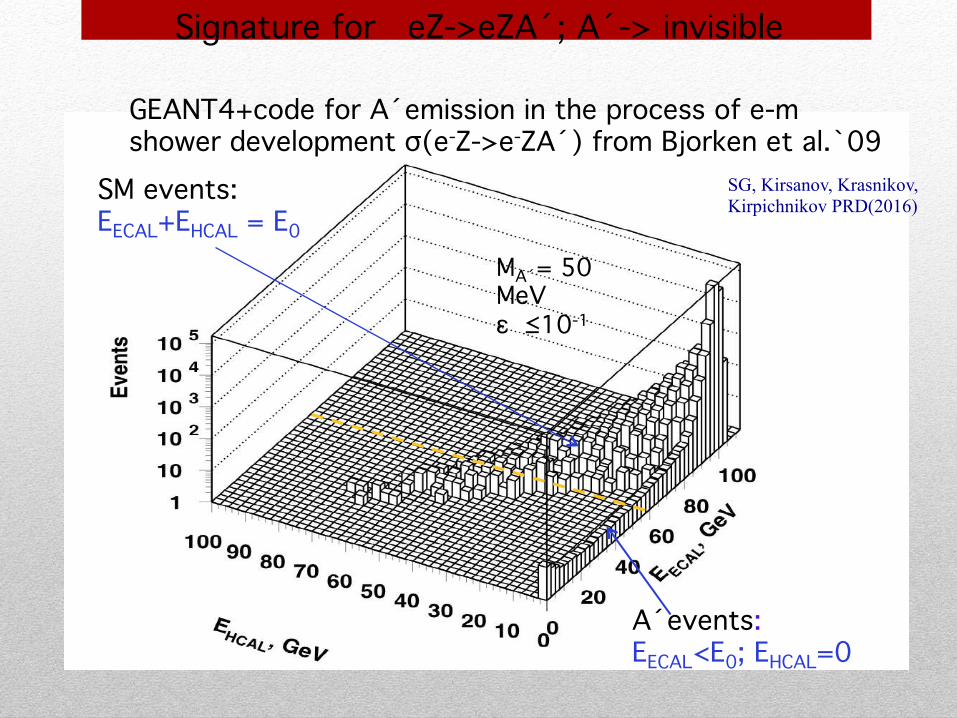
Signature for eZ->eZA´; A´-> invisible
GEANT4+code for A´emission in the process of e-m shower development σ(e-Z->e-ZA´) from Bjorken et al.`09
MA´= 50 MeVε ≤10-1
SM events:EECAL+EHCAL = E0
A´events:EECAL<E0; EHCAL=0
SG, Kirsanov, Krasnikov, Kirpichnikov PRD(2016)
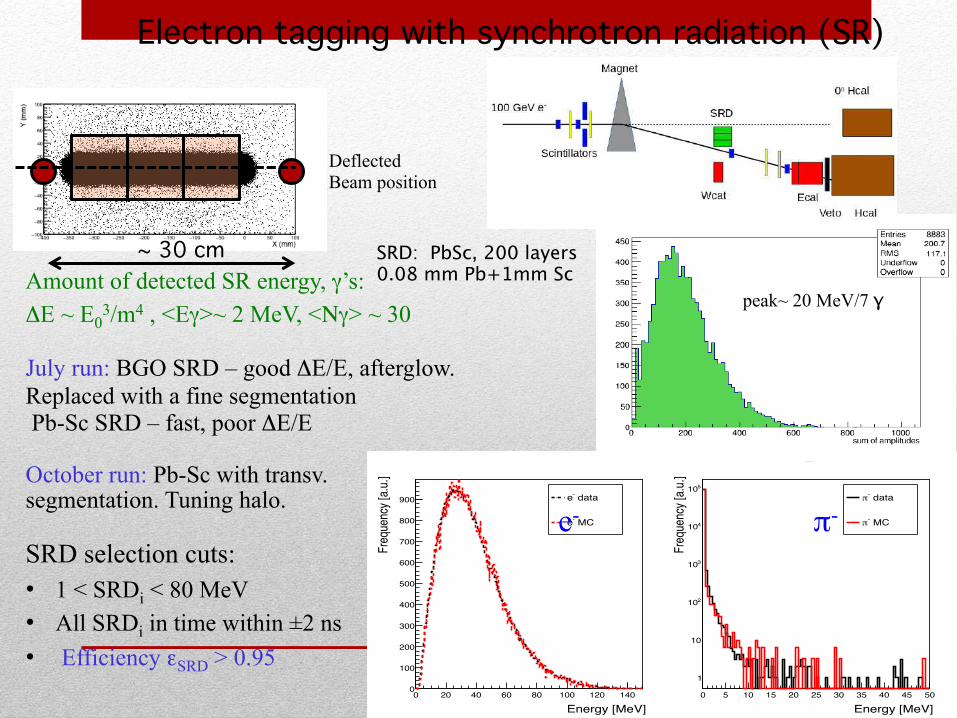
Electron tagging with synchrotron radiation (SR)
SRD: PbSc, 200 layers 0.08 mm Pb+1mm Sc Amount of detected SR energy, γ’s:
ΔE ~ E03/m4 , <Eγ>~ 2 MeV, <Νγ> ~ 30
July run: BGO SRD – good ΔE/E, afterglow. Replaced with a fine segmentation Pb-Sc SRD – fast, poor ΔE/E October run: Pb-Sc with transv. segmentation. Tuning halo.
Deflected Beam position
~ 30 cm
peak~ 20 MeV/7 γ
Energy [MeV]0 20 40 60 80 100 120 140
Freq
uenc
y [a.u
.]
0
100
200
300
400
500
600
700
800
900 data-e
MC-e
Energy [MeV]0 5 10 15 20 25 30 35 40 45 50
Freq
uenc
y [a.u
.]1
10
210
310
410
510 data-π
MC-π
summ of all BGO cell Energy
SRD selection cuts: • 1 < SRDi < 80 MeV • All SRDi in time within ±2 ns • Efficiency εSRD > 0.95
e- π-
22.06.2018, NA64 meeting NA64 status and problems. VP 7
Problem 3. MM material, test with old and new MM detectors.
June 17: 2 MM in front of MBPL, MM3 and MM4run 4293:
S1 S2 S12-V Trig S1/S2 (S12-V)/S1Run 4293 Spill 137 3858316 3409572 3210997 11434 0.883 0.832Run 4293 Spill 138 3874025 3424227 3222988 11674 0.884 0.832Run 4293 Spill 139 3930295 3471826 3269059 11646 0.883 0.832
run 999994: 2 MM in front of MBPL, MM1 and MM4S1 S2 S12-V Trig S1/S2 (S12-V)/S1
Run 999994 Spill 40 3674821 3017946 2841095 11407 0.823 0.774Run 999994 Spill 41 3584836 2938217 2770653 11336 0.821 0.774Run 999994 Spill 42 3705989 3044221 2865168 11527 0.819 0.773
Need to test all MM detectors!

events with EECAL ≲ 60 GeV was ≲10−5=EOT served as abenchmark allowing to verify the detector performanceand as a reference for the background prediction. Theregions II shows the events from the SM hadron electro-production in the ECAL which satisfy the energy con-servation EECAL þ EHCAL ≃ 100 GeV within the detectorenergy resolution. The leak of these events to the signalregion mainly due to the HCAL energy resolution wasfound to be negligible. The fraction of events from theregion III was due to pileup of e− and beam hadrons. It wasbeam rate dependent with a typical value from about a few% up to ≃20%.
V. DIMUON EVENTS FROM THE REACTIONe −Z → e−Zμ+ μ−
To evaluate the performance of the setup, a cross-checkbetween a clean sample of ≳104 observed and MCsimulated μþμ− events was made. The process (16) wasused as a benchmark allowing to verify the reliability of theMC simulation and to estimate the corrections to the signalreconstruction efficiency and possible additional uncertain-ties in the A0 yield calculations. Let us first briefly reviewthe description of the gamma conversion into a muon-antimuon pair implemented in Geant4. The dimuon pro-duction was also used as a reference for the prediction ofbackground, see Sec. VIII.
A. Simulation of dimuon events
The dimuon production has been simulated with Geant4[50] and a code developed byNA64 used also for simulationof dark photon production [46]. Here, we report ourcomparison with data based mostly on Geant4 simulationfor decays and propagation of muons through the detectors.However, we anticipate that comparison of dimuon resultswith the NA64 code will follow in the future, as it will be animportant additional cross-check of theA0 yield calculationsreported in this work and in Ref. [54].The gamma conversion into a muon-antimuon pair
γZ → μþμ−Z ð17Þ
on nuclei is a well known reaction in particle physics(Bethe-Heitler process). The simulation of this reaction inGeant4 is based on the differential cross section forelectromagnetic creation of muon pairs on nuclei ðA; ZÞin terms of the energy fraction of muons [64,65]:
dσdxþ
¼ 4αZ2r2μ
!1 −
4
3xþx−
"logðWÞ; ð18Þ
where xþ ¼ Eμþ
Eγ, x− ¼ Eμ−
Eγ, α ¼ 1
137 and rμ ¼ αmμ
is the
classical radius of muon and
0 20 40 60 80 100, GeVECALE
0
20
40
60
80
100
120
, GeV
HC
AL
E
1
10
210
310
410
510
III
I
II
0 20 40 60 80 100, GeVECALE
0
20
40
60
80
100
120
, GeV
HC
AL
E
1
10
210
310
0 20 40 60 80 100, GeVECALE
0
20
40
60
80
100
120
, GeV
HC
AL
E
1
10
B
C
A
0 20 40 60 80 100, GeVECALE
0
20
40
60
80
100
120
, GeV
HC
AL
E
1
10
210
310
410
510
III
I
II
0 20 40 60 80 100, GeVECALE
0
20
40
60
80
100
120
, GeV
HC
AL
E
, GeV
HC
AL
E
1
10
210
310
0 20 40 60 80 100, GeVECALE
0
20
40
60
80
100
120
1
10
B
C
A
FIG. 7. Event distribution in the (EECAL; EHCAL) plane from the runs II(top row) and III (bottom row) data. The left panels show themeasured distribution of events at the earlier phase of the analysis. Plots in the middle show the same distribution after applying allselection criteria, but the cut against upstream interactions. The right plots present the final event distributions after all cuts applied. Thedashed area is the signal box region which is open. The side bands A and C are the one used for the background estimate inside the signalbox. For illustration purposes the size of the signal box along EHCAL-axis is increased by a factor five.
D. BANERJEE et al. PHYS. REV. D 97, 072002 (2018)
072002-8
D. BANERJEE et al. PHYS. REV. D 97, 072002 (2018)
W ¼ W∞1þ ðDn
ffiffiffie
p−2Þδ=mμ
1þ BZ−1=3 ffiffiffie
pδ=me
; ð19Þ
where W∞ ¼ BZ−1=3
Dn
mμ
me, δ ¼ m2
μ
2Eγxþx−,
ffiffiffie
p¼ 1.6487. For
hydrogen the values B ¼ 202.4 and Dn ¼ 1.49 are used.For other nuclei those are B ¼ 183 and Dn ¼ 1.54A0.27.Here, A is the atomic number of the nuclei. The differentialcross section is symmetric in xþ and x−, and a relation is
xþx−¼ x% −x2% ð20Þ
takes place. The differential cross section (18) can berewritten in the form
1
σ0
dσdx
¼"1−
4
3ðx−x2Þ
#logWlogW∞
; ð21Þ
Here x¼ xþ or x¼ x−. The total cross section wasobtained by integration of the differential cross section,namely
σtotðEγÞ ¼Z
xmax
xmin
dσdxþ
dxþ; ð22Þ
where xmax¼ 12þ
ffiffiffiffiffiffiffiffiffiffi14−
mμ
Eγ
q, xmin ¼ 1
2 −ffiffiffiffiffiffiffiffiffiffiffiffi14 −
mμ
Eγ
q. Numerically
for Pb nuclei σtot ¼ 30.2; 334; 886 μb for Eγ ¼ 1, 10,100 GeV, respectively.Note, that formula (18) for the cross section was obtained
from the tree level formula for the differential cross sectionγZ → μþμ−Z by taking into account both the atomic andnuclear form-factors and without using the WW approxi-mation of equivalent photons. Even though the productionmechanisms of the A0 and μþμ− pair are different, thenumber of A0 and dimuon events, are both proportional tothe square of the Pb nuclear form factor Fðq2Þ andare sensitive to its shape. As the mass ðmA0 ≃mμÞ andq2 ðq≃m2
A0=EA0 ≃m2μ=EμÞ ranges of the final state for both
reactions are similar, the observed difference can beconsidered as due to the accuracy of the dimuon yieldcalculation for heavy nuclei.
B. Yield of dimuon events
The dimuon events were selected with the trigger (14),which accepted only events with the ECAL energy dep-osition smaller than ≃80 GeV. Because only muons canpunch through the total length of the modules HCAL1-3(≃21λint) without interactions, the selection was based onthe requirement of the energy deposited in HCAL1 andHCAL4 modules to be in the range 1≲ EHCAL1;4 ≲ 6 GeV,which is comparable with that expected from a single muonor dimuon pair. In Fig. 8 the distribution of selected dimuonevents in the (EECAL;EHCAL) plane is shown. Here, the
HCAL energy is defined as the total energy deposited in thefour HCAL modules.The dimuon yield was estimated from the observed
number of reconstructed dimuon events. The comparison ofthe number of observed (ndata2μ ) and predicted (nMC
2μ ) μþμ−
pairs and the corresponding reconstruction efficiency (ndata2μ
nMC2μ)
is shown in Table I. One can see, that the reconstructionefficiency of μþμ− pairs were found to be beam ratedependent. The difference between the number of observedand MC predicted μþμ− events with EECAL ≲ 60 GeV isthe range 8%–19%. It can be interpreted as due to theinaccuracy of the dimuon yield determination for heavynuclei target and, can be conservatively accounted for as anadditional reduction factor f of the signal efficiency, whichdepends on the beam intensity. The uncertainty in thisfactor includes uncertainty due to the difference of theECAL energy spectra for dimuon and A0 events which istaken into account by the reweighting procedure discussedbelow in Sec. VI.
C. The HCAL and ECAL energy distributions
An example illustrating good agreement between dis-tributions of energy deposited by μþμ− in the HCALmodule 2, for the data and MC is shown in Fig. 9. Onthe right panel of the plot one can see a small peak at≃2.5 GeV from single muons originated from events when
ECAL Energy, GeV
0 20 40 60 80 100
HC
AL
Ene
rgy,
GeV
0
20
40
60
80
100
120
140
160
0
1
2
3
4
5
6
-µ+µ→γ;γZ- e→Z-e
FIG. 8. Selected dimuon events in the ðEECAL;EHCALÞ plane.
TABLE I. Dimuon selection efficiency for the data samplesfrom the runs I–III obtained at different beam intensity forEECAL < 60 GeV.
Datasample
beamintensity,
106nEOT,106 nMC
2μ ndata2μ
Efficiencyreductionfactor f
run I 1.8 171 1223 1124 0.92run II 3.2 208.5 1491 1268 0.85run III 4.6 597 4271 3417 0.81
SEARCH FOR VECTOR MEDIATOR OF DARK MATTER … PHYS. REV. D 97, 072002 (2018)
072002-9

corresponding mixing strength ϵ were determined from the90% C.L. upper limit for the expected number of signalevents,N90%
A0 by using the modified frequentist approach forconfidence levels (C.L.), taking the profile likelihood as atest statistic in the asymptotic approximation [70–72]. Thetotal number of expected signal events in the signal box wasthe sum of expected events from the three runs:
NA0 ¼X3
i¼1
NiA0 ¼
X3
i¼1
niEOTϵitotniA0ðϵ; mA0 ;ΔEeÞ ð26Þ
where ϵitot is the signal efficiency in the run i given byEq. (23), and the niA0ðϵ; mA0 ;ΔEA0Þ value is the signal yieldper EOT generated by a single 100 GeV electron in theECAL target in the energy range ΔEe. Each ith entry in thissum was calculated by simulating the signal events forcorresponding beam running conditions and processingthem through the reconstruction program with the sameselection criteria and efficiency corrections as for the datasample from the run-i. The expected backgrounds andestimated systematic errors were also taking into account inthe limits calculation. The combined 90% C.L. exclusionlimits on the mixing strength as a function of the A0 masscan be seen in Fig. 15. In Table V the limits obtained withthe ETL and WW calculations for different mA0 valuesare also shown for comparison. One can see that thecorrections are mostly relevant in the higher mass regionmA0 ≳ 100 MeV. The derived bounds are the best for themass range 0.001≲mA0 ≲ 0.1 GeV obtained from directsearches of A0 → invisible decays [15].The limits were also calculated with a simplified method
by merging all three runs into a single run as describedpreviously by Eq. (26). The total error for the each Ni
A0
value includes the corresponding systematic uncertaintiescalculated by adding contributions from all sources inquadrature, see Sec. VII. In accordance with the CLsmethod [72], for zero number of observed events the90% C.L. upper limit for the number of signal events isN90%
A0 ðmA0Þ ¼ 2.3. Taking this and Eq. (26) into accountand using the relation NA0ðmA0Þ < N90%
A0 ðmA0Þ resulted inthe 90% C.L. limits in the (mA0 ; ϵ) plane which agreed withthe one shown in Fig. 15 within a few %.
X. CONSTRAINTS ON LIGHT THERMALDARK MATTER
As discussed previously, the possibility of the existenceof light thermal dark matter (LTDM) has been the subject of
FIG. 14. The sensitivity, defined as an average expected limit,as a function of the ECAL energy cut for the case of the A0
detection with the mass mA0 ≃ 20 (blue) and 2 (green) MeV.
FIG. 15. The NA64 90% C.L. exclusion region in the (mA0 ; ϵ)plane. Constraints from the BABAR [39], E787 and E949 experi-ments [34,35], as well as the muon αμ favored area are also shown.
Here, αμ ¼gμ−22 . For more limits obtained from indirect searches
and planned measurements see e.g., Ref. [13,14].
TABLE V. Comparison of upper bounds on mixing ϵ at90% CL obtained with WW and ETL calculations for the Pb-Sc ECAL target for Emiss > 0.5E0 at E0 ¼ 100 GeV.
mA0 ,MeV
90% C.L. upper limiton ϵ; 10−4, no k -factors
90% C.L. upper limiton ϵ; 10−4with k -factors
1.1 0.22 0.192 0.23 0.245 0.43 0.4916.7 1.25 1.3320 1.29 1.6100 5.5 8.2200 13.0 22.6500 38.7 97.8950 94.20 362.0
SEARCH FOR VECTOR MEDIATOR OF DARK MATTER … PHYS. REV. D 97, 072002 (2018)
072002-17
D. BANERJEE et al. PHYS. REV. D 97, 072002 (2018)

visible matter, transmitted by a new vector boson A0 (darkphoton) might exist [13,14]. Such A0 could have a massmA0 ≲ 1 GeV, associated with a spontaneously brokengaugedUð1ÞD symmetry, and would couple to the standardmodel through kinetic mixing with the ordinary photon,− 1
2 ϵFμνA0μν, parametrized by the mixing strength ϵ ≪ 1[15–17]. For a review see, e.g., Refs. [4,18,19]. A numberof previous beam dump [20–34], fixed target [35–37],collider [38–40], and rare particle decay [41–53] experi-ments have already put stringent constraints on the massmA0 and ϵ of such dark photons excluding, in particular, theparameter space region favored by the gμ − 2 anomaly.However, the range of mixing strengths 10−4 ≲ ϵ≲ 10−3
corresponding to a short-lived A0 still remains unexplored.In this Letter we report the first results from the NA64experiment specifically designed for a direct search of theeþ e− decays of new short-lived particles in the sub-GeVmass range at the CERN Super Proton Synchrotron (SPS)[54–57].The method of the search for A0 → eþ e− decays is
described in Refs. [54,55]. Its application to the case of theX → eþ e− decay is straightforward. Briefly, a high-energyelectron beam is sent into an electromagnetic (e.m.)calorimeter that serves as an active beam dump.Typically the beam electron loses all its shower energyin the dump. If the A0 exists, due to the A0ðXÞ − e− couplingit would occasionally be produced by a shower electron (orpositron) in its scattering off a nuclei of the dump:
e− þ Z → e− þ Z þ A0ðXÞ; A0ðXÞ → eþ e−: ð1Þ
Since the A0 is penetrating and longer lived, it would escapethe beam dump, and subsequently decays into an eþ e− pairin a downstream set of detectors. The pair energy would beequal to the energy missing from the dump. The apparatusis designed to identify and measure the energy of the eþ e−
pair in another calorimeter (ECAL). Thus, the signature ofthe A0ðXÞ → eþ e− decay is an event with two e.m.-likeshowers in the detector: one shower in the dump, and
another one in the ECAL with the sum energy equal to thebeam energy.The NA64 setup is schematically shown in Fig. 1. The
experiment employs the optimized 100 GeVelectron beamfrom the H4 beam line in the North Area (NA) of the CERNSPS. Two scintillation counters, S1 and S2, were used forthe beam definition, while the other two, S3 and S4, wereused to detect the eþ e− pairs. The detector was equippedwith two dipole magnets and a tracker, which was a set offour upstream Micromegas (MM) chambers (T1, T2) forthe incoming e− angle selection and two sets of down-stream MM, gas electron multiplier (GEM) stations, andscintillator hodoscopes (T3, T4) for measurements of theoutgoing tracks [58,59]. To enhance the electron identi-fication, the synchrotron radiation (SR) emitted by elec-trons was used for their tagging allowing us to suppress theinitial hadron contamination in the beam π=e− ≃10−2
down to the level ≃10−6 [57,60]. The use of SR detectors(SRD) was a key point for the improvement of thesensitivity compared to the previous electron beam dumpsearches [24,25]. The dump was a compact e.m. calorim-eter WCAL made as short as possible to maximize thesensitivity to short lifetimes while keeping the leakage ofparticles at a small level. It was followed by the ECAL tomeasure the energy of the decay eþ e− pair, which was amatrix of 6 × 6 shashlik-type modules [57]. The ECAL has≃40 radiation lengths (X0) and is located at a distance≃3.5 m from the WCAL. Downstream of the ECAL thedetector was equipped with a high-efficiency veto counter,V3, and a hermetic hadron calorimeter (HCAL) [57] usedas a hadron veto and for muon identification with a help offour muon counters, MU1–MU4, located between theHCAL modules. The results reported here were obtainedfrom data samples in which 2.4 × 10¹⁰ electrons on target(EOT) and 3 × 10¹⁰ EOTwere collected with the WCAL of40 X0 (with a length of 290 mm) and of 30 X0 (220 mm),respectively. The events were collected with a hardwaretrigger requiring in-time energy deposition in the WCALand EWCAL ≲ 70 GeV. Data of these two runs (hereaftercalled the 40 X0 and 30 X0 run) were analyzed with similar
FIG. 1. Schematic illustration of the NA64 setup to search for the A0, X → eþ e− decays.
PHYSICAL REVIEW LETTERS 120, 231802 (2018)
231802-2
selection criteria and finally summed up, taking intoaccount the corresponding normalization factors. For themass range 1 ≤ mA0 ≤ 25 MeV and energy EA0 ≳ 20 GeV,the opening angleΘeþe− ≃ 2mA0=EA0 ≲ 2 mrad of the decayeþe− pair is too small to be resolved in the tracker T3-T4,and the pairs are mostly detected as a single-track e.m.shower in the ECAL.The candidate events were selected with the following
criteria chosen to maximize the signal acceptance andminimize background, using both GEANT4[61,62] basedsimulations and data. (i) There should be only one trackentering the dump. No cuts on reconstructed outgoingtracks were used. (ii) No energy deposition in the V2counter exceeding about half of the energy deposited bythe minimum ionizing particle (MIP). (iii) The signal in thedecay counter S4 is consistent with two MIPs. (iv) Thesum of energies deposited in the WCAL and ECAL,Etot ¼ EWCAL þ EECAL, is equal to the beam energy withinthe energy resolution of these detectors. According tosimulations, at least 30% of the total energy should bedeposited in the ECAL [63,64]. (v) The showers in theWCAL and ECAL should start to develop within a few firstX0. (vi) The lateral and longitudinal shape of the shower inthe ECAL are consistent with a single e.m. one. However,for A0s with the energy ≲5 GeV, the ECAL shower ispoorly described by the single shower shape; hence, theadditional cut EECAL > 5 GeV was applied. (vii) No sig-nificant energy deposited in the V3and/or HCAL. Thesecuts were used for rejection of events with hadrons in thefinal state. As in the previous analyses [56,57], a cleansample of ≃105 rare μþμ− events produced in the dump wasused for the efficiency corrections in the simulations, whichdo not exceed 20%. A blind analysis of data wasperformed, with the signal box defined as 90 < Etot <110 GeV and by using 20% (100%) of the data for theselection criteria optimization (background estimate).There are several processes that can fake the A0 → eþe−
signal. Among them, the two most important were expectedeither from decay chain K0
S → π0π0; π0 → γeþe− of K0S
produced in the WCAL or from the γ → eþe− conversionof photons from K0
S → π0π0 → π0 → γγ decays in the T3plane or earlier in the beam line. Another background couldcome from the K0
S → πþπ− hadronic decays that could bemisidentified as an e.m. event in the ECAL at the level≲2.5 × 10⁻⁵ evaluated from the measurements with thepion beam. The leading K0 can be produced in the dumpeither by misidentified beam π−, K− or directly byelectrons. The background from the K0
S decay chain wasestimated by using the direct measurements of the K0
S fluxfrom the dump with the following method. It is well knownthat the K0 produced in hadronic reactions is a linearcombination of the short- and long-lived componentsjK0i ¼ ðjK0
Siþ jK0LiÞ=
ffiffiffi2
p. The flux of K0 was evaluated
from the measured ECALþ HCAL energy spectrum of
long-lived neutral hadrons selected with the requirement ofno signal in V2 and S4, taking into account corrections dueto the K0
S decays in flight. The main fraction of ≃103eventsobserved in the HCAL were neutrons produced in the sameprocesses as K0 in the WCAL. According to simulations,≲10% of them were predicted to be other neutral hadrons,i.e., Λ and K0, that were also included in the data sample.The conservative assumption that ≃100 K0 were producedallows us to calculate the number of K0
S from the dump andsimulate the corresponding background from the K0
S →πþπ− and K0
S → π0π0; π0 → γeþe− decay chain, whichwas found to be ≲0.04 events per 5.4× 10¹⁰ EOT. Tocross-check this result, another estimate of this backgroundwas used. The true neutral e.m. events, which are presum-ably photons, were selected with requirements of nocharged tracks, i.e., no signals in V2 and S4 counters,plus a single e.m.-like shower in the ECAL defined by cuts(v)–(vii). Three such events were found in the signal box asshown in Fig. 2. Using simulations we calculated that therewere ≃150 leading K0 produced in the dump, which is inreasonable agreement with the previous estimate resultingin a conservative K0
S background of 0.06 events. The μ, π,and K mistakenly tagged as e−’s [60] could also interact inthe dump though the μZ → μZγ or π, K charge-exchangereactions, accompanied by the poorly detected scattered μ,or secondary hadrons. The misidentified pion could mimicthe signal either directly (small fraction of showers thatlook like an e.m. one) or by emitting a hard bremsstrahlungphoton in the last layer of the dump, which then producesan e.m. shower in the ECAL, accompanied by the scatteredpion track. Another background can appear from the beamπ → eν decays downstream of the WCAL. The latter twobackgrounds can pass the selection only due to the V2inefficiency (≃10−4), which makes them negligible. Thecharge-exchange reaction π−p → ð≥ 1Þπ0 þ nþ % % %,which can occur in the last layers of the WCAL with
Energy in WCAL [GeV]0 20 40 60 80 100 120
Ene
rgy
in E
CA
L [G
eV]
0
20
40
60
80
100
120
FIG. 2. Distribution of selected e.m. neutral (presumablyphoton) and signal events in the (EWCAL; EECAL) plane fromthe combined 30 X0 and 40 X0 runs. Neutral e.m. events areshown as blue squares. The only signal-like event is shown as ared square. The dashed band represents the signal box.
PHYSICAL REVIEW LETTERS 120, 231802 (2018)
231802-3
decay photons escaping the dump without interactions andaccompanied by poorly detected secondaries, is anothersource of fake signal. To evaluate this background we usedthe extrapolation of the charge-exchange cross sections,σ ∼ Z2=3, measured on different nuclei [65]. The contributionfrom the beam kaon decays in flight,K− → e−νπþπ−ðKe4Þ,and dimuon production in the dump e−Z → e−Zμþμ− witheither πþπ− or μþμ− pairs misidentified as e.m. event in theECAL was found to be negligible.Table I summarizes the conservatively estimated back-
ground inside the signal box, which is expected to be0.07 $ 0.034 events per 5.4× 10¹⁰ EOT. The dominantcontribution to background is 0.06 events from the K0
Sdecays, with the uncertainty dominated by the statisticalerror. In Fig. 2, the final distributions of e.m. neutral events,which are presumably photons, and signal candidate eventsthat passed the selection criteria (i)–(iii) and (v)–(vii) areshown in the (EECAL; EWCAL) plane. No candidates arefound in the signal box. The conclusion that the back-ground is small is confirmed by the data.The combined 90% confidence level (C.L.) upper limits
for the mixing strength ϵ were obtained from the corre-sponding limit for the expected number of signal events,N90%
A0 , by using the modified frequentist approach, takingthe profile likelihood as a test statistic [66–68]. The NA0
value is given by the sum
NA0 ¼X2
i¼ 1
NiA0 ¼
X2
i¼ 1
niEOTϵitotniA0ðϵ; mA0Þ; ð2Þ
where ϵitot is the signal efficiency in the run i (30 X0 or 40X0), and niA0ðϵ; mA0Þ is the number of the A0 → eþe− decaysin the decay volume with energy EA0 > 30 GeV per EOT,calculated under the assumption that this decay mode ispredominant; see, e.g., Eq. (3.7) in Ref. [55]. Each ith entryin this sum was calculated by simulating signal events forthe corresponding beam running conditions and processingthem through the reconstruction program with the sameselection criteria and efficiency corrections as for the datasample from the run i. The A0 efficiency and its systematicerror were determined to stem from the overall
normalization, A0 yield, and decay probability, which werethe A0 mass dependent, and also from efficiencies andtheir uncertainties in the primary e−ð0.85$ 0.02Þ,WCALð0.93$ 0.05Þ, V2ð0.96$ 0.03Þ, ECALð0.93$ 0.05Þ,V3ð0.95$ 0.04Þ, and HCALð0.98 $ 0.02Þ event detection.The latter, shown as example values for the 40 X0 run, weredetermined from measurements with the e− beam cross-checked with simulations. A detailed simulation of the e.m.shower in the dump [63] with A0 cross sections was used tocalculate the A0 yield [64,69,70]. The ≲10% differencebetween the calculations in Ref. [64] and Refs. [69,70] wasaccounted for as a systematic uncertainty in nA0ðϵ; mA0Þ. Inthe overall signal efficiency for each run, the acceptance lossdue to pileup (≃7% for 40X0 and≃10% for 30X0 runs) wastaken into account and cross-checked using reconstructeddimuon events [57]. The dimuon efficiency corrections(≲20%) were obtained with uncertainty of 10% and 15%,for the 40 X0 and 30 X0 runs, respectively. The totalsystematic uncertainty on NA0 calculated by adding allerrors in quadrature did not exceed 25% for both runs.The combined 90%C.L. exclusion limits on the mixing ϵ asa function of the A0 mass is shown in Fig. 3 together with thecurrent constraints from other experiments. Our resultsexclude the X boson as an explanation for the 8Be anomalyfor the X − e− coupling ϵe ≲4.2 × 10⁻⁴and mass value of
TABLE I. Expected numbers of background events in thesignal box estimated for 5.4× 10¹⁰ EOT.
Source of background Events
eþe− pair production by punchthrough γ < 0.001K0
S → 2π0; π0 → γeþe−; γ→ eþe−; K0S → πþπ− 0.06$ 0.034
πN→ ð≥ 1Þπ0þnþ&& &; π0 → γeþe−; γ → eþe− 0.01 $ 0.004π− bremsstrahlung in the WCAL, γ → eþe− < 0.0001π; K → eν, Ke4 decays < 0.001eZ → eZμþμ−; μ$ → e$ νν < 0.001Punchthrough π < 0.003
Total 0.07 $ 0.035
FIG. 3. The 90% C.L. exclusion areas in the (mX; ϵ) plane fromthe NA64 experiment (blue area). For the mass of 16.7 MeV, theX − e− coupling region excluded by NA64 is 1.3 × 10⁻⁴<ϵe < 4.2 × 10⁻⁴. The allowed range of ϵe explaining the 8Beanomaly (red area) [2,3], constraints on the mixing ϵ from theexperiments E141 [22], E774 [25], BABAR [40], KLOE [45],HADES [47], PHENIX [48], NA48 [50], and bounds from theelectron anomalous magnetic moment ðg − 2Þe [71] are alsoshown.
PHYSICAL REVIEW LETTERS 120, 231802 (2018)
231802-4
Search for a Hypothetical 16.7 MeV Gauge Boson and Dark Photons in the NA64 Experiment at CERN PHYSICAL REVIEW LETTERS 120, 231802 (2018)
NA64 VISUAL MODE