the details of real-time report carding through …
TRANSCRIPT

THE DETAILS OF REAL-TIME REPORT CARDING THROUGH LOUISIANA’S
COASTWIDE REFERENCE MONITORING SYSTEM
Sarai Piazza, Marc Comeaux, Craig Conzelmann, & Dona Weifenbach
CEER – July 30, 2014
CRMS -

Restoration project types: vegetative planting, shoreline protection, sediment and nutrient trapping, marsh creation, hydrologic restoration, and diversions of freshwater and sediments
Coastwide Reference Monitoring System - Wetlands Coastal Wetlands Planning, Protection and Restoration Act Program
• CWPPRA was congressionally funded in 1990 and mandated 20 years of restoration project monitoring • CWPPRA program uses multiple restoration techniques
- size and types of projects vary
• Initially the program used paired project & reference sites
-difficult to find “uninfluenced” reference
• Inconsistent monitoring variables and collection frequencies across projects with short data records

• To improve our ability to determine the effectiveness of individual coastal restoration projects.
• Provide information to evaluate coastal wetlands at the project, basin, and coastwide scales.
• To determine the ecological condition of coastal wetlands to ensure that the strategic coastal planning is effective in recreating a sustainable coastal ecosystem.
Coastwide Reference Monitoring System - Wetlands Purpose

Coastwide Reference Monitoring System - Wetlands CRMS Design and Assessment
Questions to address through CRMS:
Did the restoration program: - reduce coastal wetland loss? - sustain a diversity of vegetation types within basins? Is the restoration program effective in reducing major stressors on wetlands (i.e., flooding regime, salinity, elevation change)? Which project types are the most effective in creating, restoring, protecting and enhancing wetlands?
• ~ 390 CRMS sites
• Funded by CWPPRA in 2003
• Long-term dataset (2006-2019) • 10 real-time hydro • Sites inside & outside of CWPPRA projects • Sites in swamp, fresh, intermediate, brackish, and salt marsh
• Allows for multi-scale assessments through CRMS report cards
• Data used for future scenario modeling
CRMS Sites
CRMS REAL-TIME Hydro Sites

Spatial data collection
Non-spatial data collection
200 m X 200 m
1km
1km
2m X 2m Vegetation station Rod Surface Elevation Table (RSET)
Hydro datasonde Boardwalk
Accretion station
200m
200m
WATER
MARSH
Coastwide Reference Monitoring System - Wetlands Site Design
Typical Marsh Site
Typical Swamp Site

Data Type Parameter Method Scale Frequency
Land change
Land:Water Ratio Satellite Imagery Hydrologic Basin 3 years
Land:Water Ratio Digital Aerial Photography CRMS Site (1 km2) 3 years
Vegetation Emergent Vegetation
Braun Blanquet: % Cover, Species Richness, Height of Dominant Species
(10) 2m x 2m plots per marsh site or (9) plots per swamp sites
Annually during peak biomass
Forested Vegetation DBH, Canopy Cover, Understory veg
(3) 20m x 20m Forested plots & (9) 6m X6m Understory plots per site
3 yrs during peak biomass
Soils Soil Characteristics
Core samples profiled into 4 cm increments to 24 cm. Bulk Density, OM%, Soil Salinity, pH, and Moisture.
3 cores, 18 archived samples per site 6 to 10 years
Vertical Accretion Feldspar Plots/Cryogenic Cores 3 plots per site Bi-annually
Marsh Elevation Change
Rod Surface Elevation Table (RSET) 4 directions per site Bi-annually
Hydrology Soil Porewater 10 and 30 cm syringe sippers
3 samples per depth per site and at vegetation plots
Variable and annually
Surface Water Salinity, Temp and Water Level Submersible Data Logger
in available water within 200 m of CRMS Site or in a well Hourly
Coastwide Reference Monitoring System - Wetlands Site Data Collection

State and federal scientists Academics Software & computer engineers
Vegetation
Hydrology Data Delivery
Landscape Soils CRMS Analytical
Teams
Coastwide Reference Monitoring System - Wetlands CRMS Analytical Teams
Create user friendly mapping viewer
Provide user defined graphics & tools
Simplify querying & downloading of data
Develop multi-metric ecological indices
Develop report card

Coastwide Reference Monitoring System - Wetlands CRMS Website
www.lacoast.gov/crms
• CWPPRA (1990) and CRMS (2006) data
• Programmatic documents
• Derived data &
products • Continually
evolving

Coastwide Reference Monitoring System - Wetlands Data Delivery and Visualization Tools
• Alternative to a GIS based mapping environment
• Displays data layers and tools

• General site information, data availability, and summaries
• Graphs and data are downloadable
• Displays site specific index scores and site report card
Coastwide Reference Monitoring System - Wetlands Site Level Information
CRMS0553 2012 Report Card

• Visualize project boundaries & infrastructure
• Project summary information & reports
• Data summaries & graphing
• Project report cards
Coastwide Reference Monitoring System - Wetlands CWPPRA Project Info

• Near mouth of MS River
• Outfall management & sediment trapping
• 1,305 acres • Reintro of
alluvial sediments through crevasses & sediment trapping with terraces
• $3 milllion • Constructed in
Fall 2006
Coastwide Reference Monitoring System - Wetlands Delta Management at Fort St. Philip
CRMS0139

Coastwide Reference Monitoring System - Wetlands Visualizations
Charting: • Individual charts • Site, multi-station, project Bulk Charting: • Generate & download sets of charts • Custom colors Data Download: • Download derived values Reporting: • CRMS report cards (multi-scale) • CWPPRA Project reports
Visualization/Charting

Coastwide Reference Monitoring System - Wetlands Report Carding
• Dynamic document • Nightly data sync • Downloadable .pdf file
7/24/14

Coastwide Reference Monitoring System - Wetlands Overview of Report Card Indices
FQI
HI
• Floristic quality, hydrologic, submergence vulnerability
• Developed using CRMS dataset
• Good (>75%), fair (25-50%), poor (<25%)
• Category thresholds vary by index

FQI’s are used to determine wetland quality based on plant species composition and are developed for specific geographic areas of interest.
1. Coefficient of Conservatism (CC score) assigned based on species’ tolerance to
disturbance and fidelity to a habitat.
2. FQI scores from 0 – 100 calculated for each station: When sum of species cover at a CRMS vegetation station at time t is ≤ 100:
3. Individual station level FQI scores are averaged to obtain the site level FQI score Cretini, K.F., Visser, J.M., Krauss, K.W., and Steyer, G.D. (2012) Development and use of floristic quality index for coastal Louisiana marshes. Environmental Monitoring and Assessment 184:2389-2403.
( )10
100mod ×
×=
∑ iit CCCOVERFQI t
CC score
Description
0 Invasive plant species 1–3 Plants that are opportunistic users of disturbed sites 4–6 Plants that occur primarily in less vigorous coastal wetland communities 7–8 Plants that are common in vigorous coastal wetland communities 9–10 Plants that are dominants in vigorous coastal wetland communities
Coastwide Reference Monitoring System - Wetlands Floristic Quality Index Development
Coastwide Reference Monitoring System - Wetlands Veg Site Scale Assessment
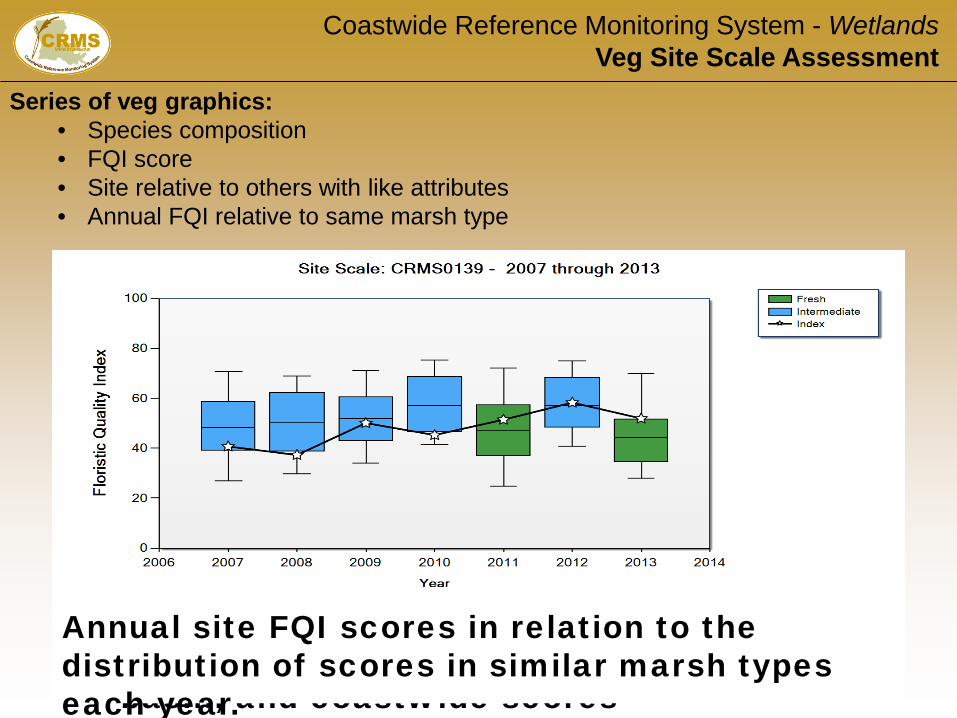
Series of veg graphics: • Species composition • FQI score • Site relative to others with like attributes • Annual FQI relative to same marsh type
Annual FQI and species composition Site FQI relative to similar marsh type, basin, and coastwide scores
Annual site FQI scores in relation to the distribution of scores in similar marsh types each year.

• HI represents % of max veg productivity given site specific % time flooded & salinity.
• The HI score is weighted according to seasonal productivity rates for each marsh type. • Index surfaces were created for each vegetation type.
Coastwide Reference Monitoring System - Wetlands Hydrologic Index Development
Snedden, G.A., and Swenson, E.M. (2012) Hydrologic index development and application to selected Coastwide Reference Monitoring System sites and Coastal Wetlands Planning, Protection, and Restoration Act projects. USGS Open-File Report 2012–1122, 25 p.
HI=89

Coastwide Reference Monitoring System - Wetlands Hydro Site Scale Assessment
Series of hydro graphics: • HI represents % of max veg productivity given site specific % time flooded & salinity • Site relative to others with like attributes • Annual HI relative to same marsh type
Annual HI scores in relation to the distribution of scores in similar marsh types each year.
Site HI score relative to similar marsh type, basin, and coastwide scores.

• Rod-Surface Elevation Table - Cumulative Elevation Change
• Feldspar Marker Horizon - Vertical Accretion
• Shallow Subsidence = Accretion – Elevation Change
• Water Elevation
• Local Relative Water Level Trend - Shallow Subsidence + ESLR
D.R. Cahoon, http://www.usgs.pwrc.gov/set
Coastwide Reference Monitoring System - Wetlands Submergence Vulnerability Index Development

Elev
atio
n (c
m N
AVD
88)
Time (+5 years)
Water b0
Water a0
Coastwide Reference Monitoring System - Wetlands Submergence Vulnerability Index Development
Stagg, C.L., Sharp, L.A., McGinnis, T.E., and Snedden, G.A. (2013) Submergence Vulnerability Index development and application to Coastwide Reference Monitoring System sites and Coastal Wetlands Planning, Protection and Restoration Act projects. USGS Open-File Report 2013–1163.
• Model assesses the vulnerability of a site to submergence based on elevation relative to local water level.
• Historic site specific data are used to predict trajectories of wetland elevation and water levels.

Elev
atio
n (c
m N
AVD
88)
Time (+5 years)
SVI S
core
0%
100%
Water b0
Water a0
Coastwide Reference Monitoring System - Wetlands Submergence Vulnerability Index Development
Stagg, C.L., Sharp, L.A., McGinnis, T.E., and Snedden, G.A. (2013) Submergence Vulnerability Index development and application to Coastwide Reference Monitoring System sites and Coastal Wetlands Planning, Protection and Restoration Act projects. USGS Open-File Report 2013–1163.
Less Flooding
More Flooding
Wetland0
SVI Score = 80
- Wetland Elevation Change
SVI Score = 10
• Model assesses the vulnerability of a site to submergence based on elevation relative to local water level.
• Historic site specific data are used to predict trajectories of wetland elevation and water levels.
• The position of the future wetland relative to the future water level determines the SVI score.

Coastwide Reference Monitoring System - Wetlands SVI Site Scale Assessment
Series of SVI graphics: • Site vulnerability to submergence based on it’s elevation relative to local water level • Site relative to others with like attributes
Site SVI relative to similar marsh type, basin, and coastwide scores

Coastwide Reference Monitoring System - Wetlands Overall Site Assessment

• BS-11 project site (blue) through time • Compares a project to sites within the same basin and marsh type
Coastwide Reference Monitoring System - Wetlands BS-11 Project, Basin, & Coastwide Assessment
Project Reference
BS-11
• Project (black), reference (white) • Mean scores for all sites within the basin and coastwide • Evaluate trajectories of change through time

Coastwide Reference Monitoring System - Wetlands Overall Assessment
• 2012 photography showing “sub-delta” formation
• Sub-aerial land forming • Land loss rate slowing?
2006 2011
High resolution aerial photo analysis Mod resolution satellite imagery
Layering CRMS data from different spatial scales helps resource managers evaluate projects

Data, visualizations, & report cards are dynamically available on the CRMS website. CRMS network contains 390+ sites with standardized data collection methods and data quality assurance. Data are current. The CRMS website and CRMS report card are evolving. The CRMS dataset is large and used for planning, monitoring, modeling, and research. Restoration project planning and assessment Louisiana’s Comprehensive Master Plan for a Sustainable Coast
Eco-hydrology, landscape change, elevation, vegetation, and storm surge modeling
Evaluation of episodic events (hurricanes, droughts, floods, oil spills)
Numerous research projects
Coastwide Reference Monitoring System - Wetlands Website, Visualizations, Data and Assessments

Questions?
Companion talk coming up next!
Using Coastal Monitoring Data to Build Dynamic Reports and Visualizations through the Coastwide
Reference Monitoring System Website
CRMS -

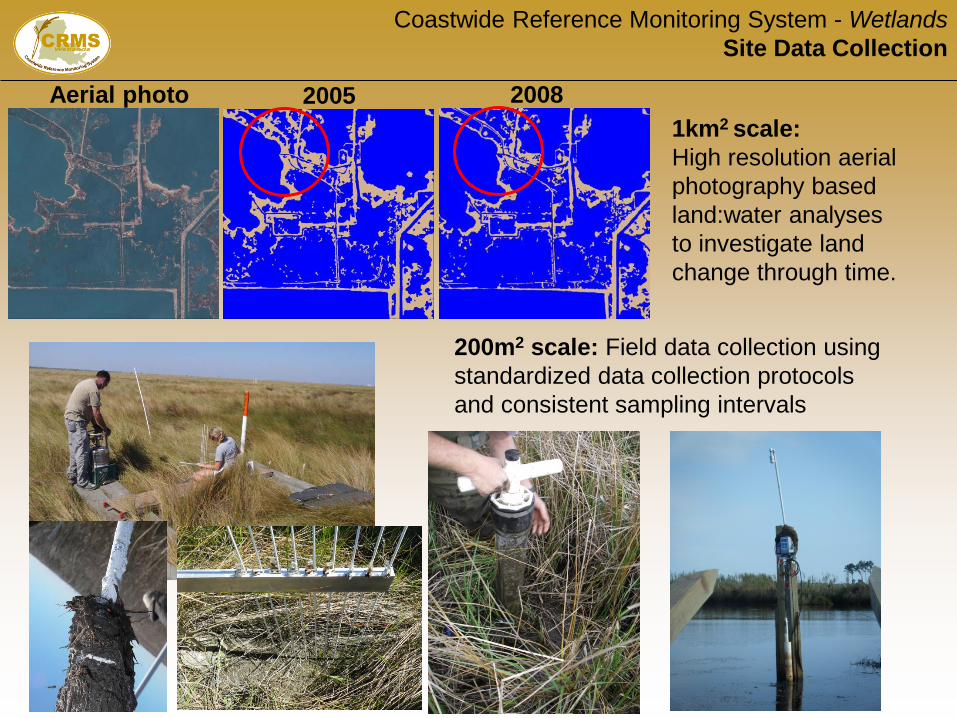
Coastwide Reference Monitoring System - Wetlands Site Data Collection
200m2 scale: Field data collection using standardized data collection protocols and consistent sampling intervals
1km2 scale:
High resolution aerial photography based land:water analyses to investigate land change through time.
Aerial photo 2005 2008

Project (black) and reference (white) mean scores for all sites within the basin and coastwide.
Coastwide Reference Monitoring System - Wetlands Basin and Coastwide Scale
HI is calculated for a water year with 70% site data completeness (Oct 1- Sept 30).

CRMS realtime gages - Isaac
Data from 10 CRMS realtime gages Peak WL: 1.12-8.84 (ft)
Diff WL from Aug-Sept 2011: 0.41-7.38 ft

Report card layout increases in spatial scale as it progresses Information to help evaluate condition and change through time
Coastwide Reference Monitoring System - Wetlands Veg Site Scale Assessment
Series of veg graphics:
• Species composition • FQI score • Site relative to others with like attributes • Annual FQI relative to same marsh type
Annual FQI and species composition Site FQI relative to similar marsh type, basin, and coastwide scores
Annual site FQI scores in relation to the distribution of scores in similar marsh types each year.