the detailed assessment of posttraumatic stress, 2nd
TRANSCRIPT

i
The Detailed Assessment of Posttraumatic Stress, 2nd Edition (DAPS-II):
Initial Psychometric Evaluation in a Trauma-Exposed Community Sample
by
Jessica Marie Petri
A thesis submitted to the Graduate Faculty of
Auburn University
In partial fulfillment of the
requirements for the Degree of
Master of Science
Auburn, Alabama
March 7, 2017
Keywords: PTSD, assessment, psychometrics
Copyright 2017 by Jessica Marie Petri
Approved by
Frank Weathers, Chair, Professor of Psychology
Tracy Witte, Associate Professor of Psychology
Joseph Bardeen, Assistant Professor of Psychology

ii
Abstract
The Detailed Assessment of Posttraumatic Stress (DAPS; Briere, 2001) is a comprehensive,
multiscale questionnaire that assesses all posttraumatic stress disorder (PTSD) diagnostic
criteria, as well as peritraumatic responses and associated problems including dissociation,
suicidality, and substance abuse. Although relatively few psychometric studies of the DAPS have
been conducted, DAPS scores have been shown to have excellent reliability, validity, and
clinically utility, performing as well or better than leading PTSD questionnaires. The DAPS was
recently revised for DSM-5 (American Psychiatric Association, 2013). The present study was an
initial psychometric evaluation of the DAPS for DSM-5 (DAPS-II) in a community sample with
mixed trauma exposure (N = 367). DAPS-II total PTSD scores demonstrated high internal
consistency (α = .98), strong convergent validity with the PTSD Checklist for DSM-5 (r = .91),
and good discriminant validity with other measures of trauma-related intrusions and avoidance,
dissociation, depression, anxiety, appetite gain, interpersonal needs, and well-being (rs = -.13 to
.75). DAPS-II associated features scales also demonstrated high internal consistency and good
convergent and discriminant associations. In confirmatory factor analyses the DSM-5 four-factor
model of PTSD provided adequate fit, but leading alternative six- and seven-factor models
(Armour, Mullerova, & Elhai, 2016) provided better fit. Taken together, these results indicate
that the DAPS-II is a psychometrically sound measure of DSM-5 PTSD symptoms and would be
a useful evidence-based tool in both research and clinical settings with diverse trauma
populations.

iii
Acknowledgements
I am indebted to the mentorship of Dr. Frank Weathers and Dr. Tracy Witte who inspire
excellence in science. I am grateful for the continued support and encouragement of my partner,
Vahab Rajaei.
iv
Table of Contents
Abstract .……………………………………………………………………………………….….ii
Acknowledgements ……………………………………………………………………………....iii
List of Tables ……………………………………………………………………………………..v
List of Abbreviations …………………………………………………………………………….vi
Introduction …………………………………………………………………………………….…1
Method ……………………………………...…………………………………………………….6
Participants and Procedure ..………………………………………………………………6
Measures …..…………………...………………………………………………….………8
Statistical Analyses ……………………………………………………………………....11
Results …………………………………………………………………………………………...13
Internal Consistency ……………………………………………………………………..13
Convergent and Discriminant Validity ………………………………………………..…13
Latent Factor Structure ……………………………………………………………..……15
Discussion …………………………………..…………………………………………………....16
References ……………………………………………………………………………………….23
Appendix …...……………………………………………………………………………………28

v
List of Tables
1. Scale-level descriptive statistics ……………….…………………………………………….28
2. Symptom mappings for confirmatory factor analysis (CFA) of PTSD factor structure ...…..31
3. DAPS-II convergent and discriminant validity correlations …………………………………33
4. Fit statistics for models of PTSD symptom structure using the DAPS-II (40 items) ………..34
5. Parameter estimates for the seven-factor hybrid model using the DAPS-II ……………...…35
6. Zero-order correlations among latent variables of the seven-factor hybrid model ………….37
7. Zero-order inter-item correlations between DAPS-II items …………………………………38
vi
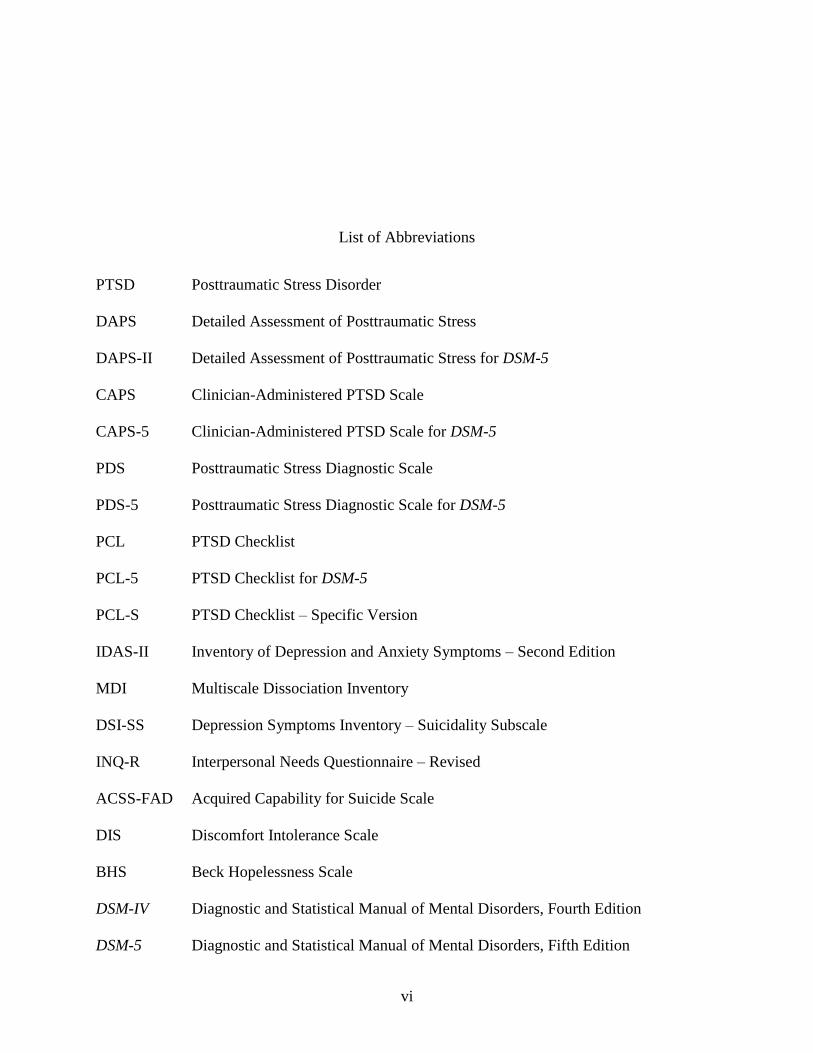
List of Abbreviations
PTSD Posttraumatic Stress Disorder
DAPS Detailed Assessment of Posttraumatic Stress
DAPS-II Detailed Assessment of Posttraumatic Stress for DSM-5
CAPS Clinician-Administered PTSD Scale
CAPS-5 Clinician-Administered PTSD Scale for DSM-5
PDS Posttraumatic Stress Diagnostic Scale
PDS-5 Posttraumatic Stress Diagnostic Scale for DSM-5
PCL PTSD Checklist
PCL-5 PTSD Checklist for DSM-5
PCL-S PTSD Checklist – Specific Version
IDAS-II Inventory of Depression and Anxiety Symptoms – Second Edition
MDI Multiscale Dissociation Inventory
DSI-SS Depression Symptoms Inventory – Suicidality Subscale
INQ-R Interpersonal Needs Questionnaire – Revised
ACSS-FAD Acquired Capability for Suicide Scale
DIS Discomfort Intolerance Scale
BHS Beck Hopelessness Scale
DSM-IV Diagnostic and Statistical Manual of Mental Disorders, Fourth Edition
DSM-5 Diagnostic and Statistical Manual of Mental Disorders, Fifth Edition
vii
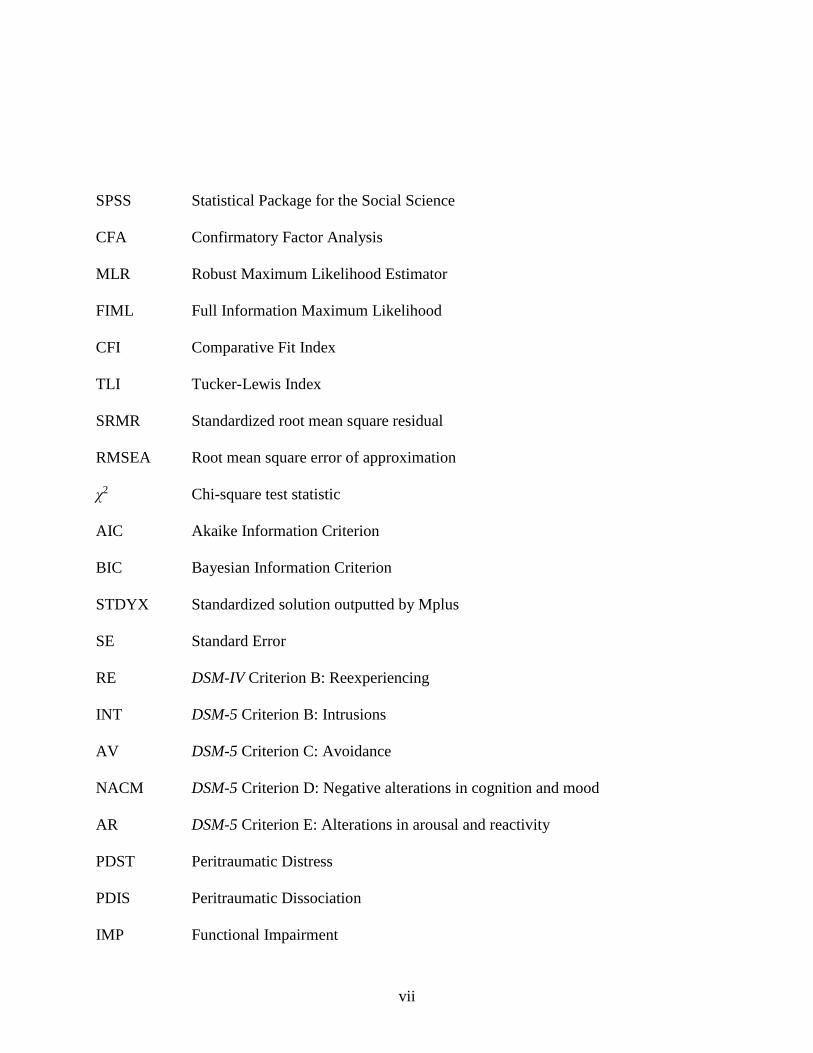
SPSS Statistical Package for the Social Science
CFA Confirmatory Factor Analysis
MLR Robust Maximum Likelihood Estimator
FIML Full Information Maximum Likelihood
CFI Comparative Fit Index
TLI Tucker-Lewis Index
SRMR Standardized root mean square residual
RMSEA Root mean square error of approximation
χ2 Chi-square test statistic
AIC Akaike Information Criterion
BIC Bayesian Information Criterion
STDYX Standardized solution outputted by Mplus
SE Standard Error
RE DSM-IV Criterion B: Reexperiencing
INT DSM-5 Criterion B: Intrusions
AV DSM-5 Criterion C: Avoidance
NACM DSM-5 Criterion D: Negative alterations in cognition and mood
AR DSM-5 Criterion E: Alterations in arousal and reactivity
PDST Peritraumatic Distress
PDIS Peritraumatic Dissociation
IMP Functional Impairment

viii
SUI Suicidality
T-DIS Trauma-related Dissociation
SUB Substance Use
PB Positive Bias
NB Negative Bias
EX Externalizing Behaviors
AN Anhedonia
DA Dysphoric Arousal
AA Anxious Arousal

1
Introduction
The Detailed Assessment of Posttraumatic Stress (DAPS; Briere, 2001) is a
comprehensive, multiscale questionnaire that assesses trauma exposure and trauma-related
symptomatology. Based on the posttraumatic stress disorder (PTSD) diagnostic criteria in the
fourth edition of the Diagnostic and Statistical Manual of Mental Disorders (DSM-IV; American
Psychiatric Association, 1994), the DAPS consists of 104 items divided into 13 scales assessing
trauma exposure, peritraumatic distress and dissociation, and core symptoms of posttraumatic
stress disorder (PTSD), as well as trauma-related functional impairment, associated problems
including dissociation, suicidality, and substance abuse, and positive and negative response bias.
The DAPS can be administered and scored by individuals with no specialized training, and a
clinical profile can be obtained in approximately 20 minutes. Additionally, DAPS items are
written at a sixth-grade reading level and DAPS scores are standardized by gender on trauma-
exposed adults from the general population, increasing its usefulness for a wide variety of
settings and individuals.
With its multiple scales and broad-spectrum approach, the DAPS was designed to address
limitations of widely used PTSD measures such as the PTSD Checklist (PCL; Weathers, Litz,
Herman, Huska, & Keane, 1993), which assesses only the core PTSD symptoms, and the
Posttraumatic Stress Diagnostic Scale (PDS; Foa, Cashman, Jaycox, & Perry, 1997), which goes
beyond the PCL only by also assessing trauma exposure and functional impairment. Further,
unlike the PCL and PDS, which contain one item per PTSD symptom, the DAPS contains two to
four items. These additional items provide multiple opportunities for respondents to endorse
complex or difficult to understand symptoms. This feature is particularly valuable in conducting
confirmatory factor analysis (CFA) of PTSD symptoms. All leading CFA models of PTSD
2
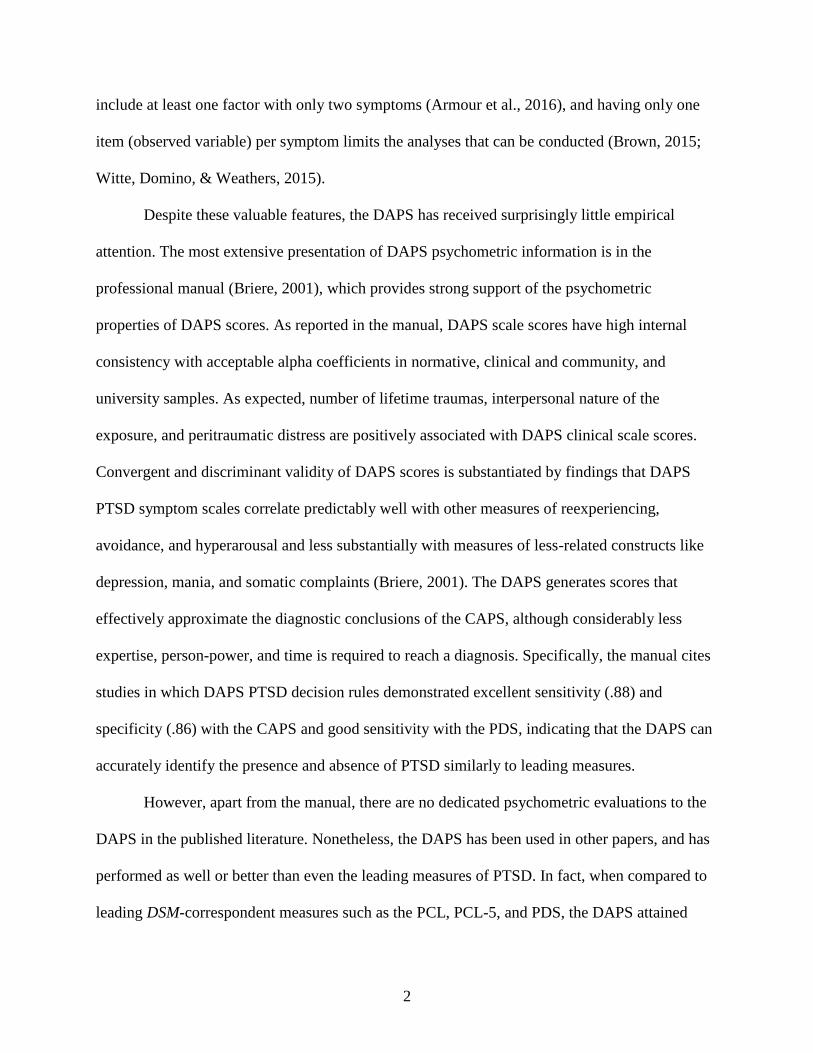
include at least one factor with only two symptoms (Armour et al., 2016), and having only one
item (observed variable) per symptom limits the analyses that can be conducted (Brown, 2015;
Witte, Domino, & Weathers, 2015).
Despite these valuable features, the DAPS has received surprisingly little empirical
attention. The most extensive presentation of DAPS psychometric information is in the
professional manual (Briere, 2001), which provides strong support of the psychometric
properties of DAPS scores. As reported in the manual, DAPS scale scores have high internal
consistency with acceptable alpha coefficients in normative, clinical and community, and
university samples. As expected, number of lifetime traumas, interpersonal nature of the
exposure, and peritraumatic distress are positively associated with DAPS clinical scale scores.
Convergent and discriminant validity of DAPS scores is substantiated by findings that DAPS
PTSD symptom scales correlate predictably well with other measures of reexperiencing,
avoidance, and hyperarousal and less substantially with measures of less-related constructs like
depression, mania, and somatic complaints (Briere, 2001). The DAPS generates scores that
effectively approximate the diagnostic conclusions of the CAPS, although considerably less
expertise, person-power, and time is required to reach a diagnosis. Specifically, the manual cites
studies in which DAPS PTSD decision rules demonstrated excellent sensitivity (.88) and
specificity (.86) with the CAPS and good sensitivity with the PDS, indicating that the DAPS can
accurately identify the presence and absence of PTSD similarly to leading measures.
However, apart from the manual, there are no dedicated psychometric evaluations to the
DAPS in the published literature. Nonetheless, the DAPS has been used in other papers, and has
performed as well or better than even the leading measures of PTSD. In fact, when compared to
leading DSM-correspondent measures such as the PCL, PCL-5, and PDS, the DAPS attained
3
higher levels of correspondence with a network of predicted associations (Blevins, Weathers,
Davis, Witte, & Domino, 2015). Also, Witte, Domino, and Weathers (2015) used the DAPS in a
recent study evaluating potential order effects in self-report assessments of PTSD. Because the
DAPS presents DSM PTSD symptoms in a different order than do the PCL and PDS, Witte et al.
tested for order effects by comparing the factor structure of the DAPS to that of the PCL and
PDS. They found that the DAPS produced similar factor analytic findings when compared to the
PCL-S and PDS, ruling out the presence of order effects while also providing structural validity
evidence for the DAPS.
Some of the associated features scales of the DAPS have also been evaluated in the
literature. Briere, Scott, and Weathers (2005) used the DAPS to assess both transient and
persistent dissociation in trauma survivors as a predictor for PTSD symptoms. Scores on the
DAPS Trauma-Specific Dissociation (T-DIS) subscale that indicated the presence or relative
absence of persistent dissociation were predictive of PTSD status, with high specificity (.97) and
moderate sensitivity (.57). In comparison to trauma-exposed participants with clinical levels of
persistent dissociation, those who scored in the sub-clinical range on the Trauma-Specific
Dissociation subscale (T < 65) had significantly lower likelihood of PTSD. Young, Merali, and
Ruff (2009) examined the validity scales of the DAPS in relation to the validity scales of the
Millon Clinical Multi-Axial Inventory III (MCMI III; Millon et al., 1997) and Ruff
Neurobehavioral Inventory (RNBI; Ruff & Hibbard, 2003) in a sample of motor vehicle accident
pain patients who did not have a TBI or neurological damage. DAPS positive and negative bias
scores correlated predictably with scores from the MCMI III and RNBI validity scales, indicating
that the DAPS accurately detects faking good as well as “cries for help” or malingering in
challenging populations.
4
In sum, the DAPS has many very desirable features, and the manual and additional
empirical reports indicate that it is psychometrically sound. It appears that the DAPS
incorporates comprehensive presentations of PTSD important for making diagnostic and
treatment decisions and yet requires less time, resources, and expertise to administer. Although
there are no focal psychometric evaluations, when the DAPS is used in the literature, it has
performed well. Therefore, the DAPS is deserving of more empirical attention and a rigorous
psychometrical evaluation.
The DAPS was recently revised for DSM-5, as were other DSM-correspondent measures
including the PCL-5 (Weathers et al., 2013b), PDS-5 (Foa et al., 2015) and CAPS-5 (Weathers et
al., 2013a), all of which have now been validated for DSM-5 PTSD. The revised DAPS (DAPS-
II) is a 119-item self-report measure with four subscales reflecting the DSM-5 PTSD criteria. The
DSM-IV reexperiencing (RE) cluster retained the same 10 items (e.g., having upsetting dreams or
nightmares about the experience) and is now DSM-5 Criterion B intrusions (INT). The new
negative alterations in cognition and mood (NACM) DSM-5 Criterion D subscale contains six
items retained from the DSM-IV avoidance and numbing cluster, four new cognitive items (e.g.,
thinking you are a bad person, feeling like people can’t be trusted) and four new trauma-related
emotional distress items (e.g., feeling nervous or anxious, feeling guilty about what happened).
The remaining four items from the DSM-IV avoidance and numbing cluster now comprise the
avoidance (AV) subscale (e.g., not doing certain things because they reminded you of the
experience). In attempt to mirror the usage of overt behavior referents in DSM-5 Criterion E,
four items assessing reckless behavior and verbal and physical aggression were also added (e.g.,
getting into physical fights, losing your temper more easily) to the hyperarousal (AR) subscale to
create the new alterations in arousal and reactivity (AR) subscale.

5
The aim of the present study is to provide the initial psychometric evaluation for the
DAPS-II for DSM-5 PSTD. Psychometric properties of DAPS-II scores evaluated included
internal consistency (alpha coefficients, item-scale correlations, and inter-item correlations) of
DAPS-II PTSD, suicidality (SUI), trauma-related dissociation (T-DIS), substance use (SUB),
and functional impairment (IMP scales; convergent and discriminant validity of DAPS-II PTSD,
suicidality (SUI), and trauma-related dissociation (T-DIS); and structural validity (CFA;
confirmatory factor analysis) of DAPS-II PTSD scores.
It was hypothesized that DAPS-II PTSD scores would demonstrate high internal
consistency and good convergent and discriminant validity with scores on various questionnaire
measures of PTSD and other relevant constructs. Regarding the associated features scales of the
DAPS-II, it was hypothesized that suicidality (SUI), trauma-related dissociation (T-DIS),
substance use (SUB), and functional impairment (IMP) scores would demonstrate high internal
consistency.
In terms of convergent and discriminant validity, it was hypothesized that DAPS-II
scores would demonstrate a similar pattern of associations with measures of PTSD and other
constructs, as has been demonstrated previously (Armour et al., 2015; Armour et al., 2016;
Witte, Domino, & Weathers, 2015). It was hypothesized that DAPS-II scores would correlate
strongly with another measure of PTSD (r ≥ .80) and nearly as strongly with symptom-level
measures such as trauma-related intrusions and avoidance on the IDAS-II (.70 ≤ r ≤ .79). DAPS-
II scores were expected to be moderately with constructs closely related to PTSD including
dissociation, depression, and anxiety, weakly correlated with peripherally related measures of
appetite gain and interpersonal needs (r < .30), and negatively correlated with well-being (r < 0).
It was also expected that scores on suicidality (SUI) would demonstrate a predicted pattern of

6
associations with measures of suicidal ideation, correlating strongly with a measure of suicidal
ideation (r = .80), moderately with depression, anxiety, interpersonal needs, and hopelessness (r
= .40-.69), and weakly with measures of capability and distress intolerance (r < .30), as has been
demonstrated previously (Van Orden, Witte, Gordon, Bender, & Joiner, 2008). Additionally,
suicidality (SUI) scores were expected to be negatively correlated with well-being (r < 0). It was
hypothesized that trauma-related dissociation (T-DIS) scores would be highly correlated with
scores form another measure of dissociation, the MDI, (r = .80), and would be moderately
correlated with measures of less-related constructs such as depression and anxiety (r < .60) and
negatively correlated with well-being (r < 0).
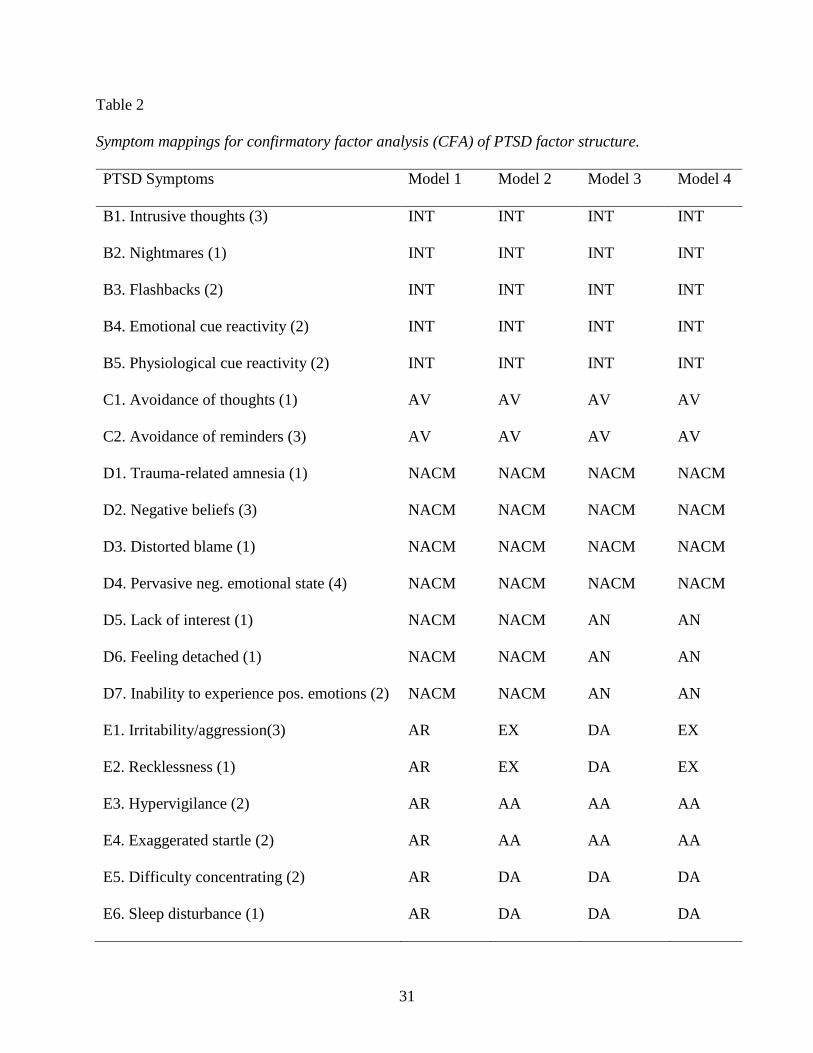
Lastly, four models of PTSD symptoms were evaluated for fit to the data: the DSM-5
implicit four-factors, six-factor externalizing, six-factor anhedonia, and seven-factor hybrid
model (see Table 2). It was expected that the fit to be adequate for the DSM-5 four-factor model
and relatively better with other empirically-supported six- and seven-factor models (Armour et
al., 2016), as has been demonstrated previously with other leading measures and the DAPS
(Witte et al., 2015).
Methods
Participants and Procedure
Participants were 550 male and female adults recruited through Amazon’s open-source
Mechanical Turk system. This method of recruitment was selected for the purpose of gathering a
normative adult sample beyond an undergraduate population as well as the ability to ensure
participant anonymity. Eligible participants were at least 18 years of age and fluent in English.
Through Amazon’s MTurk service, participants were given a randomly assigned code (e.g.

7
H66GST9MC837XC) to be recruited and compensated anonymously with no direct or indirect
coding, link, or investigator awareness of participant names or identifying information.
Participants completed a demographic questionnaire and the DAPS-II questionnaire from
any computer with internet access. Participants completed the study in 45-60 minutes and
received $2 as compensation. Following data collection, participant responses were rigorously
screened for Criterion A traumatic stressor exposure (1=meet criteria, 0=do not meet criteria)
through a process that involves syntax-based sorting and clinical judgment regarding trauma
narrative severity. The two graduate student raters agreed on Criterion A ratings on 530 (96%)
cases. Only participants who completed the survey and qualified as having a Criterion A trauma
exposure (n = 367) were included in the analyses.
The final sample consisted of 367 individuals (59.1% female) ranging in age from 18 to
74 years (M = 36.9 years; SD = 12.0). In terms of race, the sample was 76.6% Caucasian, 14.4%
Asian, 5.4% Black, 1.9% Native, and 1.4% Multiracial or other race. Approximately 4.9% of
participants were Hispanic or Latino. Most of the participants worked full-time (60.8%), some
were students (19.9%), some were active military or veterans (13.4%), and about half (49.6%)
had children. There were varying degrees of education among participants in the sample: 7.4%
high school graduate, 31.9% some college or associates degree, 20.2% bachelors, 19.6% masters,
and 2.2% doctorate degree. The most frequently reported Criterion A trauma exposures included
transportation accidents (32.2%), sexual assault (21.8%), physical assault (10.9%), assault with a
weapon (7.9%), and other serious work or recreational accident (6.8%). Of the 367 participants.
114 (25.6%) met DSM-5 criteria for a provisional PTSD diagnosis.
8
Measures
Descriptive statistics and alpha coefficients for all scales and subscales used in the study
are presented in Table 1.
Detailed Assessment of Posttraumatic Stress (DAPS-II). The DAPS-II (Briere, 2001)
is a 119-item DSM-correspondent self-report measure of PTSD. Respondents indicate the
frequency of their PTSD symptoms in the past month using a 5-point scale from 1 = never to 5 =
four or more times a week. The original DAPS has demonstrated substantial reliability and
validity in measuring the effects of traumatic exposure (Briere, 2001). Previously, resulting
diagnoses of PTSD have good sensitivity and specificity, when compared to the gold-standard
Clinician-Administered PTSD Scale (CAPS; Blake et al., 1995). In the current study, coefficient
alpha for the DAPS-II PTSD total scale was α = .99.
PTSD Checklist for DSM-5 (PCL-5). The PTSD Checklist for DSM-5 (PCL-5;
Weathers, et al., 2013) is a 20-item questionnaire measure of PTSD. Respondents indicate how
much they were bothered by each of the items in the past month on a 5-point scale from 0 = not
at all to 4 = extremely (Weathers et al., 2013b). The PCL-5 has been shown to be
psychometrically sound, with high internal consistency and test-retest reliability in addition to
strong convergent and discriminant validity for assessing PTSD symptoms (Blevins et al., 2015;
Wortmann, et al., 2016). In the current study, coefficient alpha for the PCL-5 PTSD total scale
was α = .97.
Multiscale Dissociation Inventory (MDI). Additionally, dissociative symptomatology
was assessed with the Multiscale Dissociation Inventory (MDI; Briere, 2002), a 30-item self-
report measure. It was selected in order to primarily assess the performance of the Trauma-
Specific Dissociation (T-DIS) scale of the DAPS-II. The MDI measures six different types of
9
dissociative responses that can accompany individual reactions to trauma such as disengagement,
depersonalization, memory disturbance, and others. Respondents indicate the frequency of the
experience described in each item over the past month on a 5-point scale from 1 = never to 5 =
very often. Normative scores on the MDI are based on a standardization sample of 444 trauma-
exposed individuals. The MDI is deemed a reliable and valid measure of dissociation in several
samples and populations, (Briere, 2002). In the current study, coefficient alpha for the MDI
dissociation total scale was α = .98.
Inventory of Depression and Anxiety Symptoms (IDAS-II). The IDAS-II (Watson, et
al., 2012) is a 99-item self-report measure that assesses depression, anxiety, and related
symptomatology. IDAS-II scales were used for discriminant validity to determine if the four
DAPS-II DSM-5 symptom factor subscales associate as expected with depression and anxiety.
The IDAS-II consists of 99 items, organized into a General Depression scale and 18 other non-
overlapping scales that have exhibited high internal consistency. Respondents indicate how much
they have felt or experienced the symptom described in each item on a 5-point scale from 1 = not
at all to 5 = extremely. Additionally, the IDAS-II has demonstrated good convergent and
discriminant validity with other self-report and interview measures of depression, mania, and
anxiety, as well as strong relationships to DSM disorder criteria (Watson et al., 2012).
Depressive Symptom Inventory Suicidality Subscale (DSI–SS). The Depressive
Symptom Inventory Suicidality Subscale (DSI–SS; Metalsky & Joiner, 1997) is a four-item self-
report measure used to assess suicidal ideation. Respondents indicate the frequency and intensity
of their suicidal ideation and behaviors in the previous 2 weeks, for which higher scores indicate
greater severity of suicidal ideation. If participants scored above low-risk on this measure, they
received crisis management information, Coping Card instructions, and contacts for additional

10
resources before ending the survey. In the current study, coefficient alpha for the DSI-SS total
suicidality scale was α = .93.
Interpersonal Needs Questionnaire- Revised (INQ-R). The Interpersonal Needs
Questionnaire- Revised (INQ-R; Van Orden et al., 2008, 2012) is a 15-item self-report measure
derived from the Interpersonal Theory of Suicide and developed to measure thwarted
belongingness and perceived burdensomeness—both proximal causes of desire for suicide.
Respondents indicate agreement with recent perceptions of themselves and others on a 7-point
scale from 1 = Not at all true for me to 7 = very true for me, for which higher scores indicated
higher levels of perceived burdensomeness or thwarted belongingness. In the current study,
coefficient alphas for the INQ-R total scale, perceived burdensomeness, and thwarted
belongingness were α = .92, .96, and .92, respectively.
Acquired Capability for Suicide Scale (ACSS-FAD). The Acquired Capability for
Suicide Scale (ACSS-FAD; Van Orden et al., 2008) – fearlessness of death (FAD) is a 7-item
subscale of the original 20-item ACSS-FAD. It measures respondent insensitivity to death,
thought to be a contributor to suicidal behavior. Psychometric investigation of the ACSS-FAD
supports the construct validity and use of this shortened version (e.g., Van Orden et al., 2008;
Bender et al., 2011) to assess FAD (ACSS-FAD; Ribeiro et al., 2014). Respondents indicated the
extent to which statements about fearlessness of death described them on a 5-point scale from 0
= Not at all like me to 4 = Very much like me. In the current study, coefficient alpha for the
ACSS-FAD subscale was α = .85.
Discomfort Intolerance Scale (DIS). The Discomfort Intolerance Scale (DIS; Schmidt
et al. 2006) is a concise two-item, self-report measure utilized to assess the degree to which
participants are capable of tolerating sensations of physical discomfort. Respondents indicate the
11
extent to which statements about tolerating pain described them on a 7-point scale from 0 = not
at all like me to 6 = extremely like me. In the current study, coefficient alpha for the DIS total
scale was α = .92.
Beck Hopelessness Scale (BHS). A shortened four-item version of the Beck
Hopelessness Scale (BHS; Beck & Steer, 1988) was used in this battery to assess the extent of
positive and negative beliefs about the future and summed to create a hopelessness score.
Respondents indicate whether true-false statements accurately described their attitudes and
beliefs about the future. Adequate internal reliability has been reported for the BHS across
diverse clinical and nonclinical populations. In the current study, coefficient alpha for the BHS
total hopelessness scale was α = .80.
Statistical Analyses
Latent variable modeling was conducted using Mplus version 7 (Muthén & Muthén,
1998-2013). For all other analyses, IBM SPSS version 22.0 was used. Internal consistency for
PTSD total scale and associated features scales was evaluated with Cronbach’s alpha and
examination of item-scale total and inter-item correlations. Convergent and discriminant validity
were assessed for DAPS-II PTSD total, suicidality, and trauma-related dissociation using
Pearson correlations between scores as described above.
The latent factor structure of the DAPS-II was examined using confirmatory factor
analysis (CFA). Although they were determined to have ambiguous face validity in light of
DSM-5 criteria, items 40 (e.g., People irritating you more than they did before the experience)
and 67 (e.g., Feeling like you won’t have much of a future) were included in the confirmatory
factor analyses and allowed to load onto symptoms E1 and D2, respectively, in the interest of
maintaining the integrity of the DAPS-II scales (Table 5). However, it was determined a priori

12
that items 52 (e.g., Feeling more restless since it happened) and 56 (e.g., Feeling jumpy or on
edge since it happened), which were previously included in the DSM-IV Hyperarousal (AR)
cluster, did not adequately correspond with any individual DSM-5 symptom, and were therefore
excluded from the analysis of all four CFA models.
Given that many of the variables were not normally distributed, robust maximum
likelihood estimator was used (MLR; Brown, 2015; Chou & Bentler, 1995; Curran, West, &
Finch, 1996). The covariance coverage matrix indicated that the proportion of data present for
each pairwise combination of variables was .97-1.0. Missing data, due to individual participants
inadvertently or purposefully skipping one or more items of the measure, were handled with Full
Information Maximum Likelihood (FIML; Enders, 2010; Schafer & Graham, 2002). Preliminary
analyses did not reveal other variables associated with the probability of an individual having
missing data. For all models, model fit was evaluated using a variety of fit indices: χ2 (p ≥ .05),
Bentler Comparative Fit Index (CFI ≥ .95; Bentler, 1990), Tucker-Lewis Index (TLI ≥ .95;
Bentler, 1990), and Standardized Root Mean Square Residual (SRMR < .08; Hu & Bentler,
1999). The 90% confidence intervals for Root Mean Square Error of Approximation (RMSEA)
were also evaluated according to the close-fit (lower limit < .05) and poor-fit (upper limit < .10)
hypotheses (Browne & Cudeck, 1993; Kline, 2011). The DSM-5 four-factor, six-factor
externalizing, and six-factor anhedonia models are all nested within the seven-factor hybrid
model. Thus, nested model comparisons were performed using the robust χ2 difference test
(Satorra & Bentler, 2001). Finally, all models were compared using the Akaike Information
Criterion (AIC; Anderson, Burnham, & Thompson, 2000) and the Bayesian Information
Criterion (BIC; Kass & Wasserman, 1995) Information Criterion, for which lower values that
indicate greater likelihood to replicate are preferred (Kline, 2011).

13
Results
Internal Consistency
DAPS-II PTSD total scale. Internal consistency was high for DAPS-II PTSD total (α =
.98) and for the four DSM-5 symptom clusters: intrusions (α = .96), avoidance (α = .89), NACM
(α = .96), and alterations in arousal and reactivity (α = .95). See Table 1 for scale and subscale
descriptive statistics. Since alpha is a function of scale length, the relatively lower alpha for
avoidance is likely attributable to the fact that this cluster consists of only four items. Mean item-
total correlation across all 40 PTSD items (measuring the 20 DSM-5 symptoms) was .80.
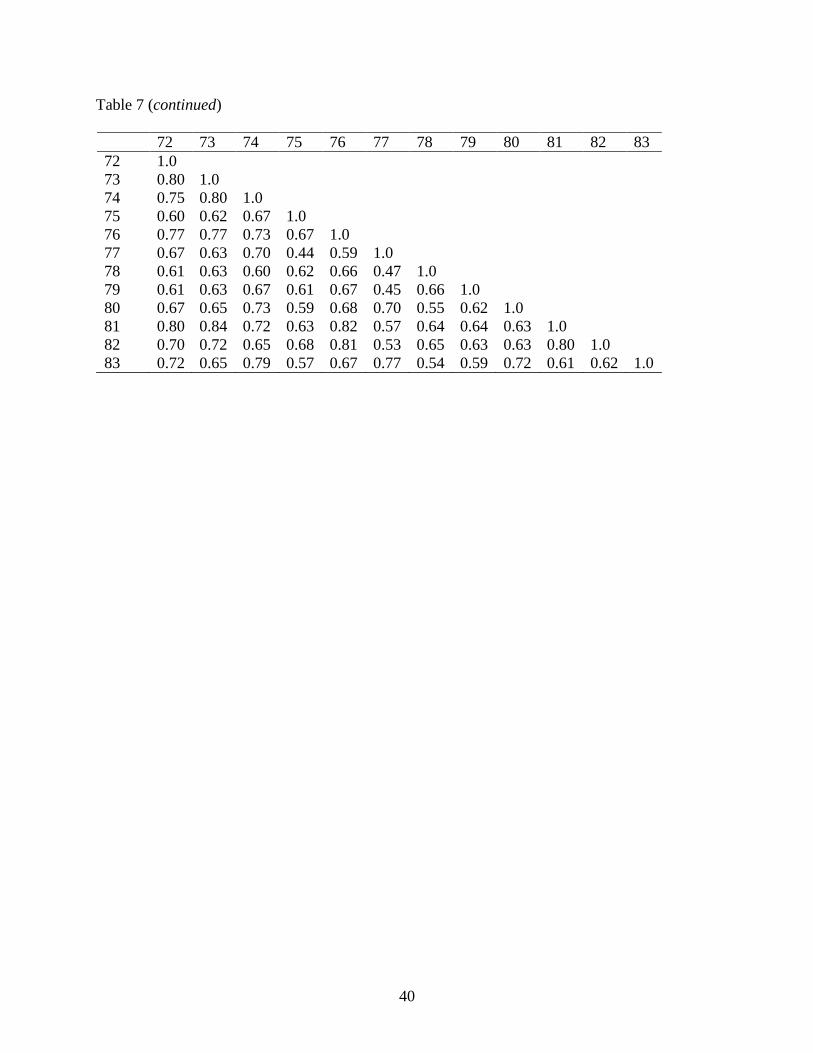
Overall, there was very high internal consistency between the 40 PTSD items. In fact, the range
of item-total correlations (r = .56 to .93) suggests some redundancy of items. Further, the 40
items were highly intercorrelated, with a mean of .65 and a range of .41-.84. Many correlations
between items were above the upper end of the recommended range of .15 to .50 (Clark &
Watson, 1995).
DAPS-II Associated Features scales. Internal consistency was high for all associated
features scales, including suicidality (α = .95), trauma-related dissociation (α = .93), substance
use (α = .92), and functional impairment (α = .93). Scale descriptive statistics are presented in
Table 1.
Convergent and Discriminant Validity
DAPS-II PTSD total and questionnaire measures. Bivariate correlations between
DAPS-II PTSD total scores and various questionnaire measures were examined to provide
evidence of convergent and discriminant validity (see Table 3). As expected, DAPS-II PTSD
total scores were most strongly correlated with the PCL-5, (r = .91, p < .001). Regarding
discriminant validity, DAPS-II total PTSD scores demonstrated moderately strong positive
correlations with measures of constructs closely related to PTSD including traumatic intrusions

14
(r = .67, p < .001), traumatic avoidance (r = .61, p < .001), derealization (r = .74, p < .001),
depersonalization (r = .73, p < .001), anxiety (r = .67, p < .001), and depression (r = .61, p <
.001). DAPS-II total PTSD scores had weak correlations with measures of appetite gain (r = .31,
< .001) and thwarted belongingness (r = .26, < .001). Finally, DAPS-II total PTSD scores had a
significant negative correlation with well-being (r = -.13, p = .03).
DAPS-II Suicidality (SUI) and questionnaire measures. Bivariate correlations
between DAPS-II suicidality scores and various questionnaire measures of convergent and
discriminant constructs were also examined. As expected, DAPS-II suicidality scores were most
strongly correlated with measures of suicidal ideation, plan, and intent such as the DSI-SS (r =
.71, p < .001) and the IDAS-II suicidality scale (r = .73, p < .001). DAPS-II SUI was also highly
related to perceived burdensomeness (r = .71, p < .001). Regarding discriminant validity, DAPS-
II suicidality scores demonstrated moderately strong positive correlations with general
depression (r = .55, p < .001) and thwarted belongingness (r = .28, p < .001), and weak
correlations with the ACSS-FAD (r = -.02, p = .749), DIS (r = .02, p = .68) and BHS (r = .13, p
= .01) which were lower than expected. The DAPS-II suicidality scale is also negatively
correlated with well-being (r = -.11, p < .05).
DAPS-II Trauma-related Dissociation (T-DIS) and questionnaire measures.
Bivariate correlations between DAPS-II trauma-related dissociation scores and various
questionnaire measures were also examined as evidence of convergent and discriminant validity.
As expected, DAPS-II trauma-related dissociation scores demonstrated strong and significant
positive correlations with the depersonalization and derealization scales on the MDI, (r = .78, r =
.78, p < .001). The trauma-related dissociation scores were also very highly related to PTSD
symptoms as measured by the PCL-5 (r = .84, p < .001). Regarding discriminant validity, DAPS-

15
II trauma-related dissociation scores were moderately correlated with measures of related
constructs such as depression (r = .59, p < .001) and anxiety (r = .63, p < .001) and negatively
correlated with well-being (r = -.12, p < .02).
Latent Factor Structure
To determine if four-factor, two six-factor, and seven-factor models of PTSD symptoms
fit the DAPS-II scores in the sample, a confirmatory factor analysis (CFA) was conducted for
each model using Mplus (Muthen & Muthen, 1998-2012). The DSM-5 and previous literatures
examining the factor structure of PTSD (Bovin et al., 2016; Witte et al., 2015) were used to
identify which DAPS-II items loaded onto each factor in all models (see Table 2). Since the
DAPS-II contains more than one item for most symptoms of PTSD, the residual variances of
items purporting to measure the same symptom were allowed to correlate (Witte, Domino,
Weathers, 2015). Additionally, post-hoc power analyses (MacCallum, Browne, & Sugawara,
1996) revealed adequate power in the sample for tests of close and not-close fit for all models (N
= 367, df = 619-634, power = 1.000).
It was expected that findings would replicate previous factor analytic support for the
relatively poorer fit for the DSM-5 four-factor model and the relatively better fit of empirically
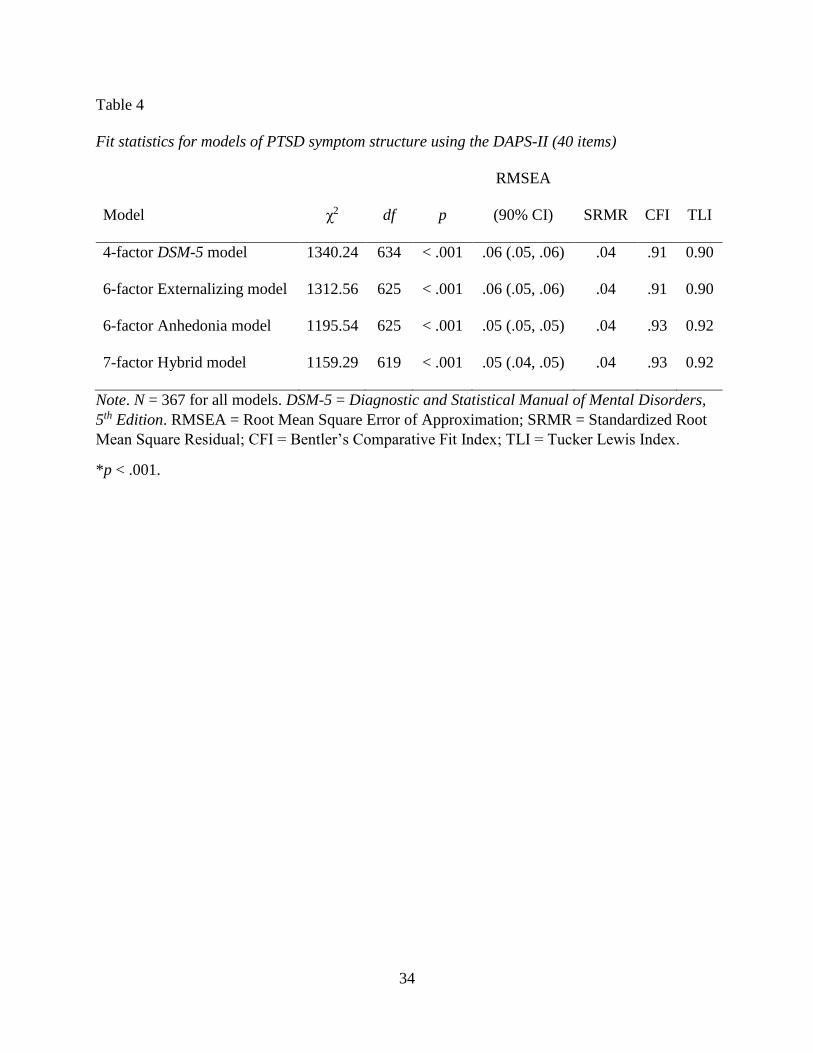
supported six- and seven-factor models (Armour et al., 2016). Indeed, out of all models tested
and across all fit indices, the DSM-5 model provided the worst fit. The fit with the data was
adequate according to some fit statistics (SRMR = 0.04), but not others (χ2 = 1340.24, df = 634, p
< .001; TLI = 0.90; CFI = 0.91). The null hypotheses that the fit was either close and or poor was
rejected according to the RMSEA values (90% Confidence Interval = 0.051, 0.059).
In the sample of DAPS-II scores, the seven-factor model had adequate fit with the data
according to most fit statistics and better fit compared to the DSM-5 four-factor, six-factor

16
Externalizing, and six-factor Anhedonia models of PTSD symptoms across a variety of fit
indices (see Table 4 for fit statistics for each model). Robust χ2 difference tests demonstrated that
the seven-factor Hybrid model fit the data significantly better than the DSM-5 four-factor (χ2 =
127.8, df = 15, p < .001), six-factor Externalizing (χ2 = 97.6, df = 6, p < .001), and six-factor
Anhedonia (χ2 = 29.2, df = 6, p < .001) models of PTSD symptoms. Moreover, both six-factor
models also had significantly better fit with the data than the DSM-5 four-factor model
(Externalizing χ2 = 24.9, df = 9, p = .003; Anhedonia χ2 = 95.2, df = 9, p < .001). The seven-
factor Hybrid model also demonstrated the lowest Akaike (AIC) and Bayesian (BIC) Information
Criterion values (AIC = 28891.2; BIC = 29516.0), indicating that it is the most likely of the four
models to replicate in subsequent samples.
Given that the seven-factor Hybrid model provided the best fit to the data, it is examined
in greater detail. The fit was adequate according to some (i.e., RMSEA, CFI, TLI, SRMR), but
not all (i.e., χ2) fit statistics (see Table 4 for fit statistics). The standardized loadings of the
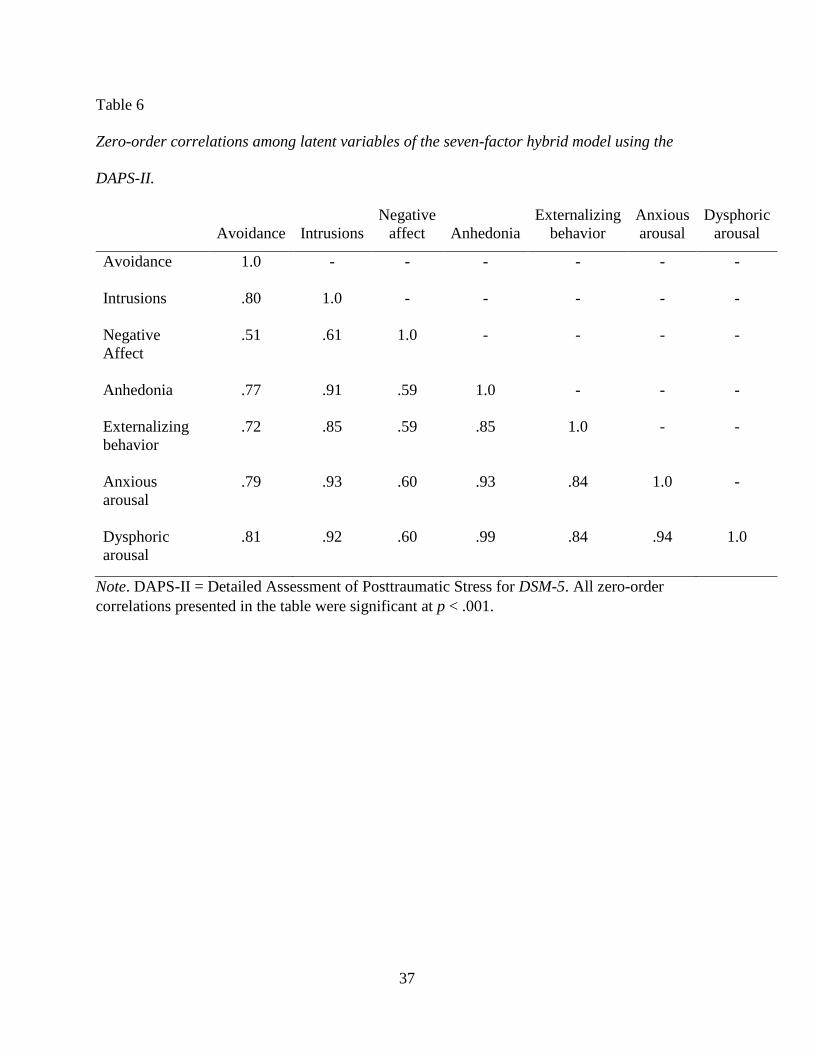
factors on to the latent variables were all significant and greater than .69 (see Table 5). The
correlations among latent variables were all significant and greater than .59 (see Table 6).
Specifically, the Dysphoric Arousal, Anxious Arousal, Anhedonia, and Intrusions clusters were
all very highly intercorrelated (r ≥ .91). The modification indices suggested produced complex
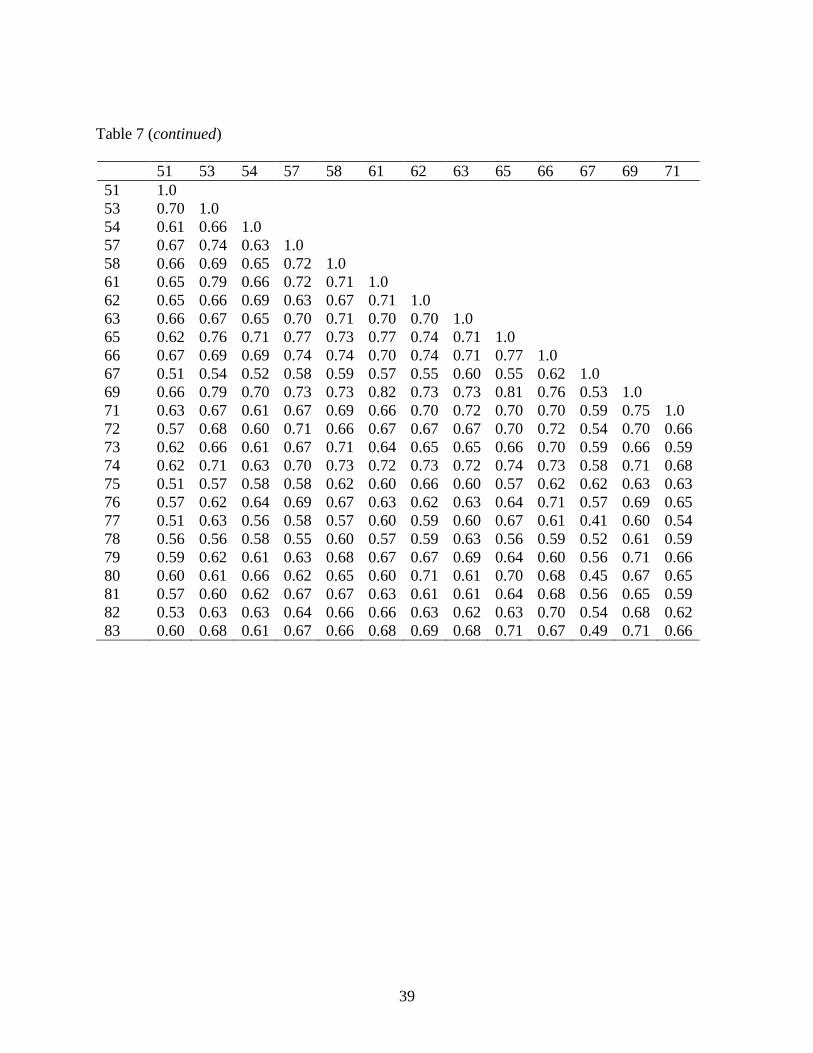
models inconsistent with theory, so no modification indices were employed. The inter-item
correlations of DAPS-II is presented in the correlation matrix in Table 7.
Discussion
This is the first study to examine the performance of the DAPS-II, the revised DSM-5
version of the DAPS, the DAPS-II. Changes made to the original DAPS are consistent with the
literature and the DSM-5. Specifically, items added to the DAPS-II to capture DSM-5 PTSD

17
symptomatology are face valid, endorsed at expected rates, and correlated with the appropriate
theorized factor with respect to other items in each cluster. The results of the current study
provide evidence for the addition of 12 items to the original DAPS and the validity of DSM-5
symptomatology in general, using the DAPS-II. The four DSM-5 subscales of the DAPS-II (e.g.,
INT, AV, NACM, AR) also performed as expected, producing a similar pattern of, but
consistently lower, discriminant correlations than the PCL-5 as shown in Table 3. In light of
DSM-5, some remaining items on the DAPS-II are not representative of any single PTSD
symptom and may no longer fit on a proposed factor. In particular, items with ambiguous face
validity include the following: 52. Feeling more restless since it happened; 56. Feeling jumpy or
on edge since it happened. Items that no longer appear to fit in a DSM symptom cluster include
the following: 40. People irritating you more than they did before the experience; 67. Feeling
like you won’t have much of a future. Clinicians and researchers may want to evaluate the
usefulness of these items when administering the DAPS-II for different purposes. For example,
clinicians should use the DAPS-II as written so they can use normative information
unambiguously, but researchers should consider not including the items of concern in CFAs.
With respect to the study hypotheses, DAPS-II PTSD total scores demonstrated adequate
internal consistency with high coefficient alphas. It should be noted that the coefficient alpha
produced by the DAPS-II PTSD total score is likely attributable in part to the number of items
included (42 items), as alpha is highly susceptible to inflation with the addition of items (Kopalle
& Lehmann, 1997). Taken together with the substantial intercorrelations between items, these
results indicate that DAPS-II PTSD items are strongly related, and possibly somewhat redundant.
While the extensive coverage of PTSD symptoms provided by multiple items per most PTSD
symptoms on the DAPS-II was beneficial for confirmatory factor analysis (CFA), the present

18
study presents evidence that many items overlap and may not, in fact, be necessary to capture the
construct of PTSD. The associated features scales of the DAPS-II also demonstrated internal
consistency, as evidenced by high coefficient alphas, and strong item-total and inter-item
correlations.
DAPS-II PTSD scores and associated features subscales demonstrated convergent and
discriminant validity. Overall, DAPS-II scales (PTS-T, SUI, T-DIS, SUB) performed as
expected, producing patterns of convergent and discriminant correlations that corresponded with
predictions for highly, moderately, and weakly related constructs. The pattern of discriminant
correlations with the DAPS-II PTSD scale was similar to the pattern of discriminant correlations
produced by the PCL-5, providing supporting evidence for good discriminant validity. Many
discriminant correlations were higher than expected, again likely attributable to the highly
intercorrelated nature of the DAPS-II items in this sample. Deviations from expected correlations
between the DAPS-II Suicidality (SUI) subscale and constructs thought to be predictive of
suicidal behavior such as interpersonal needs and fearlessness of death may be explained by the
poor obtained internal consistency of INQ-R and ACSS-FAD measures (see Table 1). Lastly,
this phenomenon might also be related to an over-endorsement of symptoms by respondents in
general.
Factor analytic results using the DAPS-II were consistent with the growing volume of
literature exhibiting the relatively better fit of the seven-factor hybrid model (Armour et al.,
2016) and other empirical models compared with other leading theoretically-derived models
such as the DSM-5 implicit four-factor model. Thus, the DAPS-II PTSD total scale performed
similarly to other leading PTSD measures such as the PCL-5, PDS, and CAPS-5 in a CFA,
providing further evidence for its validity and clinical utility in measuring PTSD. The current
19
findings also add to the continual evaluation of the construct of PTSD and deliberation as to how
it should be defined, raising questions as to whether empirically-supported models should be
valued above parsimonious models.
Although existing psychometric research on the DAPS is sparse, the results of the present
study support the reliability and construct validity of the DAPS-II in measuring PTSD symptoms
in a trauma-exposed, diverse community sample. This validation of the DAPS-II as a self-report
questionnaire allows researchers and clinicians another option for measuring DSM-5 PTSD that
has many advantages over current assessment tools and performs equally as well.
There are several important limitations of the present study. First, and most notably, is
the reliance on questionnaire measures of PTSD and other constructs, which has been widely
criticized in the literature (Cronbach, 1946; Nisbett & Wilson, 1977). First, self-report measures
are dependent on the understanding, individual interpretation, introspective ability, and honesty
of the participants as well as the structure of the instruments themselves (e.g., likert rating scales,
item phrasing). Also, it is possible that participants engaged in inattentive or socially desirable
responding while completing the measures. That being said, clients’ interpretations of their own
symptoms have clinical utility as important facets of assessment and treatment that affect
rapport, perceptions of treatment, and treatment outcomes. Capturing participants’ perceptions,
including variables such as their understanding and response bias, is a meaningful strength of
self-report instruments. Second, since both the DAPS-II and PCL-5 are questionnaires,
correlations between their scores may be inflated due to shared method variance (Campbell &
Fiske, 1959), heightening the perception of good convergent validity. Inflated convergent
validity could be explored via other statistical methods such as the multitrait-multimethod matrix
analysis. Lastly, it is also possible that the findings may not generalize to interview assessments

20
of PTSD such as the CAPS-5 (Weathers et al., 2013a). However, this is unlikely given that past
literature on the DAPS has demonstrated results commensurate to, if not better than, results from
standardized interview assessments (Blevins, Weathers, Davis, Witte, & Domino, 2015; Briere,
2001). Nonetheless, there are strong arguments for the use and validity of self-report assessment
tools as laid out by David Chan (2009): 1) there is supporting evidence of criterion-related,
convergent, and discriminant validity for self-report measures with other non-questionnaire
criteria; 2) high correlations between self-report measures does not necessarily provide evidence
for common method variance; 3) the use of non-self-report measures can also result in artificially
inflated or deflated correlations; 4) not all constructs are equally susceptible to response biases
such as social desirability; 5) social desirability responding is neither pervasive nor inevitable
and can be reduced; and 6) self-report measures most accurately capture constructs that are
perceptual in nature or that cannot be assessed via observable behavior. Given the advantages
and disadvantages of self-report measures, future research should continue to investigate PTSD
using many types of assessment tools.
Second, the current sample included English-speaking adults from the community who
experienced a Criterion A traumatic event. Only 3.8% of participants met DSM-5 criteria for a
provisional PTSD diagnosis, thus the majority of participants were likely experiencing few
symptoms and little distress. It is possible that the current findings would not generalize to a
clinical sample with more severe distress, symptoms, and comorbid psychopathology. It is also
possible that this diverse sample of online MTurk workers does not represent the typical
community sample of trauma-exposed adults. However, the individuals in the sample
experienced a variety of traumatic experiences that ranged from moderate to very severe.
Therefore, the sample will likely be representative of traumatic events experienced in the general

21
population. It is unclear whether or not these results would generalize to more specific or unique
populations such as military service-members with combat experience, non-American citizens,
or minors.
Another key concern in regards to the interpretation of results is the presence of high
factor intercorrelations, especially in the seven-factor hybrid model (i.e., many exceed .85 or
.90). Although this is a typical finding in CFA studies of PTSD (Elhai, Beihn, Armour et al.,
2011; Reddy et al., 2013), it produces doubts about the conclusions of the study. For instance,
even though the seven-factor hybrid model produced the most superior fit statistics in
comparison to all models, the Dyspohric Arousal, Anxious Arousal, Anhedonia, and Intrusions
clusters are all highly intercorrelated (r > .91). It is unclear whether or not such highly-correlated
latent factors are truly different constructs and if the adoption of the DSM-5 four-factor model is
more parsimonious. Therefore, there is a need for studies that establish the validity of these
constructs through methods such as differential associations with external variables. Future
research should consider less restrictive models of PTSD symptoms, Exploratory Factor
Analyses (EFA), or exploratory structural equation modeling (Marsh et al., 2009) to investigate
PTSD symptom structure while avoiding common problems such as high factor intercorrelations.
The existence of equivalent models of PTSD factor structure is another important
limitation for the interpretation of present findings. While the seven-factor hybrid model fit the
data well, there are other models that fit the data equally well. For example, one such model
could include replacing the covariances between the latent variables with direct effects, as in a
structural model. Since the Intrusions latent variable was one of the most highly correlated with
other latent variables, it is possible that Intrusions precipitated other PTSD symptom clusters
such as dysphoric arousal (DA), intrusions (INT), and negative alteration in cognition and mood

22
(NACM). Intrusions with a direct effect on each of the other six factors would produce an
identical solution that fits the data equally to the seven-factor hybrid model. Although the cross-
sectional design of the present study cannot provide adequate support for this hypothesis, future
research could incorporate longitudinal studies of the onset of PTSD symptoms after a traumatic
event.
Despite these limitations, the present study provides clear evidence that the DAPS-II is a
psychometrically sound assessment tool for DSM-5 PTSD symptomatology. In addition, the
questionnaire format of the DAPS-II is accessible because it requires less time and expertise to
administer and score. Finally, the supplementary features, including extensive coverage of PTSD
symptoms and trauma events, associated features scales that capture diverse clinical
presentations, and validity and response bias scales, allow for versatility and usefulness beyond
current questionnaire measures available. Thus, the DAPS-II provides an alternative and
accessible tool for assessing DSM-5 PTSD symptoms easily and accurately in a variety of
populations.

23
References
American Psychiatric Association. (2013). Diagnostic and statistical manual of mental disorders
(5th ed.). Arlington, VA. http://dx.doi.org/10.1176/appi.books.9780890425596
Anderson, D. R., Burnham, K. P., & Thompson, W. L. (2000). Null hypothesis testing:
Problems, prevalence, and an alternative. The Journal of Wildlife Management, 64, 912-
923. http://dx.doi.org/10.2307/3803199
Armour, C., Tsai, J., Durham, T. A., Charak, R., Biehn, T. L., Elhai, J. D., & Pietrzak, R. H.
(2015). Dimensional structure of DSM-5 posttraumatic stress symptoms: Support for a
hybrid Anhedonia and Externalizing Behaviors model. Journal of Psychiatric Research,
61, 106–113. http://dx.doi.org/10.1016/j.jpsychires.2014.10.012
Armour, C., Mullerova, & Elhai, J.D. (2016). A systematic literature review of PTSD’s latent
structure in the Diagnostic & Statistical Manual of Mental Disorders: DSM-IV to DSM-
5. http://dx.doi.org/10.1016/j.cpr.2015.12.003
Bentler, P. M. (1990). Comparative fit indexes in structural models. Psychological Bulletin, 107,
238–246. http://dx.doi.org/10.1037/0033-2909.107.2.238
Blake, D. D., Weathers, F. W., Nagy, L. M., Kaloupek, D. G., Gusman, F. D., Charney, D. S., &
Keane, T. M. (1995). The development of a clinician-administered PTSD scale. Journal
of Traumatic Stress, 8, 75-90. http://dx.doi.org/10.1002/jts.2490080106
Blevins, C. A., Weathers, F. W., Davis, M. T., Witte, T. K., & Domino, J. L. (2015). The
Posttraumatic Stress Disorder Checklist for DSM-5 (PCL-5): Development and initial
psychometric evaluation. Journal of Traumatic Stress, 29, 1-10.
https://doi.org/10.1037/t51564-000
Bovin, M. J., Marx, B. P., Weathers, F. W., Gallagher, M. W., Rodriguez, P., Schnurr, P. P., &
Keane, T. M. (2016). Psychometric properties of the PTSD Checklist for Diagnostic and

24
Statistical Manual of Mental Disorders – Fifth Edition (PCL-5) in veterans.
Psychological Assessment, 128 (11), 1379-1391. https://doi.org/10.1037/pas0000254
Briere, J. (2001). Detailed Assessment of Posttraumatic Stress. Odessa, FL: Psychological
Assessment Resources.
Brown, T. A. (2015). Confirmatory Factor Analysis for Applied Research, Second Edition. New
York, NY: Guilford Press.
Browne, M. W., & Cudeck, R. (1993). Alternative ways of assessing model fit. In K. A. Bollen
& J. S. Long (Eds.), Testing structural equation models (pp. 136–162). Newbury Park,
CA: Sage.
Campbell, D. T., & Fiske, D. W. (1959). Convergent and discriminant validation by the
multitrait-multimethod matrix. Psychological Bulletin, 56, 81-105.
https://doi.org/10.1037/h0046016
Chan, D. (2009). So why ask me? Are self report data really that bad? In C. E. Lance & R. J.
Vandenberg, Statistical and methodological myths and urban legends: Doctrine, verity,
and fable in the organizational and social sciences (pp. 309-336). New York, NY: Taylor
& Francis Group, LLC.
Chou, C. P., & Bentler, P. M. (1995). Estimates and tests in structural equation modeling. In R.
H. Hoyle (Ed.), Structural equation modeling: Concepts, issues, and applications (pp.
37–55). Thousand Oaks, CA: Sage.
Cronbach, L. J. (1946). Response sets and test design. Educational and Psychological
Measurement, 6, 475-494.
Curran, P. J., West, S. G., & Finch, J. F. (1996). The robustness of test statistics to nonnormality
and specification error in confirmatory factor analysis. Psychological Methods, 1, 16–29.
https://doi.org/10.1037//1082-989x.1.1.16
25
Elhai, J. D., Biehn, T. L., Armour, C., Klopper, J. J., Frueh, B. C., & Palmieri, P. A. (2011).
Evidence for a unique PTSD construct represented by PTSD’s D1–D3 symptoms.
Journal of Anxiety Disorders, 25, 340–345. https://doi.org/10.1016/j.janxdis.2010.10.007
Enders, C. K. (2010). Applied missing data analysis. New York, NY: Guilford Press.
Foa, E. B., Cashman, L., Jaycox, L., & Perry, K. (1997). The validation of a self-report measure
of posttraumatic stress disorder: The Posttraumatic Stress Diagnostic Scale.
Psychological Assessment, 9, 445-51. https://doi.org/10.1037//1040-3590.9.4.445
Foa, E. B., McLean, C. P., Zang, Y., Zhong, J., Powers, M. B., Kauffman, B. Y., Rauch, S.,
Porter, K., & Knowles, K. (2015). Psychometric properties of the Posttraumatic
Diagnostic Scale for DSM-5 (PDS-5). Psychological Assessment. Advance online
publication. http://dx.doi.org/10.1037/pas0000258
Hu, L., & Bentler, P. M. (1999). Cutoff criteria for fit indexes in covariance structure analysis:
Conventional criteria versus new alternatives. Structural Equation Modeling, 6, 1–55.
https://doi.org/10.1080/10705519909540118
Kass, R. E., & Wasserman, L. (1995). A reference Bayesian test for nested hypotheses and its
relationship to the Schwarz criterion. Journal of the American Statistical Association, 90,
928–934. https://doi.org/10.2307/2291327
Kline, R. B. (2011). Principles and practice of structural equation modeling (3rd ed.). New
York, NY: Guilford Press.
Kopalle, P., & Lehmann, D. (1997). Alpha inflation? The impact of eliminating scale items on
Cronbach's alpha. Organizational Behavior and Human Decision Processes, 70, 189-97.
https://doi.org/10.1006/obhd.1997.2702

26
MacCallum, R. C., Browne, M. W., & Sugawara, H. M. (1996). Power analysis and
determination of sample size for covariance structure modeling. Psychological Methods,
1, 130-149. https://doi.org/10.1037//1082-989x.1.2.130
Marsh, H. W., Muthen, B., Asparouhov, T., Ludtke, O., Robitzsch, A., Morin, A. J. S., &
Trautwein, U. (2009). Exploratory structural equation modeling, integrating CFA and
EFA: Application to students’ evaluations of university teaching. Structural Equation
Modeling, 16, 439–476. https://doi.org/10.1080/10705510903008220
Muthén, L. K., & Muthén, B. O. (1998 –2013). Mplus user’s guide (7th ed.). Los Angeles, CA:
Muthén & Muthén.
Nisbett, R. E., & Wilson, T. D. (1977). Telling more than we can know: Verbal reports on
mental processes. Psychological Review, 84, 231-259. https://doi.org/10.1037//0033-
295x.84.3.231
Reddy, M. K., Anderson, B. J., Liebschutz, J., & Stein, M. D. (2013). Factor structure of PTSD
symptoms in opioid-dependent patients rating their overall trauma history. Drug and
Alcohol Dependence, 132, 597–602. https://doi.org/10.1016/j.drugalcdep.2013.04.009
Satorra, A., & Bentler, P. M. (2001). A scaled difference chi-square test statistic for moment
structure analysis. Psychometrika, 66, 507–514. https://doi.org/10.1007/bf02296192
Schafer, J. L., & Graham, J. W. (2002). Missing data: Our view of the state of the art.
Psychological Methods, 7, 147-177. https://doi.org/10.1037/1082-989x.7.2.147
Weathers, F. W., Blake, D. D., Schnurr, P. P., Kaloupek, D. G., Marx, B. P., & Keane, T. M.
(2013). Clinician-Administered PTSD Scale for DSM–5 (CAPS-5). Boston, MA:
National Center for PTSD.
Weathers, F. W., Litz, B. T., Herman, D. S., Huska, J. A., & Keane, T. M. (1993). The PTSD
Checklist (PCL): Reliability, Validity, and Diagnostic Utility. Paper presented at the
27
Annual Convention of the International Society for Traumatic Stress Studies, San
Antonio, TX.
Weathers, F. W., Litz, B. T., Keane, T. M., Palmieri, P. A., Marx, B. P., & Schnurr, P. P. (2013).
The PTSD Checklist for DSM-5 (PCL-5). Scale available from the National Center for
PTSD at www.ptsd.va.gov.
Witte, T. K., Domino, J. L., & Weathers, F. W. (2015). Item order effects in the evaluation of
posttraumatic stress disorder symptom structure. Psychological Assessment, 27(3), 852-
64. https://doi.org/10.1037/pas0000089

28
Appendix
Table 1
Scale-level descriptive statistics
Variable N M SD Possible
range
Obs.
range
α
DAPS-II scales
PTS-T 307 72.5 38.7 40-210 42-204 .98
INT 355 17.7 9.4 10-50 10-50 .96
AV 360 7.1 4.0 4-20 4-20 .89
NACM 341 24.3 13.6 14-70 14-67 .96
AR 346 20.5 11.0 14-70 14-67 .95
IMP 357 8.5 5.0 5-25 5-25 .93
PDST 358 27.5 6.8 8-40 9-40 .78
PDIS 361 18.0 7.3 6-30 6-30 .89
T-DIS 358 6.3 3.8 4-20 4-20 .93
SUB 359 13.1 6.2 10-50 10-47 .92
SUI 358 13.0 6.6 10-50 10-40 .95
PB 355 15.6 7.1 8-40 8-40 .84
NB 362 10.1 4.6 8-40 8-35 .86
PCL-5 350 18.3 19.8 0-80 0-79 .97
MDI 334 50.0 23.7 30-150 30-146 .98
IDAS-II scales
General Depression 335 44.6 17.6 20-100 20-96 .93
Dysphoria 345 21.4 10.2 10-50 10-50 .94

29
Lassitude 354 13.0 5.9 6-30 6-30 .87
Insomnia 355 13.7 6.5 6-30 6-30 .91
Suicidality 358 13.0 6.6 6-30 6-30 .92
Appetite Loss 359 5.6 3.1 3-15 3-15 .81
Appetite Gain 363 6.2 3.0 3-15 3-15 .81
Well-being 358 21.1 7.5 8-40 8-40 .88
Ill Temper 361 8.9 4.5 5-25 5-24 .89
Mania 356 8.9 4.7 5-25 5-25 .90
Euphoria 357 8.4 4.0 5-25 5-22 .84
Panic 350 13.6 7.3 8-40 8-40 .93
Social Anxiety 355 11.8 6.2 6-30 6-30 .91
Claustrophobia 356 8.1 4.5 5-25 5-25 .91
Traumatic Intrusions 358 7.6 4.2 4-20 4-20 .91
Traumatic Avoidance 358 8.4 4.1 4-20 4-20 .88
Checking 360 5.7 3.1 3015 3-15 .87
Ordering 359 9.3 4.3 5-25 5-24 .85
Cleaning 352 12.2 6.0 7-35 7-35 .92
DSI-SS 355 1.4 2.4 0-12 0-9 .93
INQ-R 364 13.3 11.0 8-56 8-56 .91
DIS 364 7.5 3.0 0-12 0-12 .92
BHS 364 2.1 0.6 0-4 0-4 .80
ACSS-FAD 364 14.0 6.6 0-28 0-28 .83
Note. DAPS-II = Detailed Assessment of Posttraumatic Stress, 2nd Edition; PTS-T =
Posttraumatic Stress Total scale; INT = Intrusions subscale; AV = Avoidance subscale; NACM =

30
Negative alterations in cognitions and mood subscale; AR = Arousal subscale; IMP = Functional
Impairment scale; PDST = Peritraumatic Distress scale; PDIS = Peritraumatic Dissociation scale;
T-DIS = Trauma-related Dissociation scale; SUB = Substance Use scale; SUI = Suicidality scale;
PB = Positive Bias scale; NB = Negative Bias scale; PCL-5 = PTSD Checklist for DSM-5; MDI
= Multiscale Dissociation Inventory; IDAS-II = Inventory of Depression and Anxiety
Symptoms, Second Edition; DSI-SS = Depressive Symptoms Inventory, Suicidality Subscale;
INQ-R = Interpersonal Needs Questionnaire, Revised; DIS = Discomfort Intolerance Scale; BHS
= Beck Hopelessness Scale; ACSS-FAD = Acquired Capability for Suicide Scale – Fearlessness
about Death.
31
Table 2
Symptom mappings for confirmatory factor analysis (CFA) of PTSD factor structure.
PTSD Symptoms Model 1 Model 2 Model 3 Model 4
B1. Intrusive thoughts (3) INT INT INT INT
B2. Nightmares (1) INT INT INT INT
B3. Flashbacks (2) INT INT INT INT
B4. Emotional cue reactivity (2) INT INT INT INT
B5. Physiological cue reactivity (2) INT INT INT INT
C1. Avoidance of thoughts (1) AV AV AV AV
C2. Avoidance of reminders (3) AV AV AV AV
D1. Trauma-related amnesia (1) NACM NACM NACM NACM
D2. Negative beliefs (3) NACM NACM NACM NACM
D3. Distorted blame (1) NACM NACM NACM NACM
D4. Pervasive neg. emotional state (4) NACM NACM NACM NACM
D5. Lack of interest (1) NACM NACM AN AN
D6. Feeling detached (1) NACM NACM AN AN
D7. Inability to experience pos. emotions (2) NACM NACM AN AN
E1. Irritability/aggression(3) AR EX DA EX
E2. Recklessness (1) AR EX DA EX
E3. Hypervigilance (2) AR AA AA AA
E4. Exaggerated startle (2) AR AA AA AA
E5. Difficulty concentrating (2) AR DA DA DA
E6. Sleep disturbance (1) AR DA DA DA

32
Note. Number of DAPS-II items for each symptom included in CFA analyses listed in
parentheses; Model 1 = DSM-5 four-factor; Model 2 = Externalizing six-factor; Model 3 =
Anhedonia six-factor; Model 4 = Hybrid seven-factor; INT = Intrusions; AV = Avoidance;
NACM = Negative alterations in cognitions and mood; AR = Alterations in arousal and
reactivity; EX = Externalizing behaviors; AN = Anhedonia; DA = Dysphoric arousal; AA =
Anxious arousal.

33
Table 3
DAPS-II Convergent and Discriminant Validity Correlations.
1. 2. 3. 4. 5. 6. 7. 8. 9. 10. 11.
1. DAPS-II PTSD total ---
2. PCL-5 PTSD total .91** ---
3. IDAS-II Intrusions .67** .73** ---
4. IDAS-II Avoidance .61** .70** .72** ---
5. MDI Derealization .74** .77** .56** .51** ---
6. MDI Depersonaliz. .73** .76** .57** .52** .93** ---
7. IDAS-II Panic .67** .71** .78** .66** .65** .65** ---
8. IDAS-II Depression .61** .70** .79** .71** .59** .59** .81** ---
9. IDAS-II Appetite Gain .31** .37* .36** .38** .34** .34** .43** .47** ---
10. INQ-R total .30** .30** .18** .13* .35** .38** .19** .06 .05 ---
11. IDAS-II Well-being .-.13* -.13* -.13* -.12* -.09 -.05 -.09 -.39** .08 .24** ---
Note. DAPS-II = Detailed Assessment for Posttraumatic Stress, 2nd Edition; PCL-5 = PTSD
Checklist for DSM-5; IDAS-II = Inventory of Depression and Anxiety Symptoms, Version 2;
MDI = Multiscale Dissociation Inventory; INQ-R = Interpersonal Needs Questionnaire, Revised.
N = 367 for DAPS-II correlations.
*p < .05; **p < .01.
34
Table 4
Fit statistics for models of PTSD symptom structure using the DAPS-II (40 items)
Model
χ2
df
p
RMSEA
(90% CI)
SRMR
CFI
TLI
4-factor DSM-5 model 1340.24 634 < .001 .06 (.05, .06) .04 .91 0.90
6-factor Externalizing model 1312.56 625 < .001 .06 (.05, .06) .04 .91 0.90
6-factor Anhedonia model 1195.54 625 < .001 .05 (.05, .05) .04 .93 0.92
7-factor Hybrid model 1159.29 619 < .001 .05 (.04, .05) .04 .93 0.92
Note. N = 367 for all models. DSM-5 = Diagnostic and Statistical Manual of Mental Disorders,
5th Edition. RMSEA = Root Mean Square Error of Approximation; SRMR = Standardized Root
Mean Square Residual; CFI = Bentler’s Comparative Fit Index; TLI = Tucker Lewis Index.
*p < .001.

35
Table 5
Standardized and unstandardized parameter estimates for the seven-factor hybrid model using
the DAPS-II.
Item PTSD Symptom Factor Estimate SE STDYX
DAPS 33 1. Intrusive memories Intrusions 1.00 0.00a 0.77
DAPS 37 4. Cued distress 1.12 0.06** 0.84
DAPS 41 1. Intrusive memories 1.16 0.06** 0.84
DAPS 45 4. Cued distress 1.13 0.06** 0.84
DAPS 49 1. Intrusive memories 1.12 0.06** 0.86
DAPS 53 3. Flashbacks 1.08 0.06** 0.87
DAPS 57 2. Nightmares 1.06 0.07** 0.81
DAPS 61 5. Cued physical reactions 1.15 0.07** 0.85
DAPS 65 3. Flashbacks 1.04 0.07** 0.87
DAPS 69 5. Cued physical reactions 1.07 0.06** 0.89
DAPS 58 6. Avoidance of thoughts Avoidance 1.00 0.00a 0.86
DAPS 34 7. Avoidance of reminders 0.92 0.06** 0.76
DAPS 54 7. Avoidance of reminders 0.89 0.06** 0.79
DAPS 66 7. Avoidance of reminders 0.97 0.05** 0.86
DAPS 42 8. Trauma-related amnesia Negative Affect 1.00 0.00a 0.62
DAPS 72 9. Negative beliefs 1.38 0.15** 0.87
DAPS 75 9. Negative beliefs 1.43 0.16** 0.74
DAPS 78 9. Negative beliefs 1.36 0.16** 0.75
DAPS 81 10. Blame 1.53 0.16** 0.90

36
DAPS 73 11. Negative feelings 1.38 0.15** 0.90
DAPS 76 11. Negative feelings 1.49 0.17** 0.89
DAPS 79 11. Negative feelings 1.35 0.15** 0.78
DAPS 82 11. Negative feelings 1.50 0.17** 0.85
DAPS 38 12. Loss of interest Anhedonia 1.00 0.00a 0.86
DAPS 46 13. Feeling detached 1.03 0.06** 0.87
DAPS 50 14. Feeling numb 1.00 0.06** 0.89
DAPS 62 14. Feeling numb 1.02 0.07** 0.89
DAPS 74 15. Irritability Externalizing 1.00 0.00a 0.91
DAPS 77 15. Irritability 0.72 0.07** 0.76
DAPS 83 15. Irritability 0.91 0.06** 0.84
DAPS 80 16. Risk taking 0.87 0.06** 0.83
DAPS 63 17. Hypervigilance Anxious Arousal 1.00 0.00a 0.86
DAPS 67 17. Hypervigilance 0.94 0.05** 0.70
DAPS 47 18. Startle 0.96 0.06** 0.80
DAPS 71 18. Startle 0.98 0.05** 0.84
DAPS 35 19. Difficulty concentrating Dysphoric Arousal 1.00 0.00a 0.82
DAPS 39 19. Difficulty concentrating 1.06 0.06** 0.85
DAPS 51 20. Sleep disturbance 0.94 0.06** 0.77
Note. DAPS-II = Detailed Assessment of Posttraumatic Stress for DSM-5; STDXY =
standardized solution outputted by Mplus. a Parameter was fixed at 1.0.
*p < .05; **p < .001.
37
Table 6
Zero-order correlations among latent variables of the seven-factor hybrid model using the
DAPS-II.
Avoidance
Intrusions
Negative
affect
Anhedonia
Externalizing
behavior
Anxious
arousal
Dysphoric
arousal
Avoidance 1.0 - - - - - -
Intrusions .80 1.0 - - - - -
Negative
Affect
.51 .61 1.0 - - - -
Anhedonia .77 .91 .59 1.0 - - -
Externalizing
behavior
.72 .85 .59 .85 1.0 - -
Anxious
arousal
.79 .93 .60 .93 .84 1.0 -
Dysphoric
arousal
.81 .92 .60 .99 .84 .94 1.0
Note. DAPS-II = Detailed Assessment of Posttraumatic Stress for DSM-5. All zero-order
correlations presented in the table were significant at p < .001.

38
Table 7
Zero-order inter-item correlations between DAPS-II items
33 34 35 37 38 39 41 42 45 46 47 49 50
33 1.0
34 0.65 1.0
35 0.71 0.66 1.0
37 0.69 0.70 0.66 1.0
38 0.67 0.61 0.74 0.74 1.0
39 0.67 0.60 0.80 0.70 0.83 1.0
41 0.71 0.65 0.73 0.72 0.70 0.74 1.0
42 0.48 0.48 0.53 0.55 0.56 0.56 0.54 1.0
45 0.69 0.68 0.70 0.79 0.67 0.68 0.75 0.57 1.0
46 0.60 0.62 0.66 0.67 0.76 0.73 0.64 0.55 0.72 1.0
47 0.60 0.61 0.68 0.62 0.67 0.64 0.67 0.49 0.68 0.70 1.0
49 0.78 0.61 0.69 0.66 0.69 0.72 0.74 0.55 0.75 0.68 0.67 1.0
50 0.57 0.58 0.68 0.65 0.74 0.74 0.63 0.59 0.66 0.80 0.69 0.70 1.0
51 0.60 0.54 0.65 0.60 0.62 0.63 0.65 0.49 0.63 0.61 0.61 0.67 0.70
53 0.69 0.58 0.66 0.69 0.66 0.68 0.73 0.54 0.72 0.57 0.60 0.75 0.65
54 0.56 0.61 0.53 0.64 0.57 0.58 0.57 0.49 0.67 0.66 0.57 0.62 0.66
57 0.64 0.59 0.64 0.64 0.60 0.67 0.71 0.54 0.66 0.60 0.62 0.68 0.67
58 0.66 0.69 0.70 0.70 0.66 0.70 0.71 0.51 0.70 0.67 0.63 0.73 0.68
61 0.67 0.65 0.69 0.72 0.69 0.69 0.73 0.58 0.76 0.64 0.64 0.74 0.68
62 0.58 0.63 0.70 0.65 0.74 0.73 0.62 0.54 0.66 0.80 0.65 0.67 0.84
63 0.61 0.56 0.65 0.63 0.65 0.68 0.71 0.48 0.71 0.68 0.67 0.66 0.66
65 0.61 0.62 0.67 0.64 0.65 0.70 0.69 0.55 0.70 0.66 0.63 0.70 0.70
66 0.59 0.61 0.65 0.68 0.65 0.67 0.69 0.52 0.68 0.66 0.60 0.67 0.70
67 0.53 0.49 0.54 0.59 0.49 0.50 0.57 0.45 0.56 0.55 0.58 0.55 0.52
69 0.66 0.67 0.70 0.71 0.68 0.73 0.71 0.56 0.78 0.71 0.68 0.70 0.73
71 0.61 0.60 0.65 0.64 0.71 0.70 0.66 0.45 0.65 0.68 0.81 0.64 0.69
72 0.58 0.51 0.65 0.64 0.66 0.67 0.64 0.55 0.64 0.60 0.58 0.63 0.66
73 0.62 0.57 0.61 0.64 0.63 0.65 0.64 0.53 0.62 0.63 0.57 0.63 0.70
74 0.65 0.63 0.67 0.68 0.70 0.70 0.70 0.59 0.67 0.65 0.62 0.70 0.73
75 0.55 0.60 0.57 0.62 0.56 0.60 0.55 0.42 0.60 0.65 0.56 0.58 0.62
76 0.58 0.56 0.60 0.66 0.61 0.64 0.61 0.51 0.66 0.62 0.56 0.63 0.66
77 0.45 0.40 0.49 0.51 0.55 0.53 0.52 0.55 0.55 0.47 0.47 0.53 0.58
78 0.61 0.54 0.54 0.59 0.62 0.59 0.63 0.44 0.67 0.66 0.58 0.64 0.58
79 0.65 0.61 0.71 0.66 0.67 0.70 0.64 0.50 0.72 0.67 0.66 0.69 0.68
80 0.50 0.58 0.59 0.57 0.62 0.64 0.56 0.58 0.61 0.65 0.56 0.62 0.71
81 0.57 0.56 0.63 0.64 0.59 0.62 0.62 0.56 0.65 0.60 0.57 0.61 0.66
82 0.55 0.60 0.57 0.63 0.58 0.60 0.62 0.51 0.65 0.59 0.55 0.60 0.63
83 0.56 0.50 0.57 0.60 0.65 0.67 0.65 0.60 0.61 0.58 0.58 0.63 0.70
39
Table 7 (continued)
51 53 54 57 58 61 62 63 65 66 67 69 71
51 1.0
53 0.70 1.0
54 0.61 0.66 1.0
57 0.67 0.74 0.63 1.0
58 0.66 0.69 0.65 0.72 1.0
61 0.65 0.79 0.66 0.72 0.71 1.0
62 0.65 0.66 0.69 0.63 0.67 0.71 1.0
63 0.66 0.67 0.65 0.70 0.71 0.70 0.70 1.0
65 0.62 0.76 0.71 0.77 0.73 0.77 0.74 0.71 1.0
66 0.67 0.69 0.69 0.74 0.74 0.70 0.74 0.71 0.77 1.0
67 0.51 0.54 0.52 0.58 0.59 0.57 0.55 0.60 0.55 0.62 1.0
69 0.66 0.79 0.70 0.73 0.73 0.82 0.73 0.73 0.81 0.76 0.53 1.0
71 0.63 0.67 0.61 0.67 0.69 0.66 0.70 0.72 0.70 0.70 0.59 0.75 1.0
72 0.57 0.68 0.60 0.71 0.66 0.67 0.67 0.67 0.70 0.72 0.54 0.70 0.66
73 0.62 0.66 0.61 0.67 0.71 0.64 0.65 0.65 0.66 0.70 0.59 0.66 0.59
74 0.62 0.71 0.63 0.70 0.73 0.72 0.73 0.72 0.74 0.73 0.58 0.71 0.68
75 0.51 0.57 0.58 0.58 0.62 0.60 0.66 0.60 0.57 0.62 0.62 0.63 0.63
76 0.57 0.62 0.64 0.69 0.67 0.63 0.62 0.63 0.64 0.71 0.57 0.69 0.65
77 0.51 0.63 0.56 0.58 0.57 0.60 0.59 0.60 0.67 0.61 0.41 0.60 0.54
78 0.56 0.56 0.58 0.55 0.60 0.57 0.59 0.63 0.56 0.59 0.52 0.61 0.59
79 0.59 0.62 0.61 0.63 0.68 0.67 0.67 0.69 0.64 0.60 0.56 0.71 0.66
80 0.60 0.61 0.66 0.62 0.65 0.60 0.71 0.61 0.70 0.68 0.45 0.67 0.65
81 0.57 0.60 0.62 0.67 0.67 0.63 0.61 0.61 0.64 0.68 0.56 0.65 0.59
82 0.53 0.63 0.63 0.64 0.66 0.66 0.63 0.62 0.63 0.70 0.54 0.68 0.62
83 0.60 0.68 0.61 0.67 0.66 0.68 0.69 0.68 0.71 0.67 0.49 0.71 0.66
40
Table 7 (continued)
72 73 74 75 76 77 78 79 80 81 82 83
72 1.0
73 0.80 1.0
74 0.75 0.80 1.0
75 0.60 0.62 0.67 1.0
76 0.77 0.77 0.73 0.67 1.0
77 0.67 0.63 0.70 0.44 0.59 1.0
78 0.61 0.63 0.60 0.62 0.66 0.47 1.0
79 0.61 0.63 0.67 0.61 0.67 0.45 0.66 1.0
80 0.67 0.65 0.73 0.59 0.68 0.70 0.55 0.62 1.0
81 0.80 0.84 0.72 0.63 0.82 0.57 0.64 0.64 0.63 1.0
82 0.70 0.72 0.65 0.68 0.81 0.53 0.65 0.63 0.63 0.80 1.0
83 0.72 0.65 0.79 0.57 0.67 0.77 0.54 0.59 0.72 0.61 0.62 1.0