the desorption of ribonuclease a from charge density gradient surfaces studied by spatially-resolved...
TRANSCRIPT

COLLOIDS AND B SURFACES
ELSEVIER Colloids and Surfaces B: Biointerfaces 4 (1995) 65 75
The desorption of ribonuclease A from charge density gradient surfaces studied by spatially-resolved total internal reflection
fluorescence
Y.S. Lin, V. Hlady *
Departments of Bioengineering and Materials Science and Engineering, University of Utah, Salt Lake City, U T84112, USA
Received 16 June 1993; accepted 30 May 1994
Abstract
A quaternary amine surface gradient was prepared on fused silica by a three-step surface modification process. The gradient surface displayed a transition of surface charges along the gradient dimension from a net negative surface charge of silica to a net positive surface charge at the quaternary amine end. The gradient surface was characterized by X-ray photoelectron spectroscopy, ellipsometry, colloidal gold decoration, and dynamic contact angle measurements. It displayed an increased adhesion of negatively charged gold particles towards the quaternary amine end. The water contact angles also increased with the increased surface density of aminopropylsilyl groups.
The desorption of ribonuclease A labeled with fluorescein-5-isothiocyanate (FITC-RNase) from the quaternary amine gradient surface was measured using spatially resolved total internal reflection fluorescence (TIRF) spectroscopy. The experimental FITC-RNase desorption results fitted exceptionally well to a two adsorbed protein populations model. A tentative assignment of the two adsorbed protein populations is proposed based on the effect of the ionic strength of the desorbing buffer. The faster desorption population interacted primarily with the quaternary amine gradient surface sites through electrostatic interactions. The slower desorption population interacted with the surface sites via hydrophobic and possibly some electrostatic interactions.
Keywords: Charge density gradient surfaces; Desorption; Ribonuclease A; Total internal reflection fluorescence
1. Introduction
The interaction of proteins with solid/liquid interfaces can be governed by a combination of hydrophobic and electrostatic effects [ 1]. Protein separation and purification techniques utilize elec- trostatic and hydrophobic interactions between the protein and the solid surface to achieve the desired performance [2]. In ion-exchange chromatogra- phy, a balance between these two types of inter-
* Corresponding author.
0927-7765/95/$09.50 © 1995 Elsevier Science B.V. All rights reserved SSD1 0927-7765(94)01150-4
actions controls the selectivity and the resolution of a given chromatographic column [3,4].
An aminated silica surface is a very popular ion- exchange chromatography support for protein sep- aration despite some uncertainties about the nature of the interactions of the amine groups with the silica surface. Chiang et al. [5] used FT-IR spectro- scopy to study the structure of aminopropylsilane (APS) on glass surfaces. It was found that the amino groups are hydrogen bonded to the surface. An N M R study of molecular motion of the adsorbed APS on silica showed that the molecular

66 Y.S. Lin, V. Hlady/Colloids Surfaces B: Biointerfaces 4 (1995) 65-75
motion of APS at approximately monolayer cover- age was slower than the molecular motion of APS below monolayer coverage [6]. Horner et al. [7] concluded from X-ray photoelectron spectroscopy (XPS) of aminopropylsilyl silica (APS silica) that the amino groups are protonated by interaction with silica hydroxyl groups. Moses et al. [-8] assigned the two peaks in the XPS nitrogen spectrum of the APS surface (400.3eV and 401.9 eV) to two components: free and protonated amino groups, respectively. Only a fraction of the free and protonated amines could be intercon- verted by rinsing the surface with acidic or basic solutions, indicating that some amino groups were irreversibly protonated while others were irrevers- ibly free.
We have previously studied protein adsorption onto the so-called "wettability gradient" surfaces [9-12]. Originally described by Elwing [13], the "wettability gradient'surface is characterized by an increase of the surface density of hydrophobic groups along one of the surface linear dimensions. In this study, we demonstrate how to prepare a surface density gradient of quaternary amine groups on a flat silica surface. Furthermore, we show that this surface can be used to rapidly screen protein-surface interactions. The surface density gradient of quaternary amine groups is prepared in three steps using a two-phase silanization approach [13]. In the third step, methyl iodide was used to modify free surface amino groups into quaternary amines [ 14,15]. The final result of the three surface modification steps is a negative-to- positive charge change on the silica surface. We call this surface a charge density gradient surface: on one end of the gradient is pure silica with negatively charged silanol groups and on the other end are positively charged quaternary amine groups.
We have tested the protein-surface interactions of the charge density gradient surface using a model protein, ribonuclease A (RNase), labeled with fluorescein-5-isothiocyanate (FITC-RNase). A small globular protein with several intramolecu- lar disulfide bonds like RNase possesses good structural stability and behaves like a "hard" particle at solid/liquid interfaces interacting with surfaces through electrostatic and hydrophobic
interactions [16,17]. The separation of RNase from other proteins by ion-exchange chromatogra- phy has been reported by a number of groups [ 18 20]. High-performance ion-exchange chroma- tography on a tertiary amine agarose column showed excellent resolution in separating RNase from other proteins in the mixture [19]. In this study, the desorption of FITC RNase from the charge density gradient surface was studied using the spatially resolved total internal reflection fluo- rescence (TIRF) technique [9]. In order to under- stand the relative contributions of electrostatic and hydrophobic interactions in RNase desorption, two pH 7.0 phosphate buffers with different ionic strengths (0.0185 M vs. 0.1185 M) were used.
2. Materials and methods
2.1. Preparation and characterization of charge density gradient surface
The first step in the preparation of the charge density gradient silica surface was to prepare a gradient of isocyanatopropyldimethylsilyl groups (IPS gradient) on a flat silica surface and then to convert it into the aminopropyldimethylsilyl-silica (APDMS gradient) by acidic hydrolysis. The IPS gradient was prepared by the two-phase diffusion method [13]. The upper phase was p-xylene (Merck) and the lower phase was a solution of 0.1% (v/v) isocyanatopropyldimethylsilane (Petrarch Systems Inc.) in trichloroethylene (TCE; Merck). After a 90 min diffusion time, the silica plate was rinsed with TCE, ethanol and deionized water and then dried under nitrogen. The APDMS gradient was then prepared from the IPS gradient by hydrolysis at pH 3.8 (pH adjusted by means of HC1) at 50°C for 0.5 h.
The last step was the conversion of the surface amines into the quaternary amines. The APDMS gradient was immersed into the 5% (v/v) solution of methyl iodide in ethanol for 18 h [15]. Inagaki et al. [ 14] had used a similar method to quaternize amines in plasma-polymerized thin films. The sum- mary of the reactions used for the preparation of the surface charge density gradient is shown in Fig. 1.

Y.S. Lin, V. Hlady/Colloids Surfaces B: Biointerfaces 4 (1995) 65-75 67
c~ I
Si- OH + CI- Si-CH2CH2CH2N=C=O (IPS) I
(silica) CH 3 0 . 1 % IPS in trichloroethylene for 1.5 hours C1113
-- Si -O - Si-CH2C142CH2N=C=O I c~
pH3.8 aqueous solution (HCI) at 50°C for 0.5 hour r.[143
-- Si - O - Si-CH2CH2CH2NH 2 I c~
5% (v/v) ofCH 31 in ethanol, shaking for 18 hours, room temperature
~H3 Si - O - Si-CH2 CH 2 CH2N+(CH3 ) 3 I"
I cn3
Fig. 1. Schemat ics of the surface react ions used for the
p repa ra t ion of qua t e rna ry amine silica.
The surfaces were characterized by XPS spectro- scopy, ellipsometry, contact angle measurement and colloidal gold adsorption. The XPS analysis was performed only on the quaternary end of the charge density gradient surfaces using a Hewlett Packard 5950B XPS spectrometer. The binding energy of nitrogen (N ls) was used to deduce the relative population of reactive free amines on the APDMS silica surface. The surface density of aminopropyldimethylsilyl groups was determined indirectly using ellipsometry. All ellipsometric measurements were performed in air using the ellipsometer (Rudolf Research AR2000). The non- gradient APDMS surface, used in the ellipsometric measurements, was prepared on a 150 nm thick SiO 2 layer grown on the silicon wafer. Control experiments were performed using the clean Si/SiO 2 surface. Once the refractive index, n, and the thickness, d, of each layer were determined by ellipsometry, the composition of the APDMS sur- face layer was calculated using the Lorentz-Lorenz equation as described elsewhere [21]. The dynamic advancing and receding water contact angles on the gradient surfaces were measured by the Wilhelmy plate technique as previously described [10].
2.2. Colloidal gold adsorption onto quaternary gradient
The spatial distribution of quaternary amine groups on the gradient surface was analyzed using colloidal gold particle as a probe. These negatively charged particles adhere onto the positively charged surfaces via electrostatic interactions. The colloidal gold particles (Polysciences, Inc.), with an average particle diameter of 20 nm, were stored in a buffer solution (0.01 wt.% of gold particles in potassium carbonate/sodium citrate buffer pH 6.5). Under these conditions the colloidal gold was stable and did not coagulate. The quaternary amine gradient prepared on the Si/SiO2 surface was incu- bated in the colloidal gold solution for 1 h. After the incubation, the surface was washed with deion- ized water to remove any residual buffer which would otherwise evaporate and crystallize in the scanning electron microscope vacuum and thus prevent the observation of adhered particles. Finally the sample was dried in air and imaged by a Hitachi S-450 scanning electron microscope using a magnification of 40000 x and an acceleration voltage of 30kV. The scanning electron micro- scopy (SEM) observations were made as a function of distance along the surface gradient. The surface distribution of gold particles in the digitized SEM images was analyzed using image analysis software (Image 1.37, NIH).
2.3. RNase desorption
Ribonuclease A (bovine pancreas) (RNase; Sigma) was labeled with fluorescein-5-isothiocya- nate (FITC; Aldrich). The RNase concentration in phosphate buffer was determined using the extinc- tion coefficient: 0.73 mg- ~ ml cm- 1 at 280 nm [22]. The ratio of the 280nm/494 adsorption bands of FITC (in solution) was determined to be 0.285. Using the same ratio for the FITC-RNase conjugate, the degree of labeling, FITC/RNase, was calculated to be 0.75. The RNase adsorption was performed using a spatially-resolved TIRF apparatus [9]. A two rectangular flow channels TIRF cell was used so that two parallel experi- ments could be performed on an identical gradient surface. The FITC-RNase was adsorbed to

68 Y.S. Lin, V. Hlady/Colloids Surfaces B: Biointerfaces 4 (1995) 65-75
the surface from the flowing buffer solution (0.01 mg ml-~; flow rate, 1 ml min -~) for 11 min. The desorption segment of the experiment was initiated by replacing the flow of protein solution with the flow of buffer solution through the TIRF cell. An Ar ÷ ion laser (Lexel; Model 92; 10 mW at 488 nm) was used to excite the fluorescence of adsorbed FITC-RNase. Any fluorescence contri- bution from desorbed FITC-RNase was found to be negligible. The FITC-RNase desorption was studied at the same pH of 7.0 from two phosphate buffers of different ionic strengths: 0.0185 M and 0.1185 M, respectively. The higher ionic strength buffer was prepared by adding 0.1 M NaC1 0.0185 M ionic strength phosphate buffer.
3. Results
3.1. Characterization of the charge density gradient surface
The wettability of a typical APDMS gradient surface, i.e. water contact angles, 0, as a function of position, is shown in Fig. 2. The water contact angles changed with the change in pH of the aqueous solution, indicating that chargeable groups exist along the gradient. After the quaterni-
60 0 adv pH 7.1
5 0 r ' l 0 rec pH 7,1
• 0 a d v pH 3.1
40 A r .
30
~ 20
~ 10
0 • -
-0.3-0.1 0.1 0.3 0.5 0.7 0.9 1.1 1.3 1.5
distance, (cm)
Fig. 2. Dynamic water contact angles of the AP DM S gradient surface shown as a function of gradient position. The silica end of the gradient surface showed O,d~=O ~' and 0~¢=0 °. The gradient region and the amine end of the gradient surface showed that the contact angles depend on pH.
zation step, the wettability of the gradient surface became insensitive to pH changes. Fig. 3 shows the water contact angles of the quaternary amine gra- dient as a function of gradient position at pH 7.0. The advancing contact angle, 0adv, of the quater- nary amine end of the gradient surface was 45 ° and the receding contact angle, 0re~, was 20 °. The gradient length was approximately 0.7 cm; the same length as in the case of the APDMS gradient shown in Fig. 2. On the silica end of the gradient surface, the contact angles decreased to zero.
The surface density of the aminopropyldimethyl- silyl (APDMS) groups was calculated from the ellipsometric measurements using the Lorentz- Lorenz equation [21]. It was found that on average 1.4 APDMS groups exist on an area of I nm 2. Based on the geometric packing argument this density of APDMS groups translates into approximately half-monolayer coverage.
XPS analysis of the binding energy of the N ls doublet peak of the uniform, non-gradient APDMS silica before and after quaternization was used to determine which fraction of amines was converted into the quaternary amines. The XPS N ls results
60 • 0 adv
50 o 0 ~ 4
3 ~. - ' - - - - ' - - - ' = ~ 4o
~ 2 c ~ 3o
20 B - _.¢. _.v. z e e e 8
10 1
0 " , ~ - , - , • , •
-0.3-0.1 0.1 0.3 0.5 0.7 0.9 1.1 1.3 1.5
distance, (cm)
Fig. 3. Dynamic water contact angles of the quaternary amine gradient surface. Advancing/receding contact angles 0,av = 0r~c = 0 ° were recorded on the silica end of the gradient surface. The quaternary amine end of the gradient surface showed 0,av=46 ° and 0roc=20 °. The angles were not dependent on pH. A, B and C indicate the positions along the gradient at which the adhered colloidal gold particles were imaged by SEM (Fig. 4). 1 5 indicate the positions along the gradient used in the fitting of the experimental results to the two adsorbed protein populations model (Eq. (4)).

Y.S. Lin, V. Hlady/Colloids Surfaces B." Biointerfaces 4 (1995) 65-75 69
are listed in Table 1. The lower energy XPS peak of the N ls doublet is often interpreted as originat- ing from free amines and the higher energy XPS peak is thought to be due to protonated and hydrogen bonded amines [23]. However, accord- ing to Moses et al. [8], the amine groups on the silica surface exist in three forms:
(a) free amines that resist protonation in acid (designated N);
(b) amines that resist deprotonation (desig- nated NH);
(c) reversibly protonated amines (designated N/NH).
While the N form contributes only to the lower energy XPS peak and the NH form contributes only to the higher energy XPS peak, the N/NH form of the amines will contribute to both depend- ing on the acidity of the environment. Both the N and the NH forms of the amines can participate in hydrogen bonding. The test for the presence of the free base amines is to compare the XPS spectrum of N ls before and after incubation in acid, since only the N/NH form will become pro- tonated under acidic conditions. In the case of the APDMS surface (before quaternization), there was a 10% change in the higher and lower binding energy peak area after exposure of the surface to acidic conditions, suggesting that only a small fraction (0.1) of all surface amines was in the N/NH form (Table l, systems (a) and (b)). Furthermore, after the reaction of the APDMS sample with aldehyde-terminated poly(ethylene glycol) (PEG2000), the difference in peak area
increased further by an additional 8 10% (Table 1, systems (c) and (d)) [24]. After the quaternization of the APDMS surface no change in the peak area was recorded, indicating that on this modified surface there were no more amines in the N/NH form that could be protonated (Table 1, systems (e) and (f)). From the difference between the peak areas one finds that only a small fraction of total surface amines (between 0.1 and 0.2) was quaternized.
The letters A, B, C in Fig. 3 indicate three positions along the quaternary amine gradient surface at which the adhered colloidal gold par- ticles were imaged by SEM. Figs. 4a-4c show the respective scanning electron micrographs. Fig. 4b displays some gold particle dimers and a few smaller aggregates. Fig. 4c shows some gold par- ticles in the form of aggregates implying that the distribution of the surface amines is not entirely random: the size of the aggregates ranged from 20 nm (single particle) to several hundreds of nano- meters, but was seldom over 300 nm. The surface coverage of the adhered gold particles in Figs. 4a-4c was 1.5%, 15.3% and 46.2%, respectively. The respective advancing contact angles were 10 °, 26 ° and 44 ~'.
The contact angle of a hypothetical surface fully covered with quaternary amines, 0quat.amine , c a n be calculated by using the Cassie equation [-25]
cos Oexp =fcos 0quat.arnin e "q- ( 1 - f ) cos 0silica ( 1 )
wherefis the fraction of surface covered by quater- nary amines, ( 1 - f ) is the fraction of silica surface,
Table 1 The relative area of two deconvoluted XPS peaks in the N ls spectra
System Higher binding energy N ls peak Lower binding energy N ls peak
Area Max. energy Area Max. energy (%1 leV) (%) (eV)
(a) APDMS; pH 3 45 (b) APDMS; pH 7 35 {c) a PEG5000 + APDMS; pH 7.0 28 {d)" PEG2000 + APDMS; pH 7.0 25 (el Quaternary amine; pH 3 45 (f) Quaternary amine; ethanol 45
400.5 55 398.5 400.8 65 398.7 400.8 72 399.3 400.8 75 399.3 400.7 55 398.7 400.6 55 398.5
a Taken from Ref. [24].

70 Y.S. Lin, V. Hlady/Colloids Surfaces B." Biointerfaces 4 (1995) 65 75
1 gm 3.2. Desorption kinetics of ribonuclease A from the charge density gradient surface
a)
b)
c)
Fig. 4. SEM image of colloidal gold particles adhered at three different positions along the quaternary amine gradient surface. The advancing contact angles at these three positions were (a) Oaav = 10°; (b) 0aav=26°; (c) 0aav =44 °, respectively.
0oxp is the experimentally observed advancing water contact angle and 0silic, is the contact angle of the clean silica surface (0silica = 0).
By assuming that the surface coverage of gold particles in Figs. 4b-4c is identical to the fraction of surface covered by quaternary amines, f the value of 0quat.amine is estimated as 68.5 + 1.5 °. While the absolute value of 0quat.amine could not be con- firmed by another method, a very small deviation ( + 1.5 °) indicated that colloidal gold decoration is a suitable method for the visualization of the spatial distribution of positively charged surface groups at intermediate surface coverages.
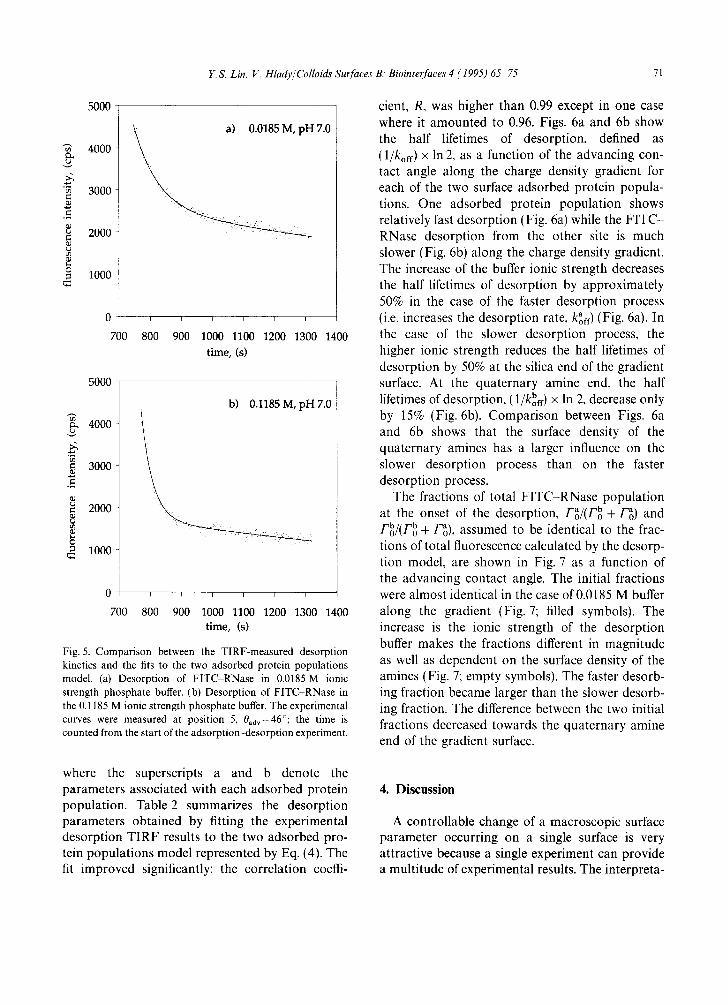
The desorption kinetics of FITC-RNase have been analyzed for the five positions along the charge density gradient. The positions were located at -0.05, 0.17, 0.34, 0.51 and 0.73 cm in Fig. 3, (as indicated by the numbers of 1 5) corresponding to advancing contact angles of 0 °, 23 °, 34 °, 41 ° and 46 °, respectively. A typical example of the desorption kinetics of RNase from the quaternary amine end of the gradient surface (0exp=46 °) is shown in Figs. 5a and 5b: the desorption segment of the TIRF experiment was carried out in phos- phate buffer solutions of 0.0185 M and 0.1185 M ionic strength, respectively.
The FITC RNase desorption kinetics were first modeled by considering the desorption of a single adsorbed protein population [26]
dF(t)/dt = - koff F(t) (2)
or in the integral form as
kofft = In [Fo/F(t)] (3)
where Fo and F(t) are the adsorbed amounts at the beginning of the desorption process and at the time, t, respectively, and kof f is the desorption rate. In order to determine the desorption rate, korf, the actual adsorbed amounts, F(t) and Fo, do not need to be known. The fluorescence intensity as a func- tion of desorption time can be used instead, as long as it remains proportional to the adsorbed amounts of FITC-RNase. This assumption has not been rigorously tested for FITC-RNase; how- ever, comparisons between the adsorbed amounts of FITC-labeled proteins along the gradient sur- faces, as determined by autoradiography and by the TIRF technique, have generally been in excel- lent agreement [27]. Fitting of the observed FITC RNase desorption kinetics to the one surface pop- ulation model resulted in very poor correlation coefficients (below 0.7). Because of such a poor fit, the next simplest model was examined: the desorp- tion of two adsorbed protein populations, a and b.
a - -1 F(t)tot = Fg [exp(t x koff) ] b - 1 + Fo b [exp(t x kof0] (4)
Y.S. Lin, V. Hlady/Colloids Surfaces B: Biointerfaces 4 (1995) 65 75 71
5000
4000
~ 3000
2000
O 1000
~ ~ 7.0
0 i i i i [ i
700 800 900 1000 1100 1200 1300 1400 time,(s)
5000
4000
3000
.fi
2000
Q
1000
b) 0.1185 M, pH 7.0
0 i i i i i i
700 800 900 1000 1100 1200 1300 1400 time, (s)
Fig. 5. Comparison between the TIRF-measured desorption kinetics and the fits to the two adsorbed protein populations model. (a) Desorption of FITC RNase in 0.0185 M ionic strength phosphate buffer. (b) Desorption of FITC-RNase in the 0.1185 M ionic strength phosphate buffer. The experimental curves were measured at position 5, 0adv=46°; the time is counted from the start of the adsorption~desorption experiment.
where the superscripts a and b denote the parameters associated with each adsorbed protein population. Table 2 summarizes the desorption parameters obtained by fitting the experimental desorption TIRF results to the two adsorbed pro- tein populations model represented by Eq. (4). The fit improved significantly: the correlation coeffi-
cient, R, was higher than 0.99 except in one case where it amounted to 0.96. Figs. 6a and 6b show the half lifetimes of desorption, defined as (1/koff) x In 2, as a function of the advancing con- tact angle along the charge density gradient for each of the two surface adsorbed protein popula- tions. One adsorbed protein population shows relatively fast desorption (Fig. 6a) while the FITC- RNase desorption from the other site is much slower (Fig. 6b) along the charge density gradient. The increase of the buffer ionic strength decreases the half lifetimes of desorption by approximately 50% in the case of the faster desorption process (i.e. increases the desorption rate, k~rf) (Fig. 6a). In the case of the slower desorption process, the higher ionic strength reduces the half lifetimes of desorption by 50% at the silica end of the gradient surface. At the quaternary amine end, the half lifetimes of desorption, (1/kbff) × In 2, decrease only by 15% (Fig. 6b). Comparison between Figs. 6a and 6b shows that the surface density of the quaternary amines has a larger influence on the slower desorption process than on the faster desorption process.
The fractions of total FITC-RNase population at the onset of the desorption, F~/(Fbo + F~) and Fb/(Fbo + Fg), assumed to be identical to the frac- tions of total fluorescence calculated by the desorp- tion model, are shown in Fig. 7 as a function of the advancing contact angle. The initial fractions were almost identical in the case of 0.0185 M buffer along the gradient (Fig. 7; filled symbols). The increase is the ionic strength of the desorption buffer makes the fractions different in magnitude as well as dependent on the surface density of the amines (Fig. 7; empty symbols). The faster desorb- ing fraction became larger than the slower desorb- ing fraction. The difference between the two initial fractions decreased towards the quaternary amine end of the gradient surface.
4. Discussion
A controllable change of a macroscopic surface parameter occurring on a single surface is very attractive because a single experiment can provide a multitude of experimental results. The interpreta-

72 Y.S. Lin, V. Hlady/Colloids Surfaces B: Biointerfaces 4 (1995)65 75
(-q
6~
0
.o
e~
e~
e.
o
Z
D.,
.=
e~
©
c~
c5 ~q c5 c5 c5
A
~ ~ + +
0 0
e~. ~.

Y.S. Lin, V. Hlady/Colloids Surfaces B: Biointetfaces 4 (1995) 65-75 73
o
E,
,s:Z
l .O"
0.8
0.6
0.4
0.2
0.0 0
• 0.0185 M
a) o 0.1185M • , • , . , . , ,
10 20 30 40 advancing contact angle, (degree)
50
z- ,.-1
=- c~
c~
¢..
25
2O I
15
10
5
0 0
b) • o.o185 M [] 0.1185 M
10 20 30 40 advancing contact angle, (degree)
50
Fig. 6. Half lifetime of desorption (in minutes) shown as a function of advancing contact angle of the quaternary amine gradient surface: faster (circles, Fig. 6a) and slower (squares, Fig. 6b) desorption of the two adsorbed protein populations in two buffers of ionic strengths 0.0185 M (filled symbols) and 0.1185 M (empty symbols) respectively.
tion of the results, however, requires a careful consideration of the microscopic distribution of important surface groups along the gradient. In the present study, one needs to consider both the net surface charge along the gradient and the microscopic distribution of the surface quaternary amine groups.
One expects to find two types of positively charged amines: quaternary amines and proton- ated amines, on the quaternary amine surface. The XPS analysis (Table 1, systems (c) and (d)) indi- cated that at least one-quarter of the total surface amines are protonated. An additional fraction, between 0.1 and 0.2, of the total surface amines were successfully converted into fully charged qua-
1.0-
o '" 0.8
o '~ 0.6
©
.=. 0.4
0.2 =_
0.0
• fast in 0.0185 M 0 fast in 0.1185 M • slow in 0.0185 M [] slow in 0.1185 M
10 20 30 40
advancing contact angle, (degree)
50
Fig. 7. The fractions of total FITC-RNase population at the onset of the desorption, F~/(F~ + F~) and Fbo/(F b + F~), shown as a function of the advancing contact angles of the quaternary amine gradient surface: faster (circles) and slower (squares) desorbing populations in two buffers of ionic strengths 0.0185 M (filled symbols) and 0.1185 M (empty symbols) respectively.
ternary amines. With a total surface density of amines of 1.4 amine groups per square nanometer, as found by ellipsometry, one finds approximately 0.35 protonated amines and 0.14-0.28 quaternary amines per square nanometer. Assuming that the contribution from the silica surface charge remains constant along the gradient at the level of 0.3-0.4 negative electron charges per square nanometer [28], the net surface charge on the quaternary amine end of the gradient surface can be anywhere between 0.14 and 0.28 positive electron charges per square nanometer. It is important to recognize that these are the lower limits of net surface charge: the charge contribution from the silica surface may be smaller due to the reaction between the surface silanol groups and the silane reagent. The existence of an increasingly more positive charge on the charge density gradient surface was confirmed by the adsorption of negatively charged colloidal gold particles (Fig. 4).
The charge density gradient surface should dis- play an interesting macroscopic effect: "a region of net zero charge" somewhere in the middle of the gradient. The F ITC-RNase adsorption (not shown) and desorption results did not display any extraordinary effect that could confirm the exis-
74 KS. Lin, V. Hlady/Colloids Surfaces B: Biointerfaces 4 (1995) 65 75
tence of such an overall neutral surface region. This may be due to the electrostatic nature of the RNase molecule. The RNase molecule, although carrying an overall positive charge at neutral pH, is surrounded by two distinct lobes of positive and negative potentials [29,30]. This quasi-dipolar nature of RNase will allow the molecule to adsorb efficiently to both negatively and positively charged surfaces.
According to the results of the dynamic contact angle measurements, a large hysteresis of the con- tact angles exists at the quaternary amine end of the gradient surface (Fig. 3), suggesting the exis- tence of patches of aminopropyldimethylsilyl sur- face groups. Some of these patches may be positively charged. Indeed, the SEM observations corroborate this conclusion (Fig. 4). The impor- tance of microscopic distribution of the surface groups is inversely proportional to the size of the adsorbate molecule. The influence of the surface patchiness has recently been treated theoretically in a polymer adsorption theory [31]. To the best of our knowledge, the effect of the surface patchi- ness on protein adsorption has not been consid- ered, perhaps because of the difficulties in controlling the surface patchiness experimentally. Protein adsorption onto the partially covered C18 silica surfaces showed a linear dependence of the adsorption rate on the C18 surface coverage in the case of low-density lipoproteins (LDL) [27]. Since the size of RNase is relatively small compared to LDL, one can expect that the surface patches may influence the RNase adsorption/desorption behaviour.
In modeling the RNase desorption, we have selected the two adsorbed protein populations model (Eq. (4)). The experimental desorption results fit this model expectionally well (R, Table 2). Two different adsorbed protein populations of RNase showed distinctly different desorption rates (Fig. 6). A tentative assignment of the two types of adsorbed FITC RNase populations can be pro- posed based on the effect of the buffer ionic strength. The faster desorption (Table 2, sites a) is assigned to the adsorbed protein populations that primarily interact with the surface via electrostatic interactions. It was found that the higher ionic strength buffer influenced the rates of the slower
desorption process; however, the effect diminished as the surface becomes more hydrophobic, i.e. towards the quaternary amine end. Hence, the slower desorption is assigned to the adsorbed protein population that interacts with the surface through a combination of hydrophobic and possi- bly some electrostatic interactions (sites b). Such an assignment is in agreement with a general notion that protein desorption from hydrophobic surfaces usually occurs very slowly or not at all, whereas proteins can desorb quite fast from hydro- philic, charged surfaces [32].
The most important conclusion from the present study is that the nature of each adsorbed protein population is not exclusive to a single type of protein-surface interaction. The FITC-RNase sur- face population interacts with surface sites via a multiplicity of interactions, including both hydro- phobic and electrostatic interactions. This multi- plicity of protein-surface interactions is the reason why two buffers of different ionic strength can "sample" different fractions of the RNase surface populations (Fig. 7). Ion-exchange chromatogra- phy uses the "sampling" effect by linearly increas- ing the salt concentration during the elution of protein from the column.
The two adsorbed protein populations model used in the present study neglects any lateral protein-protein interactions. Various forms of lat- eral interactions were included in the two adsorbed protein populations model and tested on the RNase experimental desorption results (not shown here). No improvements were found in the good- ness of fit, indicating that the quality of the present experimental data is not sufficient to discriminate between these models. The lateral interactions are expected to play a significant role when a mixture of two or more proteins is interacting with a surface. We are currently examining the role of lateral interactions in the FITC-RNase + c~-lactal- bumin surface adsorption/desorption.
5. Conclusion
The quaternary amine surface gradient was pre- pared on fused silica by a three-step surface modi- fication process. The gradient surface displayed a

Y.S. Lin, V. Hlady/Colloids Surfaces B: Biointerfaces 4 (1995) 65 75 75
transition of surface charges along the gradient dimension from a net negative surface charge of silica to a net positive surface charge at the quater- nary amine end. The gradient surface displayed an increased adhesion of negatively charged gold par- ticles towards the quaternary amine end. The water contact angles also increased with the increased surface density of aminopropylsilyl groups.
The experimental FITC-RNase desorption results fitted exceptionally well to a two adsorbed protein populations model. A tentative assignment of the two adsorbed protein populations is pro- posed based on the effect of the ionic strength of the desorbing buffer. The faster desorption popula- tion primarily interacts with the surface sites through electrostatic interactions. The slower desorption population interacts with the surface sites via hydrophobic and possibly some electro- static interactions.
Acknowledgements
Financial support for Y.S. Lin from the Center for Biopolymers at Interfaces, University of Utah is gratefully acknowledged. This research has been partially supported by the NIH research grant RO1 HL-44538 and by the Whitaker Foundation grant. The authors want to thank W. Norde for the fruitful discussions during the initial phase of this work.
References
[1] W. Norde, Adv. Colloid Interface Sci., 25 (1986) 267. [2] J-C. Janson and L. Ryden (Eds.), Protein Purifications,
Principles, High Resolution Methods and Applications, VCH Publishers, New York, 1989.
[3] J.G. Dorsey, J.P. Foley, W.T. Cooper, R.A. Barford and H.G. Barth, Anal. Chem., 62 (1990) 324R.
[4] R.M. Chicz and F.E. Regnier, Anal. Chem., 61 (1989) 2059.
[5] C.H. Chiang, H. Ishida and J.L. Koenig, J. Colloid Interface Sci., 74 (1980) 396.
[6] H.-J. Kang and F.D. Blum, J. Phys. Chem., 95 (1991) 9391. [-7] M.R. Homer, F.J. Boerio and H.M. Clearfield, J. Adhesion
Sci. TechnoL, 6 (1992) 1. [8] P.R. Moses, L.M. Wier, J.C. Lennox, H.O. Finklea, J.R.
Lenhard and R.W. Murray, Anal. Chem., 50 (1978) 576. [-9] V. Hlady, Appl. Spectrosc., 45 (1991) 246.
[10] C.G. G61ander, Y.S. Lin, V. Hlady and J.D. Andrade, Colloids Surfaces, 48 (1990) 289.
[11] C.G. G61ander, K. Caldwell and Y.S. Lin, Colloids Surfaces, 42 (1989) 165.
[12] Y.S. Lin, V. Hlady and J. Janatova, Biomaterials, 13 ( 1992 ) 497.
[13] H. Elwing, B. Nilsson, K.-E. Svensson, A. Askendahl, U.R. Ni[sson and I. LundstrOm, J. Colloid Interface Sci., 125 (19881 139.
[14] N. Inagaki, K. Suzuki and K. Oh-lshi, Appl. Surf. Sci., 24 (19851 163.
[15] F.C.M. Chen and N.L. Benoiton, Can. J. Chem., 54 (1976) 3310.
[16] T. Arai and W. Norde, Colloids Surfaces, 51 (1990) 1. [17] T. Arai and W. Norde, Colloids Surfaces, 51 (1990) 17. [18] W. Kopaciewicz, M.A. Rounds, J. Fausnaugh and G.E.
Regnier, J. Chromatogr., 266 (19831 3. [19] K. Yao and S. Hjert6n, J. Chromatogr., 385 (1987) 87. [20] W. Warren, N.E. Astephen and T.E. Wheat,
J. Chromatogr., 512 (1990) 13. [21] P.A. Cupers, J.W. Corsel, M.P. Janssen, J.M.M, Kop,
W.Th. Hermens and H.C. Hemker, J. Biol. Chem., 258 (1983) 2426.
[22] WorthingtonVU; enzymes and related biochemicals, Millipore Corp. Bedford, MA, 1979, pp. 184.
[23] E.T. Vandenberg, L. Bertilsson, B. Liedberg, K. Uvdal, R. Erlandsson, H. Elwing and I. Lundstr6m, J. Colloid Interface Sci., 147 (1991) 103.
[24] Y.S. Lin, V. Hlady and C.-G. G61ander, Colloids Surfaces B: Biointerfaces, 3 (1994)49.
[25] A.B.D. Cassie, Discuss. Faraday Soc., 75 (19521 5041. [26] J.W. Corsel, G.M. Willems, J.M.M. Kop, P.A. Cuypers
and W.Th. Hermens, J. Colloid Interface Sci., 111 (1986) 544.
[27] C.H. Ho and V. Hlady, in J.L. Brash and T.A. Horben (Eds.), Proteins at Interfaces 94, ACS Syrup. Ser., in press.
[28] R.K. Iler, The Chemistry of Silica, Solubility, Polymerization, Colloid and Surface Properties, and Biochemistry, John Wiley, New York, 1979, p. 661.
[29] C.-S. Lee and G. Belfort, Proc. Natl. Acad. Sci. U.S.A., 88 (1989) 8392.
[30] B.-J. Yoon and A.M. Lenhofl, J. Phys. Chem., 96 (1992) 3130.
[31] C.C. van der Linden, B. van Lent, F.A.M. Leermakers and G.J. Fleer, Macromolecules, 27 (1994) 1915.
[32] W. Norde, in L.-H. Lee (Ed.), Adhesion and Adsorption of Polymers, Plenum Press, New York, 1980, p. 801.